


1 Introduction
Owing to the advances in laser technology and related material production over the past decades, many laboratories have started to build extreme light sources for the generation of pulses that have a large energy, narrow width and high peak power[Reference Danson, Hillier, Hopps and Neely1]. Such facilities would provide very strong fields, which are expected to provide breakthroughs in fundamental physics as well as related applications[Reference Mourou and Tajima2]. As engineering solutions, both optical parametric chirped-pulse amplification (OPCPA) using nonlinear crystals and chirped-pulse amplification (CPA) with Ti: sapphire and mixed Nd: glasses have been employed[Reference Danson, Hillier, Hopps and Neely1, Reference Blanchot, Béhar, Chapuis, Chappuis, Chardavoine, Charrier, Coïc, Damiens-Dupont, Duthu, Garcia, Goossens, Granet, Grosset-Grange, Guerin, Hebrard, Hilsz, Lamaignere, Lacombe, Lavastre, Longhi, Luce, Macias, Mangeant, Mazataud, Minou, Morgaint, Noailles, Neauport, Patelli, Perrot-Minnot, Present, Remy, Rouyer, Santacreu, Sozet, Valla and Laniesse3]. A high peak power, up to ${\sim}5~\text{PW}$
, has been reported at the facility in Shanghai and Sichuan in China[Reference Zeng, Zhou, Zuo, Zhu, Su, Wang, Wang, Huang, Jiang, Jiang, Guo, Xie, Zhou, Wu, Mu, Peng and Jing4, Reference Gan, Yu, Li, Wang, Liang, Liu, Li, Guo, Fan, Yuan, Xu, Liu, Xu, Lu, Lu, Yin, Leng, Li and Xu5]. In addition, a 4.2 PW Ti: sapphire laser at 0.1 Hz has been achieved in Korea[Reference Sung, Lee, Yoo, Yoon, Lee, Yang, Son, Jang, Lee and Nam6]. A facility named High-Repetition-Rate Advanced Petawatt Laser System (HAPLS) has been developed for the ELI-Beamlines by Lawrence Livermore National Laboratory (LLNL). The HAPLS takes advantage of diode-pumped solid-state lasers (DPSSLs) as pump source and delivers compressed pulses with peak power of 0.5 PW for each and at a repetition rate of 3.3 Hz[7]. OPCPA in noncollinear configuration is adopted primarily for the ultra-broadband gain bandwidth up to hundreds of nanometers, which support amplifications of few cycle pulses[Reference Batysta, Antipenkov, Novák, Green, Naylon, Horáček, Horáček, Hubka, Boge, Mazanec, Himmel, Bakule and Rus8, Reference Budriūnas, Stanislauskas, Adamonis, Aleknavičius, Veitas, Gadonas, Balickas, Michailovas and Varanavičius9]. OPCPA has other advantages such as the large gain in a single pass, small thermal loading, and high contrast[Reference Moses, Manzoni, Huang, Cerullo and Kärtner10]. Using various nonlinear crystals and schematic configurations, OPCPA can be applied for a wide range of central wavelengths, such as 808 nm[Reference Zeng, Zhou, Zuo, Zhu, Su, Wang, Wang, Huang, Jiang, Jiang, Guo, Xie, Zhou, Wu, Mu, Peng and Jing4–7], 910 nm[Reference Danson, Hillier, Hopps and Neely1, 11, Reference Lyachev, Musgrave, Tang, Hernandez-Gomez, Ross, Galimberti, Chekhlov and Collier12] and 1053 nm[Reference Blanchot, Béhar, Chapuis, Chappuis, Chardavoine, Charrier, Coïc, Damiens-Dupont, Duthu, Garcia, Goossens, Granet, Grosset-Grange, Guerin, Hebrard, Hilsz, Lamaignere, Lacombe, Lavastre, Longhi, Luce, Macias, Mangeant, Mazataud, Minou, Morgaint, Noailles, Neauport, Patelli, Perrot-Minnot, Present, Remy, Rouyer, Santacreu, Sozet, Valla and Laniesse3, Reference Gaul, Martinez, Blakeney, Jochmann, Ringuette, Hammond, Borger, Escamilla, Douglas, Henderson, Dyer, Erlandson, Cross, Caird, Ebbers and Ditmire13]. The disadvantages of OPCPA are mainly consisted of three aspects. First, the amplification stability is very sensitive with the phase-matching configurations; second, the amplification demands rigorously for high quality pump pulses both in spatial and temporal domains; third, there are few available nonlinear crystals of aperture large enough, especially for high energy amplifiers. In the high energy amplifiers, the reported conversion efficiency of multi-pass CPA is up to 49%, while the value of the state-of-the-art optical parametric amplification (OPA) keeps lower than 40%[Reference Gan, Yu, Li, Wang, Liang, Liu, Li, Guo, Fan, Yuan, Xu, Liu, Xu, Lu, Lu, Yin, Leng, Li and Xu5]. The progresses of new amplification technology and crystal growth have reduced the gap compared with CPA. An efficiency of
${\sim}5~\text{PW}$
, has been reported at the facility in Shanghai and Sichuan in China[Reference Zeng, Zhou, Zuo, Zhu, Su, Wang, Wang, Huang, Jiang, Jiang, Guo, Xie, Zhou, Wu, Mu, Peng and Jing4, Reference Gan, Yu, Li, Wang, Liang, Liu, Li, Guo, Fan, Yuan, Xu, Liu, Xu, Lu, Lu, Yin, Leng, Li and Xu5]. In addition, a 4.2 PW Ti: sapphire laser at 0.1 Hz has been achieved in Korea[Reference Sung, Lee, Yoo, Yoon, Lee, Yang, Son, Jang, Lee and Nam6]. A facility named High-Repetition-Rate Advanced Petawatt Laser System (HAPLS) has been developed for the ELI-Beamlines by Lawrence Livermore National Laboratory (LLNL). The HAPLS takes advantage of diode-pumped solid-state lasers (DPSSLs) as pump source and delivers compressed pulses with peak power of 0.5 PW for each and at a repetition rate of 3.3 Hz[7]. OPCPA in noncollinear configuration is adopted primarily for the ultra-broadband gain bandwidth up to hundreds of nanometers, which support amplifications of few cycle pulses[Reference Batysta, Antipenkov, Novák, Green, Naylon, Horáček, Horáček, Hubka, Boge, Mazanec, Himmel, Bakule and Rus8, Reference Budriūnas, Stanislauskas, Adamonis, Aleknavičius, Veitas, Gadonas, Balickas, Michailovas and Varanavičius9]. OPCPA has other advantages such as the large gain in a single pass, small thermal loading, and high contrast[Reference Moses, Manzoni, Huang, Cerullo and Kärtner10]. Using various nonlinear crystals and schematic configurations, OPCPA can be applied for a wide range of central wavelengths, such as 808 nm[Reference Zeng, Zhou, Zuo, Zhu, Su, Wang, Wang, Huang, Jiang, Jiang, Guo, Xie, Zhou, Wu, Mu, Peng and Jing4–7], 910 nm[Reference Danson, Hillier, Hopps and Neely1, 11, Reference Lyachev, Musgrave, Tang, Hernandez-Gomez, Ross, Galimberti, Chekhlov and Collier12] and 1053 nm[Reference Blanchot, Béhar, Chapuis, Chappuis, Chardavoine, Charrier, Coïc, Damiens-Dupont, Duthu, Garcia, Goossens, Granet, Grosset-Grange, Guerin, Hebrard, Hilsz, Lamaignere, Lacombe, Lavastre, Longhi, Luce, Macias, Mangeant, Mazataud, Minou, Morgaint, Noailles, Neauport, Patelli, Perrot-Minnot, Present, Remy, Rouyer, Santacreu, Sozet, Valla and Laniesse3, Reference Gaul, Martinez, Blakeney, Jochmann, Ringuette, Hammond, Borger, Escamilla, Douglas, Henderson, Dyer, Erlandson, Cross, Caird, Ebbers and Ditmire13]. The disadvantages of OPCPA are mainly consisted of three aspects. First, the amplification stability is very sensitive with the phase-matching configurations; second, the amplification demands rigorously for high quality pump pulses both in spatial and temporal domains; third, there are few available nonlinear crystals of aperture large enough, especially for high energy amplifiers. In the high energy amplifiers, the reported conversion efficiency of multi-pass CPA is up to 49%, while the value of the state-of-the-art optical parametric amplification (OPA) keeps lower than 40%[Reference Gan, Yu, Li, Wang, Liang, Liu, Li, Guo, Fan, Yuan, Xu, Liu, Xu, Lu, Lu, Yin, Leng, Li and Xu5]. The progresses of new amplification technology and crystal growth have reduced the gap compared with CPA. An efficiency of ${\sim}41\%$
has been experimentally demonstrated using a quasi-parametric amplification (QPA) that employs a
${\sim}41\%$
has been experimentally demonstrated using a quasi-parametric amplification (QPA) that employs a $\text{Sm}^{3+}$
-doped YCOB crystal[Reference Ma, Wang, Yuan, Xie, Xiong, Tu, Tu, Shi, Zheng and Qian14]. Generally speaking, a higher conversion efficiency for the master optical parametric amplifier is still required.
$\text{Sm}^{3+}$
-doped YCOB crystal[Reference Ma, Wang, Yuan, Xie, Xiong, Tu, Tu, Shi, Zheng and Qian14]. Generally speaking, a higher conversion efficiency for the master optical parametric amplifier is still required.
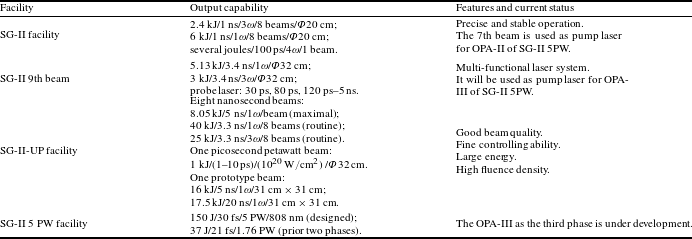
The output capability and features of SG series laser facilities.
Layout of the SG series laser facilities.

2 Architecture strategy
In this report, we provide a detailed introduction on the design specifications and current performance of the Shen Guang-II 5PW (SG-II 5PW) laser facility at the National Laboratory on High Power Laser and Physics (NLHLP), Shanghai Institute of Optics and Fine Mechanics, Chinese Academy of Sciences (SIOM, CAS). NLHLP has studied solid-state laser technologies and engineering for half a century and has developed SG series laser drivers for the research on inertial confinement fusion (ICF) in China. As shown in Figure 1, the SG series covers a region of $76~\text{m}\times 56~\text{m}$
and currently consists of SG-II, SG-II 9th beam, SG-II-Upgrade (SG-II-UP) and SG-II 5PW laser facilities. There used to be another laser facility named SG-I which ex-served in 1995. All of the laser facilities of the SG series except for the SG-II 5PW are based on Nd: glasses that pumped by xenon lamps, and operate in single shot (
$76~\text{m}\times 56~\text{m}$
and currently consists of SG-II, SG-II 9th beam, SG-II-Upgrade (SG-II-UP) and SG-II 5PW laser facilities. There used to be another laser facility named SG-I which ex-served in 1995. All of the laser facilities of the SG series except for the SG-II 5PW are based on Nd: glasses that pumped by xenon lamps, and operate in single shot ( $1{-}2~\text{h}\cdot \text{shot}^{-1}$
). The SG-II facility is capable of delivering pulses of 6 kJ at 1053 nm (
$1{-}2~\text{h}\cdot \text{shot}^{-1}$
). The SG-II facility is capable of delivering pulses of 6 kJ at 1053 nm ( $1\unicode[STIX]{x1D714}$
) and 2.4 kJ at 351 nm (
$1\unicode[STIX]{x1D714}$
) and 2.4 kJ at 351 nm ( $3\unicode[STIX]{x1D714}$
) when the pulse duration is 1 ns with all of the eight laser beams, one of which can provide probe laser pulses of several joules in 100 ps at 266 nm (
$3\unicode[STIX]{x1D714}$
) when the pulse duration is 1 ns with all of the eight laser beams, one of which can provide probe laser pulses of several joules in 100 ps at 266 nm ( $4\unicode[STIX]{x1D714}$
). The SG-II 9th beam is a multi-functional laser facility, and it can provide pulses of 5.13 kJ at
$4\unicode[STIX]{x1D714}$
). The SG-II 9th beam is a multi-functional laser facility, and it can provide pulses of 5.13 kJ at $1\unicode[STIX]{x1D714}$
and 3 kJ at
$1\unicode[STIX]{x1D714}$
and 3 kJ at $3\unicode[STIX]{x1D714}$
in 3.4 ns. In addition, it can provide probe lasers for physical experiments with tunable pulse bandwidths of 30 ps, 80 ps and
$3\unicode[STIX]{x1D714}$
in 3.4 ns. In addition, it can provide probe lasers for physical experiments with tunable pulse bandwidths of 30 ps, 80 ps and $120~\text{ps}{-}5~\text{ns}$
. SG-II-UP facility consists of eight nanosecond pulse beams and one picosecond petawatt pulse beam. The eight nanosecond beams regularly operate at 40 kJ/3.3 ns/
$120~\text{ps}{-}5~\text{ns}$
. SG-II-UP facility consists of eight nanosecond pulse beams and one picosecond petawatt pulse beam. The eight nanosecond beams regularly operate at 40 kJ/3.3 ns/ $1\unicode[STIX]{x1D714}$
and 25 kJ/3.3 ns/
$1\unicode[STIX]{x1D714}$
and 25 kJ/3.3 ns/ $3\unicode[STIX]{x1D714}$
. The maximum
$3\unicode[STIX]{x1D714}$
. The maximum $3\unicode[STIX]{x1D714}$
fluence density achieved now is
$3\unicode[STIX]{x1D714}$
fluence density achieved now is $5.5~\text{J}\cdot \text{cm}^{-2}$
with the beam size of
$5.5~\text{J}\cdot \text{cm}^{-2}$
with the beam size of $310~\text{mm}\times 310~\text{mm}$
. The picosecond petawatt beam can deliver pulses of 1 kJ/10 ps, 700 J/3 ps and 350 J/1 ps at
$310~\text{mm}\times 310~\text{mm}$
. The picosecond petawatt beam can deliver pulses of 1 kJ/10 ps, 700 J/3 ps and 350 J/1 ps at $1\unicode[STIX]{x1D714}$
after compression, similar to that obtained by the Omega EP at the University of Rochester[Reference Waxer, Maywar, Kelly, Kessler, Kruschwitz, Loucks, McCrory, Meyerhofer, Morse, Stoeckl and Zuegel15]. In addition, for the studies on higher fluence density amplification, we have developed a prototype beam that is capable to operate at 16 kJ/5 ns/
$1\unicode[STIX]{x1D714}$
after compression, similar to that obtained by the Omega EP at the University of Rochester[Reference Waxer, Maywar, Kelly, Kessler, Kruschwitz, Loucks, McCrory, Meyerhofer, Morse, Stoeckl and Zuegel15]. In addition, for the studies on higher fluence density amplification, we have developed a prototype beam that is capable to operate at 16 kJ/5 ns/ $1\unicode[STIX]{x1D714}$
and 17.5 kJ/20 ns/
$1\unicode[STIX]{x1D714}$
and 17.5 kJ/20 ns/ $1\unicode[STIX]{x1D714}$
with beam aperture
$1\unicode[STIX]{x1D714}$
with beam aperture $310~\text{mm}\times 310~\text{mm}$
. The maximized fluence density is up to
$310~\text{mm}\times 310~\text{mm}$
. The maximized fluence density is up to $18.2~\text{J}\cdot \text{cm}^{-2}$
and such a value is at the same level of those highest in the world[Reference Haynam, Wegner, Auerbach, Bowers, Dixit, Erbert, Heestand, Henesian, Hermann, Jancaitis, Manes, Marshall, Mehta, Menapace, Moses, Murray, Nostrand, Orth, Patterson, Sacks, Shaw, Spaeth, Sutton, Williams, Widmayer, White, Yang and Van Wonterghem16]. The output capability of SG series is summarized in Table 1. Therefore, the SG series are open and excellent integrated multi-functional laser platforms that have significance in various physics researches[Reference Zhong, Li, Wang, Wang, Dong, Xiao, Wang, Liu, Zhang, An, Wang, Zhu, Gu, He, Zhao and Zhang17, Reference Liu, Li, Zhang, Zhong, Zheng, Dong, Chen, Zhao, Sakawa, Morita, Kuramitsu, Kato, Chen, Lu, Ma, Wang, Sheng, Takabe, Rhee, Ding, Jiang, Liu, Zhu and Zhang18]. Based on the conditions above, SG-II 5PW is established as a part of the SG series laser platform to provide femtosecond multi-petawatt pulses for a multi-functional expansion. It has great potential applications for physics experiments in various operation modes, self-contained or combined with nanosecond kilojoules pulses from other laser beams and facilities with a precise synchronization of 7.6 ps root mean square (RMS)[Reference Gu, Zhang, Shan, Bi, Chen, Wei, Li, Song, Liu, Yang, Yu, Cui, Zhang, Liu, Liu, Wang, Dai, Yang, Yang, Zhang, Wu, Du, Zhou, Cao, Zhang, Wu, Ren, Cai, Wu, Cao, Zhang, Zhou and He19].
$18.2~\text{J}\cdot \text{cm}^{-2}$
and such a value is at the same level of those highest in the world[Reference Haynam, Wegner, Auerbach, Bowers, Dixit, Erbert, Heestand, Henesian, Hermann, Jancaitis, Manes, Marshall, Mehta, Menapace, Moses, Murray, Nostrand, Orth, Patterson, Sacks, Shaw, Spaeth, Sutton, Williams, Widmayer, White, Yang and Van Wonterghem16]. The output capability of SG series is summarized in Table 1. Therefore, the SG series are open and excellent integrated multi-functional laser platforms that have significance in various physics researches[Reference Zhong, Li, Wang, Wang, Dong, Xiao, Wang, Liu, Zhang, An, Wang, Zhu, Gu, He, Zhao and Zhang17, Reference Liu, Li, Zhang, Zhong, Zheng, Dong, Chen, Zhao, Sakawa, Morita, Kuramitsu, Kato, Chen, Lu, Ma, Wang, Sheng, Takabe, Rhee, Ding, Jiang, Liu, Zhu and Zhang18]. Based on the conditions above, SG-II 5PW is established as a part of the SG series laser platform to provide femtosecond multi-petawatt pulses for a multi-functional expansion. It has great potential applications for physics experiments in various operation modes, self-contained or combined with nanosecond kilojoules pulses from other laser beams and facilities with a precise synchronization of 7.6 ps root mean square (RMS)[Reference Gu, Zhang, Shan, Bi, Chen, Wei, Li, Song, Liu, Yang, Yu, Cui, Zhang, Liu, Liu, Wang, Dai, Yang, Yang, Zhang, Wu, Du, Zhou, Cao, Zhang, Wu, Ren, Cai, Wu, Cao, Zhang, Zhou and He19].
Schematic of the SG-II 5PW laser facility. AO: adaptive optics; HS: Hartmann sensor; DM: deformable mirror; OAP: off-axis parabolic mirror; AWG: arbitrary waveform generator; FM: frequency modulator.

The design of the SG-II 5PW facility is shown in Figure 2, and it relies on the implementation of a three-stage noncollinear OPCPA centered at 808 nm. The shaded parts in the figure are under development. The designed specifications can be described as follows. All stages are expected to realize compressed pulses that have high power of different orders, 1–10 TW at the first, 1 PW at the second, and 5 PW at the third stage. The second harmonic generated pulses from the existing laser based on Nd:YAG, SG-II 7th beam and SG-II 9th beam are employed as pump sources corresponding to the three stages. For the main amplifier based on a large-aperture $150~\text{mm}\times 150~\text{mm}$
LBO crystal, a chirped pulse that has energy higher than 250 J and a bandwidth broader than 40 nm is aimed. The beam is expanded to dimensions of
$150~\text{mm}\times 150~\text{mm}$
LBO crystal, a chirped pulse that has energy higher than 250 J and a bandwidth broader than 40 nm is aimed. The beam is expanded to dimensions of $290~\text{mm}\times 290~\text{mm}$
by spatial filter 5 (SF5) before being injected into the adaptive optics (AO) and compressor, which can deliver 150 J/30 fs pulses. In order to satisfy the demands of strong field experiments, the focused intensity is designed to
$290~\text{mm}\times 290~\text{mm}$
by spatial filter 5 (SF5) before being injected into the adaptive optics (AO) and compressor, which can deliver 150 J/30 fs pulses. In order to satisfy the demands of strong field experiments, the focused intensity is designed to ${\sim}10^{21}~\text{W}\cdot \text{cm}^{-2}$
and the energy concentration is 50% in twice diffraction limitations (2DL). At the focal spot, pulse contrast of larger than
${\sim}10^{21}~\text{W}\cdot \text{cm}^{-2}$
and the energy concentration is 50% in twice diffraction limitations (2DL). At the focal spot, pulse contrast of larger than $10^{8}$
is required. An integrated software and user-friendly interface have been developed including diagnosis, collimation and measurement systems. Real-time online data in all units, including the state of affairs, amplified pulse energy, spectrum, pulse waveform, near field and far field are automatically collected, processed and stored[Reference Zhang, Liu, Zhu, Tang and Gao20].
$10^{8}$
is required. An integrated software and user-friendly interface have been developed including diagnosis, collimation and measurement systems. Real-time online data in all units, including the state of affairs, amplified pulse energy, spectrum, pulse waveform, near field and far field are automatically collected, processed and stored[Reference Zhang, Liu, Zhu, Tang and Gao20].
3 Sub-system design and performance
3.1 Front end
The front end consists of an oscillator, pulse selector, stretcher, first stage OPCPA, pre-compressor, laser based on Nd:YAG for the OPA pump and attached spatial filters. The mode-locked Ti:sapphire oscillator operates at 78 MHz and produces 150 mW seed pulses for both signal amplification chains and photoelectric clock signal of the whole system. The oscillator provides ${\sim}2~\text{nJ}$
pulses at 808 nm that have a duration of 10 fs and FWHM spectrum bandwidth about 100 nm. A Pockels cell as a pulse selector is attached to reduce the repetition rate of OPA incident to a single shot and it operates synchronously with the master amplifier in experiments.
${\sim}2~\text{nJ}$
pulses at 808 nm that have a duration of 10 fs and FWHM spectrum bandwidth about 100 nm. A Pockels cell as a pulse selector is attached to reduce the repetition rate of OPA incident to a single shot and it operates synchronously with the master amplifier in experiments.
A four-pass Öffner stretcher is employed and shown in Figure 3 (left). The sizes of elements used in the stretcher are large enough to reduce the effects of spectrum clipping which will result in degeneration of contrast[Reference Wang, Pan, Li and Lin21]. The chirped-pulse width after stretcher is 2.55 ns with the chirp ratio 25.5 ps/nm and spectrum bandwidth of ${\sim}100~\text{nm}$
. The signal energy per pulse is approximately 0.2 nJ after the stretcher.
${\sim}100~\text{nm}$
. The signal energy per pulse is approximately 0.2 nJ after the stretcher.
Four-pass Öffner stretcher (left), laser based on Nd:YAG (middle) and first stage OPCPA on operation (right).

The signal beam is shrunk to $\unicode[STIX]{x1D719}5~\text{mm}$
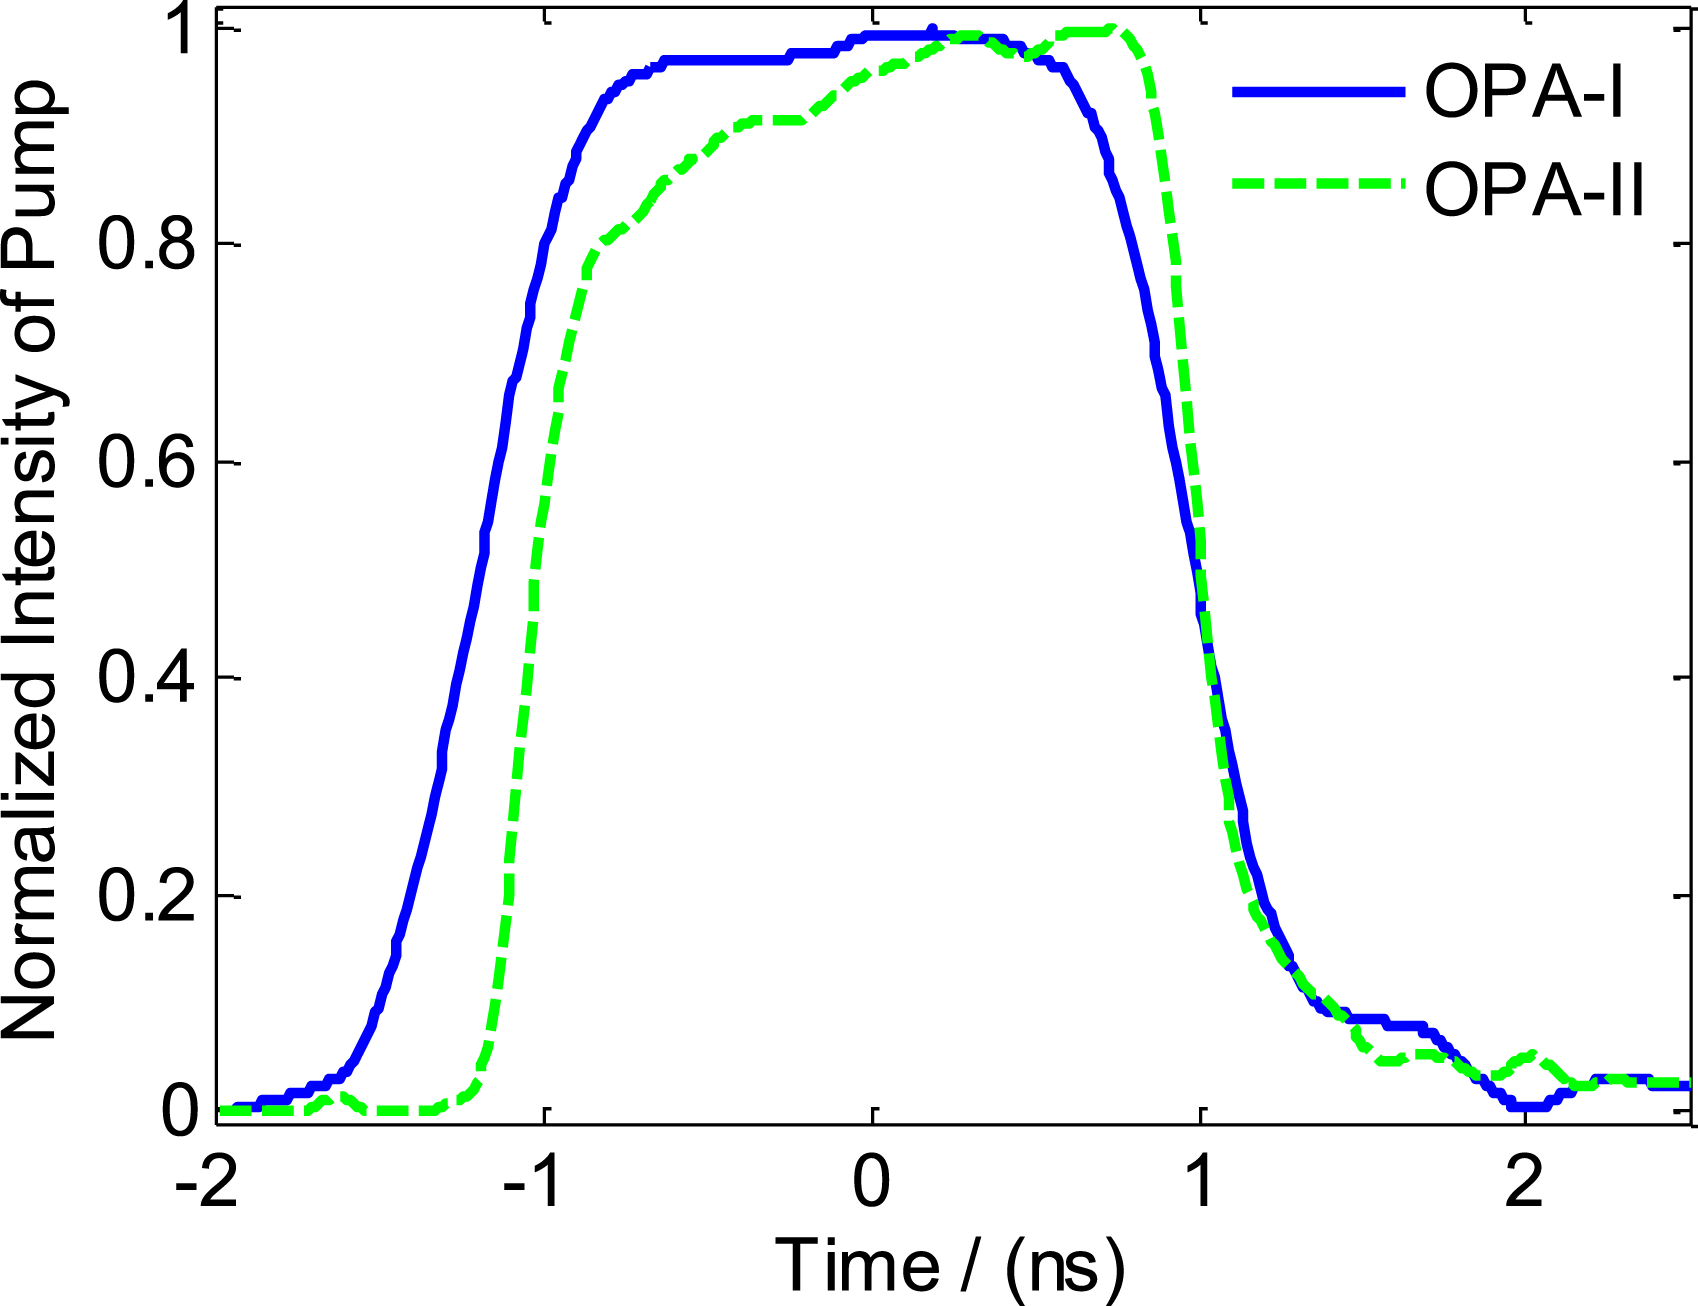
in round and injected into the first stage OPCPA (OPA-I) that includes LBO and BBO crystals as preamplifiers. The laser based on Nd:YAG glass provides spatio-temporal super-Gauss profile pulses at 1064 nm at 1 Hz repetition rate (Figure 3 (middle)). And a second harmonic generator (SHG) employing PPKTP crystal is located after the laser to produce 532 nm monochromatic pump pulses of 450 mJ per pulse in 2.2 ns (solid blue line in Figure 4). Using a beam splitter, a 60 mJ pump pulse is conducted into the LBO-based amplifiers. An image-relaying spatial filter is employed to reduce beam diameters and maintain a high quality near-field distribution of pump pulses at the position of OPA crystal. Critically phase-matched type-I LBO 30-mm-long crystals (
$\unicode[STIX]{x1D719}5~\text{mm}$
in round and injected into the first stage OPCPA (OPA-I) that includes LBO and BBO crystals as preamplifiers. The laser based on Nd:YAG glass provides spatio-temporal super-Gauss profile pulses at 1064 nm at 1 Hz repetition rate (Figure 3 (middle)). And a second harmonic generator (SHG) employing PPKTP crystal is located after the laser to produce 532 nm monochromatic pump pulses of 450 mJ per pulse in 2.2 ns (solid blue line in Figure 4). Using a beam splitter, a 60 mJ pump pulse is conducted into the LBO-based amplifiers. An image-relaying spatial filter is employed to reduce beam diameters and maintain a high quality near-field distribution of pump pulses at the position of OPA crystal. Critically phase-matched type-I LBO 30-mm-long crystals ( $\unicode[STIX]{x1D703}=90^{\circ }$
,
$\unicode[STIX]{x1D703}=90^{\circ }$
, $\unicode[STIX]{x1D711}=12.71^{\circ }$
), are aligned successively in a configuration as shown in Figure 2 to maintain the parametric bandwidth
$\unicode[STIX]{x1D711}=12.71^{\circ }$
), are aligned successively in a configuration as shown in Figure 2 to maintain the parametric bandwidth ${>}60~\text{nm}$
and spatial overlap among signal, idler and pump pulses. The noncollinear angle (
${>}60~\text{nm}$
and spatial overlap among signal, idler and pump pulses. The noncollinear angle ( $\unicode[STIX]{x1D6FC}$
) is set to
$\unicode[STIX]{x1D6FC}$
) is set to $1.13^{\circ }$
in the crystal[Reference Bagnoud, Begishev, Guardalben, Puth and Zuegel22]. With the synchronization of 14 ps RMS, these amplifiers provide majority of the gain up to
$1.13^{\circ }$
in the crystal[Reference Bagnoud, Begishev, Guardalben, Puth and Zuegel22]. With the synchronization of 14 ps RMS, these amplifiers provide majority of the gain up to $10^{7}$
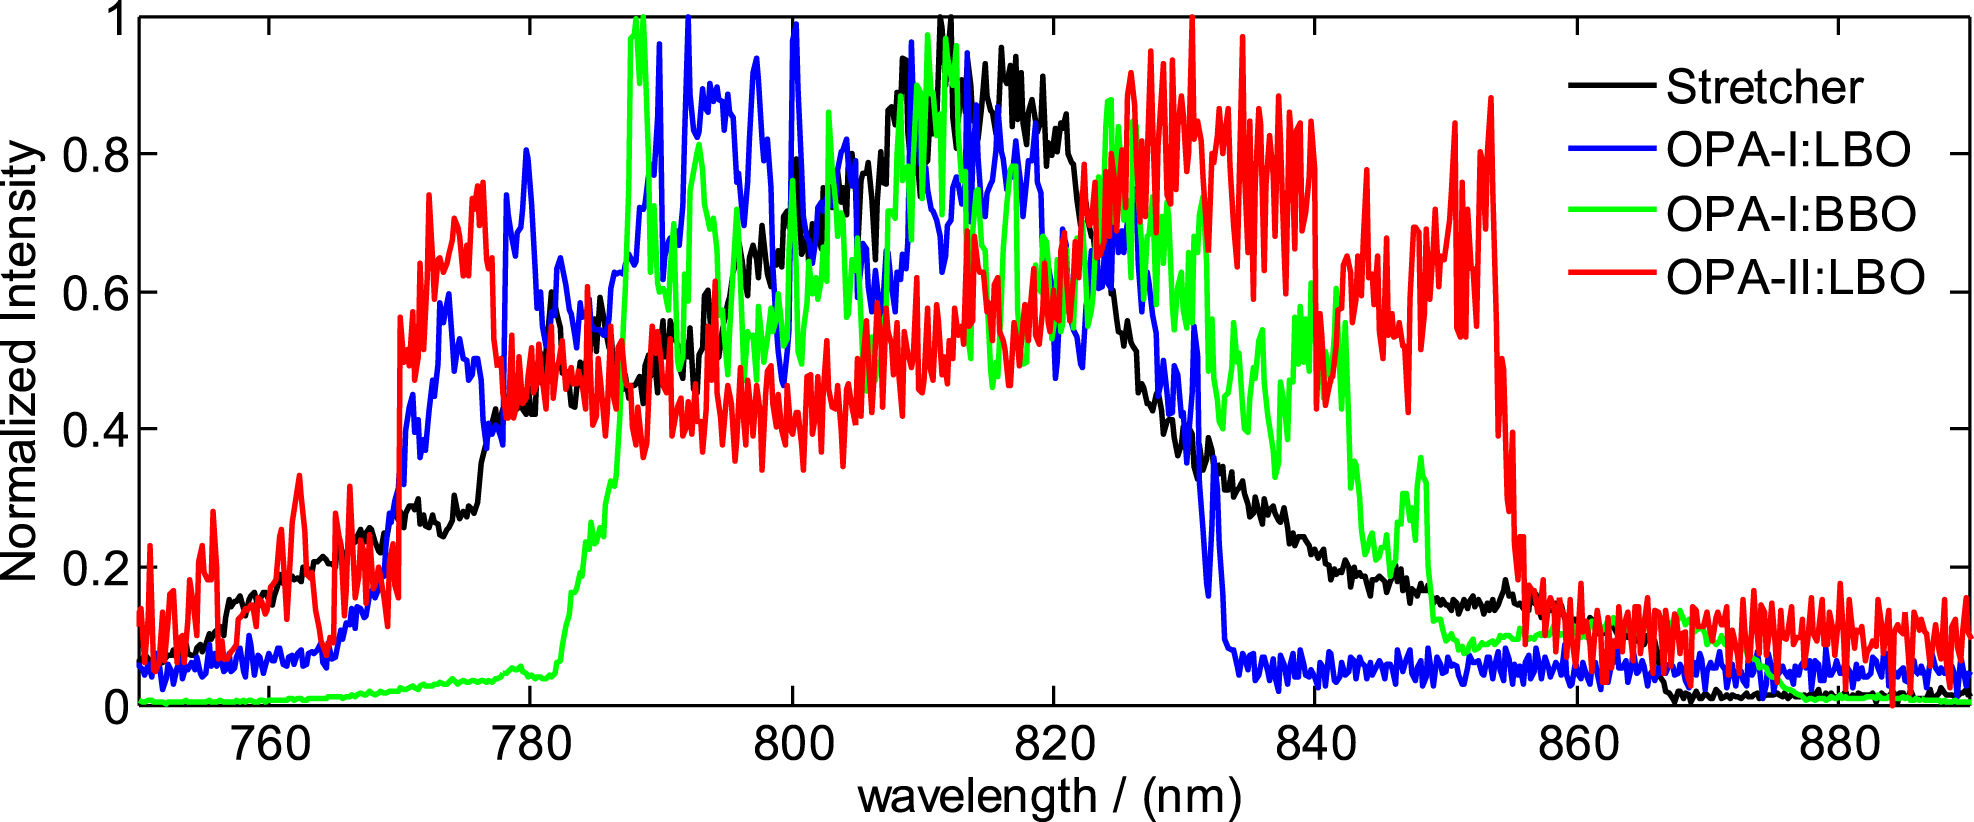
in the unsaturated regime and the signal energy per pulse exceeds 2 mJ. With the waveform of approximate Gaussian profile (black line in Figure 5) after the stretcher, the amplified waveform and spectrum are represented by the blue lines in Figure 5 and Figure 6, respectively. The temporal waveforms of the pump pulses and chirped signal pulses are measured online by photodiodes and displayed by oscilloscope. The photodiodes and oscilloscope are commercial products, which have bandwidths sufficient for nanosecond pulses’ measurements. The signal spectrum ranges from 765 nm to 833 nm. The FWHM bandwidth of 60 nm is in good agreement with the calculated parametric bandwidth and sufficient for the lateral amplifiers[Reference Zhao, Jiang, Sueda, Miyanaga and Kobayashi23].
$10^{7}$
in the unsaturated regime and the signal energy per pulse exceeds 2 mJ. With the waveform of approximate Gaussian profile (black line in Figure 5) after the stretcher, the amplified waveform and spectrum are represented by the blue lines in Figure 5 and Figure 6, respectively. The temporal waveforms of the pump pulses and chirped signal pulses are measured online by photodiodes and displayed by oscilloscope. The photodiodes and oscilloscope are commercial products, which have bandwidths sufficient for nanosecond pulses’ measurements. The signal spectrum ranges from 765 nm to 833 nm. The FWHM bandwidth of 60 nm is in good agreement with the calculated parametric bandwidth and sufficient for the lateral amplifiers[Reference Zhao, Jiang, Sueda, Miyanaga and Kobayashi23].
Waveforms of the pump pulses for OPA-I and OPA-II.
Waveforms of the chirped signal pulse along the current amplification chain.

The lens-based telescope SF1 then expands the signal beam to a diameter of 10 mm in order to match the pump beam diameter of 8.5 mm. Two type-I phase-matched BBO crystals are aligned in a configuration with an internal noncollinear angle of ${\sim}2.36^{\circ }$
. The BBO crystals are 15 mm in length and phase-matched at
${\sim}2.36^{\circ }$
. The BBO crystals are 15 mm in length and phase-matched at $\unicode[STIX]{x1D703}=23.8^{\circ }$
. By coupling with 390 mJ pump pulses (intensity of
$\unicode[STIX]{x1D703}=23.8^{\circ }$
. By coupling with 390 mJ pump pulses (intensity of ${\sim}300~\text{MW}/\text{cm}^{2}$
, well below the damage threshold), the signal pulses are further boosted to 130 mJ, and the total pump-to-signal conversion efficiency becomes
${\sim}300~\text{MW}/\text{cm}^{2}$
, well below the damage threshold), the signal pulses are further boosted to 130 mJ, and the total pump-to-signal conversion efficiency becomes ${\sim}30\%$
. With the online measurement system, the normalized near-field distribution behind the SF3 and far-field distribution are presented in Figures 7(a) and 7(b), respectively. Numerical analysis shows that the circular energy is 84% in 2.9 DL and 95% in 3.9 DL with focal lens (
${\sim}30\%$
. With the online measurement system, the normalized near-field distribution behind the SF3 and far-field distribution are presented in Figures 7(a) and 7(b), respectively. Numerical analysis shows that the circular energy is 84% in 2.9 DL and 95% in 3.9 DL with focal lens ( $f=750~\text{mm}$
). The signal temporal bandwidth increases to 1.63 ns (green line in Figure 5), caused by the saturated amplification. On the other hand, by optimizing the synchronization, the FWHM spectrum centered at
$f=750~\text{mm}$
). The signal temporal bandwidth increases to 1.63 ns (green line in Figure 5), caused by the saturated amplification. On the other hand, by optimizing the synchronization, the FWHM spectrum centered at ${\sim}815~\text{nm}$
covers the region of 784 nm to 846 nm (see green line in Figure 6). The OPA-I provides a total gain up to
${\sim}815~\text{nm}$
covers the region of 784 nm to 846 nm (see green line in Figure 6). The OPA-I provides a total gain up to $6\times 10^{8}$
at a repetition rate of 1 Hz and achieves a hundreds of millijoules chirped pulse that is expected to be compressed for the several-terawatt experimental platform.
$6\times 10^{8}$
at a repetition rate of 1 Hz and achieves a hundreds of millijoules chirped pulse that is expected to be compressed for the several-terawatt experimental platform.
Signal pulse spectra for different amplification stages.
(a) Normalized near-field distribution and (b) far-field focal spot of OPA-I.

As a further explanation, both LBO and BBO in our opinion have gain bandwidth large enough to support the compressed duration of 30 fs. On the other hand, the gain bandwidth is larger than the soft spectrum clipping of the compressor. We choose LBO as the medium of high gain OPA stage, because LBO is of higher damage threshold and the pump beam diameter on LBO can be much smaller than that of BBO. In this way, the energy of the pump pulse is smaller for high gain stage so that more energy left from the pump laser can be provided for the lateral high energy BBO-based OPA stages. In the future, we will update the Nd: YAG-based pump laser, and the LBO crystals are planned to be replaced by BBO crystals for a broader spectrum. All of the LBO and BBO crystals are cut with $1^{\circ }$
wedge angles at the rear faces and coated on the surfaces with 532 nm and 808 nm broadband antireflective films to suppress the parametric oscillation. The spatial filters between the stages, including SF1–SF5, are aligned with the pinholes to suppress the high-frequency modulations. Owing to the spatially dispersive characteristics, the optical parametric fluorescence (OPF) that generates in the amplification and transmits as high-order angular spectra can also be significantly suppressed by the pinholes in the spatial filters. The pre-compressor, located behind SF2, consists of two pairs of gold-coated diffraction gratings successively arranged[Reference Treacy24]. The chirped ratio is
$1^{\circ }$
wedge angles at the rear faces and coated on the surfaces with 532 nm and 808 nm broadband antireflective films to suppress the parametric oscillation. The spatial filters between the stages, including SF1–SF5, are aligned with the pinholes to suppress the high-frequency modulations. Owing to the spatially dispersive characteristics, the optical parametric fluorescence (OPF) that generates in the amplification and transmits as high-order angular spectra can also be significantly suppressed by the pinholes in the spatial filters. The pre-compressor, located behind SF2, consists of two pairs of gold-coated diffraction gratings successively arranged[Reference Treacy24]. The chirped ratio is $-4.2~\text{ps}\cdot \text{nm}^{-1}$
, and the gratings are of
$-4.2~\text{ps}\cdot \text{nm}^{-1}$
, and the gratings are of $1740~\text{groove}\cdot \text{mm}^{-1}$
and sizes of approximately
$1740~\text{groove}\cdot \text{mm}^{-1}$
and sizes of approximately $40~\text{mm}\times 60~\text{mm}$
and
$40~\text{mm}\times 60~\text{mm}$
and $110~\text{mm}\times 110~\text{mm}$
with the incidence angle
$110~\text{mm}\times 110~\text{mm}$
with the incidence angle $56^{\circ }$
. The pre-compressor is used to compensate the mismatch between the stretcher and master compressor. By a precise regulation, not only the shortest pulse width can be achieved, but also the third-order dispersion can be tuned to eliminate its effect on the contrast degeneration at the front edge of the compressed pulse. The optimal transmission efficiency of the pre-compressor of
$56^{\circ }$
. The pre-compressor is used to compensate the mismatch between the stretcher and master compressor. By a precise regulation, not only the shortest pulse width can be achieved, but also the third-order dispersion can be tuned to eliminate its effect on the contrast degeneration at the front edge of the compressed pulse. The optimal transmission efficiency of the pre-compressor of ${\sim}75\%$
is equal to that of the master compressor. So 90 mJ chirped pulses that have a diameter expanded to
${\sim}75\%$
is equal to that of the master compressor. So 90 mJ chirped pulses that have a diameter expanded to $\unicode[STIX]{x1D719}85~\text{mm}$
by SF3, are injected into the second OPCPA stage (OPA-II).
$\unicode[STIX]{x1D719}85~\text{mm}$
by SF3, are injected into the second OPCPA stage (OPA-II).
3.2 PW OPA-II
The second OPA stage is designed to realize 1 PW (compressed 30 J/30 fs) with the SHG of the 7th beam of SG-II facility as the pump source (Figure 8). A precisely designed soft-edge aperture is used in the SG-II front end to modulate the fundamental pulse profile from a round spot into a square. By optimizing the pinholes size in the succeeding low-pass spatial filters in order to adjust to the soft-edged aperture, the beam quality is greatly improved. The beam size is restricted to $60~\text{mm}\times 60~\text{mm}$
after the Nd:glass amplifier that is capable to provide a 200 J pulse at 1053 nm[Reference Huang, Fan and Lin25, Reference Liang, Kohn, Becker and Heinzen26]. A large-aperture 22-mm-thick KDP crystal is utilized as the second harmonic generator and the SHG conversion efficiency is approximately 70%. The temporal waveform of the SH is represented by the dashed green line in Figure 4 and the spatial profile is presented in Figure 9. The FWHM bandwidth is 2 ns, which is required to be slightly shorter than that of the signal pulse determined by the phase-matching bandwidth and chirped ratio. The fill factor (FF) and fluence beam contrast (FBC) are used to quantitatively describe the near-field distribution characteristics and they are defined in a fixed spatial region by formulas
$60~\text{mm}\times 60~\text{mm}$
after the Nd:glass amplifier that is capable to provide a 200 J pulse at 1053 nm[Reference Huang, Fan and Lin25, Reference Liang, Kohn, Becker and Heinzen26]. A large-aperture 22-mm-thick KDP crystal is utilized as the second harmonic generator and the SHG conversion efficiency is approximately 70%. The temporal waveform of the SH is represented by the dashed green line in Figure 4 and the spatial profile is presented in Figure 9. The FWHM bandwidth is 2 ns, which is required to be slightly shorter than that of the signal pulse determined by the phase-matching bandwidth and chirped ratio. The fill factor (FF) and fluence beam contrast (FBC) are used to quantitatively describe the near-field distribution characteristics and they are defined in a fixed spatial region by formulas $\text{FF}=\bar{I}/I_{\max }$
and
$\text{FF}=\bar{I}/I_{\max }$
and $\text{FBC}=\sqrt{1/mn\sum _{i=1}^{m}\sum _{j=1}^{n}[(I_{ij}-\bar{I})/\bar{I}]^{2}}$
, in which
$\text{FBC}=\sqrt{1/mn\sum _{i=1}^{m}\sum _{j=1}^{n}[(I_{ij}-\bar{I})/\bar{I}]^{2}}$
, in which $\bar{I}$
is the average intensity,
$\bar{I}$
is the average intensity, $I_{\max }$
is the maximal intensity,
$I_{\max }$
is the maximal intensity, $m$
and
$m$
and $n$
are the discrete dot numbers in the fixed region, and
$n$
are the discrete dot numbers in the fixed region, and $I_{ij}$
is the measured intensity corresponding to the point (
$I_{ij}$
is the measured intensity corresponding to the point ( $i,j$
). A numerical analysis shows that the FF and FBC of pump pulses are 0.7546 and 0.26, respectively.
$i,j$
). A numerical analysis shows that the FF and FBC of pump pulses are 0.7546 and 0.26, respectively.
SG-II laser facility (left), a large-aperture KDP crystal (as a second harmonic generator (middle)), and a large-aperture LBO crystal in the second OPCPA stage (right).

(a) Near-field distributions of the pump at location of LBO crystal and (b) signal pulse after the master compressor.

A state-of-the-art OPA based on a 19-mm-thick LBO is adopted in a type-I phase-matching noncollinear configuration in XOY principle plane. The matching angle is set to $\unicode[STIX]{x1D703}=90^{\circ }$
and
$\unicode[STIX]{x1D703}=90^{\circ }$
and $\unicode[STIX]{x1D711}=13.85^{\circ }$
and the noncollinear angle is
$\unicode[STIX]{x1D711}=13.85^{\circ }$
and the noncollinear angle is $1.25^{\circ }$
in the crystal [Reference Xu, Yu, Liang, Chu, Hu, Ma, Xu, Wang, Lu, Lu, Yue, Zhao, Fan, Tu, Leng, Li and Xu27]. In the latest experiment, the largest energy of the amplified chirped pulse up to 49.7 J was achieved with the pump pulse of 118.6 J in energy and
$1.25^{\circ }$
in the crystal [Reference Xu, Yu, Liang, Chu, Hu, Ma, Xu, Wang, Lu, Lu, Yue, Zhao, Fan, Tu, Leng, Li and Xu27]. In the latest experiment, the largest energy of the amplified chirped pulse up to 49.7 J was achieved with the pump pulse of 118.6 J in energy and ${\sim}1.7~\text{GW}\cdot \text{cm}^{-2}$
in fluence intensity, and the gain reached a value of 550. The pump-to-signal conversion efficiency is 41.9%, which to the best of our knowledge is the highest among the values reported for OPCPA facilities. The online measurement system provides the energy statistics of both signal and pump pulses for 13 shots in Figure 10. The mean values of amplified chirped-pulse energy and OPA conversion efficiency are 41.37 J and 37.8% with the pump pulse energy of 109 J on average. The RMS values of amplified chirped-pulse energy and OPA conversion efficiency are, respectively, 13.94% and 10.32% corresponding to the RMS value 7.76% of pump pulse energy. As shown by the red line in Figure 5, the signal pulse width increases to 1.92 ns, caused by the amplification in the saturation region, which is defined as the crystal length region longer than that corresponding to the highest conversion efficiency. The spectrum represented by the red line in Figure 6 is greatly extended from 770 nm to 855 nm, and the FWHM spectrum bandwidth is approximately 85 nm. The spectrum is measured after the master compressor and shows sharp edges on both sides. The most probable reason is the spatial clipping in the compressor and the spectrum after the OPA-II is going to be measured directly in future for comparison. The near-field distribution of the signal pulse is measured after the master compressor and shown in Figure 9(b).
${\sim}1.7~\text{GW}\cdot \text{cm}^{-2}$
in fluence intensity, and the gain reached a value of 550. The pump-to-signal conversion efficiency is 41.9%, which to the best of our knowledge is the highest among the values reported for OPCPA facilities. The online measurement system provides the energy statistics of both signal and pump pulses for 13 shots in Figure 10. The mean values of amplified chirped-pulse energy and OPA conversion efficiency are 41.37 J and 37.8% with the pump pulse energy of 109 J on average. The RMS values of amplified chirped-pulse energy and OPA conversion efficiency are, respectively, 13.94% and 10.32% corresponding to the RMS value 7.76% of pump pulse energy. As shown by the red line in Figure 5, the signal pulse width increases to 1.92 ns, caused by the amplification in the saturation region, which is defined as the crystal length region longer than that corresponding to the highest conversion efficiency. The spectrum represented by the red line in Figure 6 is greatly extended from 770 nm to 855 nm, and the FWHM spectrum bandwidth is approximately 85 nm. The spectrum is measured after the master compressor and shows sharp edges on both sides. The most probable reason is the spatial clipping in the compressor and the spectrum after the OPA-II is going to be measured directly in future for comparison. The near-field distribution of the signal pulse is measured after the master compressor and shown in Figure 9(b).
Statistics of the pump and signal pulses energy as well as the pump-to-signal conversion efficiency for all shots of the OPA-II.

(a) Amplified signal energy fluctuation for various pumps, (b) conversion efficiency, and (c) FF (red line) and FBC (blue line) along the LBO length in the OPCPA-II; the dotted lines in (c) are borderlines of the four intervals.
The precise synchronization and critically phase-matched alignment are required for high conversion efficiency. For OPA-II of SG-II 5PW, the synchronization of 100 ps (RMS) is precisely enough. The mismatches of noncollinear angle and phase-matching angle must be, respectively, smaller than $0.01^{\circ }$
and
$0.01^{\circ }$
and $0.05^{\circ }$
, which are determined by the acceptance angle in LBO crystal. The mismatch of noncollinear angle is determined by the monitoring precision on the beam pointing of the signal and pump beams, while the mismatch of phase-matching angle is determined by the mechanical stability of the crystal clamp. The auto-collimation system is applied to adjust the beams pointing before shots with a correction precision for state recovery about
$0.05^{\circ }$
, which are determined by the acceptance angle in LBO crystal. The mismatch of noncollinear angle is determined by the monitoring precision on the beam pointing of the signal and pump beams, while the mismatch of phase-matching angle is determined by the mechanical stability of the crystal clamp. The auto-collimation system is applied to adjust the beams pointing before shots with a correction precision for state recovery about $20~\unicode[STIX]{x03BC}\text{rad}$
, which is much smaller than the acceptance angle (
$20~\unicode[STIX]{x03BC}\text{rad}$
, which is much smaller than the acceptance angle ( ${\sim}1~\text{mrad}$
). In addition, the crystal length as well as the incident signal and pump pulses characteristics, including the energy, spatial–temporal profiles and wavefronts, should be taken into consideration. In order to improve the operation security, stability and conversion efficiency of the SG-II 5PW facility, the effects of the pump pulse near-field property and energy fluctuation on the OPCPA are numerically simulated along the crystal length, using parametric coupling wave equations[Reference Zhang, Wang, Sun, Bi, Xie and Lin28]. The measured spatial–temporal profiles of the incident signal pulses are shown in Figures 5 and 7(a), and those of the pump pulse are shown in Figures 4 and 9(a). The numerical simulations are based on the measured data and indicate that the OPCPA stability is optimized at 18.75 mm when the pump energy floats
${\sim}1~\text{mrad}$
). In addition, the crystal length as well as the incident signal and pump pulses characteristics, including the energy, spatial–temporal profiles and wavefronts, should be taken into consideration. In order to improve the operation security, stability and conversion efficiency of the SG-II 5PW facility, the effects of the pump pulse near-field property and energy fluctuation on the OPCPA are numerically simulated along the crystal length, using parametric coupling wave equations[Reference Zhang, Wang, Sun, Bi, Xie and Lin28]. The measured spatial–temporal profiles of the incident signal pulses are shown in Figures 5 and 7(a), and those of the pump pulse are shown in Figures 4 and 9(a). The numerical simulations are based on the measured data and indicate that the OPCPA stability is optimized at 18.75 mm when the pump energy floats $\pm 5\%$
around 120 J (Figure 11(a)). The conversion efficiency has a theoretical maximum of 44.5% at 17.75 mm, while the value is 41.37% for the optimized stability crystal length of 18.75 mm (Figure 11(b)). More complex evolutions of the near-field FF and FBC of the signal pulses are presented in Figure 11(c). Owing to the coupling effects between three mixing waves, the maximum FF is achieved at 18.5 mm, while the minimum FBC at 19.25 mm. At the crystal length about 12.5 mm, the FF is smallest and FBC is largest, which means the worst beam uniformity. Therefore, the crystal length can be divided into four regions: [0, 12.5 mm], [12.5 mm, 18.5 mm], [18.5 mm, 19.25 mm] and [19.25 mm, 20 mm]. Taking into account the evolutions of the conversion efficiency and stability, it can be concluded that there is an optimal interval [18.5 mm, 19.25 mm] of the nonlinear crystal length, in which a high beam quality, high conversion efficiency and high stability can be simultaneously achieved for fixed incidence pulses. The simulations and conclusions in Ref. [Reference Zhang, Wang, Sun, Bi, Xie and Lin28] indicate that the pump wavefront phase distortions transfer into those of the signal when the walk-off direction is identical to that of the signal in the super-saturation region. In OPCPA-II, we aligned the noncollinear configuration in order to make the walk-off direction identical to that of the idler to decrease the signal pulse wavefront degeneration caused by the pump wavefront distortion. The crystal length in the optimal interval [18.5 mm, 19.25 mm] is not far beyond the required crystal length of smaller than 17.75 mm, at which the wavefront distortion of the amplified beam can be maintained in low level.
$\pm 5\%$
around 120 J (Figure 11(a)). The conversion efficiency has a theoretical maximum of 44.5% at 17.75 mm, while the value is 41.37% for the optimized stability crystal length of 18.75 mm (Figure 11(b)). More complex evolutions of the near-field FF and FBC of the signal pulses are presented in Figure 11(c). Owing to the coupling effects between three mixing waves, the maximum FF is achieved at 18.5 mm, while the minimum FBC at 19.25 mm. At the crystal length about 12.5 mm, the FF is smallest and FBC is largest, which means the worst beam uniformity. Therefore, the crystal length can be divided into four regions: [0, 12.5 mm], [12.5 mm, 18.5 mm], [18.5 mm, 19.25 mm] and [19.25 mm, 20 mm]. Taking into account the evolutions of the conversion efficiency and stability, it can be concluded that there is an optimal interval [18.5 mm, 19.25 mm] of the nonlinear crystal length, in which a high beam quality, high conversion efficiency and high stability can be simultaneously achieved for fixed incidence pulses. The simulations and conclusions in Ref. [Reference Zhang, Wang, Sun, Bi, Xie and Lin28] indicate that the pump wavefront phase distortions transfer into those of the signal when the walk-off direction is identical to that of the signal in the super-saturation region. In OPCPA-II, we aligned the noncollinear configuration in order to make the walk-off direction identical to that of the idler to decrease the signal pulse wavefront degeneration caused by the pump wavefront distortion. The crystal length in the optimal interval [18.5 mm, 19.25 mm] is not far beyond the required crystal length of smaller than 17.75 mm, at which the wavefront distortion of the amplified beam can be maintained in low level.
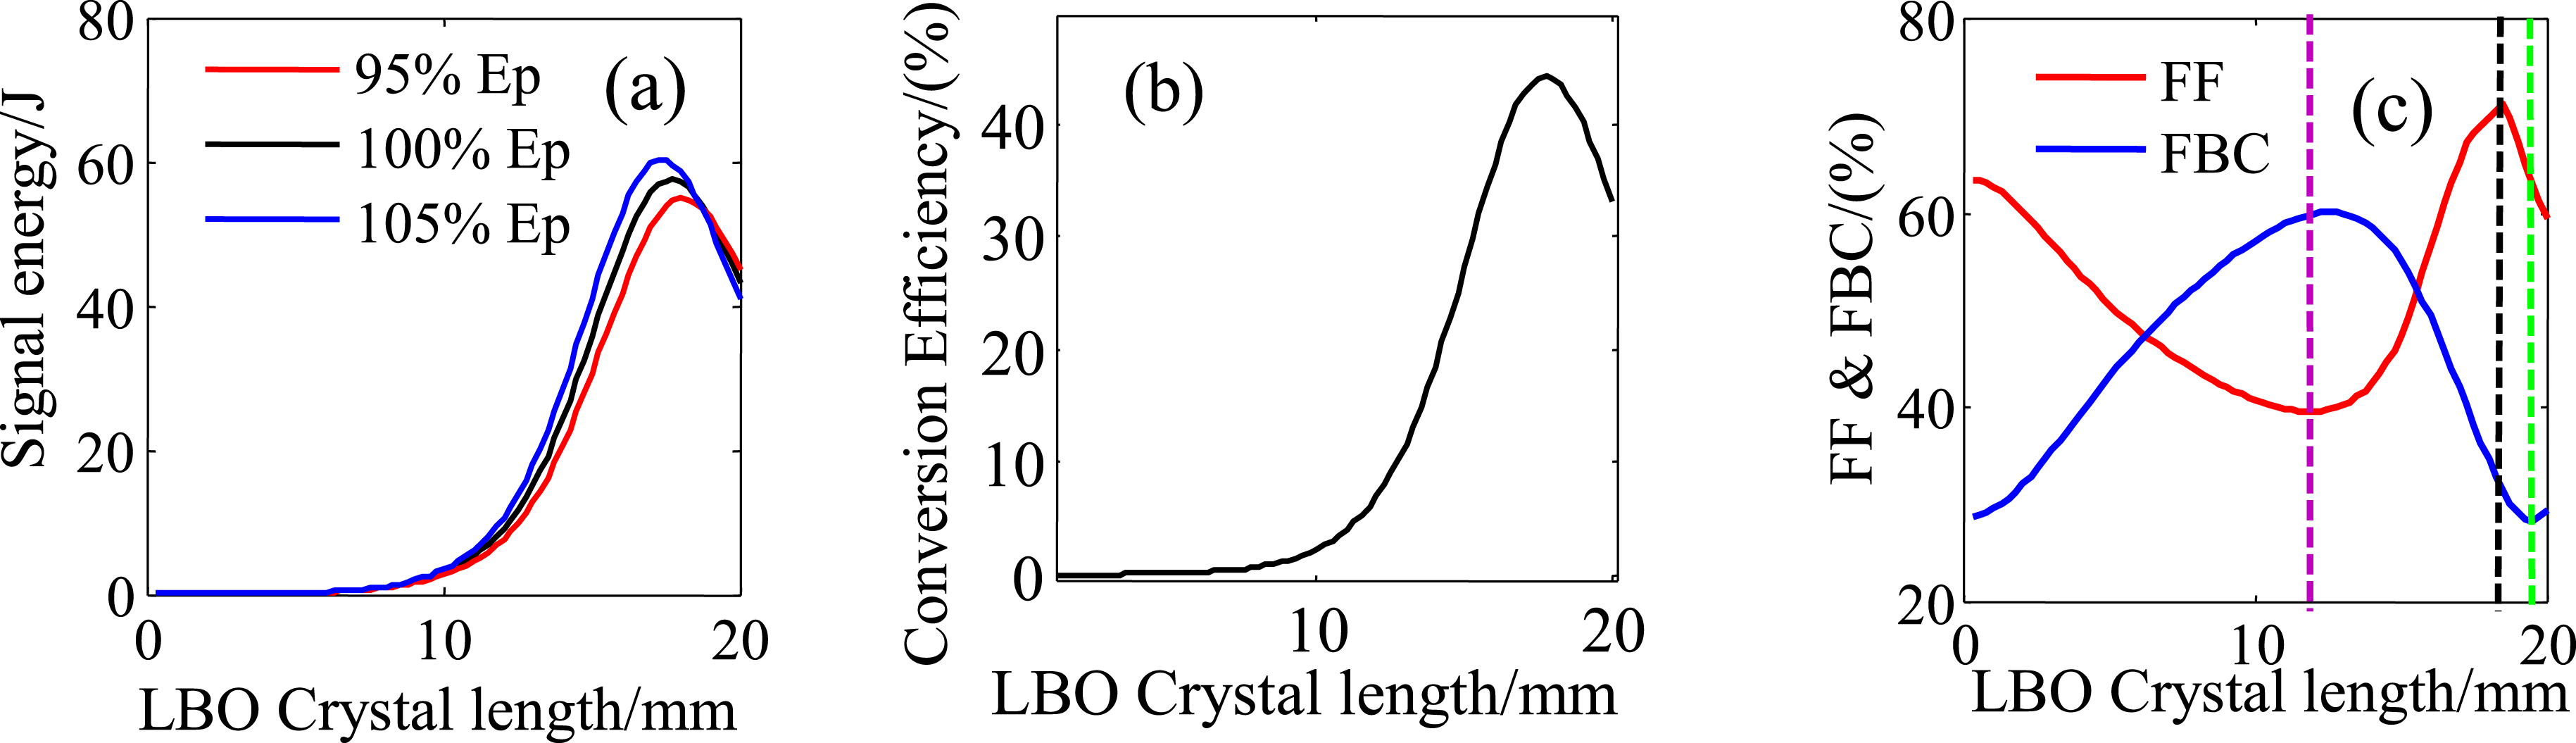
Additional simulations on FF and FBC are performed when the incident signal and pump pulses are set in ideal spatial–temporal super-Gaussian profiles so that we can quantitatively reveal which incident pulse affects the near-field distribution performance of the OPCPA-II to a greater extent. As shown in Figure 12(a), using the ideal spatial–temporal super-Gaussian pump pulse and actual signal pulse, FF (red line) and FBC (blue line) for the OPCPA-II amplified signals are much better than those shown in Figure 11(c). In contrast, for the ideal spatial–temporal super-Gaussian signal pulse and actual pump pulse, both FF (red line) and FBC (blue line) at 19 mm in Figure 12(b) differ slightly from those shown in Figure 11(c). The results indicate that the pump pulse greatly affects the amplified beam uniformity. Enhancement of the SG-II 7th beam quality is a practical approach to improve the beam uniformity of OPCPA-II amplified signal pulses.
Comparison between LBO and DKDP calculations in OPA-III.

FF (red line) and FBC (blue line) for the OPCPA-II amplified signal as a function of the crystal length that correspond to the amplification (a) with the ideal spatial–temporal super-Gaussian pump pulse and actual signal pulse and (b) that with the ideal spatial–temporal super-Gaussian signal pulse and actual pump pulse, respectively.
3.3 Master amplifier under construction
We aim to use the 9th beam of the SG-II facility for the pump of the master amplifier that can provide a compressed 5 PW (150 J/30 fs) pulse. The Nd:glass amplification chain in the 9th beam has powerful abilities to achieve pulse energy larger than 5 kJ and a pulse width that is tunable in the range 1–3 ns at 1053 nm with an arbitrary waveform that can be controlled in both spatial and temporal domains[Reference Dongfeng, Li and Zunqi29]. The SHG with KDP crystal can provide sufficient pulse energy of 3 kJ at 526.5 nm that is significantly larger than the upper limitation value of 1 kJ required for the OPA-III. The image relay technique is used for both signal and pump optical path designs and the beam size of pump pulse is $145~\text{mm}\times 145~\text{mm}$
after the SF9. A large aperture of
$145~\text{mm}\times 145~\text{mm}$
after the SF9. A large aperture of $150~\text{mm}\times 150~\text{mm}\times 13~\text{mm}$
LBO is required by numerical simulation for the high energy low-gain OPA, while the highest reported crystal size is
$150~\text{mm}\times 150~\text{mm}\times 13~\text{mm}$
LBO is required by numerical simulation for the high energy low-gain OPA, while the highest reported crystal size is $165~\text{mm}\times 120~\text{mm}\times 10~\text{mm}$
[Reference Zeng, Zhou, Zuo, Zhu, Su, Wang, Wang, Huang, Jiang, Jiang, Guo, Xie, Zhou, Wu, Mu, Peng and Jing4]. As a result, the DKDP of high level deuteration is an alternative choice, and it has been experimentally demonstrated on a desktop platform[Reference Liang, Sun, Kang, Zhou, Xie, Zhu and Lin30]. Combined with the numerical simulations based on the coupled wave equations, it can be concluded that a 35 mm DKDP crystal that has a deuteration level higher than 90% can be utilized in ultrashort high power laser systems with compressed pulses around 30 fs[Reference Liang, Sun, Kang, Zhou, Xie, Zhu and Lin30, Reference Sun, Cui, Kang, Zhang, Zhang, Cui, Xie, Liu, Liu, Zhu and Lin31]. Comparison between LBO and DKDP calculations is listed in Table 2.
$165~\text{mm}\times 120~\text{mm}\times 10~\text{mm}$
[Reference Zeng, Zhou, Zuo, Zhu, Su, Wang, Wang, Huang, Jiang, Jiang, Guo, Xie, Zhou, Wu, Mu, Peng and Jing4]. As a result, the DKDP of high level deuteration is an alternative choice, and it has been experimentally demonstrated on a desktop platform[Reference Liang, Sun, Kang, Zhou, Xie, Zhu and Lin30]. Combined with the numerical simulations based on the coupled wave equations, it can be concluded that a 35 mm DKDP crystal that has a deuteration level higher than 90% can be utilized in ultrashort high power laser systems with compressed pulses around 30 fs[Reference Liang, Sun, Kang, Zhou, Xie, Zhu and Lin30, Reference Sun, Cui, Kang, Zhang, Zhang, Cui, Xie, Liu, Liu, Zhu and Lin31]. Comparison between LBO and DKDP calculations is listed in Table 2.
3.4 Master compressor and contrast measurement
The master compressor contains four pieces of $1740~\text{groove}\cdot \text{mm}^{-1}$
gold-coated gratings that have a size of
$1740~\text{groove}\cdot \text{mm}^{-1}$
gold-coated gratings that have a size of $360~\text{mm}\times 565~\text{mm}$
. The gratings are aligned in a zigzag configuration, and placed in a tank that has a diameter of 1.7 m and a length of 4.9 m. The guaranteed vacuum degree is
$360~\text{mm}\times 565~\text{mm}$
. The gratings are aligned in a zigzag configuration, and placed in a tank that has a diameter of 1.7 m and a length of 4.9 m. The guaranteed vacuum degree is $10^{-4}$
bar during operation (Figure 13). By a precise regulation, the compressor provides a chirped ratio of
$10^{-4}$
bar during operation (Figure 13). By a precise regulation, the compressor provides a chirped ratio of $-21.3~\text{ps}/\text{nm}$
and realizes output pulses that are temporally near the Fourier transform limitation. For the incident angle of
$-21.3~\text{ps}/\text{nm}$
and realizes output pulses that are temporally near the Fourier transform limitation. For the incident angle of $56^{\circ }$
, the intensities on the surface are smaller than
$56^{\circ }$
, the intensities on the surface are smaller than $0.16~\text{J}\cdot \text{cm}^{-2}$
and
$0.16~\text{J}\cdot \text{cm}^{-2}$
and $0.1~\text{J}\cdot \text{cm}^{-2}$
for the first and last pieces of gratings, respectively, when all three amplifiers operate (smaller than half of the damage threshold).
$0.1~\text{J}\cdot \text{cm}^{-2}$
for the first and last pieces of gratings, respectively, when all three amplifiers operate (smaller than half of the damage threshold).
Compressor tank (left) and an inner image of the gold-coated gratings (right).

The compressed pulse traces, measured by an autocorrelator, are shown in Figure 14
[Reference Salin, Georges, Roger and Brun32]. The Gaussian profile fitting shows that the FWHM pulse duration is 21 fs. What is more, the pulse traces indicate a substantially uncompressed pedestal ( ${\sim}200~\text{fs}$
), which in our opinion mainly derives from the integral effect of chromatic aberrations. The chromatic aberrations are due to all of the lens-based spatial filters. In the future, an aberration pre-compensation unit will be installed in front of SF3 and numerical simulation indicates its effectiveness. Assuming that energy of the side pulse and uncompressed pedestal is ignorable, the compressed pulse energy is 37.2 J and the peak power is up to 1.76 PW. An appropriate contrast is highly demanded for physical experiments [Reference Papadopoulos, Zou, Le Blanc, Cheriaux, Georges, Druon, Mennerat, Ramirez, Martin, Freneaux, Beluze, Lebas, Monot, Mathieu and Audebert33, Reference Bagnoud and Wagner34]. The contrast in the nanosecond temporal windows is measured by the photoelectric tube and oscilloscope, and it has been confirmed experimentally higher than that in the picosecond temporal windows. Therefore, in ultrashort pulse experiment, it is usually focused on the pulse contrast of the 100 ps range. We measured the contrast by a third-order cross-correlator (Sequoia), as shown in Figure 15
[Reference Divall and Ross35]. The contrast value due to the temporal pedestal at 20 ps before the peak pulse is better than
${\sim}200~\text{fs}$
), which in our opinion mainly derives from the integral effect of chromatic aberrations. The chromatic aberrations are due to all of the lens-based spatial filters. In the future, an aberration pre-compensation unit will be installed in front of SF3 and numerical simulation indicates its effectiveness. Assuming that energy of the side pulse and uncompressed pedestal is ignorable, the compressed pulse energy is 37.2 J and the peak power is up to 1.76 PW. An appropriate contrast is highly demanded for physical experiments [Reference Papadopoulos, Zou, Le Blanc, Cheriaux, Georges, Druon, Mennerat, Ramirez, Martin, Freneaux, Beluze, Lebas, Monot, Mathieu and Audebert33, Reference Bagnoud and Wagner34]. The contrast in the nanosecond temporal windows is measured by the photoelectric tube and oscilloscope, and it has been confirmed experimentally higher than that in the picosecond temporal windows. Therefore, in ultrashort pulse experiment, it is usually focused on the pulse contrast of the 100 ps range. We measured the contrast by a third-order cross-correlator (Sequoia), as shown in Figure 15
[Reference Divall and Ross35]. The contrast value due to the temporal pedestal at 20 ps before the peak pulse is better than $10^{-6}$
. It is featured that both pulse width and contrast are measured with the whole beam diameter by shrinking the beam from
$10^{-6}$
. It is featured that both pulse width and contrast are measured with the whole beam diameter by shrinking the beam from $290~\text{mm}\times 290~\text{mm}$
to
$290~\text{mm}\times 290~\text{mm}$
to $5~\text{mm}\times 5~\text{mm}$
. These measurements with the whole beam diameter in large-aperture ultrashort laser facilities are reported for the first time, to the best of our knowledge[Reference Danson, Hillier, Hopps and Neely1, Reference Zeng, Zhou, Zuo, Zhu, Su, Wang, Wang, Huang, Jiang, Jiang, Guo, Xie, Zhou, Wu, Mu, Peng and Jing4–Reference Sung, Lee, Yoo, Yoon, Lee, Yang, Son, Jang, Lee and Nam6, Reference Chu, Gan, Liang, Yu, Lu, Wang, Wang, Xu, Lu, Yin, Leng, Li and Xu36].
$5~\text{mm}\times 5~\text{mm}$
. These measurements with the whole beam diameter in large-aperture ultrashort laser facilities are reported for the first time, to the best of our knowledge[Reference Danson, Hillier, Hopps and Neely1, Reference Zeng, Zhou, Zuo, Zhu, Su, Wang, Wang, Huang, Jiang, Jiang, Guo, Xie, Zhou, Wu, Mu, Peng and Jing4–Reference Sung, Lee, Yoo, Yoon, Lee, Yang, Son, Jang, Lee and Nam6, Reference Chu, Gan, Liang, Yu, Lu, Wang, Wang, Xu, Lu, Yin, Leng, Li and Xu36].
Design of multiple-stage spatial filters in SG-II 5PW system.
Compressed pulse duration with the whole beam diameter.

Profile measured by a third-order cross-correlator with the whole beam diameter.

Next we analyze the temporal contrast in different time regions. Scattering in grating based stretchers has been identified as a source of asymmetrical pedestal around amplified pulses. According to Ref. [Reference Hooker, Tang, Chekhlov, Collier, Divall, Ertel, Hawkes, Parry and Rajeev37], the effect of the scattering in grating based stretchers on the contrast is in the 15 ps range and from $10^{-8}$
to
$10^{-8}$
to $10^{-5}$
amplitude. The contrast of Figure 15 is only
$10^{-5}$
amplitude. The contrast of Figure 15 is only $10^{-6}$
in the 100 ps range, so the asymmetrical pedestal owing to the scattering in the grating based stretcher is covered up. The temporal pedestal before 20 ps, ahead of the main pulse, was mainly caused by the parametric fluorescence from OPCPA. The leading edge of the main pulse that has dimensions of few picoseconds was influenced by the residual high-order dispersion and system-wide spatio-temporal couplings among the spatial filters, compressor and focusing optics [Reference Zhu, Xie, Ouyang and Zhu38, Reference Zhu, Xie and Zhu39]. As mentioned above, in SG-II 5PW system, the spatial filters can filter out the high spatial frequency noise of the beam and act as beam expanders; they can improve the near-field beam quality and avoid laser-induced damages to the optical elements in the laser system. According to the long-distance image-relaying requirement of the practical setup, the multiple-stage lens-based spatial filters were designed using the parameters listed in Table 3
[Reference Zhu, Xie and Zhu39]. The incident signal beam is expanded from a 2.5-mm-diameter round shape to a
$10^{-6}$
in the 100 ps range, so the asymmetrical pedestal owing to the scattering in the grating based stretcher is covered up. The temporal pedestal before 20 ps, ahead of the main pulse, was mainly caused by the parametric fluorescence from OPCPA. The leading edge of the main pulse that has dimensions of few picoseconds was influenced by the residual high-order dispersion and system-wide spatio-temporal couplings among the spatial filters, compressor and focusing optics [Reference Zhu, Xie, Ouyang and Zhu38, Reference Zhu, Xie and Zhu39]. As mentioned above, in SG-II 5PW system, the spatial filters can filter out the high spatial frequency noise of the beam and act as beam expanders; they can improve the near-field beam quality and avoid laser-induced damages to the optical elements in the laser system. According to the long-distance image-relaying requirement of the practical setup, the multiple-stage lens-based spatial filters were designed using the parameters listed in Table 3
[Reference Zhu, Xie and Zhu39]. The incident signal beam is expanded from a 2.5-mm-diameter round shape to a $290~\text{mm}\times 290~\text{mm}$
square shape, by five stages of spatial filters (SF1–SF5). The propagation time difference (PTD) is defined by the time delay between the pulse in the center of the beam and that at the edge. The PTD of each spatial filter was calculated according to Ref. [Reference Bor40], which increases with the diameter of the lens-based spatial filters. Numerical analysis shows that the chromatic aberrations and PTD introduced by the lens-based spatial filters spatial-temporally coupled with the compression and focusing can degrade the temporal contrast. This leads to a compressed and focused pulse that has a high noise level and low steepness of the leading edge. Therefore, the chromatic aberrations of SG-II 5PW laser system should be compensated by an additional device or avoided by replacing the lens-based spatial filters with mirror-based spatial filters in order to obtain compressed and focused pulses with a higher temporal contrast.
$290~\text{mm}\times 290~\text{mm}$
square shape, by five stages of spatial filters (SF1–SF5). The propagation time difference (PTD) is defined by the time delay between the pulse in the center of the beam and that at the edge. The PTD of each spatial filter was calculated according to Ref. [Reference Bor40], which increases with the diameter of the lens-based spatial filters. Numerical analysis shows that the chromatic aberrations and PTD introduced by the lens-based spatial filters spatial-temporally coupled with the compression and focusing can degrade the temporal contrast. This leads to a compressed and focused pulse that has a high noise level and low steepness of the leading edge. Therefore, the chromatic aberrations of SG-II 5PW laser system should be compensated by an additional device or avoided by replacing the lens-based spatial filters with mirror-based spatial filters in order to obtain compressed and focused pulses with a higher temporal contrast.
3.5 Adaptive optics and focusing
The AO system in the SG-II 5PW laser facility is utilized to correct both static and dynamic wavefront aberrations and thus to improve the focusing characteristics. The wavefront correction is extremely crucial for large-aperture ultrashort lasers, as the aberrations of the chirped pulses differ not only for spatial regions but also temporally for various wavelengths that cover a wide range. In the SG-II 5PW facility, a deformable mirror (clear aperture: $320~\text{mm}\times 320~\text{mm}$
) that consists of 77 piezoelectric ceramic transducer (PZT) actuators fabricated by Institute of Optics and Electronics (IOE, CAS) as well as a Hartmann sensor is located at the master compressor entrance (Figure 16). The wavefront aberrations are measured by the Hartmann sensor using a narrow band-pass filter with the central wavelength of 808 nm whose bandwidth is 3 nm, corrected by the deformable mirror, and minimized computationally using an accurate numerical algorithm. The defocus and astigmatism are the most significant wavefront aberrations according to the measurement for the whole system.
$320~\text{mm}\times 320~\text{mm}$
) that consists of 77 piezoelectric ceramic transducer (PZT) actuators fabricated by Institute of Optics and Electronics (IOE, CAS) as well as a Hartmann sensor is located at the master compressor entrance (Figure 16). The wavefront aberrations are measured by the Hartmann sensor using a narrow band-pass filter with the central wavelength of 808 nm whose bandwidth is 3 nm, corrected by the deformable mirror, and minimized computationally using an accurate numerical algorithm. The defocus and astigmatism are the most significant wavefront aberrations according to the measurement for the whole system.
Deformable mirror (left) and Hartmann sensor (right) in AO system.

Using the AO system, the static wavefront aberrations, described by peak to valley (PV) and RMS at 808 nm, respectively, are first improved from (6.257 $\unicode[STIX]{x1D706}$
, 0.960
$\unicode[STIX]{x1D706}$
, 0.960 $\unicode[STIX]{x1D706}$
) to (0.661
$\unicode[STIX]{x1D706}$
) to (0.661 $\unicode[STIX]{x1D706}$
, 0.111
$\unicode[STIX]{x1D706}$
, 0.111 $\unicode[STIX]{x1D706}$
) when all of the OPA are not operated (Figures 17(a) and (b)). Second, before the high energy shot, the shape of the deformable mirror is optimized with an additional data to pre-compensate OPA dynamic aberrations and the inherent aberrations of the master compressor and the off-axis parabolic (OAP) mirror. As shown in Figure 17(c), the dynamic wavefront aberrations are corrected to (1.171
$\unicode[STIX]{x1D706}$
) when all of the OPA are not operated (Figures 17(a) and (b)). Second, before the high energy shot, the shape of the deformable mirror is optimized with an additional data to pre-compensate OPA dynamic aberrations and the inherent aberrations of the master compressor and the off-axis parabolic (OAP) mirror. As shown in Figure 17(c), the dynamic wavefront aberrations are corrected to (1.171 $\unicode[STIX]{x1D706}$
, 0.281
$\unicode[STIX]{x1D706}$
, 0.281 $\unicode[STIX]{x1D706}$
) when both OPA-I and OPA-II are operated. The profiles of the focal spots as well as the encircled energy curves, which are calculated by Fourier transform corresponding to Figures 17(a), (b) and (c), are provided in Figures 17(d), (e) and (f), respectively. It is obtained that the Strehl ratio (StR) of the focal spot is improved from 0.0578 to 0.7836 after the static wavefront correction. However, even if the dynamic wavefront aberrations are pre-compensated, the StR in Figure 17(f) degrades to 0.4597 because of the real-time jitter of dynamic aberrations. As a result, the focal spot that encompasses 50% of the energy degrades in diameter from
$\unicode[STIX]{x1D706}$
) when both OPA-I and OPA-II are operated. The profiles of the focal spots as well as the encircled energy curves, which are calculated by Fourier transform corresponding to Figures 17(a), (b) and (c), are provided in Figures 17(d), (e) and (f), respectively. It is obtained that the Strehl ratio (StR) of the focal spot is improved from 0.0578 to 0.7836 after the static wavefront correction. However, even if the dynamic wavefront aberrations are pre-compensated, the StR in Figure 17(f) degrades to 0.4597 because of the real-time jitter of dynamic aberrations. As a result, the focal spot that encompasses 50% of the energy degrades in diameter from $2.64~\unicode[STIX]{x03BC}\text{m}$
with the static wavefront correction to
$2.64~\unicode[STIX]{x03BC}\text{m}$
with the static wavefront correction to $5.32~\unicode[STIX]{x03BC}\text{m}$
with the dynamic wavefront pre-compensation. Therefore, another Hartmann sensor is planned to be set after the focusing spot to evaluate the jitter of dynamic aberrations so that the focusing characteristics can be further improved by AO system in real time.
$5.32~\unicode[STIX]{x03BC}\text{m}$
with the dynamic wavefront pre-compensation. Therefore, another Hartmann sensor is planned to be set after the focusing spot to evaluate the jitter of dynamic aberrations so that the focusing characteristics can be further improved by AO system in real time.
The measured static aberrations (a) before and (b) after correction, and (c) the pre-compensated dynamic aberrations when the amplifiers are on operation at the master compressor entrance; (d), (e) and (f) the calculated encircled energy and the profiles of far-field focal spot, respectively, corresponding to (a), (b) and (c).
Target chamber.

After the closed-loop correction by the AO system and compressor, the laser beam is focused by an OAP mirror that has a focal length of 800 mm and $f$
/1.95 into the target chamber as shown in Figure 18. Compared with the focal spot diameter of
$f$
/1.95 into the target chamber as shown in Figure 18. Compared with the focal spot diameter of ${\sim}30~\unicode[STIX]{x03BC}\text{m}$
(FWHM) without wavefront correction, the spot quality is greatly improved with the AO system and the spot size is
${\sim}30~\unicode[STIX]{x03BC}\text{m}$
(FWHM) without wavefront correction, the spot quality is greatly improved with the AO system and the spot size is ${\sim}10~\unicode[STIX]{x03BC}\text{m}$
(FWHM) (see Figure 19(a)), which is measured by a beam analysis silicon CCD camera (SP620U Spiricon). For this condition, the calculated intensity is up to
${\sim}10~\unicode[STIX]{x03BC}\text{m}$
(FWHM) (see Figure 19(a)), which is measured by a beam analysis silicon CCD camera (SP620U Spiricon). For this condition, the calculated intensity is up to $10^{21}~\text{W}\cdot \text{cm}^{-2}$
at the focal spot with a compressed pulse of 1.76 PW. The SG-II 5PW facility provides 13 shots for high energy physics experiments, and the laser proton acceleration is on average
$10^{21}~\text{W}\cdot \text{cm}^{-2}$
at the focal spot with a compressed pulse of 1.76 PW. The SG-II 5PW facility provides 13 shots for high energy physics experiments, and the laser proton acceleration is on average ${>}7~\text{MeV}$
, which is maximized to
${>}7~\text{MeV}$
, which is maximized to ${>}10~\text{MeV}$
for a
${>}10~\text{MeV}$
for a $10~\unicode[STIX]{x03BC}\text{m}$
copper target. The experimental results when radio-chromic film (RCF) interacted with the accelerated protons indicate that the intensity on the target is up to
$10~\unicode[STIX]{x03BC}\text{m}$
copper target. The experimental results when radio-chromic film (RCF) interacted with the accelerated protons indicate that the intensity on the target is up to $1{-}5\times 10^{19}~\text{W}\cdot \text{cm}^{-2}$
, approximately two orders of magnitude lower than the calculated value of
$1{-}5\times 10^{19}~\text{W}\cdot \text{cm}^{-2}$
, approximately two orders of magnitude lower than the calculated value of $10^{21}~\text{W}\cdot \text{cm}^{-2}$
[Reference Kar, Ahmed, Prasad, Cerchez, Brauckmann, Aurand, Cantono, Hadjisolomou, Lewis, Macchi, Nersisyan, Robinson, Schroer, Swantusch, Zepf, Willi and Borghesi41, Reference Macchi, Borghesi and Passoni42].
$10^{21}~\text{W}\cdot \text{cm}^{-2}$
[Reference Kar, Ahmed, Prasad, Cerchez, Brauckmann, Aurand, Cantono, Hadjisolomou, Lewis, Macchi, Nersisyan, Robinson, Schroer, Swantusch, Zepf, Willi and Borghesi41, Reference Macchi, Borghesi and Passoni42].
After the AO correction, (a) the focal spot of the unamplified signal pulse imaged by a CCD and (b) that of the high energy pulse imaged by an X-ray pinhole camera.

The distinction between the calculated intensity and real intensity that is indicated by laser proton acceleration, results from two possible issues. First, the focal spot shown in Figure 19(b), when parametric amplifiers are on operation, is larger than that shown in Figure 19(a). Figure 19(b) imaged online by an X-ray pinhole camera, is a bit saturated and it proves that the focal spot size at the target when OPAs are operating is smaller than $60~\unicode[STIX]{x03BC}\text{m}$
in diameter. We believe that the decrease of the intensity at the target is mainly due to the optical path drift, which is caused by the vacuum chamber deformation. The OAP’s focal performance is very sensitive to the drift. In order to analyze the focal characteristics, a numerical model based on a three-dimensional (3D) ray tracing is developed (Figure 20). The simulations show that the focal spot size increases by approximately
$60~\unicode[STIX]{x03BC}\text{m}$
in diameter. We believe that the decrease of the intensity at the target is mainly due to the optical path drift, which is caused by the vacuum chamber deformation. The OAP’s focal performance is very sensitive to the drift. In order to analyze the focal characteristics, a numerical model based on a three-dimensional (3D) ray tracing is developed (Figure 20). The simulations show that the focal spot size increases by approximately $1~\unicode[STIX]{x03BC}\text{m}$
when the angular deviation of the incident light and OAP is
$1~\unicode[STIX]{x03BC}\text{m}$
when the angular deviation of the incident light and OAP is $5~\unicode[STIX]{x03BC}\text{rad}$
or when there is a
$5~\unicode[STIX]{x03BC}\text{rad}$
or when there is a $2~\unicode[STIX]{x03BC}\text{m}$
deviation from the focal plane. Therefore, the angular and focal plane deviations should be less than
$2~\unicode[STIX]{x03BC}\text{m}$
deviation from the focal plane. Therefore, the angular and focal plane deviations should be less than $25~\unicode[STIX]{x03BC}\text{rad}$
and
$25~\unicode[STIX]{x03BC}\text{rad}$
and $10~\unicode[STIX]{x03BC}\text{m}$
in practice. Developing methods to improve the adjustment precision of OAP in the vacuum chamber is a subject of the future work. Second, the contrast at the focal spot should be further improved to values larger than
$10~\unicode[STIX]{x03BC}\text{m}$
in practice. Developing methods to improve the adjustment precision of OAP in the vacuum chamber is a subject of the future work. Second, the contrast at the focal spot should be further improved to values larger than $10^{8}$
.
$10^{8}$
.
(a) 3D ray tracing of OAP; focal spot size increase (b) as a function of the angular deviation of the incident light and (c) as a function of the deviation from the focal plane.

4 Conclusion
In this paper, we presented the current performance of the SG-II 5PW facility fully based on OPCPA in the nanosecond domain. The prior two optical parametric amplifiers have realized a chirped-pulse energy of 49.7 J and a spectrum bandwidth up to 85 nm. In the PW-scale OPA, the pump-to-signal conversion efficiency is 41.9%, which is the highest among all reported values for OPCPA systems. For the first time, we reported duration and contrast measurements with the whole beam diameter for PW-class facilities. It was demonstrated that the peak power of the compressed pulse is higher than 1.76 PW (37 J/21 fs). The static focal spot was ${\sim}10~\unicode[STIX]{x03BC}\text{m}$
after the closed-loop correction performed by the AO. The SG-II 5PW facility has succeeded in providing 13 shots for high energy physics experiments. In addition, laser proton acceleration was achieved. This indicates that the effective focused intensity for experiments has exceeded
${\sim}10~\unicode[STIX]{x03BC}\text{m}$
after the closed-loop correction performed by the AO. The SG-II 5PW facility has succeeded in providing 13 shots for high energy physics experiments. In addition, laser proton acceleration was achieved. This indicates that the effective focused intensity for experiments has exceeded $10^{19}~\text{W}\,\cdot \,\text{cm}^{-2}$
and the contrast was not severely degenerated at the focal spot. In the future, both of the focusing characteristic and contrast are big issues for the whole system. The OPA-III to realize 5 PW now is under construction. The large-aperture LBO is preferred as the gain media, while DKDP of high level deuteration is an alternative proposal.
$10^{19}~\text{W}\,\cdot \,\text{cm}^{-2}$
and the contrast was not severely degenerated at the focal spot. In the future, both of the focusing characteristic and contrast are big issues for the whole system. The OPA-III to realize 5 PW now is under construction. The large-aperture LBO is preferred as the gain media, while DKDP of high level deuteration is an alternative proposal.
Acknowledgements
M. Sun, J. Kang, Q. Yang, A. Guo and H. Zhu contributed equally to this work. We appreciate all colleagues for their contributions to the development of the SG-II 5PW facility. We thank Xiaochao Wang and Hui Wei for the synchronization system and front end pump laser, D. Liu and P. Zeng for the collimation system and structure cabling, X. Ouyang and S. Tang for the measurement system, Z. Liu, Z. Zhang, K. Gu and J. Miao for the SG-II facility operation, X. Jiang and D. Liu for the SHG and Z. Yang for the discussions about AO. This work was partially supported by the National Natural Science Foundation of China (NSFC) (Nos. 11304332, 11704392, and 61705245) and the Key Projects of International Cooperation in Chinese Academy of Sciences.


 Open access