





1. Introduction
Commercially viable stellarator reactors must have an exhaust solution, that is, the steady flow of heat and particles expelled from the confined region must be adequately managed. There are several requirements, for example: (i) helium ash and other impurities must be removed to avoid core dilution and excessive core radiation; (ii) plasma-facing components (PFCs) should not be thermally overloaded; (iii) the plasma temperature at the PFCs should be sufficiently low to avoid sputtering (Burnett et al. Reference Burnett, Grove, Stix and Wakefield1958; König et al. Reference König2002; Gates et al. Reference Gates2018). The magnetic field in the stellarator edge plays an essential role in determining exhaust performance. Wendelstein 7-X (W7-X) is designed for an island divertor (Renner et al. Reference Renner, Sharma, Kisslinger, Boscary, Grote and Schneider2004), currently the most well-understood stellarator divertor concept and often used in stellarator reactor designs (Bader et al. Reference Bader2025; Lion et al. Reference Lion2025; Goodman Reference Goodmann.d., Submitted JPP). The island divertor relies on a magnetic island chain with a low-order rational rotational transform $\iota$
to divert the plasma. How the electromagnetic coils of W7-X influence its island chain(s) is the focus of this work. We therefore first describe the coil arrangement in W7-X.
$\iota$
to divert the plasma. How the electromagnetic coils of W7-X influence its island chain(s) is the focus of this work. We therefore first describe the coil arrangement in W7-X.
There are two properties that stellarators (including W7-X) use to reduce the number of unique coil geometries they require and thus simplify their construction. The first is field periodicity: stellarators are constructed such that the field repeats itself $n_{{\!fp}}$
times in
$n_{{\!fp}}$
times in $\phi$
(using a cylindrical
$\phi$
(using a cylindrical $(R, \phi , Z)$
coordinate system where
$(R, \phi , Z)$
coordinate system where $\phi$
is the toroidal angle) with a period
$\phi$
is the toroidal angle) with a period $2\pi /n_{{\!fp}}\;(=72^\circ$
for W7-X since
$2\pi /n_{{\!fp}}\;(=72^\circ$
for W7-X since $n_{{\!fp}}=5$
). Fewer unique coil geometries are required, they can just be copied and placed in their respective field periods. The second reduction is stellarator symmetry (Dewar & Hudson Reference Dewar and Hudson1998). This implies that the magnetic field adheres to the relation
$n_{{\!fp}}=5$
). Fewer unique coil geometries are required, they can just be copied and placed in their respective field periods. The second reduction is stellarator symmetry (Dewar & Hudson Reference Dewar and Hudson1998). This implies that the magnetic field adheres to the relation $(B_R, B_\phi , B_Z) (R,\phi , Z) = (-B_R, B_\phi , B_Z) (R, -\phi , -Z)$
. This puts a strong relation between the coils at
$(B_R, B_\phi , B_Z) (R,\phi , Z) = (-B_R, B_\phi , B_Z) (R, -\phi , -Z)$
. This puts a strong relation between the coils at $\phi \gt 0$
and
$\phi \gt 0$
and $\phi \lt 0$
, which comes down to copying the coil at angle
$\phi \lt 0$
, which comes down to copying the coil at angle $+\phi$
to
$+\phi$
to $-\phi$
, rotating it upside-down and changing the direction of the current. This further halves the number of unique coil geometries. Because of field periodicity, the coils at
$-\phi$
, rotating it upside-down and changing the direction of the current. This further halves the number of unique coil geometries. Because of field periodicity, the coils at $\phi \lt 0$
re-appear in the second half of the field period and stellarator symmetry implies the existence of a second symmetry plane halfway through the field period
$\phi \lt 0$
re-appear in the second half of the field period and stellarator symmetry implies the existence of a second symmetry plane halfway through the field period $\phi =\pi /n_{{\!fp}}$
(
$\phi =\pi /n_{{\!fp}}$
( $=\!36^\circ$
for W7-X).
$=\!36^\circ$
for W7-X).
W7-X has four varieties of electromagnetic coil (Bozhenkov et al. Reference Bozhenkov, Lazerson, Otte, Gates, Pedersen and Wolf2016; Andreeva et al. Reference Andreeva2022), the first three of which are stellarator-symmetric and are shown in figure 1: (i) five unique ‘non-planar’ coil geometries, numbered 1–5 (referred to here as ‘NPC 1’, etc.); (ii) two unique ‘planar’ coils, labelled ‘A’ and ‘B’ (‘PC A’, ‘PC B’); (iii) one unique ‘control’ (‘CC’, also called ‘sweep’) coil, which is close to the plasma (within the vacuum vessel) and carries a relatively small current; (iv) ‘trim’ coils, which obey field periodicity but not stellarator symmetry. These are furthest from the plasma and intended to only correct error fields.
Top-down view of W7-X for the ‘standard configuration’. The boundary of the confined plasma is shown as a yellow surface and coils as black lines, with the coils of one field period shown bold and coloured (each unique coil geometry having its own colour and appearing twice in the field period). The magnetic axis is shown as a red line, and the X- and O-points of the edge island chain are shown as dark and light green lines, respectively.

The currents in each unique non-planar and planar coil can be independently adjusted (although for each unique coil geometry, the currents in their periodic and stellarator-symmetric copies must be the same) and each control and trim coil is independently powered. This enables a large range of unique magnetic configurations and hence a variety of magnetic topologies in the edge. In this work, we do not consider trim coils. We also assume that the magnetic field adheres strictly to field periodicity and stellarator symmetry (so that all the control coils carry the same current), although small symmetry-breaking error fields can arise naturally or be deliberately introduced in experiment (Bozhenkov et al. Reference Bozhenkov2018).
Three paradigmatic W7-X configurations are the ‘standard’, ‘high iota’ and ‘low iota’ configurations. The standard configuration has an $\iota =m/n=5/5$
island chain in the edge (where
$\iota =m/n=5/5$
island chain in the edge (where $m$
and
$m$
and $n$
are the toroidal and poloidal periodicities of the island chain) which intersects the divertor plates, as shown in figure 2. The high iota configuration has an edge
$n$
are the toroidal and poloidal periodicities of the island chain) which intersects the divertor plates, as shown in figure 2. The high iota configuration has an edge $\iota =m/n=5/4$
island chain and low iota has an edge
$\iota =m/n=5/4$
island chain and low iota has an edge $\iota =m/n=5/6$
island chain, shown in figure 3. A standard approach to model these island chains is as a resonant magnetic perturbation of a hypothetical set of unperturbed nested flux surfaces (Bozhenkov et al. Reference Bozhenkov, Geiger, Grahl, Kisslinger, Werner and Wolf2013, Reference Bozhenkov, Lazerson, Otte, Gates, Pedersen and Wolf2016). Simple island models exist (Feng et al. Reference Feng2022) describing the relationship between island parameters (e.g. island width) and properties of the unperturbed surfaces (such as the magnetic shear) and the resonant perturbations.
$\iota =m/n=5/6$
island chain, shown in figure 3. A standard approach to model these island chains is as a resonant magnetic perturbation of a hypothetical set of unperturbed nested flux surfaces (Bozhenkov et al. Reference Bozhenkov, Geiger, Grahl, Kisslinger, Werner and Wolf2013, Reference Bozhenkov, Lazerson, Otte, Gates, Pedersen and Wolf2016). Simple island models exist (Feng et al. Reference Feng2022) describing the relationship between island parameters (e.g. island width) and properties of the unperturbed surfaces (such as the magnetic shear) and the resonant perturbations.
Poincaré plots for the ‘standard’ configuration at several toroidal locations, also showing the magnetic axis and edge $\iota =1$
X- and O-points. The X-point and O-point in the midplane (
$\iota =1$
X- and O-points. The X-point and O-point in the midplane ( $Z=0$
) at
$Z=0$
) at $\phi =36^\circ$
are shown by larger markers (blue and orange) to illustrate their motion.
$\phi =36^\circ$
are shown by larger markers (blue and orange) to illustrate their motion.

Poincaré plots for the ‘high iota’ (upper row) and ‘low iota’ (lower row) configurations at $\phi =36^\circ$
(left) and
$\phi =36^\circ$
(left) and $\phi =0^\circ$
(right).
$\phi =0^\circ$
(right).

The role of coils on W7-X magnetic configurations and edge structures has been widely reported (e.g. Andreeva et al. Reference Andreeva2022) and can be summarised as follows: (i) non-planar coils are responsible for the plasma shaping and generating the rotational transform $\iota$
, and also control the mirror ratio; (ii) the planar coils can add/remove a toroidal magnetic field and vertical magnetic field, with the former shifting the
$\iota$
, and also control the mirror ratio; (ii) the planar coils can add/remove a toroidal magnetic field and vertical magnetic field, with the former shifting the $\iota$
profile up/down and the latter shifting the flux surfaces inwards/outwards (i.e. to larger/smaller major radius); (iii) the control coil can control the island size and phase of edge magnetic islands. This work seeks to quantify these effects over the operational space of W7-X and to describe coil–island relationships beyond these principal roles.
$\iota$
profile up/down and the latter shifting the flux surfaces inwards/outwards (i.e. to larger/smaller major radius); (iii) the control coil can control the island size and phase of edge magnetic islands. This work seeks to quantify these effects over the operational space of W7-X and to describe coil–island relationships beyond these principal roles.
Our focus is on fixed points of the field line map, most often X-points and O-points. Island chains consist of X-points and O-points, and are therefore well-characterised by this technique. The main difference between our approach and the ‘resonant perturbation model’ is that we do not require the calculation of unperturbed nested surfaces (which, in general, is not trivial and solutions are non-unique). Here, we only consider vacuum fields (the contribution of the plasma current is neglected), although plasma-generated fields have been shown to affect edge structures (Gao et al. Reference Gao2019; Killer et al. Reference Killer2019; Knieps et al. Reference Knieps2021; Zhou et al. Reference Zhou2022).
This work is organised as followed. We first (§ 2) introduce theory relating to fixed points, in particular, we introduce the Jacobian $\boldsymbol{M}$
of the field line map at a fixed point. In § 3, we describe our fast automated scheme. We then perform two sets of coil current scans. The first, described in § 4, is a one-dimensional (1-D) scan in each of the coils, taking the standard, high and low iota configurations as starting points. The second is a large scan of different combinations of coil currents. Section 5 presents an overview of the the large scan and we explore three phenomena: the role of the planar coils in determining location and periodicity of fixed points (§ 5.1), the role of the control coil in modifying fixed point properties (§ 5.2) and variation in the size of internal island chains (§ 5.3). Conclusions and outlook is presented in § 6.
$\boldsymbol{M}$
of the field line map at a fixed point. In § 3, we describe our fast automated scheme. We then perform two sets of coil current scans. The first, described in § 4, is a one-dimensional (1-D) scan in each of the coils, taking the standard, high and low iota configurations as starting points. The second is a large scan of different combinations of coil currents. Section 5 presents an overview of the the large scan and we explore three phenomena: the role of the planar coils in determining location and periodicity of fixed points (§ 5.1), the role of the control coil in modifying fixed point properties (§ 5.2) and variation in the size of internal island chains (§ 5.3). Conclusions and outlook is presented in § 6.
2. Relevant topological theory
Analysis of the field in a stellarator often starts by studying trajectories of magnetic field lines. A common approach is to select a Poincaré section [usually a plane of constant toroidal angle $\phi$
(using a cylindrical
$\phi$
(using a cylindrical $(R, \phi , Z)$
coordinate system)] and to follow magnetic field lines starting from a point
$(R, \phi , Z)$
coordinate system)] and to follow magnetic field lines starting from a point $(R,Z)$
on the plane as they go around the device, noting each time the location
$(R,Z)$
on the plane as they go around the device, noting each time the location $(R',Z')$
where that field line returns to the same plane. This also defines the Poincaré return map
$(R',Z')$
where that field line returns to the same plane. This also defines the Poincaré return map $f^n: (R, Z)\rightarrow (R', Z')$
, which is the map defined by going
$f^n: (R, Z)\rightarrow (R', Z')$
, which is the map defined by going $n$
times toroidally around the device. A Poincaré plot is constructed by calculating the trajectories of dozens of field lines, for hundreds or thousands of toroidal transits around the device, and often illustrates well the structure of the magnetic field (Poincaré Reference Poincaré1893).
$n$
times toroidally around the device. A Poincaré plot is constructed by calculating the trajectories of dozens of field lines, for hundreds or thousands of toroidal transits around the device, and often illustrates well the structure of the magnetic field (Poincaré Reference Poincaré1893).
Field periodicity and stellarator symmetry enable faster computation of Poincaré plots. Field periodicity implies that every plane separated by $2\pi /n_{\!fp}$
is identical and, therefore, that we can construct a Poincaré plot by iterating over the
$2\pi /n_{\!fp}$
is identical and, therefore, that we can construct a Poincaré plot by iterating over the $f^{1/n_{{\!fp}}}$
map. In addition, stellarator symmetry implies that the trajectory of a field line
$f^{1/n_{{\!fp}}}$
map. In addition, stellarator symmetry implies that the trajectory of a field line $(R(\phi ), Z(\phi ))$
, started at
$(R(\phi ), Z(\phi ))$
, started at $(R_0, 0, Z_0)$
and followed in the positive
$(R_0, 0, Z_0)$
and followed in the positive $\phi$
direction, is related to the trajectory of a field line
$\phi$
direction, is related to the trajectory of a field line $(R'(\phi ), Z'(\phi ))$
started at
$(R'(\phi ), Z'(\phi ))$
started at $(R_0, 0, -Z_0)$
as follows:
$(R_0, 0, -Z_0)$
as follows: $(R'(-\phi ), Z'(-\phi )) = (R(\phi ), -Z(\phi ))$
. A consequence is that Poincaré plots in the first half-field period are related to those in the second half-field period by a flip in the
$(R'(-\phi ), Z'(-\phi )) = (R(\phi ), -Z(\phi ))$
. A consequence is that Poincaré plots in the first half-field period are related to those in the second half-field period by a flip in the $Z=0$
plane and are symmetric about
$Z=0$
plane and are symmetric about $Z=0$
at the symmetry planes. Thus, for strictly stellarator symmetric magnetic fields, all the unique information of a configuration can be presented by Poincaré plots between the first two symmetry planes (one half-field period e.g. between
$Z=0$
at the symmetry planes. Thus, for strictly stellarator symmetric magnetic fields, all the unique information of a configuration can be presented by Poincaré plots between the first two symmetry planes (one half-field period e.g. between $\phi =0$
and
$\phi =0$
and $\phi =36^\circ$
for W7-X).
$\phi =36^\circ$
for W7-X).
A Poincaré map $f$
may contain special points, which are fixed, such that
$f$
may contain special points, which are fixed, such that $f^{n_{\mathrm{(fixed\, point)}}/n_{{\!fp}}}(R,Z) = (R,Z)$
. Such a field line returns to the same location after
$f^{n_{\mathrm{(fixed\, point)}}/n_{{\!fp}}}(R,Z) = (R,Z)$
. Such a field line returns to the same location after $n_{\mathrm{(fixed\, point)}}$
field periods (
$n_{\mathrm{(fixed\, point)}}$
field periods ( $n_{\mathrm{(fixed\, point)}}/n_{{\!fp}}$
toroidal turns) and is thus a closed field line. The magnetic axis is an example. It returns to the same
$n_{\mathrm{(fixed\, point)}}/n_{{\!fp}}$
toroidal turns) and is thus a closed field line. The magnetic axis is an example. It returns to the same $(R,Z)$
every period and closes on itself after a full toroidal turn. Island chains contain fixed points, which return after multiple field periods. The
$(R,Z)$
every period and closes on itself after a full toroidal turn. Island chains contain fixed points, which return after multiple field periods. The $5/5$
island chain of the standard configuration of W7-X contains
$5/5$
island chain of the standard configuration of W7-X contains $n_{{(fixed point)}}=5$
fixed points, and the
$n_{{(fixed point)}}=5$
fixed points, and the $5/4$
and a
$5/4$
and a $5/6$
chains contain
$5/6$
chains contain $n_{{(fixed point)}}=4$
and
$n_{{(fixed point)}}=4$
and $n_{{(fixed point)}}=6$
fixed points, respectively.
$n_{{(fixed point)}}=6$
fixed points, respectively.
The behaviour of field lines near a fixed point at $\boldsymbol{x}_0$
can be understood from linearising the field line map around
$\boldsymbol{x}_0$
can be understood from linearising the field line map around $\boldsymbol{x}_0$
:
$\boldsymbol{x}_0$
:
 \begin{equation} f^n(\boldsymbol{x}_0+\delta \boldsymbol{x})= f^n(\boldsymbol{x}_0)+ \boldsymbol{M}\boldsymbol{\cdot }\delta \boldsymbol{x}, \end{equation}
where $\text{M}$
(the Jacobian) is the linearised matrix of partial derivatives defined as
$\text{M}$
(the Jacobian) is the linearised matrix of partial derivatives defined as $M_{ij}=\partial _j f_i$
and
$M_{ij}=\partial _j f_i$
and $\delta \boldsymbol{x} = \boldsymbol{x}_i-\boldsymbol{x}_0$
is a small step. This can also be written as
$\delta \boldsymbol{x} = \boldsymbol{x}_i-\boldsymbol{x}_0$
is a small step. This can also be written as
 \begin{align} R_{\!f} &= R_0 + M_{11}(R_i-R_0) + M_{12}(Z_i-Z_0), \end{align}
 \begin{align} Z_f &= Z_0 + M_{21}(R_i-R_0) + M_{22}(Z_i-Z_0) , \end{align}
where $\boldsymbol{x\!}_f = (R_{\!f}, Z_f)$
is the location of a field line started at
$\boldsymbol{x\!}_f = (R_{\!f}, Z_f)$
is the location of a field line started at $\boldsymbol{x}_i=(R_i, Z_i)$
and traced
$\boldsymbol{x}_i=(R_i, Z_i)$
and traced $n_{\mathrm{(fixed\, point)}}$
field periods and
$n_{\mathrm{(fixed\, point)}}$
field periods and $\boldsymbol{x}_0 = (R_0, Z_0)$
. Since magnetic flux is preserved, the determinant of
$\boldsymbol{x}_0 = (R_0, Z_0)$
. Since magnetic flux is preserved, the determinant of $\text{M}$
is equal to
$\text{M}$
is equal to $1$
(Cary & Hanson Reference Cary and Hanson1986, Reference Cary and Hanson1991).
$1$
(Cary & Hanson Reference Cary and Hanson1986, Reference Cary and Hanson1991).
Here, $\text{M}$
encapsulates several properties of the fixed point (Cary & Hanson Reference Cary and Hanson1986, Reference Cary and Hanson1991; Smiet, Kramer & Hudson Reference Smiet, Kramer and Hudson2019). First,
$\text{M}$
encapsulates several properties of the fixed point (Cary & Hanson Reference Cary and Hanson1986, Reference Cary and Hanson1991; Smiet, Kramer & Hudson Reference Smiet, Kramer and Hudson2019). First, $\mathrm{Tr}(\text{M}) = M_{11} + M_{22}$
determines the ‘flavour’ of the fixed point (e.g. X-point, O-point), according to the following rules:
$\mathrm{Tr}(\text{M}) = M_{11} + M_{22}$
determines the ‘flavour’ of the fixed point (e.g. X-point, O-point), according to the following rules:
-
(i) if $\mathrm{Tr}(\text{M}) \gt 2$
, the fixed point is an X-point;
$\mathrm{Tr}(\text{M}) \gt 2$
, the fixed point is an X-point; -
(ii) if
$2\gt \mathrm{Tr}(\text{M}) \gt -2$
, the fixed point is an O-point; -
(iii)
$\mathrm{Tr}(\text{M}) =2$
fixed points include (but are not limited to) points on intact rational surfaces; -
(iv) if
$\mathrm{Tr}(\text{M}) \lt -2$
, the fixed point is a ‘reflection hyperbolic fixed point’ (‘RH point’).




The last ‘flavour’, probably least familiar to the reader, can occur in W7-X; however, they appear near the coils and are typically inaccessible to the plasma [the plasma intersects the PFCs before interacting with the reflection hyperbolic (RH) point]. We therefore do not dwell on this phenomenon, but refer the reader to Lichtenberg et al. (Reference Lichtenberg, Lieberman, Lichtenberg and Lieberman1992), Meiss (Reference Meiss1992), Smiet, Kramer & Hudson (Reference Smiet, Kramer and Hudson2020), Smiet (Reference Smiet2025) and Davies et al. (Reference Davies, Smiet, Punjabi, Boozer and Henneberg2025).
For O-points, $\mathrm{Tr}(\text{M})$
is also related to the rotational transform around the fixed point with respect to the map according to
$\mathrm{Tr}(\text{M})$
is also related to the rotational transform around the fixed point with respect to the map according to $2\cos (2\pi \iota ) = \mathrm{Tr}(\text{M})$
. For X-points, nearby field lines asymptotically approach or are exponentially repelled as the field lines are followed in the positive toroidal direction. The directions of attraction/repulsion are given by the ‘stable’/‘unstable’ eigenvectors
$2\cos (2\pi \iota ) = \mathrm{Tr}(\text{M})$
. For X-points, nearby field lines asymptotically approach or are exponentially repelled as the field lines are followed in the positive toroidal direction. The directions of attraction/repulsion are given by the ‘stable’/‘unstable’ eigenvectors $\boldsymbol{v}_{\mathrm{stable}}, \boldsymbol{v}_{\mathrm{unstable}}$
of
$\boldsymbol{v}_{\mathrm{stable}}, \boldsymbol{v}_{\mathrm{unstable}}$
of $\text{M}$
and the eigenvalues
$\text{M}$
and the eigenvalues $\lambda _{\mathrm{stable}}, \lambda _{\mathrm{unstable}}$
describe the exponent of attraction/repulsion (related also to the Lyapunov exponent) (Wolf et al. Reference Wolf1986). If one instead follows field lines in the negative toroidal direction, the directions of attraction/repulsion are swapped (unstable/stable eigenvectors are the directions of attraction/repulsion, respectively). The eigenvectors of the fixed point are dependent on the position along the trajectory of the fixed point (i.e. they vary with
$\lambda _{\mathrm{stable}}, \lambda _{\mathrm{unstable}}$
describe the exponent of attraction/repulsion (related also to the Lyapunov exponent) (Wolf et al. Reference Wolf1986). If one instead follows field lines in the negative toroidal direction, the directions of attraction/repulsion are swapped (unstable/stable eigenvectors are the directions of attraction/repulsion, respectively). The eigenvectors of the fixed point are dependent on the position along the trajectory of the fixed point (i.e. they vary with $\phi$
), but the eigenvalues do not.
$\phi$
), but the eigenvalues do not.
The last concept we introduce is the stable/unstable manifolds of the X-point: the set of (infinitely many) magnetic field lines which asymptotically approach the X-point when followed in the positive/negative toroidal direction. Near to the X-point, these lie along the stable/unstable eigenvectors. The manifolds tend to act as transport pathways for the plasma; for island divertors with negligible chaos (such as the W7-X standard configuration), the manifolds form the island ‘separatrix’, which diverts heat and particles away from the confined region. Of course, since the plasma can be transported in either direction along field lines, heat and particles are agnostic to whether a manifold is stable or unstable; ‘stable’ and ‘unstable’ should be understood as labels relating to a toroidal direction in which magnetic field lines approach a given X-point rather than as physically distinct concepts.
3. Description of the scheme
We begin by finding the magnetic axis. We use a root finder to locate $(dR,dZ)=(R_{\!f}-R_0, Z_f-Z_0)=(0,0)$
points for the one field period map. For the initial guess we sample
$(dR,dZ)=(R_{\!f}-R_0, Z_f-Z_0)=(0,0)$
points for the one field period map. For the initial guess we sample $N_{\mathrm{sample}}=101$
points along
$N_{\mathrm{sample}}=101$
points along $Z=0$
at
$Z=0$
at $\phi =36^\circ$
(between
$\phi =36^\circ$
(between $R_{\mathrm{min}}=435\,\text{cm}$
and
$R_{\mathrm{min}}=435\,\text{cm}$
and $R_{\mathrm{max}}=635\,\text{cm}$
), trace for one field period and select the (
$R_{\mathrm{max}}=635\,\text{cm}$
), trace for one field period and select the ( $R,Z$
) point with smallest (
$R,Z$
) point with smallest ( $dR^2+dZ^2$
). We calculate
$dR^2+dZ^2$
). We calculate $\text{M}$
by tracing a set of nearby points and fitting
$\text{M}$
by tracing a set of nearby points and fitting $\{R_i, Z_i\}$
and
$\{R_i, Z_i\}$
and $\{R_{\!f}, Z_f\}$
to (2.2) and (2.3) (see Appendix A for more detail). This is not the only method by which
$\{R_{\!f}, Z_f\}$
to (2.2) and (2.3) (see Appendix A for more detail). This is not the only method by which $\text{M}$
can be calculated, and it is arguably inelegant since it requires sampling field lines around the fixed point and using finite-difference-like methods. One alternative, if the derivatives of
$\text{M}$
can be calculated, and it is arguably inelegant since it requires sampling field lines around the fixed point and using finite-difference-like methods. One alternative, if the derivatives of $\boldsymbol{B}$
along the trajectory are known, is to use the scheme presented by Cary & Hanson (Reference Cary and Hanson1991). This is more efficient since it only requires integration along the periodic orbit. A similar approach is implemented in the python package pyoculus (Rais et al. Reference Rais, Smiet, Qu and Hudson2025) (Smiet et al. Reference Smiet, Rais, Loizu and Davies2025; https://github.com/zhisong/pyoculus Reference Goodmann.d.). Although we do not use these approaches here (and thus we only require field line tracing and not magnetic field derivatives), implementing these approaches may further improve the speed and accuracy of our algorithm.
$\boldsymbol{B}$
along the trajectory are known, is to use the scheme presented by Cary & Hanson (Reference Cary and Hanson1991). This is more efficient since it only requires integration along the periodic orbit. A similar approach is implemented in the python package pyoculus (Rais et al. Reference Rais, Smiet, Qu and Hudson2025) (Smiet et al. Reference Smiet, Rais, Loizu and Davies2025; https://github.com/zhisong/pyoculus Reference Goodmann.d.). Although we do not use these approaches here (and thus we only require field line tracing and not magnetic field derivatives), implementing these approaches may further improve the speed and accuracy of our algorithm.
We then seek fixed points with periodicities $n_{\mathrm{(fixed\, point)}}=4,5,6$
i.e.
$n_{\mathrm{(fixed\, point)}}=4,5,6$
i.e. $(\text{d}R,\text{d}Z)=(0,0)$
under the
$(\text{d}R,\text{d}Z)=(0,0)$
under the $n_{\mathrm{(fixed\, point)}}$
field period map. We make multiple attempts using
$n_{\mathrm{(fixed\, point)}}$
field period map. We make multiple attempts using $N_{\mathrm{scan}}=10$
points spaced along
$N_{\mathrm{scan}}=10$
points spaced along $Z=0$
(from
$Z=0$
(from $R_{\mathrm{min}}$
to
$R_{\mathrm{min}}$
to $R_{\mathrm{max}}$
, see before for values) in
$R_{\mathrm{max}}$
, see before for values) in $\phi =36^\circ$
as starting points. Having found up to
$\phi =36^\circ$
as starting points. Having found up to $N_{\mathrm{scan}}$
fixed points, we remove duplicates, resulting in between
$N_{\mathrm{scan}}$
fixed points, we remove duplicates, resulting in between $0$
and
$0$
and $N_{\mathrm{scan}}$
unique fixed points in addition to the axis.
$N_{\mathrm{scan}}$
unique fixed points in addition to the axis.
If we have only found one unique fixed point in addition to the magnetic axis, it is likely that an island chain exists, but the fixed point on the $\phi =36^\circ$
outboard midplane is the same as that on the inboard midplane (for example, the high and low iota configurations, see figure 3). In this case, we repeat the fixed point-finding scheme at
$\phi =36^\circ$
outboard midplane is the same as that on the inboard midplane (for example, the high and low iota configurations, see figure 3). In this case, we repeat the fixed point-finding scheme at $\phi =0^\circ$
. Our approach is not guaranteed to find all fixed points, but it can be shown that for island chains, there must exist fixed points at
$\phi =0^\circ$
. Our approach is not guaranteed to find all fixed points, but it can be shown that for island chains, there must exist fixed points at $Z=0$
on both sides of the axis in both symmetry planes, and so at least some island fixed points are recovered. Then,
$Z=0$
on both sides of the axis in both symmetry planes, and so at least some island fixed points are recovered. Then, $\text{M}$
is calculated for each fixed point as for the magnetic axis.
$\text{M}$
is calculated for each fixed point as for the magnetic axis.
3.1. Implementation details using EMC3-Lite
The field line tracing is performed by EMC3-Lite (Feng et al. Reference Feng2022), which is interfaced via a Python ‘wrapper’. EMC3-Lite is a code designed for calculating PFC heat loads, but also includes a field line tracer which uses the Adams–Bashforth–Moulton fifth-order predictor–corrector scheme with fourth-order Runge–Kutta as the initial step. The magnetic field is calculated on a regular $(R,\phi ,Z)$
grid using EMC3-Lite‘s Biot–Savart solver.Footnote
1
$(R,\phi ,Z)$
grid using EMC3-Lite‘s Biot–Savart solver.Footnote
1
Two implementation details significantly speed up the calculations. First, the magnetic field generated by each independent coil is calculated only once. The magnetic field for a given set of currents is then calculated as a linear sum of coil contributions. Second, the field line tracer is interfaced with the Python wrapper using f2py, allowing the magnetic field grids to be stored in memory, rather than reading the magnetic field from a file each time the field line tracer is called.
4. Results of 1-D scans
We first perform a series of 1-D scans using standard, high iota and low iota as starting points, by varying the current in each coil separately. The coil current $I_{{X}}$
reported here is the filament (i.e. total) current in coil X, equal to the winding current multiplied by the number of windings for the coil (which is
$I_{{X}}$
reported here is the filament (i.e. total) current in coil X, equal to the winding current multiplied by the number of windings for the coil (which is $108$
,
$108$
, $36$
and
$36$
and $8$
for the non-planar, planar and control, respectively). In other words, the coil winding current is varied between
$8$
for the non-planar, planar and control, respectively). In other words, the coil winding current is varied between $10.8$
and
$10.8$
and $14.54$
kA for the non-planar coils,
$14.54$
kA for the non-planar coils, $\pm 10.0$
kA for the planar coils and
$\pm 10.0$
kA for the planar coils and $\pm 2.5$
kA for the control coil. The scan with respect to standard is shown in figure 4. The
$\pm 2.5$
kA for the control coil. The scan with respect to standard is shown in figure 4. The $R$
location of magnetic axis at
$R$
location of magnetic axis at $\phi =36^\circ$
(labelled
$\phi =36^\circ$
(labelled $R_{\mathrm{MA}}$
) can be moved by around
$R_{\mathrm{MA}}$
) can be moved by around $10$
cm per planar coil and correlates with
$10$
cm per planar coil and correlates with $(I_{\mathrm{PCA}} - I_{\mathrm{PCB}})$
, and can also be moved by the non-planar coils by up to
$(I_{\mathrm{PCA}} - I_{\mathrm{PCB}})$
, and can also be moved by the non-planar coils by up to $4$
cm (panels a and b). Here,
$4$
cm (panels a and b). Here, $\iota _{\mathrm{MA}}$
correlates with
$\iota _{\mathrm{MA}}$
correlates with $(I_{\mathrm{PCA}} + I_{\mathrm{PCB}})$
, with the non-planar coil currents having a smaller impact (panel c). The control coil has virtually no effect on either
$(I_{\mathrm{PCA}} + I_{\mathrm{PCB}})$
, with the non-planar coil currents having a smaller impact (panel c). The control coil has virtually no effect on either $R_{\mathrm{MA}}$
(changing
$R_{\mathrm{MA}}$
(changing $R_{\mathrm{MA}}$
by a maximum of
$R_{\mathrm{MA}}$
by a maximum of $0.4$
cm) or
$0.4$
cm) or $\iota _{\mathrm{MA}}$
(causing a maximum change of
$\iota _{\mathrm{MA}}$
(causing a maximum change of $0.003$
).
$0.003$
).
Coil current scans with the standard configuration as the starting point. (a) Magnetic axis location at $\phi =36^\circ$
(
$\phi =36^\circ$
( $R_{\mathrm{MA}}$
) as planar coils (PC) are varied. (b)
$R_{\mathrm{MA}}$
) as planar coils (PC) are varied. (b) $R_{\mathrm{MA}}$
variation with non-planar coils (NPCs). (c) On-axis rotational transform
$R_{\mathrm{MA}}$
variation with non-planar coils (NPCs). (c) On-axis rotational transform $\iota _{\mathrm{MA}}$
against PC currents. The range of
$\iota _{\mathrm{MA}}$
against PC currents. The range of $\iota _{\mathrm{MA}}$
when NPC currents are scanned is shown as shaded yellow region. (d) Location of
$\iota _{\mathrm{MA}}$
when NPC currents are scanned is shown as shaded yellow region. (d) Location of $\phi =36^\circ$
outboard midplane fixed point
$\phi =36^\circ$
outboard midplane fixed point $R_{\mathrm{(fixed\, point)}}$
against PC currents, with NPC range shown as shaded yellow region and control coil (CC) range shown as shaded grey region. (e) Jacobian trace
$R_{\mathrm{(fixed\, point)}}$
against PC currents, with NPC range shown as shaded yellow region and control coil (CC) range shown as shaded grey region. (e) Jacobian trace $\mathrm{Tr}(\text{M})$
for the
$\mathrm{Tr}(\text{M})$
for the $\phi =36^\circ$
outboard midplane fixed point (solid lines) and the
$\phi =36^\circ$
outboard midplane fixed point (solid lines) and the $\phi =36^\circ$
inboard midplane fixed point (dashed line) against PC currents with NPC range shown in shaded yellow. (f)
$\phi =36^\circ$
inboard midplane fixed point (dashed line) against PC currents with NPC range shown in shaded yellow. (f) $\mathrm{Tr}(\text{M})$
against CC current for both fixed points.
$\mathrm{Tr}(\text{M})$
against CC current for both fixed points.

The variation in $R_{\mathrm{(fixed\, point)}}$
, the location of the fixed point on outboard midplane at
$R_{\mathrm{(fixed\, point)}}$
, the location of the fixed point on outboard midplane at $\phi =36^\circ$
, is greatest for the planar coils (up to
$\phi =36^\circ$
, is greatest for the planar coils (up to $60$
cm), followed by the non-planar coils (up to
$60$
cm), followed by the non-planar coils (up to $4$
cm), and very little for the control coil (up to
$4$
cm), and very little for the control coil (up to $1$
cm) (panel d). However, the control coil has the strongest influence on
$1$
cm) (panel d). However, the control coil has the strongest influence on $\mathrm{Tr}(\text{M})$
for the X-point (a variation of more than
$\mathrm{Tr}(\text{M})$
for the X-point (a variation of more than $3$
over the experimentally relevant range), sufficient to achieve an X-point
$3$
over the experimentally relevant range), sufficient to achieve an X-point $\rightarrow$
O-point transition (indicated by
$\rightarrow$
O-point transition (indicated by $\mathrm{Tr}(\text{M})$
crossing below 2 in panel f). Somewhat surprisingly, the O-point is far less affected by
$\mathrm{Tr}(\text{M})$
crossing below 2 in panel f). Somewhat surprisingly, the O-point is far less affected by $I_{\mathrm{CC}}$
.
$I_{\mathrm{CC}}$
.
Figure 5(a) shows the island chain as $I_{\mathrm{CC}}$
is scanned. The island separatrix (i.e. X-point manifolds) are calculated by sampling and tracing points along the eigenvectors of
$I_{\mathrm{CC}}$
is scanned. The island separatrix (i.e. X-point manifolds) are calculated by sampling and tracing points along the eigenvectors of $\mathsf{M}$
(see Appendix A for more information). Consistent with figure 4(f), the
$\mathsf{M}$
(see Appendix A for more information). Consistent with figure 4(f), the $5/5$
island chain transitions to a
$5/5$
island chain transitions to a $10/10$
chain, with an X
$10/10$
chain, with an X $\rightarrow$
O transition. Figure 5(b) shows the variation in island area (here referring to the area of the island with an X-point at the outboard midplane at
$\rightarrow$
O transition. Figure 5(b) shows the variation in island area (here referring to the area of the island with an X-point at the outboard midplane at $\phi =36^\circ$
, calculation described in Appendix B) as the transition is approached. As
$\phi =36^\circ$
, calculation described in Appendix B) as the transition is approached. As $\mathrm{Tr}(\text{M}) \rightarrow 2$
for the X-point, the island area decreases, but does not approach
$\mathrm{Tr}(\text{M}) \rightarrow 2$
for the X-point, the island area decreases, but does not approach $0$
.
$0$
.
(a) Poincaré plots, showing edge island chain as control coil current $I_{\mathrm{CC}}$
is scanned. (b) Island area and Jacobian trace
$I_{\mathrm{CC}}$
is scanned. (b) Island area and Jacobian trace $\mathrm{Tr}(\text{M})$
as a function of
$\mathrm{Tr}(\text{M})$
as a function of $I_{\mathrm{CC}}$
.
$I_{\mathrm{CC}}$
.

We repeat the coil current scans, starting from the high iota and low iota configurations, with selected results shown in figure 6. As in the ‘standard’ scan, the planar coils mostly determine the axis properties ( $R_{\mathrm{MA}}$
and
$R_{\mathrm{MA}}$
and $\iota _{\mathrm{MA}}$
) (
$\iota _{\mathrm{MA}}$
) ( $\iota _{\mathrm{MA}}$
variation shown in panels a and d) and the location of the fixed points
$\iota _{\mathrm{MA}}$
variation shown in panels a and d) and the location of the fixed points $R_{\mathrm{(fixed\, point)}}$
(panel b).
$R_{\mathrm{(fixed\, point)}}$
(panel b).
Coil currents scans with respect to the ‘high iota’ (panels a–c) and ‘low iota’ (panels d–f) configurations: (a, d) $\iota _{{MA}}$
against PC current; (b, e)
$\iota _{{MA}}$
against PC current; (b, e) $R_{\mathrm{(fixed\, point)}}$
against PC current with NPC and CC range shown as shaded areas; (c, f)
$R_{\mathrm{(fixed\, point)}}$
against PC current with NPC and CC range shown as shaded areas; (c, f) $\mathrm{Tr}(\text{M})$
for
$\mathrm{Tr}(\text{M})$
for $\phi =36^\circ$
outboard midplane fixed point (solid line) and
$\phi =36^\circ$
outboard midplane fixed point (solid line) and $\phi =0^\circ$
outboard midplane fixed point against CC current. NPC and PC ranges for
$\phi =0^\circ$
outboard midplane fixed point against CC current. NPC and PC ranges for $\phi =36^\circ$
outboard midplane fixed point shown as shaded areas.
$\phi =36^\circ$
outboard midplane fixed point shown as shaded areas.

However, several differences among the standard, high iota and low iota scans can be seen. For high iota, $\mathrm{Tr}(\text{M})$
(shown in panel c) is more affected by all coil types (non-planar, planar and control) than for standard; all coil types can create an X
$\mathrm{Tr}(\text{M})$
(shown in panel c) is more affected by all coil types (non-planar, planar and control) than for standard; all coil types can create an X $\rightarrow$
O transition for the fixed point on the
$\rightarrow$
O transition for the fixed point on the $\phi =36^\circ$
outboard midplane (i.e. a
$\phi =36^\circ$
outboard midplane (i.e. a $4/4 \rightarrow 8/8$
island chain transition). For low iota, the fixed points are less affected by all coil types than standard (panel f). Another difference is that
$4/4 \rightarrow 8/8$
island chain transition). For low iota, the fixed points are less affected by all coil types than standard (panel f). Another difference is that $\mathrm{Tr}(\mathsf{M})$
for the
$\mathrm{Tr}(\mathsf{M})$
for the $\phi =36^\circ$
outboard midplane fixed point increases with
$\phi =36^\circ$
outboard midplane fixed point increases with $I_{\mathrm{CC}}$
for high iota, the opposite trend to standard and low iota. Like standard, in low and high iota scans, we find that one fixed point in the island chain is more strongly affected by
$I_{\mathrm{CC}}$
for high iota, the opposite trend to standard and low iota. Like standard, in low and high iota scans, we find that one fixed point in the island chain is more strongly affected by $I_{\mathrm{CC}}$
than the other. For high iota, it is the
$I_{\mathrm{CC}}$
than the other. For high iota, it is the $\phi =36^\circ$
outboard midplane fixed point, but for low iota, it is the
$\phi =36^\circ$
outboard midplane fixed point, but for low iota, it is the $\phi =0^\circ$
outboard midplane fixed point. A final difference is that for high iota,
$\phi =0^\circ$
outboard midplane fixed point. A final difference is that for high iota, $I_{\mathrm{CC}}$
can cause much larger variations in
$I_{\mathrm{CC}}$
can cause much larger variations in $R_{\mathrm{(fixed \,point)}}$
than for standard or low iota (up to
$R_{\mathrm{(fixed \,point)}}$
than for standard or low iota (up to $8$
cm).
$8$
cm).
An obvious reason for differences between these scans is the distance of the edge fixed points to the coils. The change to the magnetic field resulting from changes in coil currents is larger when the coil-fixed point distance is smaller, which qualitatively explains why $\mathrm{Tr}(\text{M})$
variation is greatest for high iota (because
$\mathrm{Tr}(\text{M})$
variation is greatest for high iota (because $R_{\mathrm{(fixed\, point)}}$
is largest, i.e. the fixed points are closer to the coils) and smallest for low iota. Another difference is the differing
$R_{\mathrm{(fixed\, point)}}$
is largest, i.e. the fixed points are closer to the coils) and smallest for low iota. Another difference is the differing $\iota$
of the fixed points, which implies different trajectories for the fixed points. This might explain the differences in
$\iota$
of the fixed points, which implies different trajectories for the fixed points. This might explain the differences in $\mathrm{Tr}(\text{M}) (I_{\mathrm{CC}})$
trends, although we do not have a quantitative or predictive model for these variations.
$\mathrm{Tr}(\text{M}) (I_{\mathrm{CC}})$
trends, although we do not have a quantitative or predictive model for these variations.
5. Summary of the large scan
We analyse over $2.8\times 10^5$
different coil current combinations, with currents for each coil selected uniformly randomly within the prescribed range (see Appendix C for details). We perform the scan using a single CPU with an average computational cost of
$2.8\times 10^5$
different coil current combinations, with currents for each coil selected uniformly randomly within the prescribed range (see Appendix C for details). We perform the scan using a single CPU with an average computational cost of $0.26$
CPU-seconds per configuration.
$0.26$
CPU-seconds per configuration.
The magnetic axis location at $\phi =36^\circ$
as a function of
$\phi =36^\circ$
as a function of $(\tilde {I}_{\mathrm{PCA}}-\tilde {I}_{\mathrm{PCB}})$
(the parameter controlling inward/outward shift) is shown in figure 7. The tilde
$(\tilde {I}_{\mathrm{PCA}}-\tilde {I}_{\mathrm{PCB}})$
(the parameter controlling inward/outward shift) is shown in figure 7. The tilde $(\,\tilde {}\,)$
denotes normalised current, defined as
$(\,\tilde {}\,)$
denotes normalised current, defined as $\tilde {I}_X = I_X \boldsymbol{\cdot }5/(I_{\mathrm{NPC1}}+I_{\mathrm{NPC2}}+I_{\mathrm{NPC3}}+I_{\mathrm{NPC4}}+I_{\mathrm{NPC5}})$
for coil
$\tilde {I}_X = I_X \boldsymbol{\cdot }5/(I_{\mathrm{NPC1}}+I_{\mathrm{NPC2}}+I_{\mathrm{NPC3}}+I_{\mathrm{NPC4}}+I_{\mathrm{NPC5}})$
for coil $X$
, i.e. the coil current divided by the average NPC current.
$X$
, i.e. the coil current divided by the average NPC current. $R_{{MA}}$
spans the range
$R_{{MA}}$
spans the range $R=(505, 535\,\text{cm})$
and has a strong (approximately linear) correlation with
$R=(505, 535\,\text{cm})$
and has a strong (approximately linear) correlation with $(\tilde {I}_{\mathrm{PCA}}-\tilde {I}_{\mathrm{PCB}})$
. Additionally,
$(\tilde {I}_{\mathrm{PCA}}-\tilde {I}_{\mathrm{PCB}})$
. Additionally, $\iota _{\mathrm{MA}}$
(figure 7
b) strongly correlates with
$\iota _{\mathrm{MA}}$
(figure 7
b) strongly correlates with $(\tilde {I}_{\mathrm{PCA}}+\tilde {I}_{\mathrm{PCB}})$
and spans the range
$(\tilde {I}_{\mathrm{PCA}}+\tilde {I}_{\mathrm{PCB}})$
and spans the range $0.71$
–
$0.71$
– $1.07$
.
$1.07$
.
(a) On-axis rotational transform against normalised planar coil currents $(\tilde {I}_{\mathrm{PCA}}+\tilde {I}_{\mathrm{PCB}})$
. Currents normalised to mean non-planar coil current. (b) Location of magnetic axis at
$(\tilde {I}_{\mathrm{PCA}}+\tilde {I}_{\mathrm{PCB}})$
. Currents normalised to mean non-planar coil current. (b) Location of magnetic axis at $\phi =36^\circ$
against
$\phi =36^\circ$
against $(\tilde {I}_{\mathrm{PCA}}-\tilde {I}_{\mathrm{PCB}})$
.
$(\tilde {I}_{\mathrm{PCA}}-\tilde {I}_{\mathrm{PCB}})$
.

The $n_{\mathrm{(fixed\, point)}}=5$
fixed points are represented in figure 8. Ten distinct ‘bands’ can be seen, with O-, X- and RH-points present in each band. Fixed points living outside these bands (for example, the
$n_{\mathrm{(fixed\, point)}}=5$
fixed points are represented in figure 8. Ten distinct ‘bands’ can be seen, with O-, X- and RH-points present in each band. Fixed points living outside these bands (for example, the $20/20$
island chain) are possible, but would not be found by our algorithm. Here,
$20/20$
island chain) are possible, but would not be found by our algorithm. Here, $n_{\mathrm{(fixed\, point)}}=5$
fixed points are present at all minor radii (which is not the case for the
$n_{\mathrm{(fixed\, point)}}=5$
fixed points are present at all minor radii (which is not the case for the $n_{\mathrm{(fixed\, point)}}=4$
and
$n_{\mathrm{(fixed\, point)}}=4$
and $n_{\mathrm{(fixed\, point)}}=6$
).
$n_{\mathrm{(fixed\, point)}}=6$
).
(a) Illustration of all $n_{\mathrm{(fixed\, point)}}=5$
found in our large scan of coil currents. (b)
$n_{\mathrm{(fixed\, point)}}=5$
found in our large scan of coil currents. (b) $\mathrm{Tr}(\text{M})$
of all fixed points found in the large scan, plotted in ascending order.
$\mathrm{Tr}(\text{M})$
of all fixed points found in the large scan, plotted in ascending order.

The $\mathrm{Tr}(\text{M})$
for all edge fixed points found by our scheme is shown in figure 8(b). Here,
$\mathrm{Tr}(\text{M})$
for all edge fixed points found by our scheme is shown in figure 8(b). Here, $\mathrm{Tr}(\text{M})$
varies the most for the
$\mathrm{Tr}(\text{M})$
varies the most for the $n_{\mathrm{(fixed\, point)}}=4$
and least for
$n_{\mathrm{(fixed\, point)}}=4$
and least for $n_{\mathrm{(fixed\, point)}}=6$
; the middle
$n_{\mathrm{(fixed\, point)}}=6$
; the middle $80\,\%$
of points (i.e. between 0.1 and 0.9 in figure 8
b) spans the range
$80\,\%$
of points (i.e. between 0.1 and 0.9 in figure 8
b) spans the range $(0.58{-}3.20)$
,
$(0.58{-}3.20)$
, $(1.50{-}2.78)$
,
$(1.50{-}2.78)$
, $(1.94{-}2.05)$
for the
$(1.94{-}2.05)$
for the $n_{\mathrm{(fixed\, point)}}=4$
,
$n_{\mathrm{(fixed\, point)}}=4$
, $5$
and
$5$
and $6$
, respectively.
$6$
, respectively.
5.1. Role of planar coils
We loosely define three categories of fixed points, according to their spatial position: (i) ‘internal’ fixed points, defined as those for which $R\lt 590$
cm for the
$R\lt 590$
cm for the $\phi =36^\circ$
outboard midplane fixed point. These are likely to form internal island chains i.e. the island chains do not intersect PFCs; (ii) ‘divertor-relevant’ fixed points,
$\phi =36^\circ$
outboard midplane fixed point. These are likely to form internal island chains i.e. the island chains do not intersect PFCs; (ii) ‘divertor-relevant’ fixed points, $590\,\text{cm} \lt R \lt 620$
cm for the
$590\,\text{cm} \lt R \lt 620$
cm for the $\phi =36^\circ$
outboard midplane fixed point, which are likely to form PFC-intersecting island chains; (iii) ‘near-coil’ fixed points,
$\phi =36^\circ$
outboard midplane fixed point, which are likely to form PFC-intersecting island chains; (iii) ‘near-coil’ fixed points, $R\gt 620$
cm, which are less likely to have experimental relevance since the structures they form are likely to be shielded from the plasma by PFCs. We emphasise that this is a loose categorisation.
$R\gt 620$
cm, which are less likely to have experimental relevance since the structures they form are likely to be shielded from the plasma by PFCs. We emphasise that this is a loose categorisation.
The distribution of fixed points with respect to $(\tilde {I}_{\mathrm{PCA}} + \tilde {I}_{\mathrm{PCA}})$
and
$(\tilde {I}_{\mathrm{PCA}} + \tilde {I}_{\mathrm{PCA}})$
and $(\tilde {I}_{\mathrm{PCA}} - \tilde {I}_{\mathrm{PCA}})$
in these three categories are shown in figure 9. The overall shape of the phase space of
$(\tilde {I}_{\mathrm{PCA}} - \tilde {I}_{\mathrm{PCA}})$
in these three categories are shown in figure 9. The overall shape of the phase space of $(\tilde {I}_{\mathrm{PCA}} + \tilde {I}_{\mathrm{PCA}})$
and
$(\tilde {I}_{\mathrm{PCA}} + \tilde {I}_{\mathrm{PCA}})$
and $(\tilde {I}_{\mathrm{PCA}} - \tilde {I}_{\mathrm{PCA}})$
is a diamond. Within the diamond, fixed points of each periodicity have a well-defined position in phase space, mostly determined by
$(\tilde {I}_{\mathrm{PCA}} - \tilde {I}_{\mathrm{PCA}})$
is a diamond. Within the diamond, fixed points of each periodicity have a well-defined position in phase space, mostly determined by $(\tilde {I}_{\mathrm{PCA}} + \tilde {I}_{\mathrm{PCA}})$
. For ‘divertor-relevant’ fixed points, all three periodicities are present, with
$(\tilde {I}_{\mathrm{PCA}} + \tilde {I}_{\mathrm{PCA}})$
. For ‘divertor-relevant’ fixed points, all three periodicities are present, with $n_{\mathrm{(fixed\, point)}}=5$
points possible over the full range of
$n_{\mathrm{(fixed\, point)}}=5$
points possible over the full range of $(\tilde {I}_{\mathrm{PCA}} - \tilde {I}_{\mathrm{PCA}})$
. Only
$(\tilde {I}_{\mathrm{PCA}} - \tilde {I}_{\mathrm{PCA}})$
. Only $n_{\mathrm{(fixed\, point)}}=5$
and
$n_{\mathrm{(fixed\, point)}}=5$
and $6$
‘internal’ fixed points are possible with our selection of current limits and only
$6$
‘internal’ fixed points are possible with our selection of current limits and only $n_{\mathrm{(fixed\, point)}}=4$
and
$n_{\mathrm{(fixed\, point)}}=4$
and $5$
‘near coil’ fixed points are possible.
$5$
‘near coil’ fixed points are possible.
Fixed point occurrence as a function of planar coil currents, categorised by location of $\phi =36^\circ$
at outboard midplane fixed point. (a) ‘Internal’ fixed points. (b) ‘divertor-relevant’ fixed points. (c) ‘Near-coil’ fixed points.
$\phi =36^\circ$
at outboard midplane fixed point. (a) ‘Internal’ fixed points. (b) ‘divertor-relevant’ fixed points. (c) ‘Near-coil’ fixed points.

5.2. Role of control coil
The results of § 4 show that $\tilde {I}_{\mathrm{CC}}$
has a greater effect on
$\tilde {I}_{\mathrm{CC}}$
has a greater effect on $\mathrm{Tr}(\text{M})$
for fixed points located at larger minor radius, but also that
$\mathrm{Tr}(\text{M})$
for fixed points located at larger minor radius, but also that $\tilde {I}_{\mathrm{CC}}$
can unequally affect different fixed points in a single island chain. This is also borne out by our large scan. Figure 10(a–d) characterises
$\tilde {I}_{\mathrm{CC}}$
can unequally affect different fixed points in a single island chain. This is also borne out by our large scan. Figure 10(a–d) characterises $\mathrm{Tr}(\text{M}) (R, \tilde {I}_{\mathrm{CC}})$
for
$\mathrm{Tr}(\text{M}) (R, \tilde {I}_{\mathrm{CC}})$
for $n_{\mathrm{(fixed\, point)}}=5$
. The data are binned and we describe a given
$n_{\mathrm{(fixed\, point)}}=5$
. The data are binned and we describe a given $(R, \tilde {I}_{\mathrm{CC}})$
cell by a mean
$(R, \tilde {I}_{\mathrm{CC}})$
cell by a mean $\mathrm{Tr}(\text{M})$
(denoted
$\mathrm{Tr}(\text{M})$
(denoted $\langle \mathrm{Tr}(\text{M})\rangle$
), a standard deviation
$\langle \mathrm{Tr}(\text{M})\rangle$
), a standard deviation $\sigma _{\mathrm{Tr}(\text{M})}$
and a cell population
$\sigma _{\mathrm{Tr}(\text{M})}$
and a cell population $N$
. Figure 10(a) shows
$N$
. Figure 10(a) shows $\langle \mathrm{Tr}(\text{M})\rangle$
for
$\langle \mathrm{Tr}(\text{M})\rangle$
for $\phi =36^\circ$
outboard midplane fixed points. Within the ‘divertor relevant’ range (between the dashed and solid horizontal lines),
$\phi =36^\circ$
outboard midplane fixed points. Within the ‘divertor relevant’ range (between the dashed and solid horizontal lines), $\langle \mathrm{Tr}(\text{M})\rangle$
increases with
$\langle \mathrm{Tr}(\text{M})\rangle$
increases with $\tilde {I}_{{CC}}$
and the magnitude of
$\tilde {I}_{{CC}}$
and the magnitude of $(\langle \mathrm{Tr}(\text{M})\rangle -2 )$
increases with
$(\langle \mathrm{Tr}(\text{M})\rangle -2 )$
increases with $R_{\mathrm{(fixed\, point)}}$
. Here,
$R_{\mathrm{(fixed\, point)}}$
. Here, $\sigma _{\mathrm{Tr}(\mathsf{M})}$
increases with
$\sigma _{\mathrm{Tr}(\mathsf{M})}$
increases with $R_{\mathrm{(fixed\, point)}}$
(panel b), often exceeding 2 in the ‘near coil’ region. Panel (c) shows that
$R_{\mathrm{(fixed\, point)}}$
(panel b), often exceeding 2 in the ‘near coil’ region. Panel (c) shows that $n_{\mathrm{(fixed\, point)}}=5$
mostly occupy the ‘divertor-relevant’ range.
$n_{\mathrm{(fixed\, point)}}=5$
mostly occupy the ‘divertor-relevant’ range.
Statistics of $\mathrm{Tr}(\text{M})$
for fixed points against control coil current and
$\mathrm{Tr}(\text{M})$
for fixed points against control coil current and $R$
. (a, b, c)
$R$
. (a, b, c) $n_{\mathrm{(fixed\, point)}}=5$
,
$n_{\mathrm{(fixed\, point)}}=5$
, $\phi =36^\circ$
outboard midplane fixed points, showing (a)
$\phi =36^\circ$
outboard midplane fixed points, showing (a) $\langle \mathrm{Tr}(\text{M})\rangle$
, (b) standard deviation and (c) cell population (right) for binned data. (d, e, f)
$\langle \mathrm{Tr}(\text{M})\rangle$
, (b) standard deviation and (c) cell population (right) for binned data. (d, e, f) $\langle \mathrm{Tr}(\text{M})\rangle$
for (d)
$\langle \mathrm{Tr}(\text{M})\rangle$
for (d) $\phi =36^\circ$
inboard midplane
$\phi =36^\circ$
inboard midplane $n_{\mathrm{(fixed\, point)}}=5$
fixed points, (e)
$n_{\mathrm{(fixed\, point)}}=5$
fixed points, (e) $\phi =36^\circ$
outboard midplane
$\phi =36^\circ$
outboard midplane $n_{\mathrm{(fixed \,point)}}=4$
and (f)
$n_{\mathrm{(fixed \,point)}}=4$
and (f) $\phi =36^\circ$
outboard midplane
$\phi =36^\circ$
outboard midplane $n_{\mathrm{(fixed\, point)}}=6$
(right).
$n_{\mathrm{(fixed\, point)}}=6$
(right).

Figure 10(d) shows $\langle \mathrm{Tr}(\text{M})\rangle$
for the
$\langle \mathrm{Tr}(\text{M})\rangle$
for the $n_{\mathrm{(fixed\, point)}}=5$
on the
$n_{\mathrm{(fixed\, point)}}=5$
on the $\phi =36^\circ$
inboard midplane. As in § 4, there is little dependence of
$\phi =36^\circ$
inboard midplane. As in § 4, there is little dependence of $\mathrm{Tr}(\text{M})$
on
$\mathrm{Tr}(\text{M})$
on $\tilde {I}_{\mathrm{CC}}$
. Here,
$\tilde {I}_{\mathrm{CC}}$
. Here, $\vert (\langle \mathrm{Tr}(\text{M})\rangle -2 ) \vert$
increases with distance from the magnetic axis. A sharp bifurcation occurs around
$\vert (\langle \mathrm{Tr}(\text{M})\rangle -2 ) \vert$
increases with distance from the magnetic axis. A sharp bifurcation occurs around $R=455$
cm, with
$R=455$
cm, with $\vert (\langle \mathrm{Tr}(\text{M})\rangle -2 ) \vert$
becoming large and negative. This bifurcation is curious, but is likely to be in the ‘near-coil’ region and is not explored here.
$\vert (\langle \mathrm{Tr}(\text{M})\rangle -2 ) \vert$
becoming large and negative. This bifurcation is curious, but is likely to be in the ‘near-coil’ region and is not explored here.
Figures 10(e) and 10(f) show $\langle \mathrm{Tr}(\text{M})\rangle$
for
$\langle \mathrm{Tr}(\text{M})\rangle$
for $\phi =36^\circ$
outboard midplane fixed points with
$\phi =36^\circ$
outboard midplane fixed points with $n_{\mathrm{(fixed\, point)}}=4$
and
$n_{\mathrm{(fixed\, point)}}=4$
and $6$
. For
$6$
. For $n_{\mathrm{(fixed\, point)}}=4$
, a strong correlation exists between
$n_{\mathrm{(fixed\, point)}}=4$
, a strong correlation exists between $\langle \mathrm{Tr}(\text{M})\rangle$
and
$\langle \mathrm{Tr}(\text{M})\rangle$
and $\tilde {I}_{\mathrm{CC}}$
, with the opposite trend to
$\tilde {I}_{\mathrm{CC}}$
, with the opposite trend to $n_{\mathrm{(fixed\, point)}}=5$
. There is little dependence for
$n_{\mathrm{(fixed\, point)}}=5$
. There is little dependence for $n_{\mathrm{(fixed\, point)}}=6$
and
$n_{\mathrm{(fixed\, point)}}=6$
and $\vert (\langle \mathrm{Tr}(\text{M})\rangle -2 ) \vert$
tends to be small, but increases with distance from magnetic axis. This also supports the findings of § 4.
$\vert (\langle \mathrm{Tr}(\text{M})\rangle -2 ) \vert$
tends to be small, but increases with distance from magnetic axis. This also supports the findings of § 4.
Finally, we note that $n_{\mathrm{(fixed\, point)}}=5$
and
$n_{\mathrm{(fixed\, point)}}=5$
and $6$
have a clear preferred phase, with the majority (85 %) of
$6$
have a clear preferred phase, with the majority (85 %) of $n_{\mathrm{(fixed\, point)}}=6$ $\phi =36^\circ$
outboard midplane fixed points being O-points, the majority (78 %) of such
$\phi =36^\circ$
outboard midplane fixed points being O-points, the majority (78 %) of such $n_{\mathrm{(fixed \,point)}}=5$
being X-points. In contrast, approximately half (53 %) of
$n_{\mathrm{(fixed \,point)}}=5$
being X-points. In contrast, approximately half (53 %) of $n_{\mathrm{(fixed \,point)}}=4$ $\phi =36^\circ$
outboard midplane fixed points are X-points (no clearly preferred phase).
$\phi =36^\circ$
outboard midplane fixed points are X-points (no clearly preferred phase).
5.3. Island size for ‘internal’ islands
Section 5.2 shows that $\mathrm{Tr}(\text{M})$
for fixed points tends to approach
$\mathrm{Tr}(\text{M})$
for fixed points tends to approach $2$
as the minor radius of the fixed point decreases and § 4 shows that
$2$
as the minor radius of the fixed point decreases and § 4 shows that $\mathrm{Tr}(\mathsf{M}) \rightarrow 2$
correlates with decreasing island size. This is indirectly what is targeted when the Cary and Hanson method (Cary & Hanson Reference Cary and Hanson1986) for stochasticity reduction in stellarators is used. The method minimises Greene’s residue
$\mathrm{Tr}(\mathsf{M}) \rightarrow 2$
correlates with decreasing island size. This is indirectly what is targeted when the Cary and Hanson method (Cary & Hanson Reference Cary and Hanson1986) for stochasticity reduction in stellarators is used. The method minimises Greene’s residue $\mathcal{R}=\tfrac {1}{2} - \tfrac {1}{4}\mathrm{Tr}(\text{M})$
(Greene Reference Greene1968; MacKay Reference MacKay1992) (i.e. to make
$\mathcal{R}=\tfrac {1}{2} - \tfrac {1}{4}\mathrm{Tr}(\text{M})$
(Greene Reference Greene1968; MacKay Reference MacKay1992) (i.e. to make $\mathrm{Tr}(\text{M})$
close to
$\mathrm{Tr}(\text{M})$
close to $2$
) to eliminate or reduce the size of internal islands. Internal islands have historically been considered undesirable for fusion reactors (since they flatten the pressure profile across the island). However, recent experimental results (Andreeva et al. Reference Andreeva2022; Chaudhary et al. Reference Chaudhary, Hirsch, Andreeva, Geiger, Hoefel, Rahbarnia, Wurden and Wolf2023) have found that island chains within the confined region but near the edge appear to suppress MHD activity and enable an increase in volume-normalised diamagnetic energy. Tailoring the emergence and size of internal island chains could therefore be useful in future experiments.
$2$
) to eliminate or reduce the size of internal islands. Internal islands have historically been considered undesirable for fusion reactors (since they flatten the pressure profile across the island). However, recent experimental results (Andreeva et al. Reference Andreeva2022; Chaudhary et al. Reference Chaudhary, Hirsch, Andreeva, Geiger, Hoefel, Rahbarnia, Wurden and Wolf2023) have found that island chains within the confined region but near the edge appear to suppress MHD activity and enable an increase in volume-normalised diamagnetic energy. Tailoring the emergence and size of internal island chains could therefore be useful in future experiments.
To address this, we compare island size and $\mathrm{Tr}(\text{M})$
for the
$\mathrm{Tr}(\text{M})$
for the $n_{\mathrm{(fixed \,point)}}=5$
‘internal’ fixed points, shown in figure 11. For reasons described in Appendix B, the area calculation may fail, and our approach is limited to configurations with X-points on the
$n_{\mathrm{(fixed \,point)}}=5$
‘internal’ fixed points, shown in figure 11. For reasons described in Appendix B, the area calculation may fail, and our approach is limited to configurations with X-points on the $\phi =36^\circ$
outboard midplane and O-points on the
$\phi =36^\circ$
outboard midplane and O-points on the $\phi =36^\circ$
inboard midplane. With these caveats, we calculate an island area for
$\phi =36^\circ$
inboard midplane. With these caveats, we calculate an island area for $32\,949$
configurations (the total number of configurations with
$32\,949$
configurations (the total number of configurations with $n_{\mathrm{(fixed\, point)}}=5$
internal fixed points is
$n_{\mathrm{(fixed\, point)}}=5$
internal fixed points is $35\,276$
). We find that island area correlates positively with
$35\,276$
). We find that island area correlates positively with $\vert \mathrm{Tr}(\text{M})-2 \vert$
for both the X- and O-points of the island chain, albeit with a large spread. Optimisations based on Greene‘s residue can therefore remove islands by minimising this residue, but if a specific island size is desired, other metrics should be used (see Geraldini et al. Reference Geraldini, Landreman and Paul2021). We also find that island area increases with the minor radius (
$\vert \mathrm{Tr}(\text{M})-2 \vert$
for both the X- and O-points of the island chain, albeit with a large spread. Optimisations based on Greene‘s residue can therefore remove islands by minimising this residue, but if a specific island size is desired, other metrics should be used (see Geraldini et al. Reference Geraldini, Landreman and Paul2021). We also find that island area increases with the minor radius ( $R_{\mathrm{(fixed\, point)}} - R_{\mathrm{MA}}$
) (figure 11
c). This might be expected, since the island area for a given island width should increase approximately linearly with minor radius.
$R_{\mathrm{(fixed\, point)}} - R_{\mathrm{MA}}$
) (figure 11
c). This might be expected, since the island area for a given island width should increase approximately linearly with minor radius.
(a, b) Comparison between fixed point $\mathrm{Tr}(\text{M})$
and island area for ‘internal’ 5/5 island chains. (c) Correlation between island area and minor radius of island chain.
$\mathrm{Tr}(\text{M})$
and island area for ‘internal’ 5/5 island chains. (c) Correlation between island area and minor radius of island chain.

6. Conclusions
This work presents a fast automated method to characterise fixed points in vacuum stellarator-symmetric magnetic fields and applies this to W7-X. We restrict our study to edge fixed points with periodicity of $n_{\mathrm{(fixed\, point)}}=4$
,
$n_{\mathrm{(fixed\, point)}}=4$
, $5$
and
$5$
and $6$
field periods, but there is no reason the algorithm cannot be applied beyond this. The aim of this work is both to develop the tool (a fast automated topological scheme) and to investigate the physics of W7-X edge topology towards experiment. In these conclusions, we highlight some possible applications.
$6$
field periods, but there is no reason the algorithm cannot be applied beyond this. The aim of this work is both to develop the tool (a fast automated topological scheme) and to investigate the physics of W7-X edge topology towards experiment. In these conclusions, we highlight some possible applications.
We perform scans where each coil current is individually varied, relative to the ‘standard’, ‘high iota’ and ‘low iota’ configurations, and also a large scan in which all coil currents are varied simultaneously. These confirm the following behaviours: (i) the non-planar coils, responsible for generating rotational transform and plasma shaping, have relatively little effect on magnetic axis location and rotational transform or on edge fixed points; (ii) the planar coils control inward and outward shift of the plasma and can boost the $\iota$
profile up and down, and thus principally control the periodicity and location of edge fixed points; (iii) the control coil has a relatively large effect on fixed points in the edge, with the sensitivity of fixed points to coil current increasing with the minor radius of the fixed points. These are well-expected (Andreeva et al. Reference Andreeva2022), but for the first time are quantified over a large scan. This quantification may assist selection of experimental candidates, since (for example) we show quantitatively how the the on-axis rotational transform and axis location is relative to the planar coil currents. Selecting suitable candidates based on axis or edge fixed point properties may be easier since these are now ‘mapped out’.
$\iota$
profile up and down, and thus principally control the periodicity and location of edge fixed points; (iii) the control coil has a relatively large effect on fixed points in the edge, with the sensitivity of fixed points to coil current increasing with the minor radius of the fixed points. These are well-expected (Andreeva et al. Reference Andreeva2022), but for the first time are quantified over a large scan. This quantification may assist selection of experimental candidates, since (for example) we show quantitatively how the the on-axis rotational transform and axis location is relative to the planar coil currents. Selecting suitable candidates based on axis or edge fixed point properties may be easier since these are now ‘mapped out’.
We also find that the control coil has a surprisingly unequal effect on the X- and O-points within an island chain, which (for example) causes the $5/5$
island chain in the standard configuration to transition to a
$5/5$
island chain in the standard configuration to transition to a $10/10$
island chain: the X-point is changed to an O-point, but the O-point experiences little change. Understanding the reasons for this would be a useful piece of future work and possible methods to address these have been recently published (Hudson, Guinchard & Sengupta Reference Hudson, Guinchard and Sengupta2025; Wei et al. Reference Wei, Knieps, Hua and Liang2025). Preliminary investigations indicate that the changes to
$10/10$
island chain: the X-point is changed to an O-point, but the O-point experiences little change. Understanding the reasons for this would be a useful piece of future work and possible methods to address these have been recently published (Hudson, Guinchard & Sengupta Reference Hudson, Guinchard and Sengupta2025; Wei et al. Reference Wei, Knieps, Hua and Liang2025). Preliminary investigations indicate that the changes to $\mathrm{Tr}(\text{M})$
arise from highly toroidally and poloidally localised changes to the magnetic field induced by the control coil. Within the framework of the ‘resonant perturbation model’ (in which island chains are conceptualised as resonant perturbations to a set of nested surfaces), this spatial localisation implies that the control coils provide a broad spectrum of Fourier modes, rather than (for example) exclusively exciting the
$\mathrm{Tr}(\text{M})$
arise from highly toroidally and poloidally localised changes to the magnetic field induced by the control coil. Within the framework of the ‘resonant perturbation model’ (in which island chains are conceptualised as resonant perturbations to a set of nested surfaces), this spatial localisation implies that the control coils provide a broad spectrum of Fourier modes, rather than (for example) exclusively exciting the $m/n=5/5$
resonance. The implications of this for transport in the edge (compared with simple island models in which the island rotational transform is uniform with toroidal angle) is unknown.
$m/n=5/5$
resonance. The implications of this for transport in the edge (compared with simple island models in which the island rotational transform is uniform with toroidal angle) is unknown.
Our final result is finding a strong correlation between $\vert \mathrm{Tr}(\text{M})-2 \vert$
and island area for ‘internal’ island chains (i.e. not intersecting plasma-facing components), which may help to select experimental candidates with internal island chains of a desired width. This could be especially useful since the improved confinement properties of W7-X with internal island chains is known to be sensitive to island size (Andreeva et al. Reference Andreeva2022; Chaudhary et al. Reference Chaudhary, Hirsch, Andreeva, Geiger, Hoefel, Rahbarnia, Wurden and Wolf2023).
$\vert \mathrm{Tr}(\text{M})-2 \vert$
and island area for ‘internal’ island chains (i.e. not intersecting plasma-facing components), which may help to select experimental candidates with internal island chains of a desired width. This could be especially useful since the improved confinement properties of W7-X with internal island chains is known to be sensitive to island size (Andreeva et al. Reference Andreeva2022; Chaudhary et al. Reference Chaudhary, Hirsch, Andreeva, Geiger, Hoefel, Rahbarnia, Wurden and Wolf2023).
This work has ignored the effects of plasma-generated magnetic fields, which in general can affect the fixed point properties presented here, and therefore requires some discussion. Studies have previously examined the effects of plasma $\beta$
and toroidal current on the steady-state edge topology using both the numerical simulations and experimental measurements (Knieps et al. Reference Knieps2021; Zhou et al. Reference Zhou2022). These studies indicate that, although the plasma-generated fields can significantly stochastise the edge magnetic field and affect divertor plate heat loads, for standard and high iota configurations, the island phase is unchanged and the X/O-point location varies by only up to several centimetres, even for an on-axis plasma
$\beta$
and toroidal current on the steady-state edge topology using both the numerical simulations and experimental measurements (Knieps et al. Reference Knieps2021; Zhou et al. Reference Zhou2022). These studies indicate that, although the plasma-generated fields can significantly stochastise the edge magnetic field and affect divertor plate heat loads, for standard and high iota configurations, the island phase is unchanged and the X/O-point location varies by only up to several centimetres, even for an on-axis plasma $\beta$
of 5 %. Simulations of the low iota configuration with on-axis
$\beta$
of 5 %. Simulations of the low iota configuration with on-axis $\beta =2\,\%$
likewise show little change, but for on-axis
$\beta =2\,\%$
likewise show little change, but for on-axis $\beta =5\,\%$
display a transition from a
$\beta =5\,\%$
display a transition from a $5/6$
to
$5/6$
to $10/12$
island chain, again with a shift of the resonant surface by several centimetres. Separate studies reported by Gao et al. (Reference Gao2019) specifically studying the effect or toroidal current also show, for the standard configuration, a variation in fixed point position (and the location where plasma strikes the divertor plate) by several centimetres, but no change of island phase.
$10/12$
island chain, again with a shift of the resonant surface by several centimetres. Separate studies reported by Gao et al. (Reference Gao2019) specifically studying the effect or toroidal current also show, for the standard configuration, a variation in fixed point position (and the location where plasma strikes the divertor plate) by several centimetres, but no change of island phase.
Based on these studies, we acknowledge that the results presented here will contain a systematic error when applied to cases with plasma-generated currents. However, it appears that in many cases, the error induced will be relatively small, with plasma-generated fields only causing modest changes to the steady-state edge topology. It is also probable that the general trends we report (e.g. the roles of planar and control coils) are maintained even when plasma-generated fields are substantial. Finally, it is worth emphasising that the methods presented here could be used to study non-vacuum fields, although calculation of plasma-generated magnetic fields is non-trivial and likely to add significant computational cost.
Acknowledgements
Editor Peter Catto thanks the referees for their advice in evaluating this article.
Funding
This work has been carried out within the framework of the EUROfusion Consortium, partially funded by the European Union via the Euratom Research and Training Programme (Grant Agreement No. 101052200 – EUROfusion). The Swiss contribution to this work has been funded by the Swiss State Secretariat for Education, Research and Innovation (SERI). Views and opinions expressed are however those of the author(s) only and do not necessarily reflect those of the European Union, the European Commission or SERI. Neither the European Union nor the European Commission nor SERI can be held responsible for them. This work was supported by a grant from the Simons Foundation (1013657, J.L.). Open access funding provided by Max Planck Society.
Declaration of interests
The authors report no conflict of interest.
Appendix A. Illustration of calculation of Jacobian
The calculation of the Jacobian $\text{M}$
is shown graphically in figure 12. We construct a
$\text{M}$
is shown graphically in figure 12. We construct a $3\times 3$
grid of points around the given fixed point and trace for
$3\times 3$
grid of points around the given fixed point and trace for $n_{\mathrm{(fixed \,point)}}$
field periods, and fit the points to (2.2) and (2.3). The eigenvectors of
$n_{\mathrm{(fixed \,point)}}$
field periods, and fit the points to (2.2) and (2.3). The eigenvectors of $\text{M}$
for the X-point are easily calculated, and sampling points on the eigenvectors recover the manifolds of the X-point (the island separatrix for a regular non-chaotic island chain).
$\text{M}$
for the X-point are easily calculated, and sampling points on the eigenvectors recover the manifolds of the X-point (the island separatrix for a regular non-chaotic island chain).
Illustration of calculating the Jacobian $\text{M}$
of the Poincaré map for fixed points, using an initial grid of points (blue circles) and their image under the field line map (orange circles). (a) O-point, for which
$\text{M}$
of the Poincaré map for fixed points, using an initial grid of points (blue circles) and their image under the field line map (orange circles). (a) O-point, for which $\mathrm{Tr}(\text{M})\lt 2$
. (b) X-point, for which
$\mathrm{Tr}(\text{M})\lt 2$
. (b) X-point, for which $\mathrm{Tr}(\text{M})\gt 2$
. The eigenvectors of
$\mathrm{Tr}(\text{M})\gt 2$
. The eigenvectors of $\text{M}$
for the X-point are shown as black and green arrows.
$\text{M}$
for the X-point are shown as black and green arrows.

Appendix B. Island area calculation
The island area calculations presented here are only performed for configurations with $n_{\mathrm{(fixed\, point)}}=5$
fixed points, and only for configurations with an X-point on the
$n_{\mathrm{(fixed\, point)}}=5$
fixed points, and only for configurations with an X-point on the $\phi =36^\circ$
outboard midplane and an O-point on the
$\phi =36^\circ$
outboard midplane and an O-point on the $\phi =36^\circ$
inboard midplane, which includes (for example) the standard configuration (see figure 2). We approximate the area by finding the eigenvectors of
$\phi =36^\circ$
inboard midplane, which includes (for example) the standard configuration (see figure 2). We approximate the area by finding the eigenvectors of $\text{M}$
for the X-point and tracing the stable and unstable manifolds. If these manifolds become sufficiently close to the forward image of the X-point (within a distance
$\text{M}$
for the X-point and tracing the stable and unstable manifolds. If these manifolds become sufficiently close to the forward image of the X-point (within a distance $d_{\mathrm{tol}}=0.02d_X$
, where
$d_{\mathrm{tol}}=0.02d_X$
, where $d_X$
is the distance from the X-point to its forward image), we use the manifolds to construct a closed polygon, for which the area is calculated using Gauss’s shoelace algorithm. As a check against numerical error, we repeat the calculation for the backward image of the X-point and compare the calculated areas. If the areas differ too greatly (by more than
$d_X$
is the distance from the X-point to its forward image), we use the manifolds to construct a closed polygon, for which the area is calculated using Gauss’s shoelace algorithm. As a check against numerical error, we repeat the calculation for the backward image of the X-point and compare the calculated areas. If the areas differ too greatly (by more than $A_{\mathrm{tol}}=10\,\text{cm}^2$
), or if the manifolds do not sufficiently approach the image of the X-point (which might happen for example if the island chain has
$A_{\mathrm{tol}}=10\,\text{cm}^2$
), or if the manifolds do not sufficiently approach the image of the X-point (which might happen for example if the island chain has $m/n=15/15$
), the scheme is considered to have failed. A graphical example of the calculation is shown for the standard configuration in figure 13.
$m/n=15/15$
), the scheme is considered to have failed. A graphical example of the calculation is shown for the standard configuration in figure 13.
Illustration of the island area calculation scheme, applied to the standard configuration.

It is worth noting that the area of the island varies with toroidal position of the island. Calculating instead the toroidal magnetic flux in the island (for example) would create a toroidally invariant ‘island size’, although the toroidal flux should then be normalised to a reference magnetic field strength because field strength (and hence toroidal flux) can be arbitrarily scaled without affecting the island geometry.
Appendix C. Selection of coil current constraints
Experimentally, the coil currents in W7-X are constrained by a number of factors. These include the electrical limit on the coil winding current, the constraints on the mechanical forces permitted by the machine and the requirement that the magnetic field strength allows the plasma to couple to the ECRH beams. Because rigorously applying all of these constraints is relatively difficult, we use simple constraints the limits, with non-planar coil filament currents restricted to the range $1.168$
–
$1.168$
– $1.57$
MA, planar coil filament currents to the range
$1.57$
MA, planar coil filament currents to the range $-0.361$
to
$-0.361$
to $+0.361$
MA, and control coil filament current to
$+0.361$
MA, and control coil filament current to $-20$
to
$-20$
to $+20$
kA. These are within the normal range of coil currents operated by W7-X (Andreeva et al. Reference Andreeva2022).
$+20$
kA. These are within the normal range of coil currents operated by W7-X (Andreeva et al. Reference Andreeva2022).


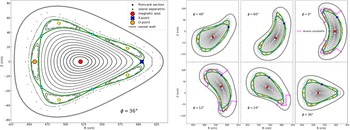


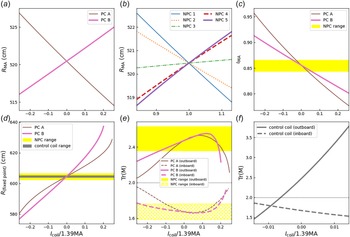


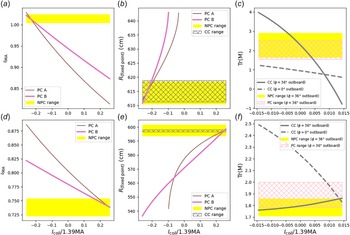


 Open access

