

INTRODUCTION
Dredging of the sea bed is required for the development and maintenance of harbours and offshore petrochemical facilities around the world (Morton, Reference Morton1977; DEWHA, 2009). However, this activity requires the removal and subsequent dumping of millions of cubic metres of spoil into proximate areas, posing an environmental risk for marine communities (Morton, Reference Morton1977; Desprez, Reference Desprez2000). One of the main physical effects of dredging is the temporary increase in suspended sediment concentrations at both dredge and disposal sites (Morton, Reference Morton1977). Dredged sediments can remain in suspension for minutes to days depending on their particle size and composition, and local environmental conditions, before settling on the seafloor and benthic communities (Newell et al., Reference Newell, Seiderer and Hitchcock1998). Increased sedimentation and levels of total suspended solids (TSS) are considered major causes of worldwide degradation of important marine ecosystems such as coral reefs (Rogers, Reference Rogers1990; McClanahan & Obura, Reference McClanahan and Obura1997; McCulloch et al., Reference McCulloch, Fallon, Wyndham, Hendy, Lough and Barnes2003), rocky assemblages (Airoldi, Reference Airoldi2003; Balata et al., Reference Balata, Piazzi, Cecchi and Cinelli2005) and estuaries (Wilber & Clarke, Reference Wilber and Clarke2001). The effects of high sedimentation and TSS range from the immediate burial and smothering of benthic organisms to negative effects on life history processes such as settlement, recruitment, feeding and growth (Airoldi, Reference Airoldi2003; Fabricius, Reference Fabricius2005; Lohrer et al., Reference Lohrer, Hewitt and Thrush2006). Competitive and predator-prey interactions may also be affected by high sedimentation (Airoldi, Reference Airoldi2003).
Sponges are sessile filter-feeding organisms that play important roles in marine ecosystems including occupying and eroding substrate, bentho-pelagic energy transfer, and positive and negative associations with other organisms (Bell, Reference Bell2008; de Goeij et al., Reference de Goeij, van Oevelen, Vermeij, Osinga, Middelburg, de Goeij and Admiraal2013). Sponges are highly diverse and can even be the dominant fauna in many regions including some coral reefs, inter-reef habitats and deep water environments (e.g. Wilkinson & Evans, Reference Wilkinson and Evans1989; Bell & Barnes, Reference Bell and Barnes2000a; Diaz & Rützler, Reference Diaz and Rützler2001; Pawlik, Reference Pawlik2011; Murillo et al., Reference Murillo, Muñoz, Cristobo, Ríos, González, Kenchington and Serrano2012). In areas of particularly high sponge abundance (sponge gardens), these organisms can fulfil ecological roles comparable to coral reefs (Schönberg & Fromont, Reference Schönberg and Fromont2011). However, sponge assemblages can also be sensitive to global and local pressures including climate change (Przeslawski et al., Reference Przeslawski, Ahyong, Byrne, Wörheide and Hutchings2008; Bell et al., Reference Bell, Davy, Jones, Taylor and Webster2013; Webster et al., Reference Webster, Pantile, Botté, Abdo, Andreakis and Whalan2013) and dredging-associated increases in sediment suspension and deposition (Gerrodette & Flechsig, Reference Gerrodette and Flechsig1979; Wilkinson & Cheshire, Reference Wilkinson and Cheshire1989; Roberts et al., Reference Roberts, Davis and Cummins2006; Bannister et al., Reference Bannister, Battershill and de Nys2012).
The effects of sediments on sponges include clogging of the aquiferous canals and chambers (Bakus, Reference Bakus1968), reduced pumping activity (Gerrodette & Flechsig, Reference Gerrodette and Flechsig1979; Tompkins-MacDonald & Leys, Reference Tompkins-MacDonald and Leys2008), reduced growth rates (Roberts et al., Reference Roberts, Davis and Cummins2006; Whalan et al., Reference Whalan, Battershill and Nys2007) and increased respiration rates (Bannister et al., Reference Bannister, Battershill and de Nys2012). High sediment deposition can also smother sponge recruits (Maldonado et al., Reference Maldonado, Giraud and Carmona2008) and even bury adults (Wulff, Reference Wulff1997). In addition, sponges host dense and diverse microbial symbionts that contribute to the health, fitness and nutrition of the host (Webster & Taylor, Reference Webster and Taylor2012). Many of these symbionts are photosynthetic which may make sponges particularly sensitive to dredge-related light reduction due to increased turbidity (Thacker, Reference Thacker2005; Roberts et al., Reference Roberts, Davis and Cummins2006; Bell, Reference Bell2008). High sedimentation can therefore greatly influence the structure, abundance and diversity of sponge assemblages (Bell & Barnes, Reference Bell and Barnes2000a, Reference Bell and Barnesb; Carballo, Reference Carballo2006).
Effects of sedimentation will vary between sponge species with morphology or shape likely to be a major contributor to this inter-species variation. For example, high sediment deposition may smother thin, encrusting sponges while having little impact on upright or erect sponges. The overall aim of this study was to investigate responses of different sponge morphologies to a range of controlled sedimentation treatments simulating conditions associated with dredging activity.
MATERIALS AND METHODS
Sponge species and morphology
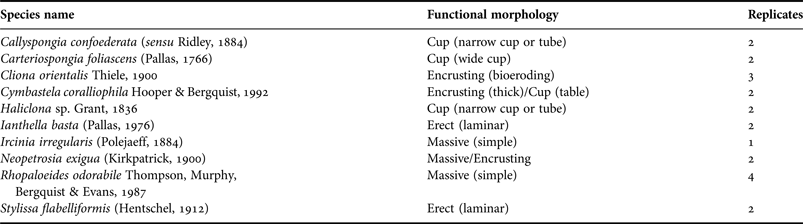
Ten sponge species (Table 1), representing four general morphologies (massive, erect, cup and encrusting), were collected from Broadhurst Reef, Great Barrier Reef (18°51.891′S 147°41.660 E), in September 2013. Of these, Stylissa flabelliformis, Cliona orientalis, Ianthella basta and Carteriospongia foliascens are also widely distributed throughout the Indo-Pacific (Fromont, Reference Fromont2004). Sponges were transported to the Australian Institute of Marine Science and acclimated in 1000 l tanks for >2 weeks with 5 µm filtered flow-through seawater at 25°C and 36‰ salinity, environmental conditions comparable to the collection site.
List of species, morphologies and number of replicates per treatment.

Experimental set up
The experiment was conducted in three 1000 l tanks, each dosed at one of three sediment levels: 0 mg l−1 (control), 250 mg l−1 (medium) and 500 mg l−1 (high). The siliciclastic sediment used in this experiment was collected sub-tidally from Onslow, Western Australia (21°38′S 114°56′E) and ground to 63 µm. Particle size distribution analysis determined that the ground sediment ranged from 1–130 µm in size, with the majority between 30 and 80 µm. Heavy metal analysis determined that the grinding process did not contaminate sediments but that they were naturally rich in Fe and Al.
For the medium and high treatments, ground sediment was blended with seawater, forming a sediment slurry that was poured slowly into each tank in a single pulse at Day 0 to reach desired treatment concentrations. Water flow in the tanks was standardized to ~300 ml min−1, resulting in a complete renewal of seawater in 48 h.
One to four replicates of each sponge species were randomly placed in each tank, with all sponges separated by ≥10 cm to prevent any antagonistic interactions. All species were placed in their natural orientation. For example, I. basta, Haliclona sp., S. flabelliformis and Callyspongia confoederata were fixed to coral plugs using non-toxic underwater putty (Knead IT® Aqua Selleys, NSW Australia) and placed in plastic racks, so that they were exposed to sediments in their natural upright position. Sponges were exposed to sediments for 15 days.
No significant differences in initial size of replicates among treatments were observed for any of the species (ANOVA: P > 0.05 for all species), thus excluding initial sponge size influencing the results.
Studied parameters
PHYSICAL PARAMETERS
Total Suspended Solids (TSS) were recorded immediately following sediment addition (T = 0 h), T = 8, 24 and 32 h, and then after 7 and 14 days. For TSS analysis, triplicate water samples (200 ml) were collected from each tank and filtered through previously weighed 0.4 µm polycarbonate filters (Advantec MFS, Inc.). Filters were dried overnight at 60°C and dry weights were recorded the following morning.
Sedimentation Rates (SR) were measured by collecting and filtering sediments that accumulated on five SedPods (Surface Area = 25.16 cm2) (Field et al., Reference Field, Chezar and Storlazzi2013) randomly placed in each tank. To examine sedimentation rates throughout the experiment, SedPods were removed after 1, 2, 7 and 15 days.
DETERMINATION OF SMOTHERING AND ASSESSMENT OF SPONGE HEALTH
Underwater pictures of each sponge were taken with an Olympus C-5050 digital camera prior to sediment addition and after 2, 7 and 15 days. Image analysis software (Image J) was then used to measure the percentage of surface area covered by sediments for each sponge during the experiment (Figure 1).
Tested sponge species prior to the sediment addition (before), during the experiment (during) and after removal of sediments (after) in the high sediment treatment: (A) R. odorabile; (B) I. irregularis; (C) N. exigua; (D) I. basta; (E) S. flabelliformis; (F) Haliclona sp.; (G) C. confoederata; (H) C. foliascens; (I) C. orientalis; (J) C. coralliophila. Scale bars: 1 cm.
To determine the weight of sediment remaining on each sponge by the end of the experiment, each sponge was carefully placed into a plastic zip lock bag underwater, and then inverted and shaken so that all sediment fell off the sponge surface into the bag. The water and sediment within each plastic bag was filtered and weighed as described above.
Following the removal of sediments and any attached algae, additional pictures were taken of each sponge to confirm sponge mortality, determine colour changes and calculate the percentage of necrosed tissue. The change in sponge surface area from day 0 to day 15 was measured for each sample to determine approximate sponge growth (Figure 1). Importantly however, inferred growth based on surface area could be underestimated, especially in sponges with a three-dimensional structure such as cups and erect morphologies.
Changes in surface area (i.e. growth), percentage of necrosed tissue, percentage of area covered by sediments on day 2 and total sedimentation on sponges were studied separately for those species with sufficient levels of replication to enable statistical testing (i.e. ≥3 replicates: Rhopaloeides odorabile and C. orientalis) with a one-way analysis of variance (ANOVA) using treatment as the fixed factor. For all four variables, we performed a two-way general linear model (GLM) ANOVA with sponge morphology (as per Table 1) and treatment as fixed factors. Logit and arcsine transformations were performed to meet the assumptions for ANOVA. Transformed data had homogeneity of variances in all datasets, although in some instances normality was not accomplished. GLM ANOVA tests were still conducted as they are robust to departures from normality when variances are homogeneous (Underwood, Reference Underwood1997). Statistical analysis and graphs were performed using the software SigmaPlot v.11.0 (Systat Software Inc.) and NCSS v 9 (NCSS, USA).
PIGMENT ANALYSIS
At the completion of the experiment, two 1 × 0.5 × 0.5 cm pieces of healthy tissue per sponge individual were excised using sterile scalpels, cutting from the pinacoderm through to the mesohyl. Excised pieces were briefly rinsed in clean seawater to remove surface sediments, placed into two 2 ml cryo-vials and snap frozen in liquid nitrogen for subsequent analysis of pigments and microbial symbionts.
Chlorophyll and carotenoid concentrations were used as a proxy for host stress and photosynthetic potential after exposure to sediments. Samples were allowed to thaw slightly and approximately 0.25 g wet weight of each sample was finely cut and extracted in 2 ml of 95% ethanol. Three stainless steel beads were added to each vial, and samples were shaken in a Bead Beater (Bio Spec Products Inc., Bartlesville, USA) for 3 min. Triplicate 300 µl extracts, and the 95% ethanol blank, were then pipetted into a microplate.
The extraction method using 95% ethanol was less toxic and more time efficient than extractions with acetone or methanol and also yielded greater extraction concentrations (data not shown). As ethanol is less volatile than methanol or acetone, it can be used in 96-well microplates for assessment using the spectrophotometer.
Absorbance at 470, 632, 649, 665, 696 and 750 nm (i.e. turbidity) was read on a Power Wave Microplate Scanning Spectrophotometer (BIO-TEK® Instruments Inc., Vermont, USA). Using the blank corrected absorbance readings minus the absorbance at wavelength 750 nm (E x), Chl a, Chl b, Chl c, Chl d, Total Chl and Total Carotenoids were calculated using the following equations (Lichtenthaler, Reference Lichtenthaler1987; Ritchie, Reference Ritchie2008):
 $${\rm Chl}\, a\, \lpar \mu {\rm g}\, {\rm ml}^{ - 1} \rpar =\lsqb \lpar\! - 0. 9394 \times E_{ 632} \rpar +\lpar\! - 4. 2774 \times E_{ 649} \rpar +\lpar 13. 3914 \times E_{ 665} \rpar \rsqb /0. 794$$
 $${\rm Chl}\, b\, \lpar \mu {\rm g}\, {\rm ml}^{ - 1} \rpar =\lsqb \lpar\! - 4.0 937 \times E_{ 632} \rpar +\lpar 25. 6865 \times E_{ 649} \rpar +\lpar \!- 7. 3430 \times E_{ 665} \rpar \rsqb /0. 794$$
 $${\rm Chl}\, c\, \lpar \mu {\rm g}\, {\rm ml}^{ - 1} \rpar =\lsqb \lpar 28. 50 73 \times E_{ 632} \rpar +\lpar\! - 9. 9940 \times E_{ 649} \rpar +\lpar\! - 1. 9749 \times E_{ 665} \rpar \rsqb /0. 794$$
 $$\eqalign{{\rm Chl}\, d\, \lpar \mu {\rm g}\, {\rm ml}^{ - 1} \rpar &=\lsqb \lpar\! -\! 0. 200 7 \times E_{ 632} \rpar +\lpar 0.0 848 \times E_{ 649} \rpar \cr &\quad+\lpar\! -\! 0. 190 9 \times E_{ 665} \rpar \cr &\quad +\lpar 12. 130 2 \times E_{ 696} \rpar \rsqb /0. 794}$$
 $${\rm Total}\, {\rm Chl}\, \lpar \mu {\rm g}\, {\rm ml}^{ - 1} \rpar =\lsqb \lpar 24. 120 9 \times E_{ 632} \rpar +\lpar 11. 2884 \times E_{ 649} \rpar +\lpar 3. 7620 \times E_{ 665} \rpar +\lpar 5. 8338 \times E_{ 696} \rpar \rsqb /0. 794$$
 $${\rm Total}\, {\rm carotenoids}\, \lpar \mu {\rm g}\, {\rm ml}^{ - 1} \rpar =\lsqb \lpar \lpar 1000 \times E_{ 470} \rpar /0. 794\rpar -\lpar 2. 13 \times {\rm Chl}\, a\rpar -\lpar 97. 64 \times {\rm Chl}\, b\rpar \rsqb / 20 9$$
The factor 0.794 is a path length correction, determined by the ratio of the absorbance of the microplate measurement divided by the absorbance of the 1 cm cuvette at a given wave length, using ethanol as solvent and for a volume of 300 µl of sample extract.
Pigment concentrations were normalized to wet weight using the calculation:
 $$\lsqb {\rm Chl}\, a\, \lpar \mu {\rm g}\, {\rm ml}^{ - 1} \rpar \times {\rm extraction}\, {\rm volume}\, \lpar {\rm ml}\rpar \rsqb /{\rm wet}\, {\rm weight}\, {\rm \lpar g\rpar }$$
MICROBIAL SYMBIONTS ANALYSIS
Assessment of host-associated microbial communities was performed for all sponge species that had ≥2 replicates alive in all treatments at the completion of the experiment (i.e. C. foliascens, C. orientalis, Cymbastela coralliophila, I. basta, Neopetrosia exigua, R. odorabile and S. flabelliformis). DNA extractions were performed using the Power Plant® Pro DNA Isolation Kit (MoBio Laboratories, Carlsbad, CA) and a fragment of the 16S rRNA gene was amplified with the primer set 1055F and 1392r containing a GC clamp (Muyzer et al., Reference Muyzer, de Waal and Uitterlinden1993; Ferris et al., Reference Ferris, Muyzer and Ward1996). Total reaction volume was 50 µl, including 10 µl of 5× Buffer (containing 5 mM dNTPs and 15 mM MgCl2), 0.4 µl of BSA (10 mg ml−1), 0.25 µl (1.25 units) of My Taq DNA Polymerase (Bioline®, London, UK), 1 µl of each primer (10 µM), ~10 ng of template DNA and sterile Milli-Q water. PCR conditions were as follows: 1 cycle at 95°C for 1 min; 32 cycles at 94°C for 30 s, 54°C for 30 s and 72°C for 1 min, and a final elongation at 72°C for 7 min. PCR products were visualized on 1% agarose gels to assess amplification specificity and initial product quantity. 15 µl of each PCR product were applied to 8% w/v polyacrylamide (37.5:1) gels containing a 50–70% denaturing gradient of formamide and urea. Gels were electrophoresed at 65°C for 16 h in 1 × TAE (Tris-acetic acid EDTA) buffer at 75 V using the Ingeny D-Code system (Goes, the Netherlands). Gels were stained with 1× Sybr Gold for 10 min, visualized under UV illumination and photographed. Individual band numbers were assigned based on their migration. Bands assigned the same number had identical migration end points, and were used to build a presence/absence matrix. Three factors were determined (i.e. species, morphology, sediment treatment). principal component analysis (PCA) of microbial community profiles was performed on square root transformed data. The same matrix was used for SIMPER analysis (similarity/distance percentages), which examined the contribution of each variable to average resemblances between sample groups. A distance matrix was obtained using Bray–Curtis similarity and used for PERMANOVA (Permutational multivariate ANOVA based on distances). All analyses were performed on Primer 6 (PRIMER-E Ltd, Plymouth, UK).
RESULTS
Physical parameters
Levels of TSS measured at Time 0 (directly after addition of sediments to the tanks) were 1.8 ± 0.3, 217 ± 7 and 542 ± 87 mg l−1 (mean ± SE) in the control, medium and high treatment tanks, respectively. Thus, measured TSS values were close to expected values of 0, 250 and 500 mg l−1. TSS dropped ~80% in 8 h and 99% in 48 h in both treatment tanks.
Total sedimentation levels at the end of the experiment were 0.27 ± 0.01, 8.7 ± 0.7 and 16.3 ± 0.3 mg cm−2 (mean ± SE) in the control, medium and high treatment tanks, respectively. Similar to the TSS levels, a ~98% decline in SR was observed within 24 h in both sediment treatments with all sediments settling within 48 h. The primary main physical effect on sponges in this study was therefore sediment deposition.
Determination of smothering and assessment of sponge health
With the exception of individuals of Haliclona sp. and Callyspongia confoederata, all sponges in all treatments survived until the end of the experiment. Haliclona sp. died after 7 days in the medium and high sedimentation treatments and after 15 days in the control, indicating that this species is unsuitable for further aquarium-based experimentation. In contrast, C. confoederata survived in the control treatment, but died after 7 days in the high sediment treatment and after 15 days in the medium sediment treatment, indicating sensitivity to elevated sediment levels (Figure 1).
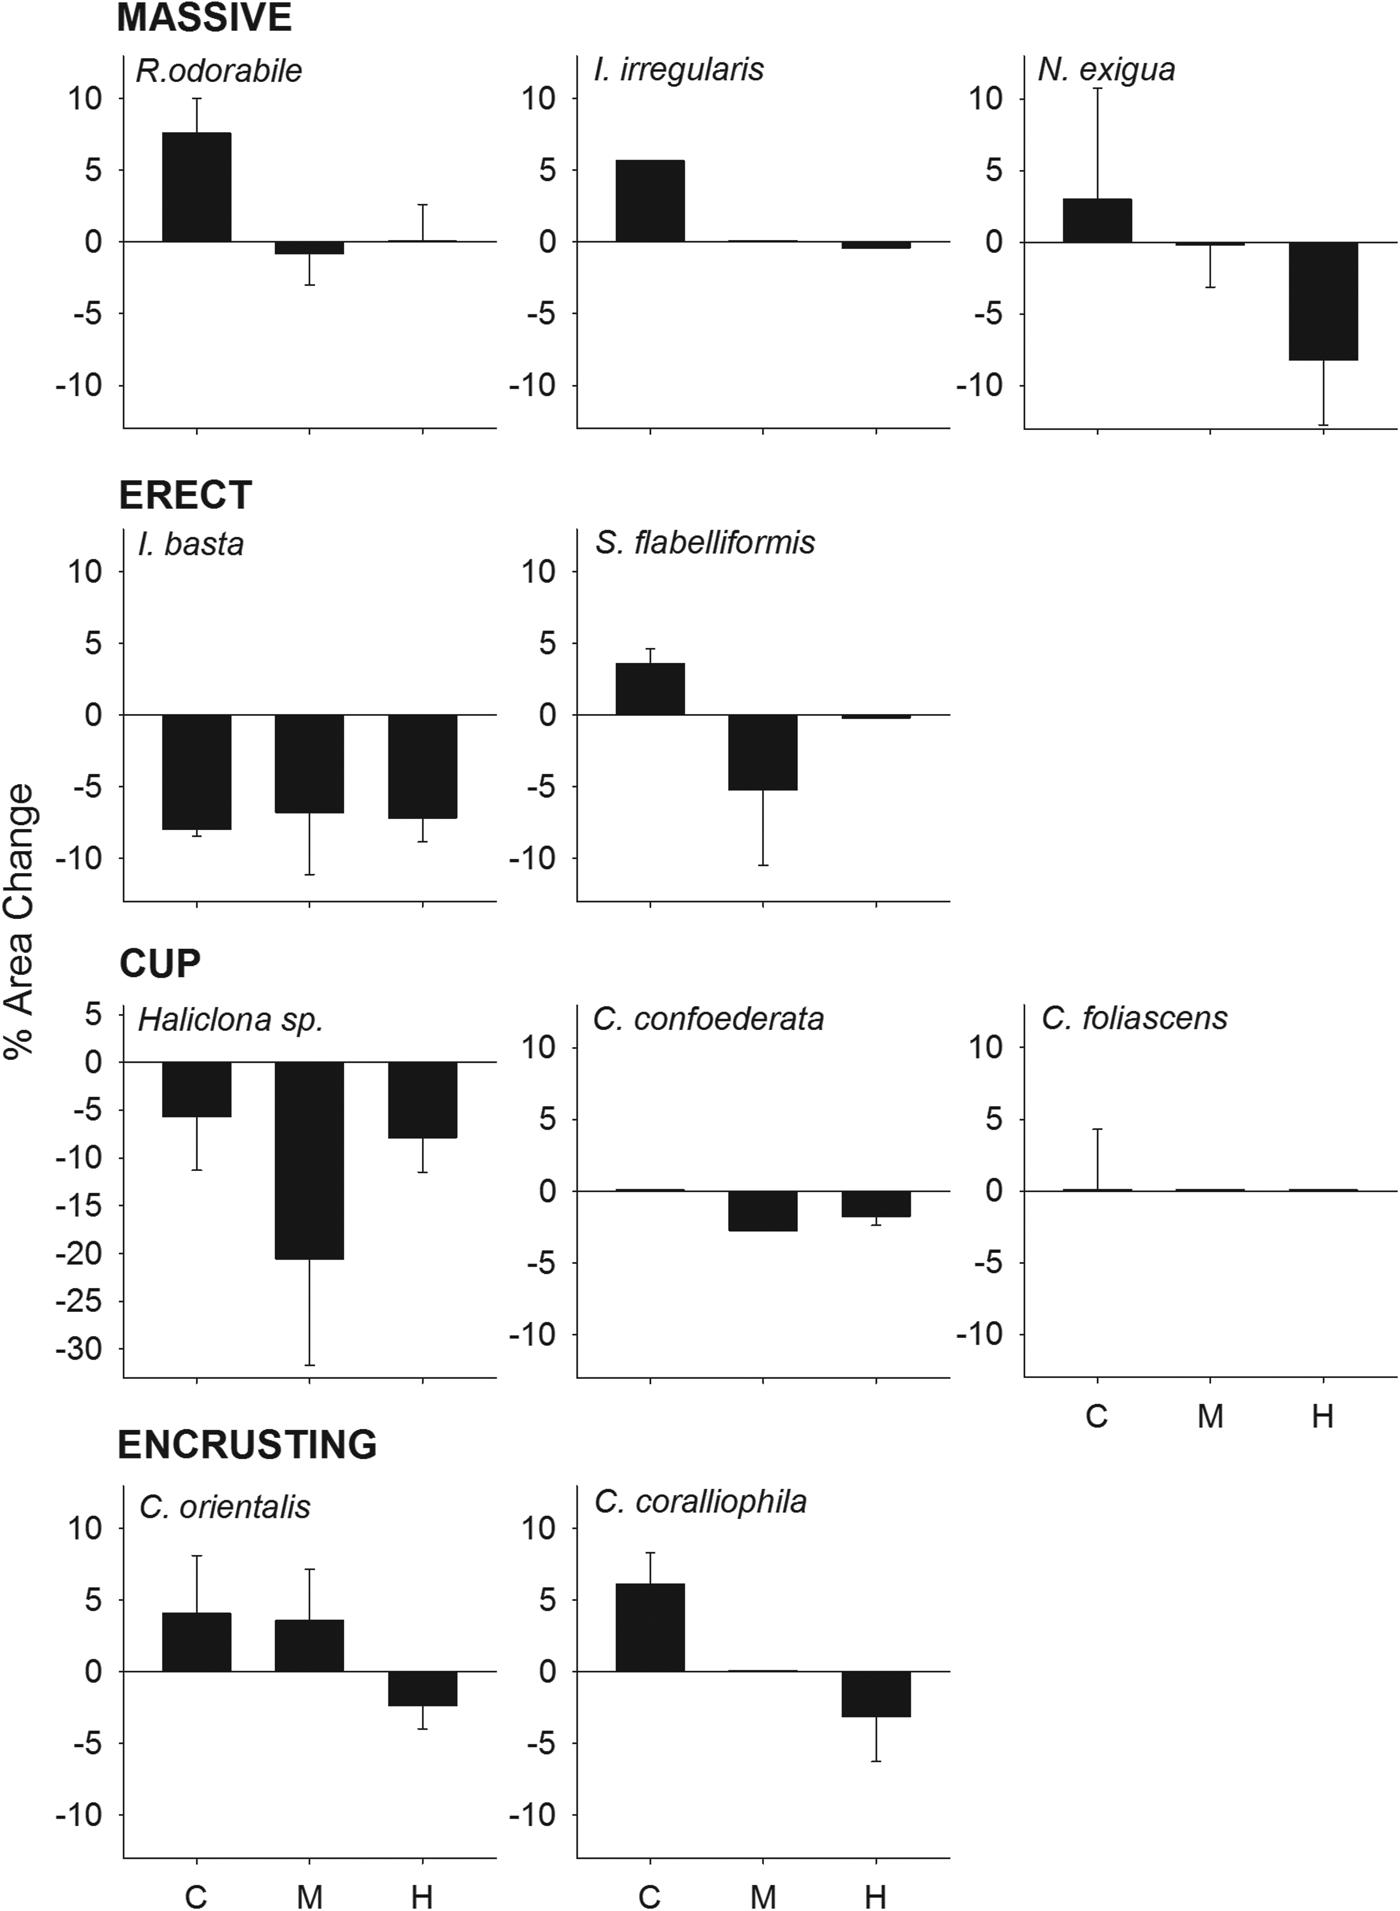
With the exception of Ianthella basta, Haliclona sp. and C. confoederata, all species showed positive growth (i.e. surface area) in the control treatment (Figure 2). In contrast, null or negative growth was observed in the medium and high sediment treatment for all species except Cliona orientalis which exhibited positive growth in the medium treatment but negative growth in the high treatment (Figure 2). Although differences in growth between treatments were not statistically significant for Rhopaloeides odorabile and C. orientalis (ANOVA: P > 0.05), both morphology and treatment had a significant effect on growth when comparing all individuals grouped by morphology (Table 2). Massive and encrusting species showed a significantly higher growth than cups and erect sponges. Sponges exposed to medium and high sediment treatments grew significantly less than sponges in the control treatment (Table 2, Figure 2).
Percentage of area change (growth) at the end of the experiment for all species grouped by morphologies, at the three sediment treatments (control, medium and high).
ANOVA examining the effects of treatment on size (growth) among the sponge morphologies after 15 days.

Significant Pairwise Multiple Comparisons (Holm–Sidak method).
MAS, ENC > CUP (P = 0.009, 0.010).
C > M (P = 0.017), H (P = 0.025).
Individuals of some species in the medium and high sediment treatments developed areas of necrosed tissue (e.g. 2–15% of R. odorabile tissue and 2.6–5% of Cymbastela coralliophila tissue) although there was no significant difference between treatments (ANOVA: P > 0.05). Tissue necrosis was not observed in any individual of the erect species Stylissa flabelliformis and I. basta and the encrusting species C. orientalis. Significant differences in percentage of necrosis were only observed when comparing among morphologies, with cups experiencing the highest percentage of necrosis (Table 3, Figure 1).
ANOVA examining the effects of treatment on the percentage of tissue affected by necrosis among the sponge morphologies after 15 days.

Significant Pairwise Multiple Comparisons (Holm–Sidak method).
CUP > ENC (P = 0.009), MAS (P = 0.010), ERE (P = 0.013).
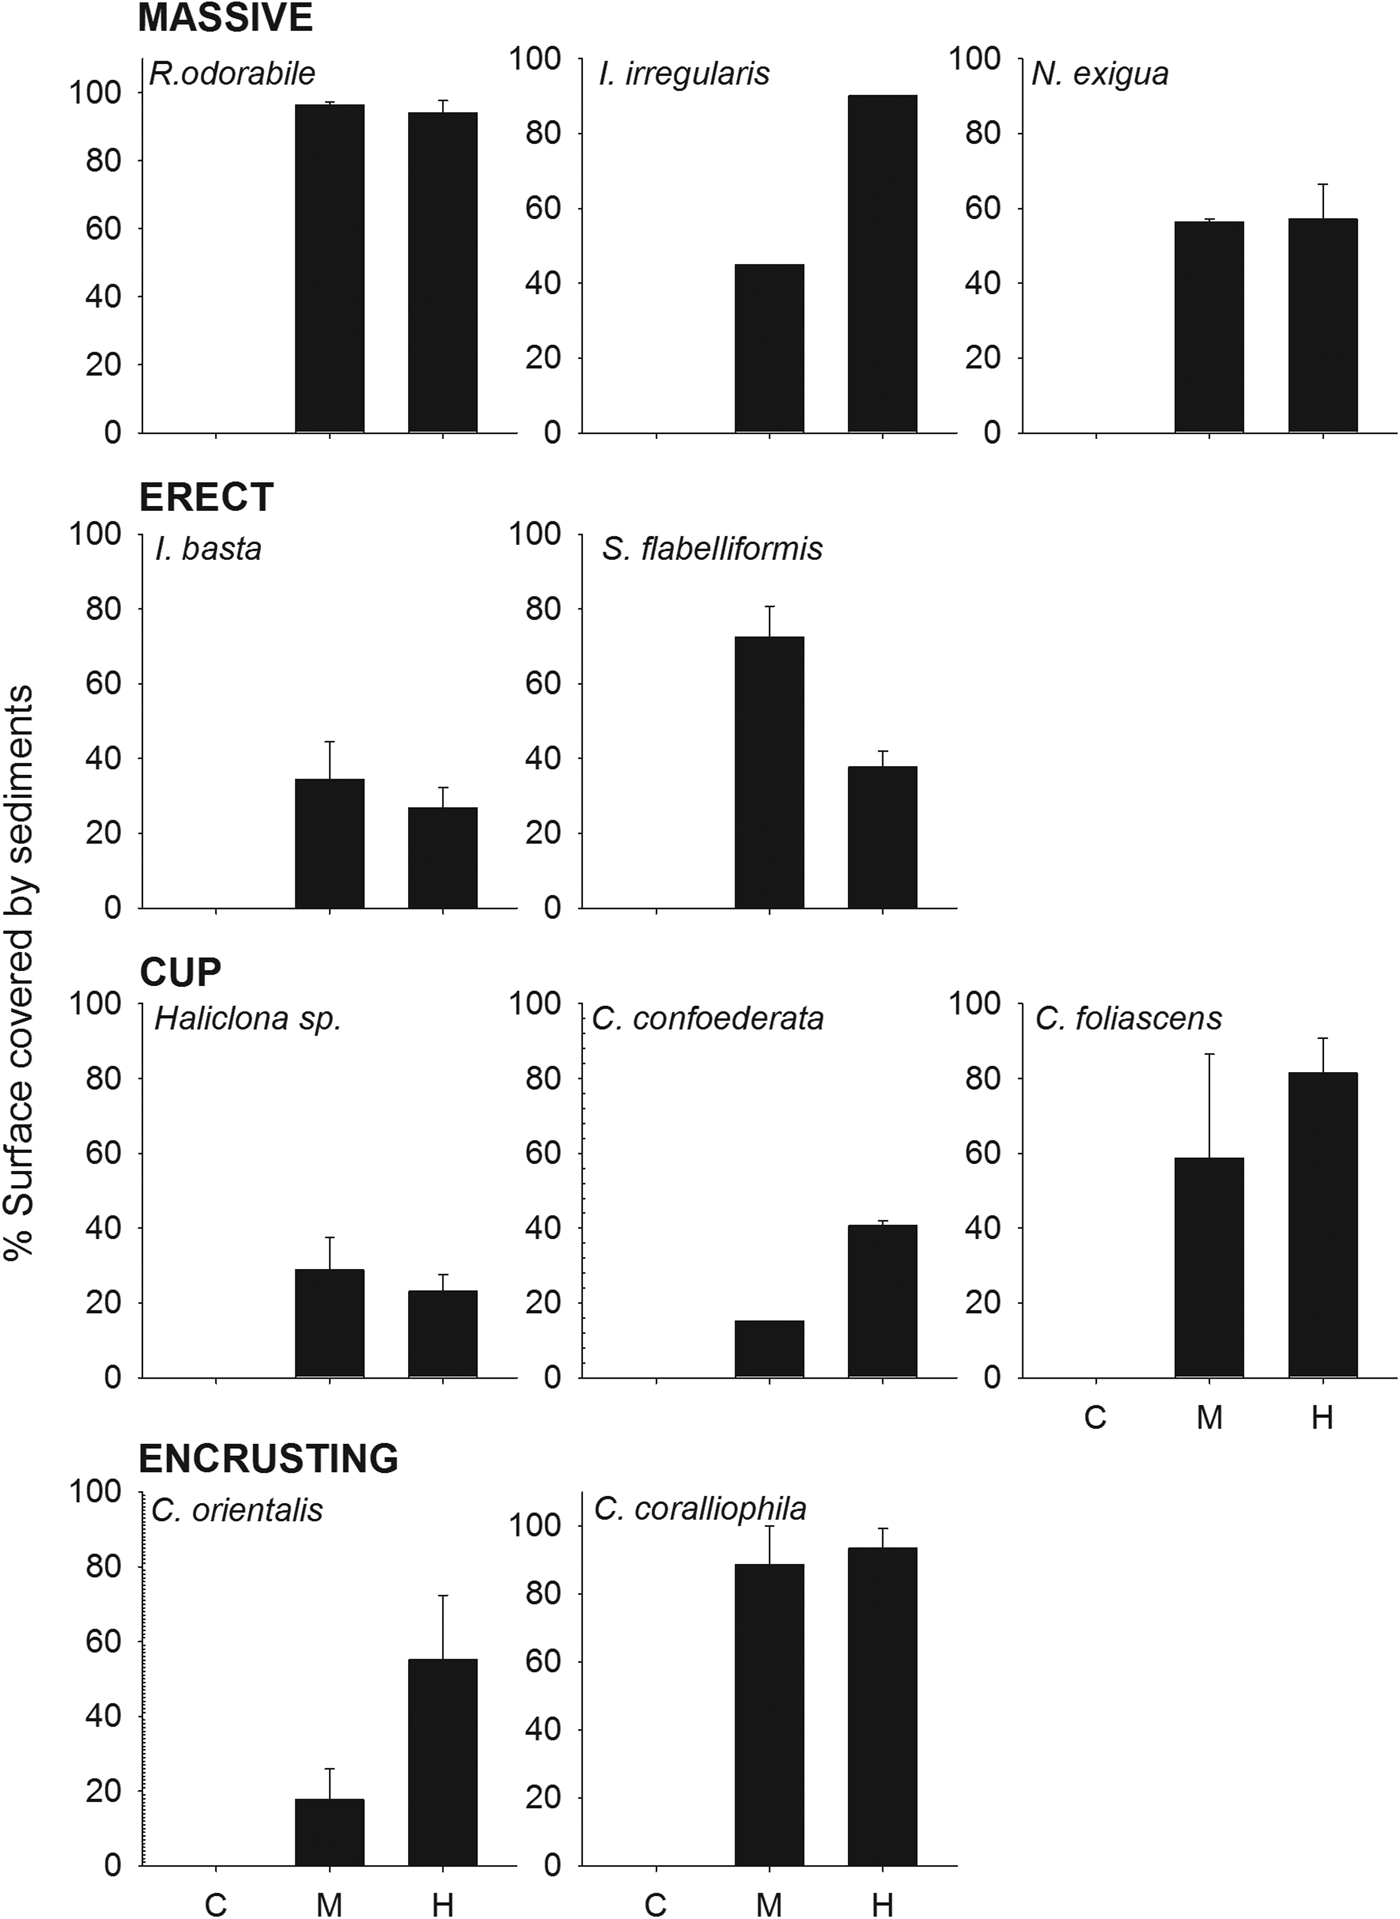
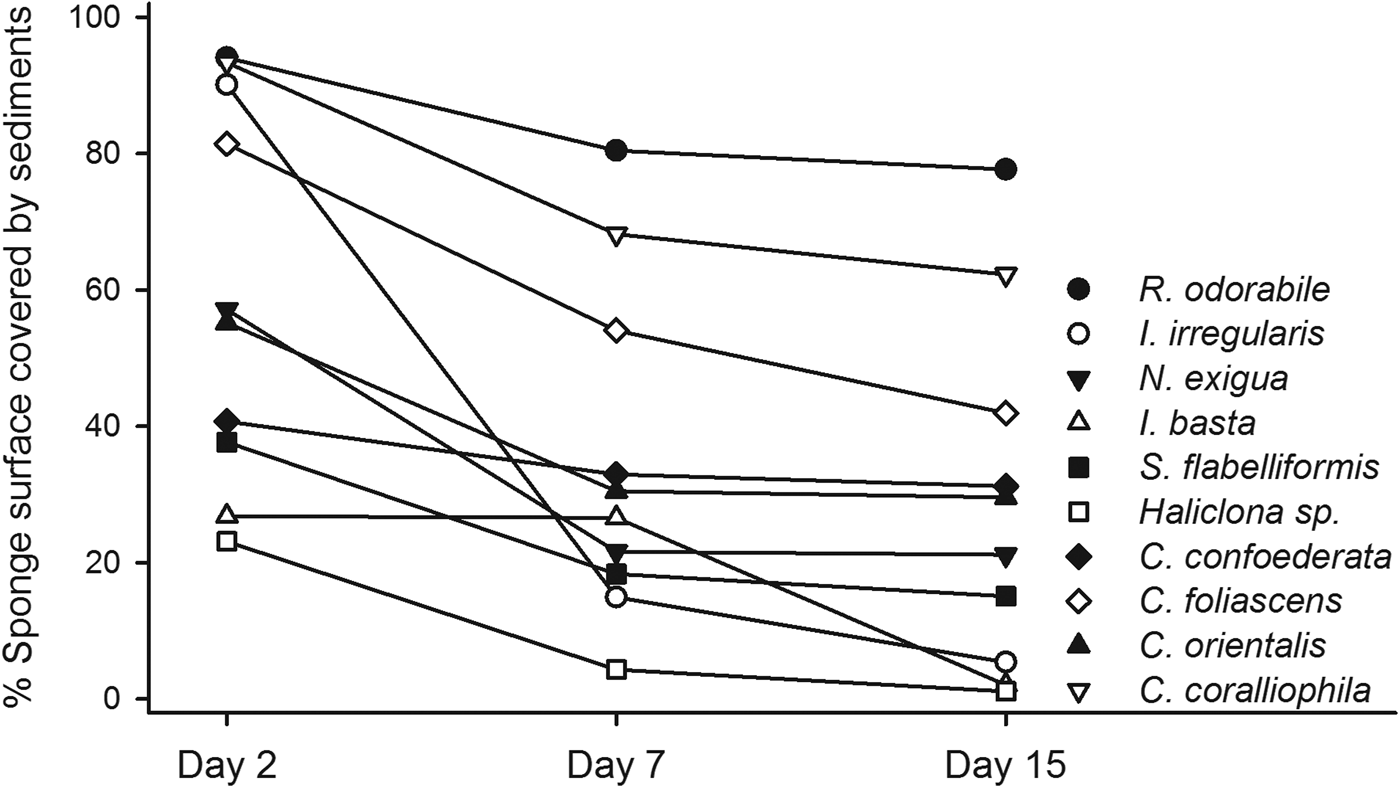
The percentage of sponge surface covered by sediments after 48 h differed significantly between treatments (ANOVA: P < 0.001, 0.03 for R. odorabile and C. orientalis, respectively) and morphologies (Table 4, Figure 3), with massive species having a greater coverage of sediments than cup and erect species. Nevertheless, the percentage of sponge surface covered by sediments decreased over time for most species, indicating an ability to remove some sediment from their surface tissue (Figure 4). This ability differed between species with R. odorabile removing less than 20% of the surface sediment and Ircinia irregularis removing 85% of the surface sediment after 15 days (Figure 4).
Percentage of sponge surface covered by sediments 2 days after the sediment pulse for all species, grouped by morphologies, at the three sediment treatments (control, medium and high).
Mean percentage of surface covered by sediments at day 2, 7 and 15 after sediment addition, for each sponge species at the high sediment treatment.
ANOVA examining the differences in percentage of sponge surface covered by sediments among the sponge morphologies after 48 h.

Significant Pairwise Multiple Comparisons (Holm–Sidak method).
MAS > CUP (P = 0.009), ERE (P = 0.010).
C < M (P = 0.025), H (P = 0.017).
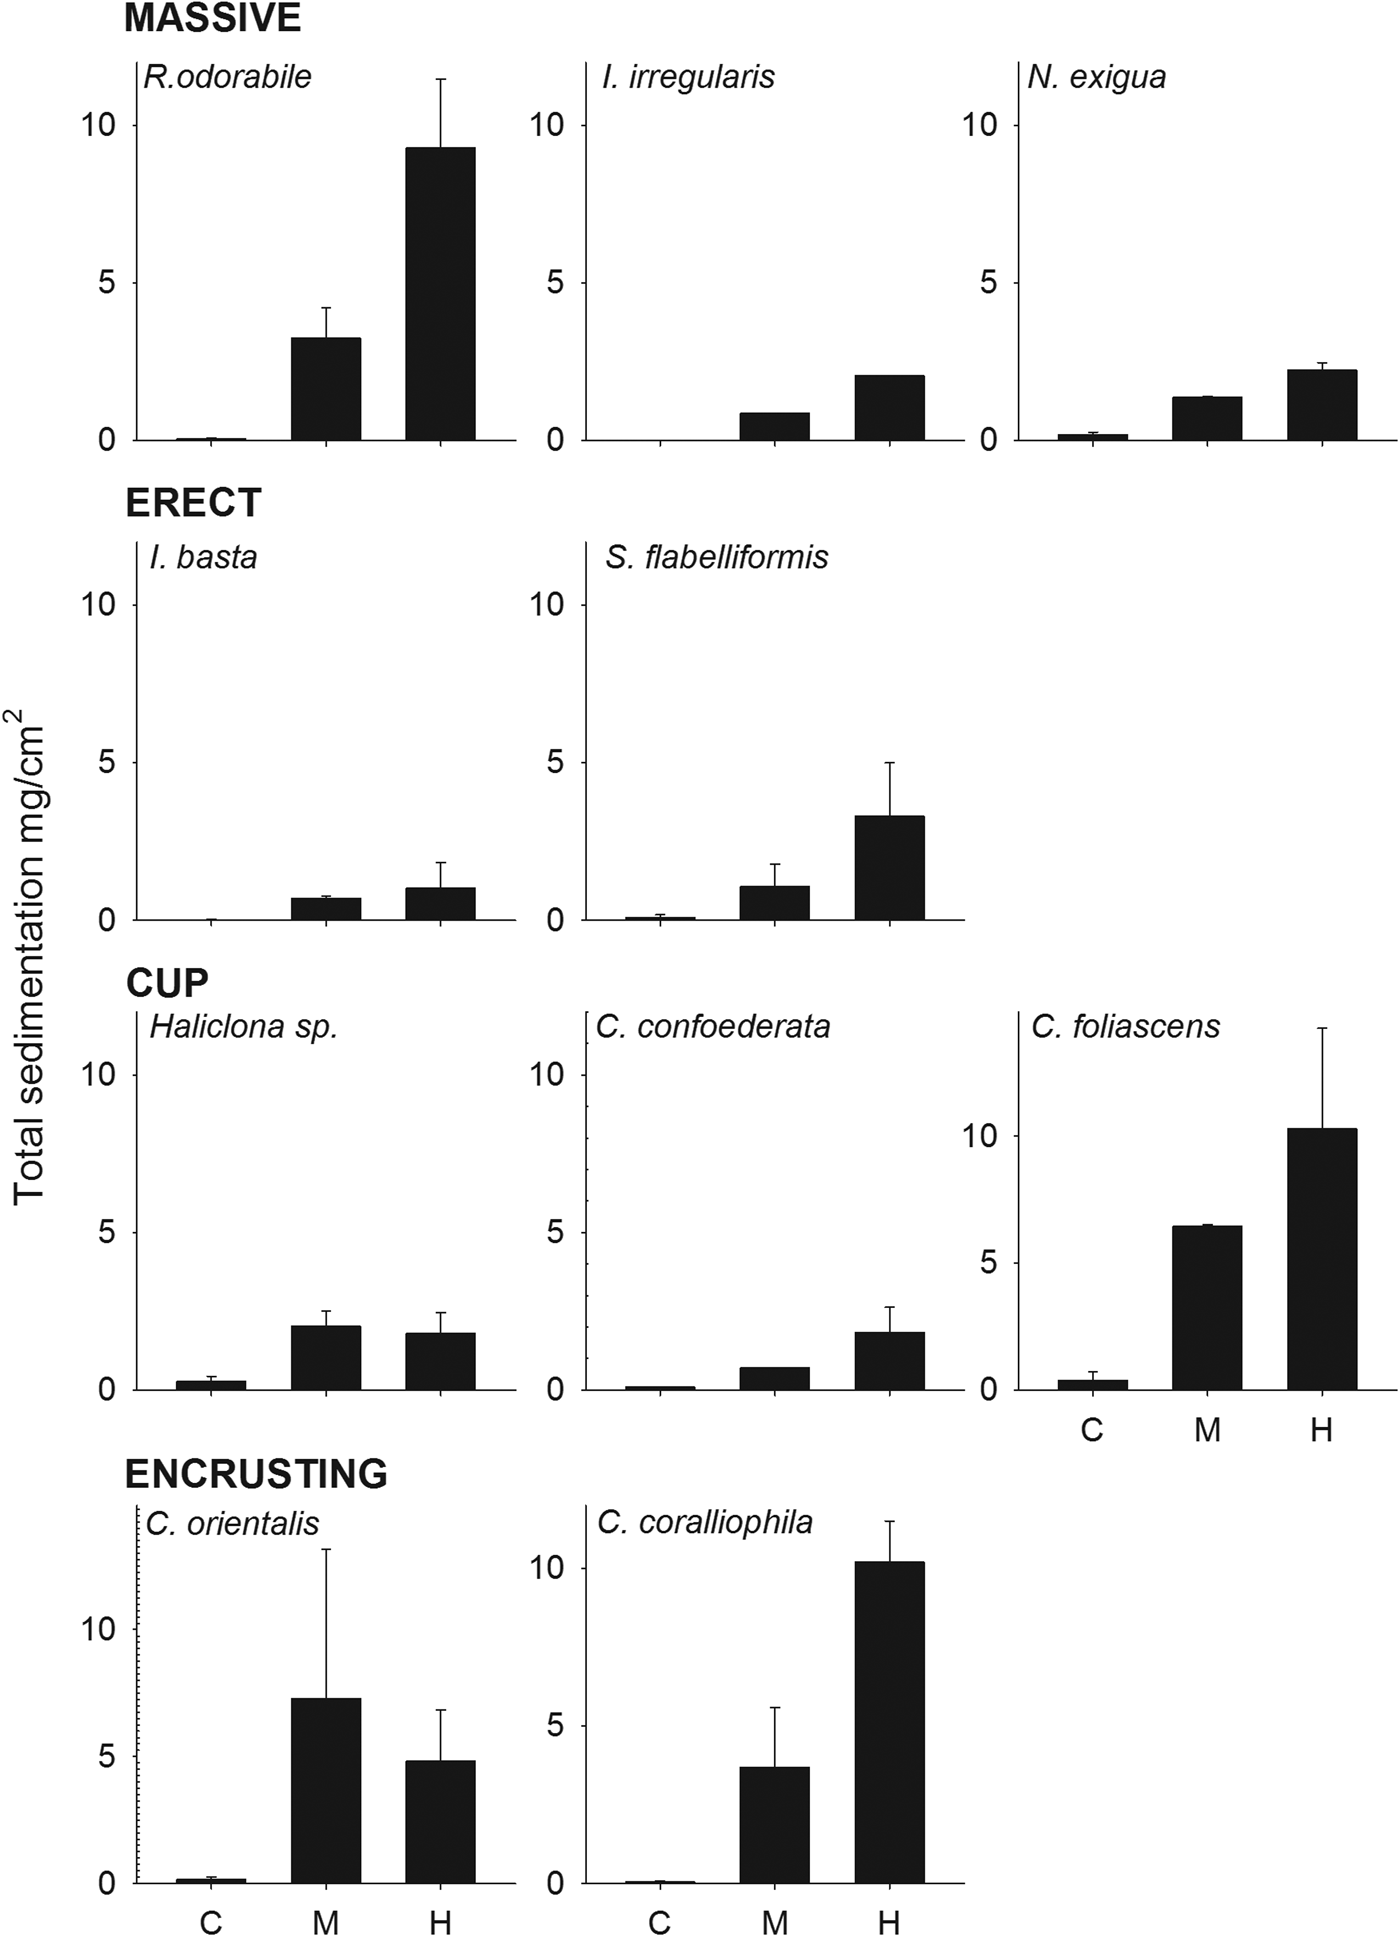
Total sedimentation onto sponges was significantly higher in the sediment treatments than the control (ANOVA: P < 0.001, 0.04 for R. odorabile and C. orientalis, respectively) and also differed significantly between the four main sponge morphologies (Figure 5, Table 5). Erect species received the minimum amount of deposited sediment while cup-shaped sponges, particularly those with a wide cup morphology, collected the highest amount of sediment (Figure 5, Table 5). No correlation existed between total sedimentation and sponge tissue surface area covered by sediments (R 2 = 0.218, P = 0.022).
Total sedimentation (mg cm−2) at the end of the experiment for all species grouped by sponge morphology, at the three sediment treatments (control, medium and high).
ANOVA examining the differences in total sedimentation among the sponge morphologies after 15 days.

Significant Pairwise Multiple Comparisons (Holm–Sidak method).
CUP > ENC (P = 0.049) > MAS (P = 0.025) > ERE (P = 0.013).
C < M (P = 0.025), H (P = 0.017).
Pigment analysis
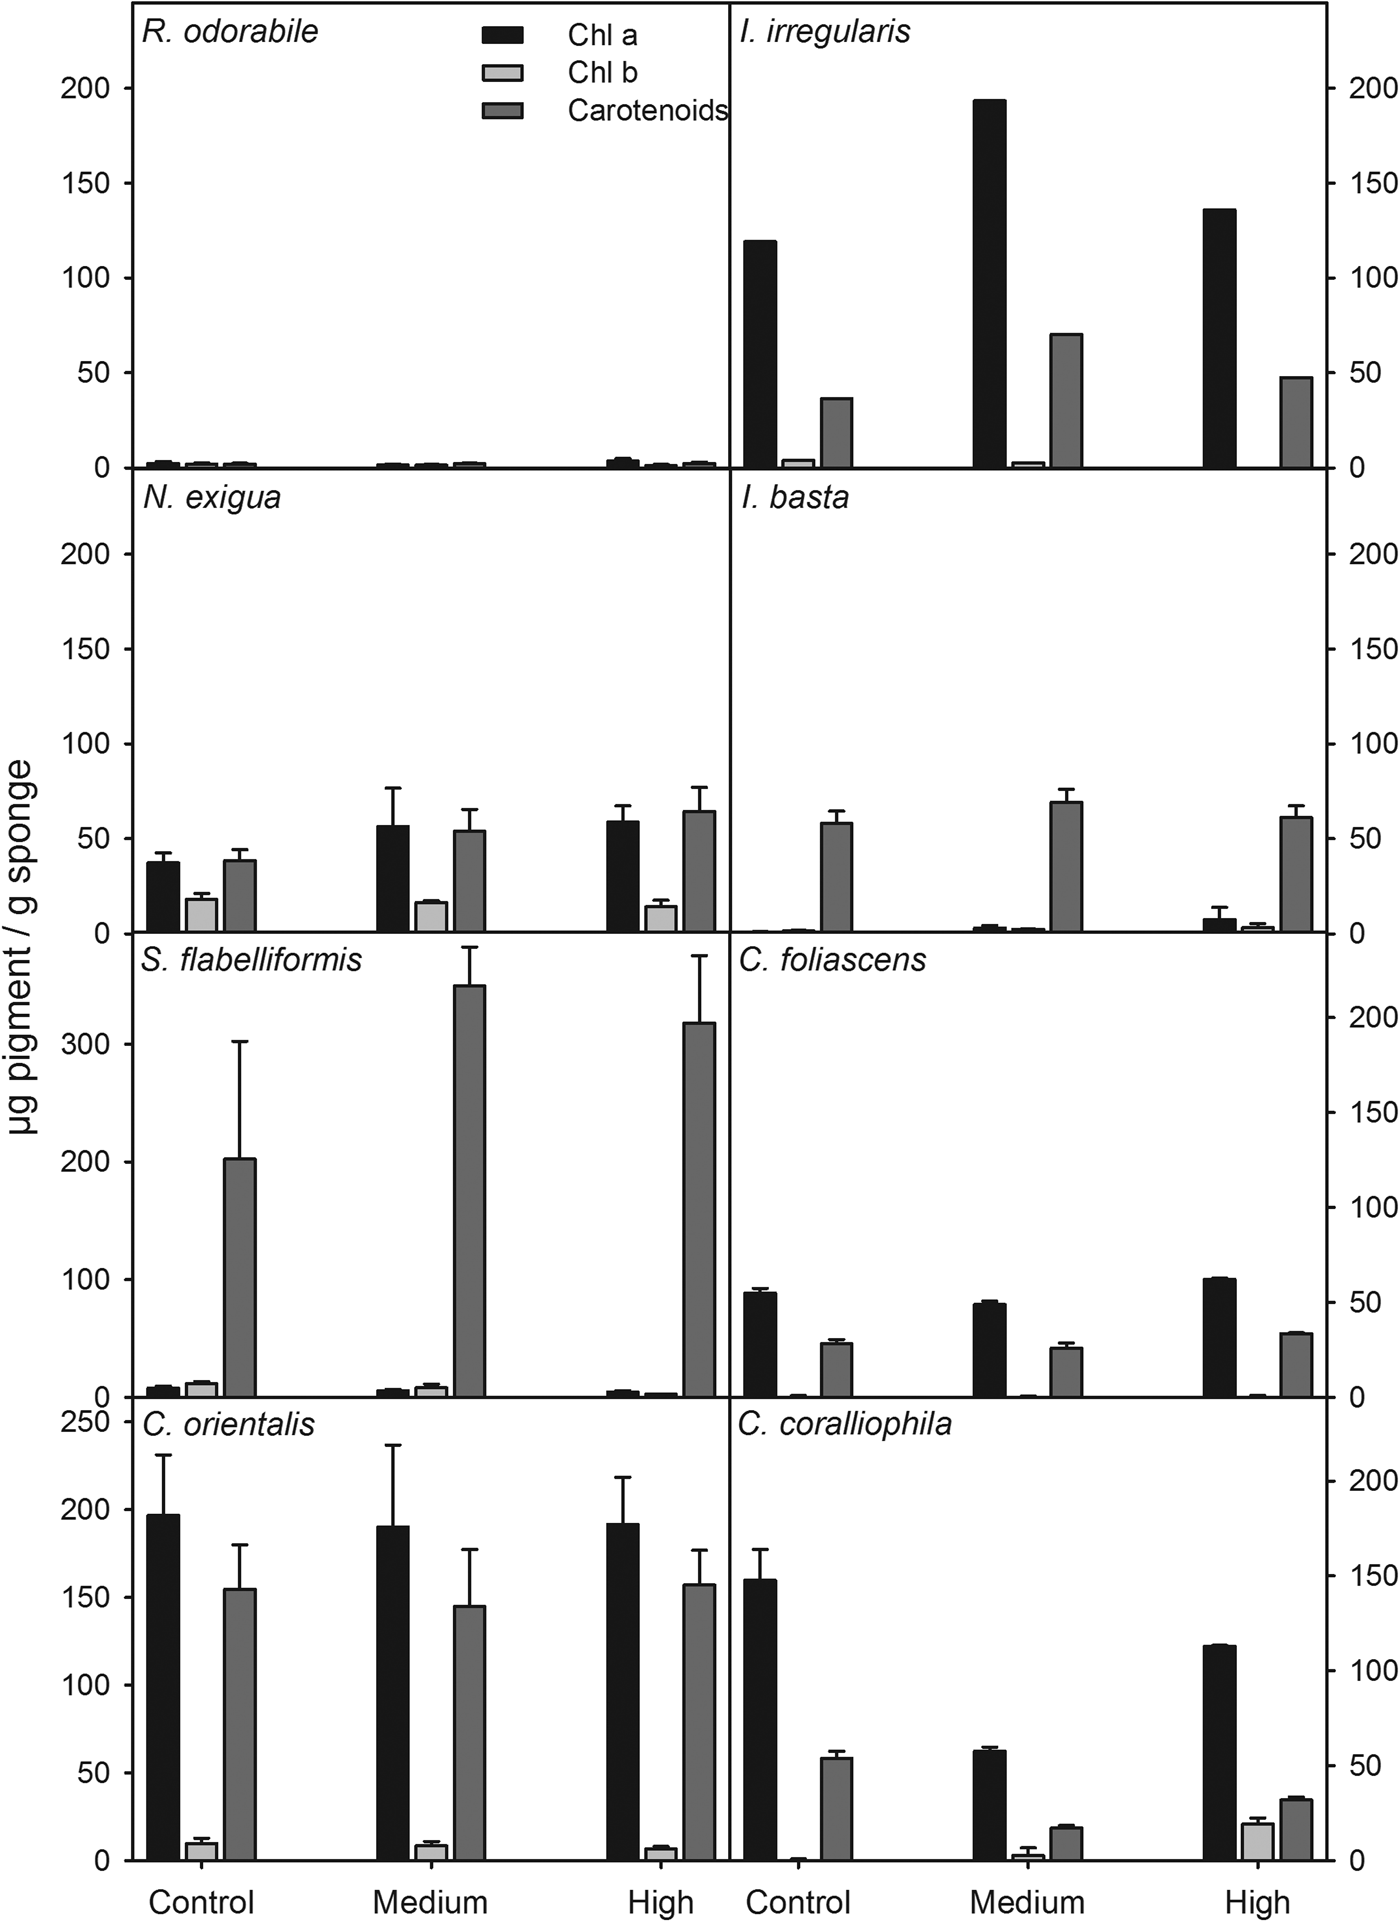
Due to high rates of mortality, pigment concentrations were not analysed for Haliclona sp. and C. confoederata. For the remaining species, the concentration of photosynthetic pigments did not differ significantly between treatments (ANOVA: P > 0.05 for all species). However, pigment concentrations and types varied between species and treatments. For example, R. odorabile had an extremely low concentration of chlorophylls and carotenoids, consistent with the absence of photosymbionts previously described for this species (Bannister et al., Reference Bannister, Hoogenboom, Anthony, Battershill, Whalan, Webster and de Nys2011) whereas I. basta and S. flabelliformis had low concentrations of chlorophylls, but high concentrations of carotenoids that decreased slightly with increasing sedimentation (Figure 6). The relatively high concentrations of Chl a in C. orientalis did not vary among treatments, while Chl b in this species was reduced slightly in the high sediment treatment (Figure 6). A slight increase in chlorophyll concentration in the sediment treatment compared with the control was observed in I. irregularis and Neopetrosia exigua (Figure 6). In general, concentrations of photosynthetic pigments were not reduced by the increasing sediment concentrations, although every species and every pigment responded differently.
Chlorophylls a, b and carotenoids (μg pigment/g sponge tissue) for all species at the three sediment treatments (control, medium and high).
Microbial symbiont analysis
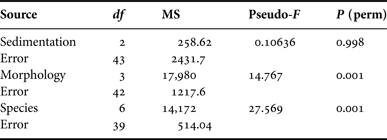
Microbial community profiling of replicate samples from Carteriospongia foliascens, C. orientalis, C. coralliophila, I. basta, N. exigua, R. odorabile and S. flabelliformis revealed 44 unique bands (corresponding to different microbial symbionts). The microbial profiles grouped according to species although some minor clustering according to sediment treatment was observable for C. foliascens, R. odorabile and C. coralliophila (Figure 7). The first two factors in the principal component analysis (PCA) explained 39.3% of the total variation (Figure 7). SIMPER analysis indicated high levels of similarity within species and moderate to high levels of similarity within morphologies: ≥50% for erect and encrusting, and ≥80% for massive and cup morphologies. PERMANOVA analysis of the microbial profiles revealed that microbial communities were significantly affected by host species and host morphology, but not by sedimentation treatment (Table 6).
Principal component analysis (PCA) of DGGE banding pattern profiles. Labels correspond to the sediment treatment (C, M and H).
PERMANOVA analysis for each factor separately.
DISCUSSION
Rapid deposition of sediments after an initial sediment pulse combined with a rapid drop in TSS within 48 h indicates that the primary pressures on sponges in this study were sediment covering the surface tissue or clogging of their aquiferous system. Although the tested sedimentation treatments are consistent with values observed near dredging operations (e.g. 300 mg l−1; Simpson, Reference Simpson1988), these sedimentation levels did not cause mortality during the 2-week experiment, except for Callyspongia confoederata. However, low levels of replication for this species precluded chlorophyll and symbiont analyses, making it difficult to reach definitive conclusions regarding the nature of the sediment sensitivity. Colour changes, generally indicating loss of photosynthetic symbionts or bleaching (Thacker, Reference Thacker2005; Roberts et al., Reference Roberts, Davis and Cummins2006), were not detected in any of the sponges that survived the experiment. Bleaching due to light attenuation may have occurred if there had not been such a rapid decrease in TSS or if the sediments had completely smothered the sponges.
All sponge morphologies shrunk when exposed to the high sediment treatment. Decreased or negative growth is likely linked to reduced feeding efficiency due to sediments clogging the sponge aquiferous systems (Gerrodette & Flechsig, Reference Gerrodette and Flechsig1979; Tompkins-MacDonald & Leys, Reference Tompkins-MacDonald and Leys2008). For example, the glass sponge Rhabdocalyptus dawsoni arrests pumping entirely in response to sediments (Tompkins-MacDonald & Leys, Reference Tompkins-MacDonald and Leys2008), the pumping rate of Veronia lacunosa has been shown to reduce with a sediment load as low as 11 mg l−1 (Gerrodette & Flechsig, Reference Gerrodette and Flechsig1979) and similar responses have previously been observed in other species of demosponges (Reiswig, Reference Reiswig1971; Lohrer et al., Reference Lohrer, Hewitt and Thrush2006). Additionally, sponges living under high sediment conditions can become energetically stressed with efforts to expel unwanted material, contributing to a depletion of their reserves in comparison to individuals inhabiting areas less affected by sediment (Roberts et al., Reference Roberts, Davis and Cummins2006; Tompkins-MacDonald & Leys, Reference Tompkins-MacDonald and Leys2008; Bannister et al., Reference Bannister, Battershill and de Nys2012).
Notable differences in the total amount of entrapped sediments and the percentage of sponge surface covered by sediments were observed between the different sponge species and sponge morphologies. In general, massive, encrusting and wide cup morphologies accumulated more sediment than erect species and the narrow cup morphology. This is consistent with what has previously been reported for other sponge species (Gerrodette & Flechsig, Reference Gerrodette and Flechsig1979; Bell & Barnes, Reference Bell and Barnes2000b; Carballo, Reference Carballo2006). Although specific mechanisms were not elucidated within the context of this study, the reduction in sediment covering the sponges over time suggests that either the sponges are actively removing the sediment from their surface (i.e. through their pumping activity, production of mucus, protrusion of spicules) or other in-fauna organisms are doing it for them. For instance, Iricinia irregularis in this study had many brittle stars living inside their oscula, which may have indirectly cleaned their surfaces as found for other species (e.g. Hendler, Reference Hendler1984; Turon et al., Reference Turon, Codina, Tarjuelo, Uriz and Becerro2000).
The weak correlation between total sedimentation and sponge area covered by sediments could be explained by the presence of algae overgrowing some of the sponge individuals by the end of the experiment. Algae attached to the surface of some sponges may have immobilized the sediments, making it difficult to remove and quantify the sediments. This would explain the observed underestimation in total sedimentation and highlights the critical importance of controlling algal growth in future experiments.
Chlorophyll and carotenoid analysis provided valuable data on pigment concentrations in each of the target sponge species. A reduction in Chl a has previously been reported in 90-days sediment-exposed (Roberts et al., Reference Roberts, Davis and Cummins2006) and 2 weeks-shaded sponges (Thacker, Reference Thacker2005), although these results were not statistically significant. However, elevated sediment concentrations did not appear to affect the production of any photosynthetic pigments in sponges over the 15-day exposure period. Moreover, the results were extremely variable among species and between pigments and no discernible trends in pigment behaviour could be determined according to sediment treatment. Therefore, the analyses of chlorophylls and carotenoids did not appear to be a valid proxy for sedimentation stress in sponges following a short-term sediment pulse. Nevertheless, longer-term experiments with higher levels of replication per species may result in more meaningful conclusions about the effect of sediments on sponge photosynthetic pigment production.
Assessment of microbial symbionts in the studied species revealed generally stable and species-specific communities with some similarity observed within morphologies. Shifts in the microbial communities of sponges have previously been reported in association with temperature and contamination stress (Webster et al., Reference Webster, Webb, Ridd, Hill and Negri2001, Reference Webster, Cobb and Negri2008; Simister et al., Reference Simister, Taylor, Tsai, Fan, Bruxner, Crowe and Webster2012a; Fan et al., Reference Fan, Liu, Simister, Webster and Thomas2013) although highly stable populations have also been reported in response to nutrient and sediment stress (Luter et al., Reference Luter, Whalan and Webster2012, Reference Luter, Gibb and Webster2014; Simister et al., Reference Simister, Taylor, Tsai and Webster2012b). Consistent with these latter findings, sedimentation treatments assessed in this study did not cause large shifts in the microbial communities of any species. Small differences between control sponges and sediment-treated sponges were detected in the two photosynthetic species Carteriospongia foliascens and Cymbastela coralliophila as well as the heterotrophic species Rhopaloeides odorabile, although greater replication would be required to determine if these shifts are truly significant. In addition, whilst we don't see the appearance of foreign microbes or the loss of stable microbes associated with sediment treatment, a shift in the relative abundance of the microbes within the host (not detectable using a DGGE approach) may still have functional implications for the holobiont. Further research using next-generation sequencing approaches would help elucidate whether higher sediment concentrations or longer exposure periods would trigger shifts in the sponge-associated microbial communities.
Dredging programmes often last for many weeks or months, possibly exposing benthic organisms to periodically high sediment loads, with sedimentation rates affected by TSS, sediment size and local hydrodynamics. In addition, residual plumes can persist in the area for months before TSS returns to ambient levels. In conclusion, our results show that high sedimentation primarily affected massive, encrusting and wide cup sponge morphologies. However, the sediment concentrations tested in this experiment did not appear to cause shifts in the pigment concentrations or microbial community structure of the sponges. These results indicate that a single short-term pulse of high TSS levels resulting in a sediment deposition rate of 16 mg cm−2 could be tolerated by most of the sponge species studied. Nevertheless, the long-term effects of high sedimentation, high TSS and light attenuation on sponges should be assessed before final conclusions on the effect of dredging on sponge communities can be drawn.
ACKNOWLEDGEMENTS
This research was funded by Woodside Energy, BHP Billiton, Chevron and the WAMSI partners as part of the WAMSI Dredging Science Node. The views expressed herein are those of the authors and not necessarily those of WAMSI. We are thankful to the Node leaders (Dr R. Jones and Dr R. Masini) for their advice and discussion of results. We are also grateful to A. Severati and J. Gioffre for assistance in the field. J. Doyle provided valuable advice on the chlorophyll analysis. Dr C. Schönberg contributed to the species identification and facilitated access to the dredging-related literature. B. Strehlow commented on a previous version of the manuscript.