

A theoretical literature has argued that extractive institutions both hinder economic growth and promote high inequality (Acemoglu and Robinson Reference Acemoglu and Robinson2012). Serfdom is an archetypal extractive institution that concentrates economic and political power within a small landed elite while restricting serfs’ control over their labor (Acemoglu and Wolitzky Reference Acemoglu and Wolitzky2011). According to the conventional view of serfdom, a small number of people controlled land, wealth, and capital, and extracted the surplus from serfs and other underprivileged classes, who received only subsistence incomes. However, empirical evidence regarding the level of inequality in serf economies remains limited. Specifically, there has been no quantitative investigation of income inequality and surplus extraction levels by elites in Russia—a quintessential serf economy.
This article studies income and its distribution in Moscow Province in the early nineteenth century. It uses new archival, granular, household-level data to capture the elite’s income from serfdom, among other sources, and shows that Russian elites were able to extract much of the surplus. Specifically, we construct a new dataset of the income of every Russian aristocratic family that resided in Moscow Province in 1811 and combine it with similar data on the property-owning elites belonging to other social classes. By combining household and group-level data, we estimate national income and Gini coefficient of income distribution, which, at 65, is comparable to today’s high levels.Footnote 1 Following the method developed by Milanovic, Lindert, and Williamson (Reference Milanovic, Lindert and Williamson2011) we also calculate the extraction ratio at 95 percent. Moreover, while confirming the high extraction levels in Moscow Province our detailed data also identifies 36 former serfs among the top 1 percent of earners. Thus, we are the first to provide a more nuanced quantitative picture of the economic impact of serfdom on inequality.
Studying Moscow Province provides valuable insights into the dynamics of inequality in Tsarist Russia, as it encompassed significant proportions of all major social classes, including serfs, state peasants, urban dwellers, aristocrats, and merchants. However, inequality in this province may have been higher than in the rest of the Empire. This is because Moscow housed a disproportionately large number of elite landowners whose estates were located outside the province, enabling them to reinvest profits and accumulate greater wealth.
Our work speaks to the tension in the literature between theoretical or macro-level work that emphasizes the extractive nature of serfdom, and micro-histories that highlight that serfdom was a relatively effective system given historical context (Acemoglu and Wolitzky Reference Acemoglu and Wolitzky2011; Dennison Reference Dennison2011; Engerman Reference Engerman and Bush1996; Domar and Machina Reference Domar and Machina1984; Malinowski Reference Malinowski2016a, 2016b; Markevich and Zhuravskaya Reference Markevich and Zhuravskaya2018; Dennison Reference Dennison2023). Our results suggest that both can be true: serfdom was (a) associated with low overall income levels, it (b) allowed the elite to capture a lion’s share of the national income, while it (c) also allowed for some mobility for the serfs to reach the top 1 percent of the income distribution. Therefore, this article points to a need for a better understanding of the inner workings of the serf economy with all its complexities. Moreover, when placed in a historical context, our results give quantitative evidence that serfdom was associated with high inequality and that similar levels of inequality have persisted despite the abolition of serfdom, five wars, three revolutions, and two radical changes in political regime.
We study the pre-tax and post-tax income of the population of Moscow Province, including the elites, in 1811, before the destruction brought about by Napoleon’s Grand Army. We examine the incomes of the entire population. Due to the composition of our data, we divide the population into two broad categories: (a) unique asset-holding elite households for which we compile household-level data, and (b) 21 types of other households without assets for which we estimate average incomes due to the lack of household-level data.Footnote 2
Regarding the asset-holding elite, we collected new archival evidence showing the income generated from land, factories, capital, and governmental posts held by the elite in Moscow Province. This extensive dataset includes 7,399 property-owning households, equivalent to around 3 percent of the total population, encompassing all registered landed aristocrats and merchant guild members, as well as property holders from other social classes, including serfs. Specifically, we collected comprehensive data on the income of individual aristocrats residing in Moscow Province, stemming from serf duties, primarily unpaid labor duties (corvée/barshchina) and paid levies (quitrent/obrok), performed on the land estates located both within and outside the province, enabling a thorough examination of the distribution of rents resulting from serfdom. The united income of this elite group was around 57 percent of the total income of the entire Moscow Province.
To account for the remaining 97 percent of households with no household-level data, we have compiled both previously published data and newly obtained archival information from both governmental and private bodies. With this data, we have reconstructed the average incomes of households from 21 distinct social groups, covering all social classes except the previously mentioned registered aristocrats and merchants, for whom we have gathered household-level data. By merging the 7,399 property-owning households with household-level data with 222,114 households belonging to one of the 21 groups with average incomes, we have constructed a detailed social table that provides an unprecedented level of granularity compared to many existing social tables of preindustrial societies, which often lack any household-level data.
Our main results underscore the historical presence and persistence of high inequality levels in Russia. The latest research on disparity in present-day Russia by Treisman (Reference Treisman2016) noted the unusually high number of billionaires, resulting in a high level of inequality in the country by global standards. According to Remington (Reference Remington2018), the disparities stemmed from Russia’s heavy reliance on natural resources both today and in the past. To showcase deep-rooted patterns of inequality, Lindert and Nafziger (Reference Lindert and Nafziger2014) provided comprehensive estimates of Russian inequality dating back to 1904 and identified a high concentration of income at that time (compare Novokmet, Piketty, and Zucman Reference Novokmet, Piketty and Zucman2018). Moreover, Chancel and Piketty (Reference Chancel and Piketty2021) studied the data available in the World Inequality Database and suggested that inequality in Russia remained roughly stable between 1820 and 1920, and that the emancipation of the serfs in 1861 was not followed by a sudden drop in inequality. While the last study focused on the territory of the entire country, our findings for Moscow Province in 1811 are a first step toward understanding inequality levels in Russia in the nineteenth century at a provincial level. We find that the Gini coefficient of the income distribution of national and provincial incomes was 65 and 57, respectively. By comparing our estimates with those provided by Lindert and Nafziger (Reference Lindert and Nafziger2014) for 1904, we find that these inequality levels remained high despite the emancipation of the serfs in 1861. We also identify a vast concentration of assets within the hands of a narrow group of aristocrats, mirroring the concentration seen among present-day oligarchs. Moreover, our analysis of the income data highlights the highly extractive nature of serfdom, resulting in levels of inequality approaching theoretical limits (extraction ratio equal to 95 percent).
Our study contributes to the economic history literature in several ways. First, our research complements existing studies on long-term wealth and income concentration among elites, addressing common limitations (Alfani Reference Alfani2021). Traditional economic historians used tax data to study wealth and income inequality, but this overlooked individuals without property who were not taxed. Our approach addresses this by leveraging Russia’s caste-based system, where all aristocrats, regardless of property ownership, submitted tax returns. By using self-reported income data from the elite and new estimates for 21 social groups in Moscow Province, we more accurately capture inequality, avoiding the distortions caused by assumptions about top earners’ incomes in pre-modern tax systems.
GINI COEFFICIENT OF INCOME DISTRIBUTIONS OF PRE-TAX AND POST-TAX INCOMES

Source: See the text.
Second, our research contributes valuable insights to the ongoing discussion about the economic consequences of extractive institutions, such as serfdom (Acemoglu and Wolitzky Reference Acemoglu and Wolitzky2011, Stanziani Reference Stanziani2010; Buggle and Nafziger Reference Buggle and Nafziger2021; Dennison Reference Dennison2011; Domar Reference Domar1970; Hoch Reference Hoch1986; Malinowski Reference Malinowski2016b; Markevich and Zhuravskaya Reference Markevich and Zhuravskaya2018; Moon Reference Moon1996; Mironov Reference Mironov2010; Ogilvie and Carus Reference Ogilvie, Carus, Aghion and Steven2014; Dennison and Nafziger Reference Dennison and Nafziger2013). Russian serfdom has mostly been studied through the prism of the records left behind by individual estates employing modern accounting techniques, thus potentially suffering from selection bias and lacking an aggregate perspective. While serfdom is commonly recognized as an extractive and growth-limiting institution, the empirical evidence supporting this assertion has been limited to the recent work by Malinowski and van Zanden (2017) on sixteenth-century Poland. However, no such quantitative analysis has been conducted for pre-emancipation Russia, except for the work of Mironov (Reference Mironov2000), who excluded the aristocracy and peasantry, and thus serfdom, from his study. We contribute to these discussions by examining pre-tax and post-tax income and its distribution within the framework of the Inequality Possibility Frontier proposed by Milanovic, Lindert, and Williamson (Reference Milanovic, Lindert and Williamson2011). We expand on individual estate studies with an aggregate analysis of all estates, supporting the view that serfdom is linked to high inequality and low growth. Our findings show that Moscow Province was relatively poor per capita, and its regressive tax system exacerbated already high pre-tax inequality, with Gini coefficients of 65 pre-tax and 67 post-tax. Using the Inequality Possibility Frontier framework, we demonstrate that serfdom was highly extractive, nearing its theoretical peak.
Third, Marxist historians argued that Russian serfdom was unprofitable, which led to its ultimate abolishment (Pokrovskii Reference Pokrovskii1934). This thesis was empirically and theoretically challenged by Domar and Machina (Reference Domar and Machina1984), who argued that the profitability of Russian serfdom was not threatened by the rise in grain prices, the growth of population, the use of the quitrent, or Paul’s legal restriction limiting labor services to three days a week. The authors, however, used only fragmentary evidence and did not observe the aristocratic profits directly. This article contributes to the debate by analyzing detailed archival information on aristocratic incomes and attributing the high inequality levels to serfdom and income concentration among the aristocratic elite. Specifically, we uncover that income derived from serfdom accounted for a significant portion of the elite’s income, with the aristocracy (comprising roughly 1 percent of the population) deriving as much as 34 percent of within-province or 14 percent of the national income of Moscow Province, even after accounting for income from industry.Footnote 3 This reaffirms the understanding of serfdom as a cornerstone of the Russian socio-economic structure and a primary source of high income for the elite.
Fourth, according to the literature, despite various limitations to their mobility, for the most industrious serfs, economic advancement within the system was possible (Moon Reference Moon1996; Dennison Reference Dennison2011; Stanziani Reference Stanziani2010). Our study sheds light on this issue. It reveals that members of all social classes had the potential to enter the top 1 percent of income earners due to their incomes from factories and trade. However, due to the limited industrial production and access to trade, the top 1 percent remained largely dominated by the aristocracy. These findings underscore the predominantly agrarian nature of Russian society at the start of the nineteenth century. We study the merchant census of 1811 (Naydenov Reference Naydenov1887) and identify 36 former serfs who entered the top 1 percent of households by income and registered as guild merchants, thus losing their formal former serf status. We find no individual who retained the serf status in the top 1 percent.
Fifth, Alfani and Di Tullio (Reference Alfani and Di Tullio2019) proposed that regressive taxation contributed to high inequality levels in preindustrial societies. We compare pre- and post-tax income inequality levels. Tsarist Russia had limited fiscal capacity and taxation levels (Mironov Reference Mironov1992). We therefore find that direct taxes accounted for only 4 percent of national income and that taxation had only a marginal effect on income distribution. However, it is likely that this small difference compounded over time and contributed to the high general inequality levels.
OVERVIEW OF RUSSIAN SERFDOM
Imperial Russia was characterized by scarce labor and abundant land. The population was divided into various estates, each carrying specific tax obligations and legal rights. In this text, we will follow the established terminology that labels all the agricultural workers as peasants, who are further sub-divided into serfs, state peasants, court peasants, and free agriculturalists. This analysis centers on serfs and state peasants, who accounted for the lion’s share of all peasants.
The central state institutions in Russia lacked the capacity to fully control their vast territory (Velychenko Reference Velychenko2001; Korchmina Reference Korchmina, Franklin and Bowers2017). This decentralization of authority resulted in regional governance by local assemblies of the aristocracy and urban self-governing bodies. Decentralization granted the landed aristocracy the means to maintain their legal privileges, but also imposed on them the obligation to support serfs during times of famine. Simultaneously, it empowered serfs to engage in negotiations regarding the terms of their obligations and the assistance they could request. These ongoing negotiations between landowners and serfs resulted in a significant diversity of serfdom practices throughout Russia. Thus, Russian serfdom constituted a blend of formal and informal arrangements between landlords and village communes. Nonetheless, some common features of Russian serfdom, typical for the central European provinces, can be identified (Dennison Reference Dennison2011).
First, as it was a feudal economy, the lion’s share of land in Russia was owned by the Tzar, the state, or the aristocracy. All estates, including peasants and peasant communities, could lease land from those owners. This enabled wealthier peasants to request additional land, albeit at an extra cost. Specifically, through special legal practices, serfs could effectively lease land on behalf of an aristocrat. In these instances, the de facto lessee would receive all revenues from the land, which were documented in legal records and subject to taxation. This practice enabled serfs, state peasants, and merchants to establish their own manufacturing enterprises.
Second, while state peasants resided on state-owned land, serfs lived on the land owned by the aristocracy. This distinction resulted in differential tax obligations. While both state peasants and serfs were obligated to pay the poll tax (semigrivennyi) administered by the village commune, only state peasants had to pay an additional monetary tax (chetyrekhgrivenyi). According to Mironov (Reference Mironov2010), this tax was typically of lower value than the corvée paid by the serfs in unpaid labor or quitrent, monetary compensation for forgone corvée.Footnote 4 Only aristocrats had the privilege of utilizing serfs for agricultural and industrial production without the need to provide wages. Aristocrats managed their demesnes primarily using unpaid serf labor. Consequently, their income from land could be equated with rent and income from serf labor (Kula Reference Kula1987; Domar and Machina Reference Domar and Machina1984).
Third, according to the conventional view, each aristocrat negotiated the size of quitrent and corvée with the village commune. The commune was responsible for allocating these obligations among its members. Serfs who paid quitrent typically received more land to accommodate the monetary payment. The available evidence, based on surviving records of private estates, suggests that by the early nineteenth century, at least half of all duties were settled through quitrent payments (Dennison Reference Dennison2011). Nevertheless, these studies may be subject to selection bias, as more modernized and market-oriented estates were more inclined to favor monetary over labor obligations (Stanziani Reference Stanziani2010).
Fourth, the traditional method of distributing land among serfs and state peasants by their communes aimed for fairness. In principle, each household received land in proportion to its size, preventing excessive concentration. Additionally, there was also limited “free/unassigned” land. The well-to-do serfs and state peasants could rent it from either their communes, directly from the aristocrats, or from the state (Fedorov Reference Fedorov1974; Aleksandrov Reference Aleksandrov1976). However, in Moscow Province, the free land comprised only about 1 percent of the total land area, indicating that the availability was limited (Vodarsky Reference Vodarsky1988).
Fifth, serfs were subject to the jurisdiction of their landlords and represented by the aristocrat in external disputes. In the event of conflicts with their landlord, serfs had no recourse to appeal to the emperor; instead, their grievances were addressed in regional courts to which they could not be elected. However, landlords could not unilaterally increase duties without risking a violent uprising. Consequently, the aristocracy cooperated to align fee levels across their estates.Footnote 5
Sixth, serfdom imposed legal restrictions on mobility. According to the Muscovite Law Code, Ulozhenie, published in 1649, to travel beyond approximately 30 versta from their villages, serfs were required to obtain written passports from the state, along with permission from their landlords. This constraint hindered urbanization, industrialization, and trade. Engaging in trade necessitated guild membership, obliging serfs and state peasants to acquire licenses for selling their products in the market.
According to conventional wisdom, serfdom had adverse effects, including limited economic output, contributed to high inequality, and facilitated resource extraction. This was achieved through several means: (1) constraining migration from the agricultural to the urban sector; (2) discouraging agricultural productivity by undermining incentive structures (higher output incentivized landlords to increase duties resulting in a ratchet effect); (3) hampering the accumulation of human capital; and (4) decreasing the purchasing power of the villagers (Dennison Reference Dennison2011; Ogilvie and Carus Reference Ogilvie, Carus, Aghion and Steven2014).
Acemoglu and Wolitzky (Reference Acemoglu and Wolitzky2011) provided a theoretical model outlining that coercion is “always ‘socially inefficient’, because it involves a costly way to transfer resources from workers to employers.” Markevich and Zhuravskaya (Reference Markevich and Zhuravskaya2018) identified empirically that serfdom stifled agricultural productivity. Buggle and Nafziger (Reference Buggle and Nafziger2021) suggest that the legacy of serfdom continues to hinder industrial development and household expenditure in present-day Russia.
Other scholars argue that Russian serfdom and economic growth were not incompatible (Melton 1988; Hagen Reference Hagen2002). A stream of literature portrays serfdom as a dynamic institution that sustained a considerable rate of economic development (Hoch Reference Hoch1986; Moon Reference Moon1996; Mironov Reference Mironov2010; Dennison Reference Dennison2011; Stanziani Reference Stanziani2010). This view posits that serfdom, in some cases, sustained economic development, allowing entrepreneurial serfs to navigate its limitations by indirectly renting land, acquiring trade licenses, and establishing industrial production. In this article, we discuss specific evidence of such limited serf involvement in industry.
Some scholars who studied countries other than Russia argue that serfdom, in general, helped force the commercialization of agricultural output in societies with scarce labor supplies and underdeveloped markets (Lampe and Sharp Reference Lampe and Sharp2018). North and Thomas (1973) argued that the improvement in market conditions in the nineteenth century contributed to the abolishment of serfdom. Bush (Reference Bush1996) argued that surplus extraction by the demesne created large-scale commercial farming that would not have been created by free workers (Kula Reference Kula1987). Fenoaltea (Reference Fenoaltea1975) claimed that supervised coerced labor is more productive and therefore “cost-effective” than self-supervised free wage labor on estates specialized in a single effort-intensive cash crop. Malinowski (Reference Malinowski2016b) argued that serfdom ensured the commercialization of agricultural production that would be withheld from the market during a time of market crisis.
Concerning the distributional impact of serfdom, Russian historiography generally asserts that serfdom heightened economic inequality by restricting serfs’ economic opportunities and social mobility. For example, Jones (Reference Jones1997) argued that the inequality was high because the Russian state kept the poll tax low, which allowed the landlords to extract more surplus. Moreover, Dennison (Reference Dennison2011) discussed in detail how, by demanding duties, landlords aggregated inequalities and locked poor serfs, especially widowed women, in poverty. This argument has been based on qualitative evidence. We advance this literature by a comprehensive quantitative analysis of income and its distribution in Moscow Province in 1811.Footnote 6
Moscow Province
The establishment of Moscow Province dates back to 1782. It was one of the two capital regions in Russia. Around 1800, while Saint Petersburg served as the country’s administrative center, boasting a population of 336,000 inhabitants, Moscow City, with its 270,000 residents, served as its commercial nucleus, often referred to as the “heart of Russia,” located in the Russian Central Economic Region (Tsentralno-Promyshlennyi). While European Russia had an average urbanization rate of around 4 percent, due to hosting the second-largest city, Moscow Province boasted an urbanization rate of approximately 22 percent by 1800, making it the second-most urbanized region in the country (Online Appendix H1). Moscow Province accounted for roughly half a percent of the total landmass and 4.02 percent of the population of European Russia (Mironov Reference Mironov2000). In 1811, it had a population of approximately 1.2 million people and covered an area of about 33,000 square kilometers. This translates to the highest population density in the country of around 40 people per square mile (versta) (Rashin Reference Rashin1956).
As an urban, administrative, and educational center, Moscow had many skilled professionals. Those higher levels of human capital set it apart from most of the Empire. Furthermore, 16 percent of all factories in Russia were situated in Moscow ProvinceFootnote 7 alongside efforts to develop the textile, copper, and brick industries in the region (Golitsyn Reference Golitsyn1807). We use detailed industrial census data to shed light on the issue (Online Appendix B).
On the other hand, the province was not especially well-suited for agriculture. A report submitted by the Province’s Governor to the Minister of Internal Affairs in 1810 described the province’s agriculture and animal husbandry as very poorly developed (RGIA, f. 1281, op. 11, d. 82). The availability of free land in the province dwindled already before the nineteenth century, and the amount of harvested grain per capita was 30 percent lower than the average in European Russia (Nefedov Reference Nefedov2005). Additionally, the amount of land per male taxpayer ranked among the lowest of the 26 provinces in European Russia (Ignatovich Reference Ignatovich1925; Kovalchenko Reference Kovalchenko1967). According to Milov (Reference Milov2001), due to underdeveloped animal husbandry, agriculture lacked investments in natural fertilizers. The observations of past officials and historians align with modern soil suitability data from the Food and Agriculture Organization. According to recent soil quality data, the unweighted mean soil quality for low rye in Russia was 6,549, while the same parameter for Moscow Province is 5,706,Footnote 8 which places Moscow among the less suitable provinces in Russia for agricultural production of rye (Broadberry and Korchmina Reference Broadberry and Korchmina2024). Due to these conditions, many serfs and peasants were involved in non-agricultural occupations, including work in rural factories as well as seasonal employment in Moscow. However, despite these limitations, agriculture remained the dominant sector.
Moscow in 1811 is particularly well-suited for studying serfdom for several reasons: the structure of the serf-based economy at that time, the characteristics of the Moscow elite, and the advantages provided by Moscow’s status as the capital.
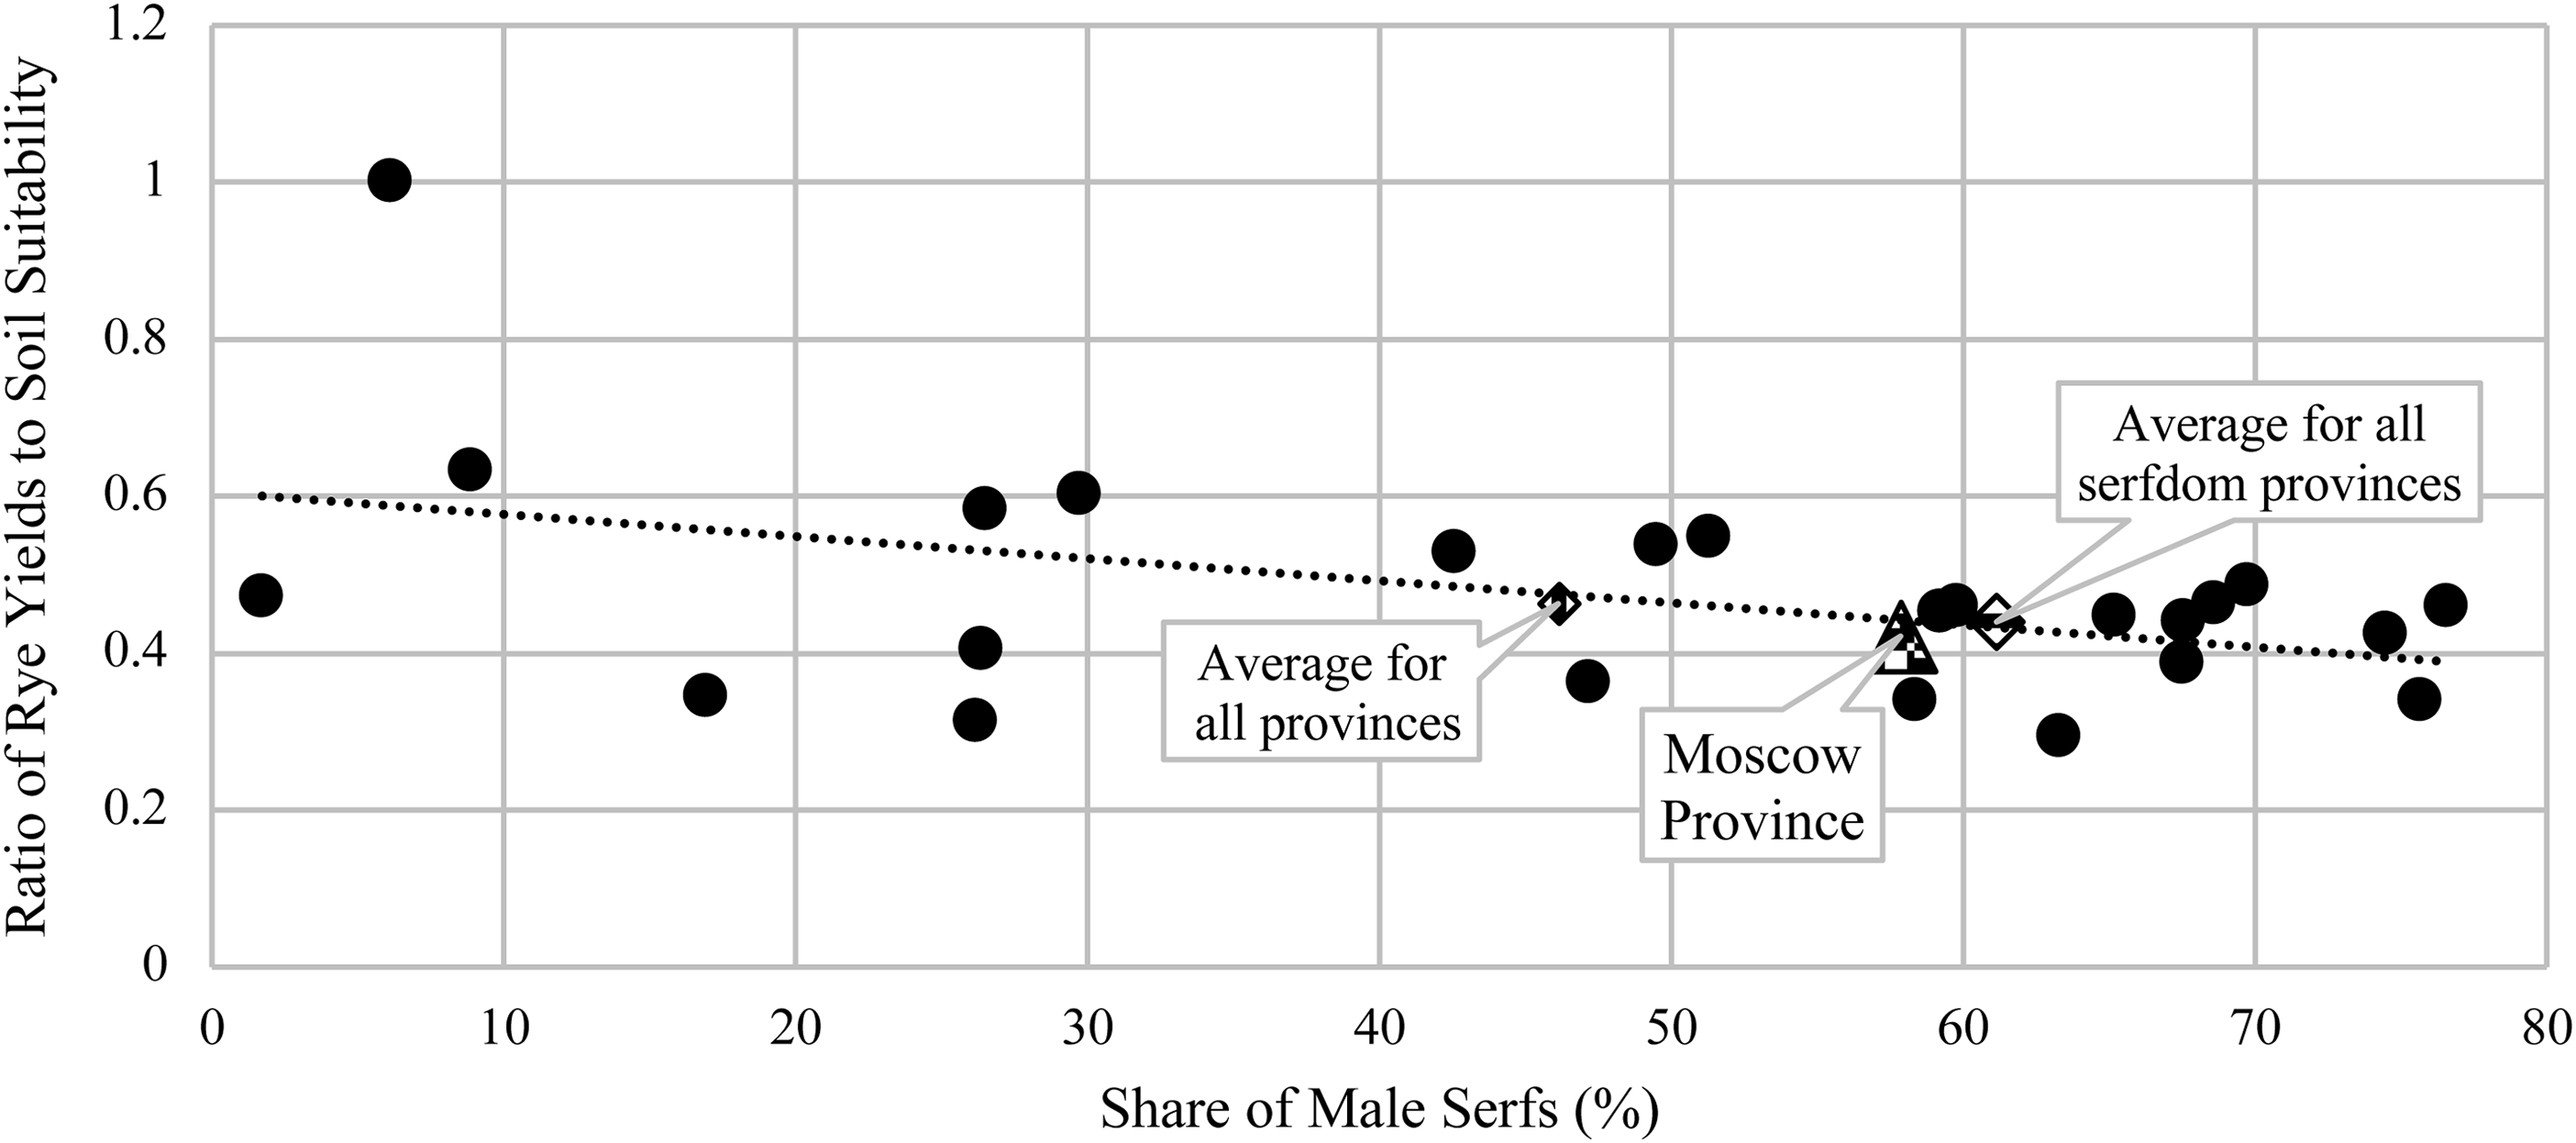
Comparing Moscow with other serf-dominated provinces reveals that it was, in many ways, an “average” serfdom province, as illustrated in Figure 1, which highlights two key indicators: the proportion of male serfs within the total male population and the ratio of rye yields to soil suitability, a measure of agricultural efficiency. The data suggest that Moscow Province had relatively low agricultural efficiency, similar to other provinces with high concentrations of serfs, particularly those classified as “serfdom provinces,” which generally exhibited mediocre or below-average efficiency. Notably, Moscow’s agricultural productivity closely aligns with the overall average for serfdom provinces, reinforcing our argument that Moscow is highly representative of such regions in terms of agricultural practices. Moreover, since the serf population declined during the first half of the nineteenth century, our 1811 estimate captures serfdom at its peak (Hoch Reference Hoch1986).
PLACE OF MOSCOW PROVINCE IN THE CONTEXT OF SERFDOM PRODUCTIVITY WITHIN RUSSIA
Notes: On the y-axis, the coefficient represents the ratio of average rye yields for 20 years per province divided by soil suitability based on rye, multiplied by 1,000 for presentation purposes. Average for serfdom provinces is calculated for provinces where the share of serfs is higher than 40 percent.
Source: Online Appendix H2.

Moscow was also home to many aristocrats who owned estates across the Empire (Online Appendix J1). The aristocratic shares of the population in Moscow Province were 1.3 percent compared to the 0.8 percent average. This highlights the socio-economic concentration of the elite in the city. This high status of Moscow’s aristocracy and their access to arable land outside of Moscow Province, particularly to the south, allowed them to reinvest the gains from serfdom to develop better infrastructure, educational services, and industry to support their consumption in Moscow city, where they resided.
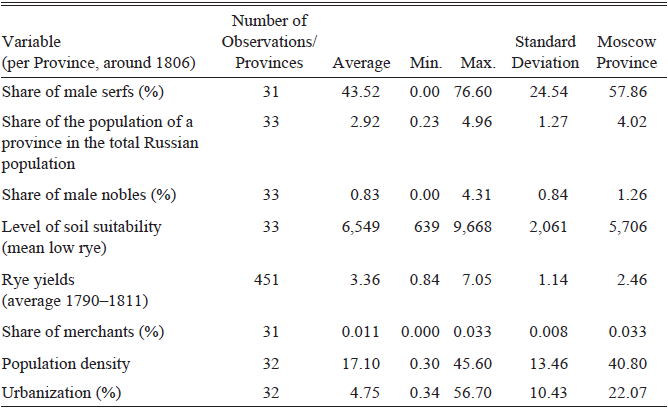
Table 2 provides a summary of the key indicators that place Moscow Province within a wider Russian context around 1806.
SUMMARY OF KEY PROVINCIAL VARIABLES FOR MOSCOW

Source: Online Appendix H2.
Therefore, the Moscow region serves as a potential testing ground for exploring alternative development paths for Russia in the nineteenth century, addressing the question of whether growth under serfdom and extraction was possible.
DATASET OF PRE-TAX INCOMES OF 7,399 ASSET-HOLDING HOUSEHOLDS WITH INDIVIDUAL-HOUSEHOLD-LEVEL DATA
We have created an extensive dataset that provides detailed information about the individual incomes of the asset-holding elite in pre-1861 Russia (see Korchmina and Malinowski 2025). It includes all aristocrats and registered merchants, as well as selected asset-holding members from other groups, such as serfs. In total, it comprises 7,399 households, which accounts for approximately 3 percent of the population. Specifically, the dataset includes information about their pre-tax incomes derived from the following sources: (A) owning land in the case of aristocracy (serfdom), (B) renting out houses, (C) running factories (industry), (D) obtaining posts in civil service, and (E) investing capital in trade in the case of merchants.
Declared Income from Land
In February 1812, the Russian government introduced an income tax, which was collected annually until 1819. Tax declarations had to be submitted once a year for the current year, except for 1812 when the incomes were submitted for 1811. This tax primarily targeted the previously untaxed income of the aristocracy generated from immovable property, including quitrent and corvée obtained from serfs. The tax applied to all aristocrats, regardless of their income. Those with declared incomes below 500 assignat rubles (hereafter AR) were exempt from taxation, while incomes exceeding 500 AR were subject to progressive taxation ranging from 1 to 10 percent (Online Appendix I1). We collected all 5,581 income declarations submitted by aristocrats residing in Moscow Province for the year 1811.Footnote 9 These declarations were submitted by men, women (married, unmarried, and widows), and trustees on behalf of children who could own property independently.
We have matched individuals into households, considering taxpayers’ surnames, first names, patronymic names, ranks, and titles. To match a household, we looked for a husband and wife. Noblewomen in Russia held the same surname and rank as their husbands. This allowed us to match a husband and wife with a high level of accuracy. For additional certainty, we checked the timing of the tax returns. If the married couple submitted their tax returns around the same time, we assumed they lived together. We also consulted additional family-specific genealogical sources. We kept children in separate households if they submitted tax returns separately from their parents.
Our dataset provides an extensive view of the elite’s income, including data on the total number of estates they own and the number of estates in each province (although it does not break down income by estate). In total, we have identified 2,717 individual aristocratic households owning 6,916 estates, with 2,168 of these estates located in Moscow Province (Online Appendix J1). This dataset offers a valuable resource for understanding the income sources and economic activities of the Russian aristocratic elite during this period.
The taxable income reported by aristocrats was shared during the Aristocratic Assembly. Korchmina (Reference Korchmina2022) confirmed the reliability of this source by cross-referencing tax returns with estate accounts. The fear of public exposure acted as a deterrent, ensuring accurate tax declarations for several reasons. First, inaccuracies could limit nobles’ access to credit. Second, undervaluing income could damage their reputation in the marriage market. Third, fellow aristocrats could challenge inaccurate declarations, forcing the offender to pay double the tax. These factors, along with the elite’s desire to protect their property and maintain social order amid the Napoleonic threat, motivated tax compliance.
The income of the landed aristocracy from land consisted of serf duties. 1,613 aristocratic households declared both their total income from all their estates and the total number of male serfs living and working on all their land. Figure 2 charts that there was a strong and directly proportional relationship between the total number of male serfs and the landlords’ incomes (the number of declared serfs explains as much as 83 percent of the variance of the reported incomes). This close correlation suggests that (1) serf duties were the main source of the aristocracy’s income from real estate; (2) land was their main real estate; and (3) the total income declared by the aristocracy approximates the total income from serfdom. In sum, aristocrats declared an income of 17 million AR from serfdom, which we estimate to represent as much as one-third of the national income; that is, income generated both within and outside of the Moscow Province for its inhabitants—or 14 percent of the within-province income, which is income generated only within the province. The difference stems from the fact that, as already discussed, Moscow aristocracy owned estates located both within and outside of Moscow Province.
CORRELATION BETWEEN THE TOTAL NUMBER OF MALE SERFS AND THE INCOMES FROM PROPERTY DECLARED BY THE 1,613 MEMBERS OF THE LANDED ARISTOCRACY RESIDING IN MOSCOW PROVINCE FOR 1811
Notes: Based on the dataset of individual incomes. To retain the scale, six outliers with astronomical incomes were excluded (incomes are in assignat rubles).
Sources: See the text and Table 3.

The benefits of serfdom were not distributed equally among the landed aristocrats. The detailed income owned by each decile of population is available in Online Appendix A. Reported incomes varied widely, ranging from zero to an astonishing 500,000 AR, which was declared by Anna Orlova-Chesmenskaya. Figure 3 presents a Lorenz curve of reported incomes. The Gini coefficient of income distribution was exceptionally high within this elite group, reaching 72.5 (excluding 34 zero-income aristocratic households) or 73.4 (including those households). This translates into a high income distribution across the whole population (Figure 5).
LORENZ CURVE OF THE DISTRIBUTION OF THE DECLARED ARISTOCRATIC GROSS, PRE-TAX INCOMES FROM PROPERTY/SERFDOM
Source: See the text.

GLOBAL GDP/GDI PER CAPITA ESTIMATES IN 1990$PPP AROUND 1820 Sources: Our calculations for Russia, “How was Life” OECD report (van Zanden et al. 2014).

LORENZ CURVE OF THE INCOME DISTRIBUTION OF THE WHOLE POPULATION IN MOSCOW PROVINCE
Source: Our dataset.

Declared Pre-Tax Income from Renting Out Houses
The real estate tax was mandatory only for the aristocracy. However, an additional 1,282 households from other social groups voluntarily declared their incomes from real estate. It is challenging to estimate the data coverage accurately. We argue that elite households were motivated to pay the tax voluntarily because (a) it served as a signal of their high social status, and (b) it was a means to safeguard their property and privileges, particularly in the face of the revolutionary threat posed by Napoleon’s Grand Army. Notably, these voluntary declarations often included specific details about the types of assets used to calculate taxable income. While the aristocracy primarily declared income from land based on serf rents and labor, landless groups reported income from houses. Table 3 provides a breakdown of the voluntarily declared income from land and houses among various social groups. The number of declarations submitted by each group correlated with that group’s likelihood of owning real estate, with merchants submitting the most declarations and soldiers the fewest, reflecting the ownership structure within the sample. Serfs did not declare any income from owning houses.
PRE-TAX INCOME FROM THE REAL ESTATE (LAND AND HOUSE RENTS) DECLARED BY RESIDENTS OF MOSCOW PROVINCE FOR 1811

Notes: While the table assumes strict social boundaries, we acknowledge that Russian society was more complex and fluid. Our data on social status is based on self-reported documents, such as tax returns and industrial censuses, which reflect the self-perception of property owners.
Sources: TSGA Moskvy, f. 4 op. 1 d. 3225, 3226, 3227, 3228, 3229, 3230, 3231, 3232, 3233, 3234, 3235, 3236, 3237, 3238, 3241, 3242, 3243, 3244, 3245, 3246, 3247, 3248, GATO, f. 161, op. d. 1429, 2432, 1423, 1439.
Calculated Pre-Tax Income from Factories
We also collected new archival data on all factories located in Moscow Province in 1809 (RGIA, f. 17, op. 1, d. 44). Specifically, we examined the previously unpublished industrial census conducted by the newly established Ministry of Internal Affairs. This register provides comprehensive details about significant factories, excluding distilleries, in European Russia. The source contains valuable information, including the names, surnames, patronymic names, social classes, noble ranks, and guild affiliations of each owner. We linked the owners of the factories with the applicants of the tax returns.
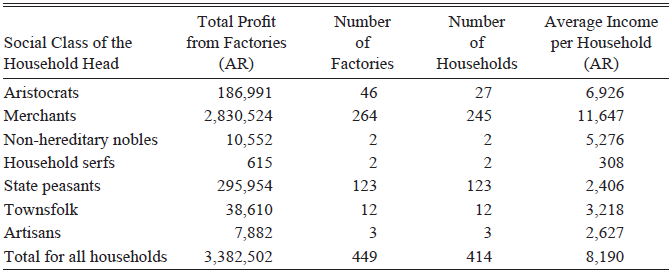
Table 4 presents details regarding factory profits categorized by social groups. In total, we identified 446 factories located in Moscow Province that collectively generated a profit of 3.4 million AR. This income was distributed among 414 factory-owning households (Online Appendix B). This data suggests that factory ownership was relatively uncommon. The ownership was not concentrated, as most property-owning families owned just one factory. Furthermore, while 60 percent of these factories were owned by merchants, a notable 30 percent belonged to state peasants. However, it is important to note that the income generated by state-peasant-owned factories was significantly lower, averaging five times less. No factory was owned by a serf, while two were owned by household serfs, but they generated the lowest incomes in the sample. For this reason, no individuals categorized as serfs entered the top 1 percent of households by income (detailed discussion later).
SUMMARY STATISTICS OF THE PRE-TAX INCOME FROM THE INDUSTRIAL CENSUS

Source: Online Appendix B.
As previously mentioned, the income declared by the aristocracy serves as a proxy for the overall income generated by serfdom for the elite. When analyzing the factory data, it becomes clear that, even in the industrial heart of Russia, serfdom (accounting for 17 million in national income or 5.5 million in provincial income) yielded more income than the factories (3.5 million AR) did for the elite of Moscow Province. This underscores the predominantly agricultural nature of the Russian economy in the early nineteenth century.
Calculated Pre-Tax Income from Governmental Service
Starting from 1722, Russia’s elite and government operated under the Table of Ranks, a hierarchical system with ranks ranging from 1 (the highest) to 14 (the lowest). This system was divided into two main branches: military and civil service. A person’s rank signified their proximity to the emperor within each branch. Military service was exclusively reserved for the aristocracy. However, in the civil service, only the top ranks (1–8) were restricted to aristocrats, while ranks 9–14 could be held by individuals who were not part of the aristocracy. The 14th rank was mainly filled by educated clergy, townspeople, merchants, and others involved in basic local administration. Civil servants in ranks 9 to 14, referred to as non-hereditary nobles (lichnye). Every aristocrat, non-hereditary noble, and civil servant who submitted a tax declaration indicated their rank. Governmental service salaries were standardized and fixed by the government for each rank.Footnote 10 We utilized these official salary regulations to calculate the income of each individual from their government service (Online Appendix D).
Calculated Pre-Tax Income from Capital Invested in Trade
Trade and the movement of goods in Russia were subject to strict regulations and required a merchant license. In 1775, Empress Catherine II introduced reforms to the merchant guilds, where membership was based on the amount of capital invested in trade and came with various lucrative privileges. First-guild merchants had the authority to engage in foreign trade and own sea vessels; second-guild merchants could conduct trade across the Russian Empire and own riverboats; and third-guild merchants could operate local retail businesses and inns. In 1785, Catherine II implemented the “Charter to the Cities,” which not only confirmed the merchant class’s exclusive right to trade but also elevated their social status. For instance, merchants were exempt from compulsory military service if they paid for a substitute conscript. Additionally, first and second-guild merchants were spared corporal punishment, while first-guild merchants were granted the privilege of owning carriages, which had previously been reserved exclusively for the aristocracy.
Guild membership in the first, second, or third guild was contingent on the amount of capital invested in trade. Starting from 1807, the required capital thresholds were set at 50,000, 20,000, and 8,000 AR, respectively. Yakovtsevskii (Reference Yakovtsevskii1953) conducted an estimation of the profit rates for merchants, revealing that, due to their monopoly on international trade, first-guild merchants enjoyed an impressive 25 percent annual return on their invested capital. Meanwhile, second-guild merchants, who dominated inter-regional trade, earned up to 20 percent in annual returns. These substantial yearly profits essentially constituted a form of rent provided by the state to the commercial elite. On the other hand, third-guild merchants derived their income from local retail, capitalizing on the price differential between retail and wholesale prices. Yakovtsevskii (Reference Yakovtsevskii1953) offered data on the retail and wholesale prices of 15 common products in Moscow during the 1800s, revealing a price difference of about 7 percent, which approximated the profit rate of third-guild merchants.Footnote 11
To estimate the capital of each merchant, we assume that they possessed precisely the minimum required amount to join their respective guilds and subsequently obtained the corresponding annual rates of return.Footnote 12 This results in estimated annual incomes of 12,500, 4,000, and 560 AR from the capital invested in trade for first, second, and third-guild merchants, respectively. In 1887, Naydenov published the merchant census of 1811, which included self-reported data on the size of each merchant’s household in Moscow Province.
According to this census, there were a total of 4,067 merchant households, categorized as follows: 123 households belonging to the first guild, with an average of 6 people per household, 350 households in the second guild, also with an average of 5 people per household, and 3,594 households in the third guild, with an average of 5 people per household.
This data suggests a total population of 20,467 individuals among these merchant households. Consequently, we estimate that the income generated from capital investments amounted to approximately 5 million AR.
Summary of All Pre-Tax Incomes of 7,399 Asset-Holding Households
Table 5 provides a summary of all the studied income sources of the asset-holding elite. We know the names and the reported incomes of all landed aristocrats, factory owners, registered guild merchants, and taxed real estate owners. The same person could obtain income from different sources. To avoid counting the same person more than once, we match and combine the available information from the different sources of income for each household head. In the case of aristocrats, we sum the incomes from land of all the household members with known individual incomes. In all the other cases, we assume that the household head is the only one with income. In total, we have information on 7,399 asset-holding households with household-level data. In sum, the household-level of the asset-holding elite totaled 29.5 million AR. The Gini coefficient for income distribution among the 7,399 asset-holding households is calculated at 75. Since assets (land, houses, capital) were the main sources of the studied income of the elite, this result also suggests a high level of wealth inequality within Russian society. We are unable to measure the exact levels of wealth inequality because our data do not report the exact prices of these income-generating assets. In the subsequent sections, we will estimate the average incomes of non-asset-holding groups to gain a comprehensive understanding of income distribution in Moscow Province.
THE INDIVIDUAL PRE-TAX INCOMES OF THE PROPERTY-HOLDING ELITE BY SOURCE OF INCOME

Sources: See Online Appendices B and D.
Dataset of Pre-Tax Estimated Average Incomes of 21 Types of Households
We complement our dataset on the 7,399 individual asset-holding households by incorporating information about 21 distinct groups with estimated average incomes. To construct this social table, we rely on the occupational composition of Moscow Province, as documented in the sixth Russian census of 1811 published by a team of Soviet historians led by Beskrovny (1972). Starting in 1724, Russia implemented a poll tax that applied to males from various social backgrounds, including serfs, state peasants, merchants, and townsfolk, encompassing individuals of all ages, from infants to seniors. Over the period from 1724 to 1858, the Russian administration conducted ten censuses for population tracking. Beginning in the mid eighteenth century, these censuses began to collect detailed information regarding the numbers of both male and female serfs, state peasants, and townsfolk, thereby offering comprehensive demographic insights into these social groups. While these censuses also contained some data on personal nobility and clergy, participation in the census by these groups was voluntary, and the recorded information is incomplete. To address these gaps, we have incorporated supplementary historical information about personal nobility, relying on administrative lists to ascertain the precise number of personal nobles (Kabuzan and Troitskii Reference Kabuzan and Troitskii1971). Additionally, we have utilized the Moscow Registers compiled by Moscow Police in 1811, which furnish us with thorough demographic data for all major social classes, excluding the clergy, who participated in the census voluntarily (Online Appendix D). Here, we offer only the most important details.
AGRICULTURAL WORKERS
Serfs and state peasants in agriculture accounted for 56 percent of the province’s population. Two-thirds of agricultural workers were serfs. Specifically, the 1811 census recorded a total of 860,566 people involved in agriculture, comprising 290,257 state peasants and 570,309 serfs, including both men and women. Although serfs and state peasants had different tax obligations, their incomes were similar.Footnote 13
Kovalchenko and Milov (Reference Kovalchenko and Milov1966) categorized the agricultural population into three income groups: lower, middle, and upper. The lower-income group, making up around 30 percent of peasants, relied solely on income from farming, including animal husbandry. The middle-income agricultural households supplemented their earnings from farming by providing transport services and engaging in various crafts, such as producing yarn, cloth, or tools at home, in addition to their agricultural activities. The top 10 percent of both state peasants and serfs had more land for farming and invested in animal husbandry. Dennison (Reference Dennison2011) even identified some wealthier state peasants and serfs in the Central Economic Region who ran small private workshops, such as tanneries and distilleries (we found 130 such owners; see Table 5). For agricultural workers not covered in the individual income dataset, we assume they earned money from different sources, including farming, animal husbandry, crafts, and services. Building on available output data, we estimate that each adult male worker generated 45.5 AR of income for his household. Moreover, income from services and animal husbandry varied between 50 and 25 AR and 8.2 AR and 0.42 AR, respectively, depending on household size and income level. This further suggests the argued underdevelopment of animal husbandry in Moscow Province at the time (Online Appendix C).
While census reports provide both the total population and household figures, we only have access to aggregated data. To determine the number of households, we make certain assumptions about their average size. Mironov (Reference Mironov2014) indicates that, on average, an agricultural household consisted of seven family members.Footnote 14 This aligns with Hajnal’s (Reference Hajnal, Glass and Eversley1965) observation that agricultural Russia had high marriage and fertility rates, with households typically being intergenerational, as opposed to the higher levels of neo-locality, celibacy, and lower fertility seen in Western Europe. In addition, we examined archival records of estates owned by the Golitsyn family in Moscow Province (OPI GIM, f. 14, d. 1741). According to this data, households in 1811 had an equal representation of males and females, with adults and infants each accounting for about a third of all household members. Based on these findings, we assume that a typical intergenerational household comprised seven members, including (A) a senior, (B) one male and one female spouse, (C) one adult son aged 14 or older, (D) one adult daughter aged 14 or older, and (E) two infants.
Households varied in size. In general, communes allotted more land to larger households. Archival records from Golitsyn’s estate in 1811 demonstrated that households cultivated plots of different sizes, with a bimodal distribution. Typically, one male serf cultivated either a one or half desyatina plot (equivalent to 1.09 hectares), and both smaller and larger plots were equally common. Drawing from this data, we classify households as either “larger” or “smaller” based on their size and allotments. Larger households, with access to bigger plots, sustained more family members, typically totaling eight people. Conversely, smaller households, tending to smaller plots, supported fewer members and generally consisted of six individuals. This aligns with Mironov’s (Reference Mironov1990) estimate of an average household size of around seven people.
Our assumptions are as follows: (A) all poor households are considered small; (B) half of the middle-income households are small, and the other half are large; and (C) all top-income households are considered large. We further assume that household size mainly impacts the number of infants and seniors, and that each household includes two male adult workers, typically the father and an adult son (Online Appendix C).
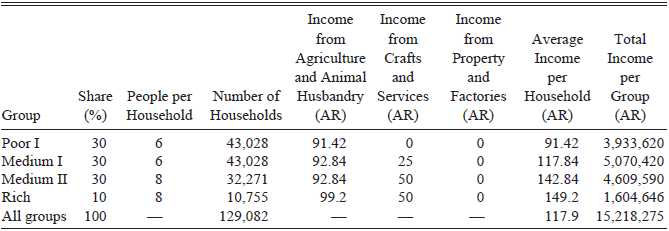
Table 6 provides a summary of the incomes for low, middle, and high-income state peasants and serfs, encompassing revenue from agriculture, crafts, and services. It also includes incomes from property and factories of the already discussed property-holding households. The total income of all serfs and state peasants in agriculture (excluding the 130 property-holding households) in 1811 amounted to 15.2 million AR. Notably, since peasants could not operate plots outside of their communes, they had no income outside of Moscow Province. Unlike aristocrats, their provincial and national incomes were equal.Footnote 15
AVERAGE INCOMES OF SERFS AND STATE PEASANTS IN AGRICULTURE, FOUR INCOME GROUPS

Source: Online Appendix C.
INCOMES OF WAGE AND SALARY EARNERS
We also study the incomes of the remunerated workers based on available population census and wage and salary data. Together, they accounted for around a third of the province’s population (Online Appendix D). Specifically, we studied household serfs (dvorovye) who were paid for their services in money (1 income group). We take their number from the census. To identify the income of household serfs, we collected new archival data on annual salaries paid for different services in 1810 in private estates.Footnote 16 Skilled and unskilled wage workers (serfs in factories, unskilled workers outside of Moscow, unskilled workers inside Moscow, mid-skilled workers, skilled workers). We take their number from the census. To proxy workers’ incomes and skill premiums, we look at the range of weaver wages paid by Moscow textile manufacturers (Tugan-Baranovskii Reference Tugan-Baranovskii1922). Civil servants (hereditary nobles, 5 income groups determined by their rank). We base their number on a detailed administrative list of all public officials in Russia in 1811 compiled by Kabuzan and Troitskii (Reference Kabuzan and Troitskii1971). We take their salaries from official regulations.Footnote 17 Other miscellaneous groups (clergy and soldiers) are based on the census and a range of different wage sources, such as the books of revenues and expenditures.
INCOME DISTRIBUTION AND INTERNATIONAL COMPARISON
Table 7 presents a social table. It compiles data on 7,399 asset-holding households for which we have the household-level data (Table 5) with 222,114 households belonging to one of the 21 household types for which we estimated average incomes (229,513 households in total). To evaluate these results, we express the average incomes of each social group in terms of bare-bones subsistence ratios, which are useful for studying and comparing impoverished preindustrial agricultural economies (Allen Reference Allen2000). A subsistence ratio of one indicates that the average annual income of an individual is enough to cover the basic calories and essential manufactured goods required for survival. We determined the cost of a contemporary Russian bare-bones basket for one adult, based on Moscow prices, to be 13.66 AR (Online Appendix E). In Table 7, we calculate the average income per person by dividing the total annual income by the total number of people in each category. Our findings suggest that all social classes could sustain themselves with the estimated average income, indicating that we likely did not underestimate the incomes of serfs, state peasants, and wage earners. However, serfs in manufacturing and household serfs had slightly below-subsistence incomes, supporting the view of serfdom as an extractive system. Serfs and state peasants in agriculture had subsistence ratios similar to townspeople, around 1.3–1.5, and our calculations are pre-tax, excluding the impact of taxes on serfs and peasants.Footnote 18
SOCIAL TABLE. SUMMARY INCOMES OF ALL SOCIAL CLASSES AND THE TOTAL PRE-TAX INCOME IN MOSCOW PROVINCE IN 1811

Sources: Online Appendices B, D, and Table 3.
Income Levels
The social table shows that the total pre-tax income of Moscow Province’s population was about 51.5 million AR, with an average income of 44 AR per person. To compare these results internationally and align them with the Inequality Possibility Frontier framework, we convert them to 1990 international purchasing power parity dollars (1990$PPP). Using the implicit conversion ratio method based on the cost of a basic national basket, we equate 44 AR to 1012 1990$PPP per capita national income. We also estimate the income within Moscow Province at 781 1990$PPP, excluding incomes from outside estates and adding the emperor’s income from his lands within the province (Online Appendices F and G).
Figure 4 compares Moscow Province’s income levels globally, suggesting that Russia’s income was between that of Western Europe and East Asia prior to widespread industrialization. In line with the Little Divergence hypothesis, our findings confirm that Eastern Europe (Russia) lagged behind economic leaders such as the North Sea Region, Northern Italy, and the expanding United States. Moscow Province’s income levels were similar to national estimates for France, Sweden, Canada, and Argentina, while both national and within-province incomes were notably higher than those in India and China.
Our GDP/GDI estimate for pre-1861 Russia is not the first. Maddison (Reference Maddison2001) provided a “guesstimate” of GDP per capita for the entire future Soviet Union in 1820, estimating it at 688 1990$PPP, but this was not based on any Russian data. Broadberry and Korchmina (Reference Broadberry and Korchmina2024) estimated output levels for European Tsarist Russia at around 950 1990$PPP. Our income-based estimate suggests that Moscow Province was slightly wealthier than the rest of the Empire on average. Since GDP estimates based on output typically exceed those based on income, these findings highlight the need for further studies on regional inequalities in preindustrial Russia (Broadberry et al. Reference Broadberry, Campbell, Klein, Overton and van Leeuwen2015).
Pre-Tax Inequality
The social table indicates that income distribution was heavily skewed. While merchants and aristocrats made up just 3 percent of the population, they collectively received 56 percent of the total national income. In contrast, serfs and state peasants, who constituted roughly two-thirds of the population, received only about one-third of the total national income.
Figure 5 shows a Lorenz curve depicting the income distribution of 7,399 individual households and 21 average income groups, with each square representing a household or group. The graph clearly illustrates the concentration of income among the asset-owning classes, with the top 1 percent of households receiving 50 percent of the total pre-tax income. For context, this level of income inequality is higher than that observed in present-day Russia, where the top 1 percent earned 20 percent of total income in 2015 (Novokmet, Piketty, and Zucman Reference Novokmet, Piketty and Zucman2018), although that estimate applies to the whole country, not just Moscow Province.
In a nutshell, the aggregated income of residents of Moscow Province exhibited extremely high levels of income concentration, reflected by a Gini coefficient of 65 for the distribution within the overall population. Notably, this figure is higher than contemporary observed already high inequality levels in Moscow, which for 2004 were estimated at a Gini coefficient equal to 60 (Novokmet, Piketty, and Zucman Reference Novokmet, Piketty and Zucman2018). To provide perspective, this level of inequality surpasses that of present-day South Africa, currently the highest in the world (Gini of 63). Footnote 19 They were also exceptionally unequal, even by the preindustrial standards, as Tsarist Russian inequality levels exceeded those identified for the colonial economy of Nueva España in 1790 (Gini of 62), which was based on coerced labor and resource exploitation. The Gini coefficient based on within-province income was still high at 57 (Online Appendix G).
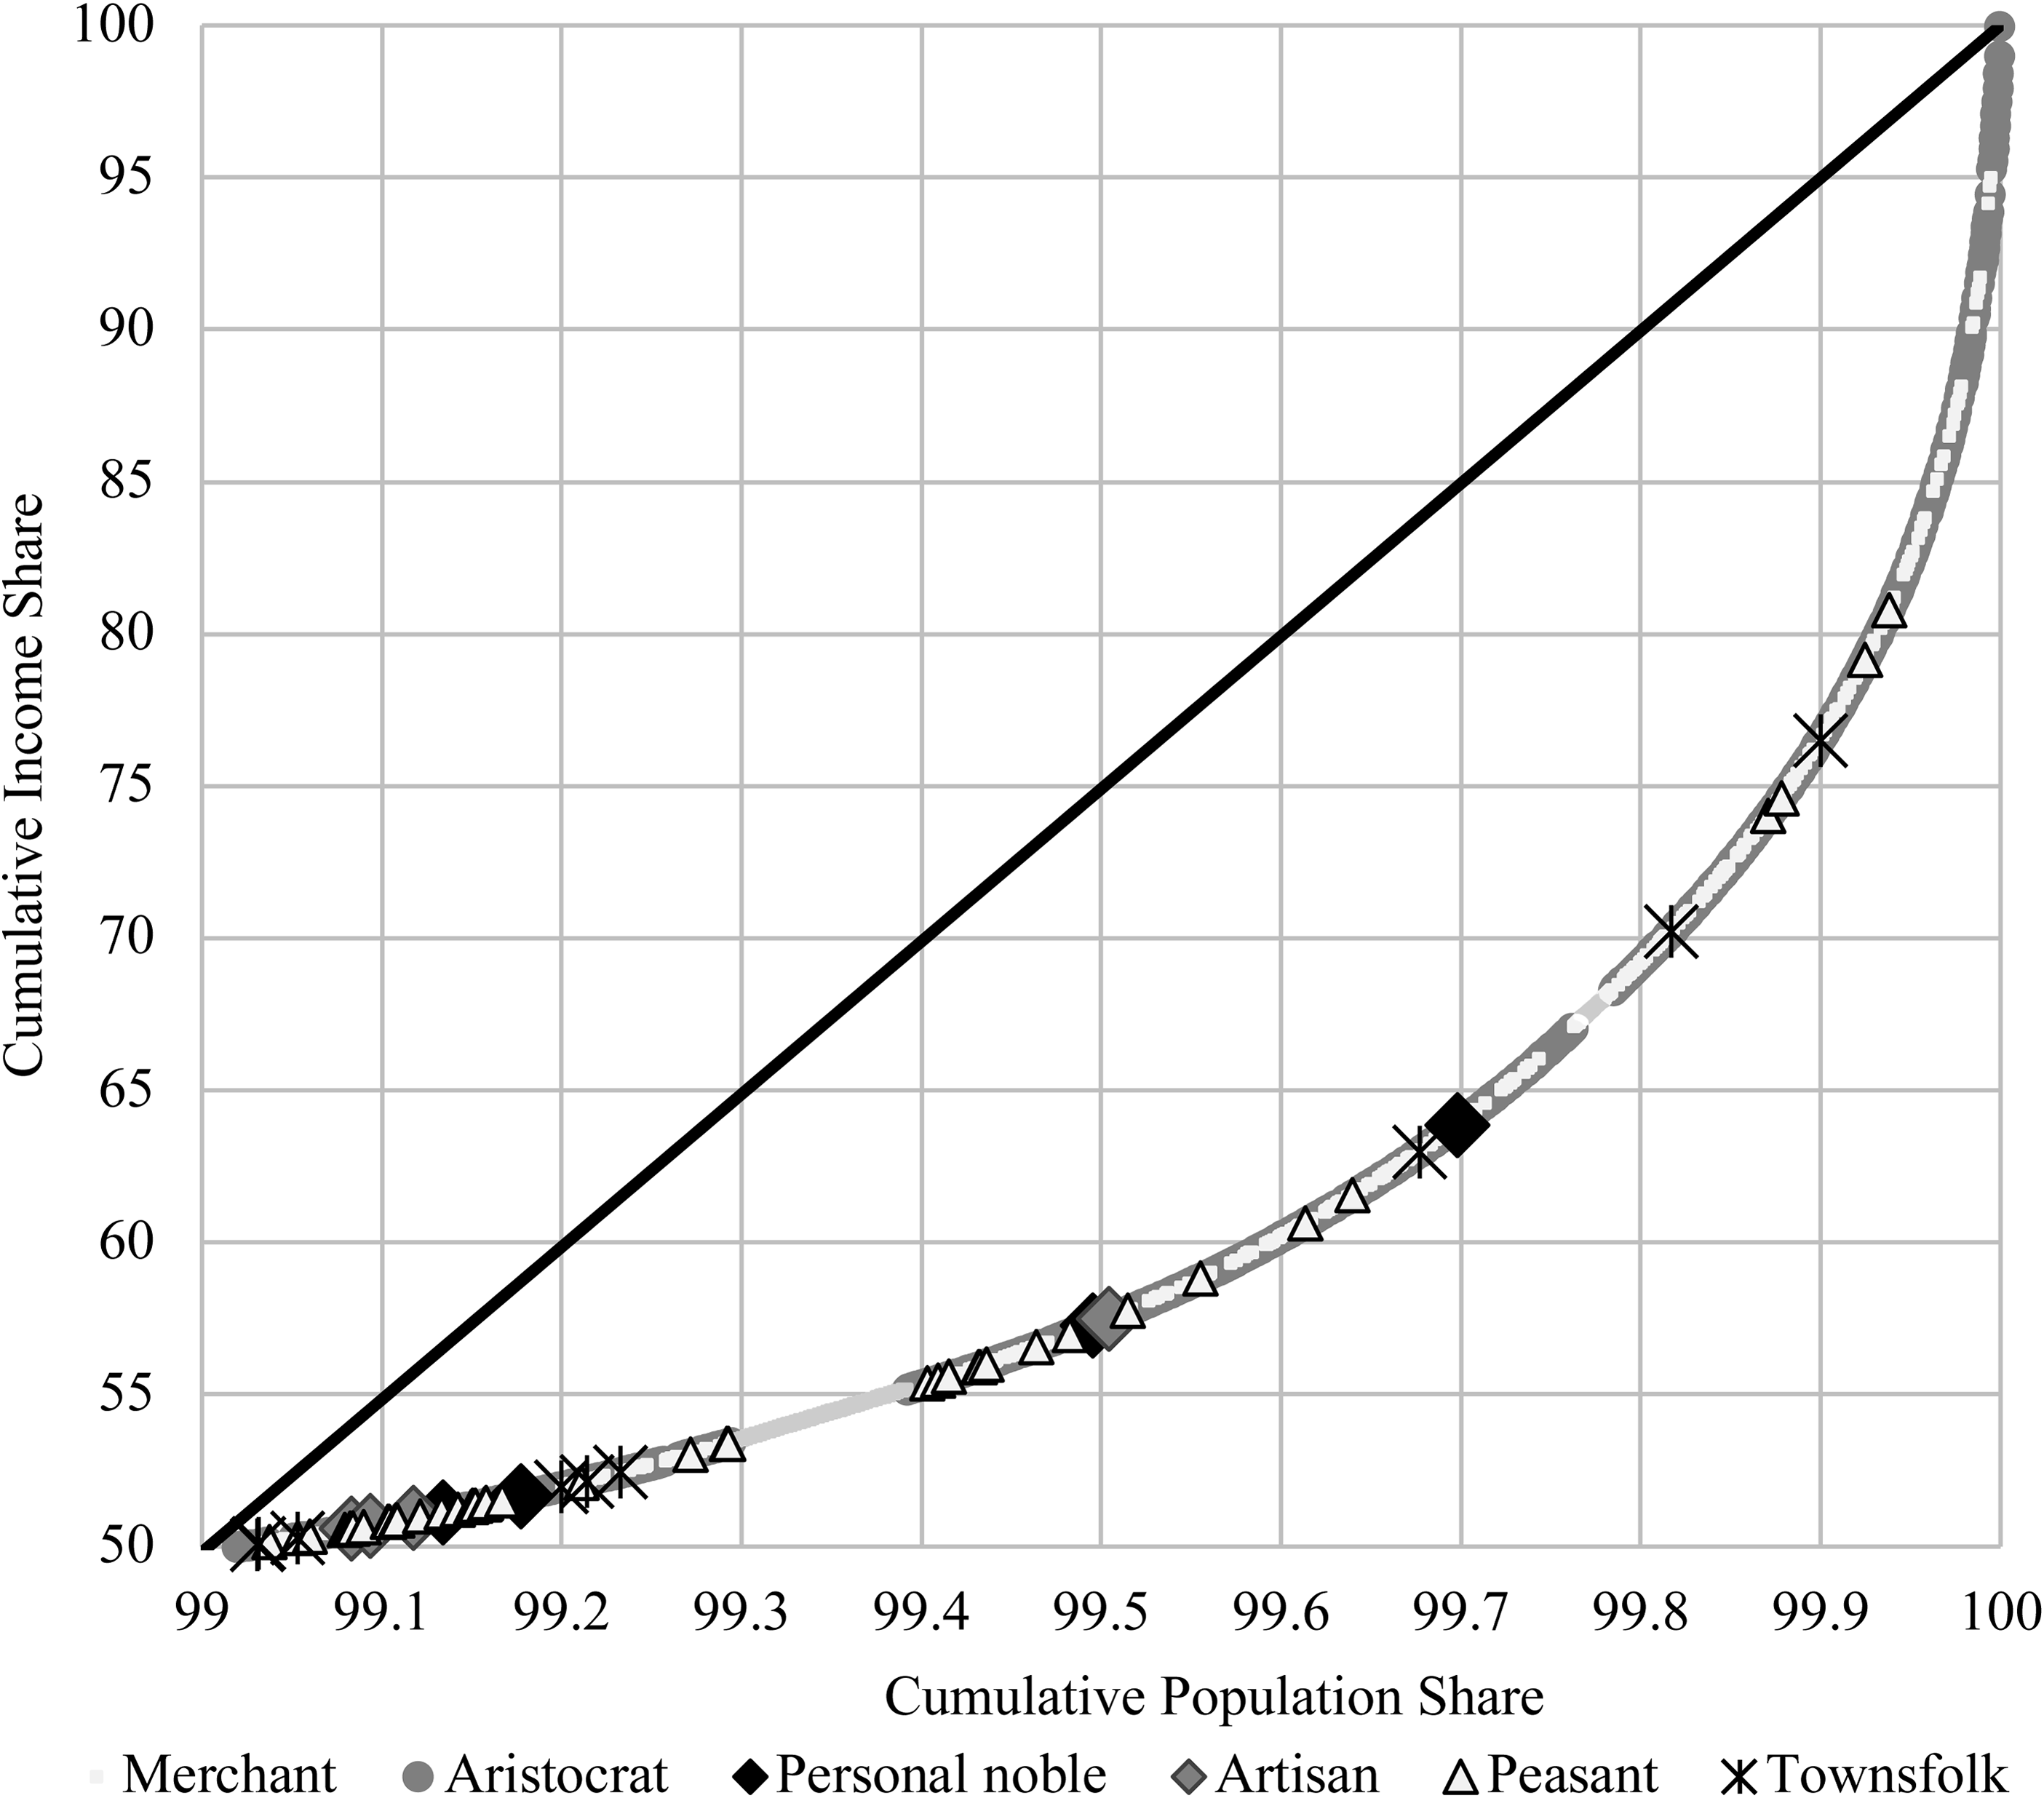
Our dataset allows us to study the distribution of income within the top 1 percent of all earners. The Gini coefficient for pre-tax income distribution of this group was exceptionally high at 71. Figure 6 illustrates the cumulative distribution of incomes within the top 1 percent. This elite group included 1,419 aristocrats, all 123 merchants of the first guild, all 350 merchants of the second guild, and 307 merchants of the third guild who owned factories; 86 state peasants, 17 townsfolk (including 4 artisans), 2 personal nobles, and one foreigner (these are household heads). In contrast, the top 0.1 percent primarily consisted of merchants and aristocrats, with only two state peasants and one townsman. This suggests that while merchants and aristocrats were the most affluent, entry into Russia’s top asset-holding class was not exclusively determined by one’s birthright.
LORENZ CURVE OF THE TOP 1 PERCENT OF THE INCOME DISTRIBUTION IN MOSCOW PROVINCE IN 1811
Source: Our dataset.

Hoch (Reference Hoch1986) argued that serfs could enter the economic elite using only limited qualitative evidence (Ulianova Reference Ulianova2015). We verify this claim empirically and measure the exact scale of the process by analyzing who entered the top 1 percent of households by income. At first glance, no person with serf status was in the top 1 percent. However, former serfs could change their status and enter the elite group by becoming merchants. One of the reasons for changing the status was that serfs had difficulty accessing credit (Meshalin Reference Meshalin1950). The change of status was regulated in the “Charter Granted to the Cities,” published in 1785. Specifically, Article 79 granted serfs who were freed by their landlords the right to relocate to cities. The bureaucratic procedure for transitioning from serf to merchant estate involved securing approval from the merchant corporation of the city where the candidate sought to join the merchant class (conditioned on their capital) and registering the transition in the region’s Treasury Chamber.
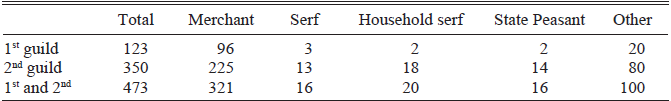
We study the merchant census of 1811 that listed the prior social status and residence of the heads of each merchant household before they obtained a guild license (Naydenov Reference Naydenov1887). Between the 1795 and 1811 censuses, 1,696 new household heads joined one of the merchant guilds, averaging about 100 new members per year. Of these newcomers, 63 percent were either formerly serfs (354), household serfs (319), or state peasants (393), suggesting that the most underprivileged classes were not entirely excluded from guild membership. However, the advancement to higher guilds was limited. Only three new people, on average, per year obtained a license to operate in one of the elite guilds. In 1811, only 16 former serfs and 20 former household serfs were included in the top 1 percent of households by income as merchants of the first or second guild; only 4 percent of the elite merchants came from a serf background. Sixty-nine percent of the elite merchant household heads originated from a merchant background. Put differently, while 52 percent of all aristocrats were in the top 1 percent, less than 0.0001 percent of the serf population managed to climb the social ladder by entering the elite merchant group.Footnote 20 This suggests limited social mobility in Tsarist Russia and limited access for serfs to the economic elites. This limited inclusivity of the top 1 percent contributed to the profound income disparity between the privileged and the underprivileged (Table 8).
STATUS OF MERCHANT HOUSEHOLD HEADS IN 1811 BY PRE-GUILD STATUS

Source: Naydenov Reference Naydenov1887.
EXTRACTION RATIO
We analyze our findings via the prism of the Inequality Positivity Frontier framework proposed by Milanovic, Lindert, and Williamson (Reference Milanovic, Lindert and Williamson2011). This frontier posits that at every level of per capita income, there is a maximum attainable level of inequality.Footnote 21 In their framework, the authors assume that the elites extract the available surplus from the rest of the population. In poor subsistence-level economies, maximum inequality is limited because few resources can be transferred from subsistence farmers to the other social classes. The larger the economic “pie,” the more surplus can be extracted while still allowing for subsistence consumption. Therefore, as economies grow, so does the extractable surplus and the maximum attainable level of inequality. The extraction level is determined by comparing the actual Gini coefficient to the maximum feasible one determined by the frontier. A ratio of one signifies the elite’s complete extraction of the available surplus. The framework was designed specifically to study income, distribution, and extraction in poor pre-industrial economies and therefore fits perfectly for the needs of this study. Figure 7 plots the results for both national and within-province incomes in the international comparative framework. It yields that in both cases, the extraction rate was at around 95 percent of the theoretical maximum. This corroborates the conventional view that the Russian serf economy was not only very unequal but also highly extractive within the context of its low average per capita income levels.
PRE-INDUSTRIAL INEQUALITY IN THE CONTEXT OF THE INEQUALITY POSSIBILITY FRONTIER
Sources: Our estimations, Milanovic, Lindert, and Williamson (Reference Milanovic, Lindert and Williamson2011), and Malinowski and van Zanden (2017).

After-Tax Inequality
Thus far, we have analyzed only pre-tax income. We also study the impact of direct taxation on inequality levels. Most pre-industrial regimes had regressive tax systems that disproportionally affected the disenfranchised population (Alfani and Di Tullio Reference Alfani and Di Tullio2019). Tsarist Russia was no exception. Regarding the central-state taxes, state peasant male population in Moscow Province,Footnote 22 regardless of age, was subject to 2 AR annual poll tax plus 6 AR obrochnya podat, Footnote 23 so altogether 8 AR. Male serfs paid only 2 AR as a poll tax, but were obliged to pay quitrent or perform unpaid labor duties to their landlords. Male townsfolk paid 5 AR poll tax.
Regarding the provincial taxes, the serfs and state peasant households residing in the rural areas were required to pay an additional 0.16 AR tax per male and 0.25 percent of the value of their sales.Footnote 24 In total, according to our calculations, the tax burden for state peasants was around 25 percent, and for serfs, around 7 percent of their pre-tax income. This brought their post-tax incomes close to the subsistence level (Online Appendix I2).
Regarding the elite incomes, each merchant was required to pay a 1 percent wealth tax on the declared capital to the central-state budget and a 0.25 percent tax on the declared capital to the provincial budget (1.25 percent in total). Additionally, everyone who owned a house had to pay 0.5 percent on the value of their real estate. There was no tax on the income from the sales of factory production. Since wealth was the source of merchant income, we include this wealth tax when calculating the post-tax income. Lastly, aristocracy, personal nobles, and clergy were exempted from taxation. Therefore, in general, the elites paid relatively much lower taxes. The exception was the special income from property tax studied in this article, which ranged from zero to 10 percent depending on the declared income (Online Appendix I).
According to our calculations, the population of Moscow Province paid around 3,171,076 AR in direct taxation (general population 2,489,622; merchants an additional 523,625 from capital tax; property holders 157,829 from the regular house tax) or 8 percent of the within-province income (this excludes the special tax on aristocracy). Due to the regressive nature of taxation, the Gini coefficient of income distribution rises from 65 (pre-tax) to 67 (post-tax). In 1811, the aristocracy paid 1,115,403 AR in the special tax. Once we also account for the equalizing effect of this special tax on the elite, the Gini coefficient of post-tax income distribution drops from 67 to 66. Those small shifts in the level of the Gini coefficient indicate that taxation did not determine the levels of income inequality, but that the high inequality levels were driven by the feudal ownership land structure, resulting in serfdom (Online Appendix A3).
Emancipation and Inequality Trends in the Nineteenth Century
If serfdom was associated with high concentration, inequality, and extraction levels, what was the impact of emancipation? The emancipation of the serfs in 1861 granted personal freedom to all former serfs, who could no longer be sold, bought, leased, punished, or imprisoned by their landlords. The obligations of the former serfs to their landlords were fixed, and the aristocrats could no longer demand any unpaid corvée. Markevich and Zhuravskaya (Reference Markevich and Zhuravskaya2018) argue that the discontinuation of the ratchet effect motivated the former serfs to increase productivity and invest in their human capital. Specifically, the authors documented a steady rise in agricultural productivity and showed an effect on living standards proxied by height after 1861.
However, emancipation did not translate into an immediate boost to economic growth. According to Broadberry and Korchmina (Reference Broadberry and Korchmina2024), the GDP per capita in Russia was stagnant between 1800 and 1880, while the size of the economy increased only slightly between 1880 and 1910 (based on Gregory Reference Gregory1982). One possible explanation for this is that emancipation was followed by land reform that perpetuated the communal system of land titles, and former serfs did not end up owning the land directly. Specifically, the land reform implemented over the next 20 years after 1861 ended feudal land ownership structures. Aristocrats gained full ownership rights to their lands free from the emperor and transferred the land rights to village communes in return for redemption payments. Eighty percent of the land value specified in the buyout contract signed between the landlords, village communes, and the state was financed by the state in the form of a 49-year state loan to each village commune (Khristoforov Reference Khristoforov2011). The effects of these legal constraints on Russian agriculture have received substantial attention in the literature (Castañeda and Markevich 2019; Chernina, Castañeda, and Markevich 2014; Gregory Reference Gregory1982; Nafziger Reference Nafziger2016). Most notably, because village communes needed to repay the debts incurred to buy out the land, they maintained mobility restrictions on their members. Therefore, emancipation and land reform did not “free” the former serfs entirely. According to Gerschenkron (Reference Gerschenkron1962, Reference Gerschenkron1965), the mobility restrictions imposed by village communes on their members after emancipation undercut the supply of factory workers and stifled the growth of the industrial sector and the formation of the industrial elites. While it restrained urbanization and industrialization, the restriction was beneficial to the aristocrats who retained the ownership of their demesnes but needed to hire paid agricultural workers to operate them (Markevich and Zhuravskaya Reference Markevich and Zhuravskaya2018). However, Nafziger (Reference Nafziger2012) demonstrated that the restrictions lessened by the end of the nineteenth century.
Table 9 investigates the distributional impact of emancipation and land reform by comparing our new results for Moscow Province in 1811 with the estimates available for nineteenth-century (European) Russia. Unfortunately, there are no detailed inequality estimates for the 1860s. Chancel and Piketty (Reference Chancel and Piketty2021) studied the data available in the World Inequality Database (WID) for 1820, 1850, 1880, and 1905. Their results suggested that inequality levels in Russia remained roughly stable between 1820 and 1905. In fact, there was no significant change in income distribution levels between 1850 and 1880, directly before and after emancipation and land reform. The inequality levels only slightly rose, rather than declined, between 1880 and 1905. This trend from stagnation to a slight increase corresponds broadly with the previously mentioned trends in economic growth identified by Broadberry and Korchmina (Reference Broadberry and Korchmina2024). This suggests that the Russian nineteenth-century inequality levels might have been more impacted by the shifts in income levels rather than by the emancipation, whose effects were muted by the land reform.
COMPARISON OF THE TOP INCOME SHARE IN MOSCOW PROVINCE IN 1811 AND 1904

Notes: The 1904 estimate of domestic income by Lindert and Nafziger (Reference Lindert and Nafziger2014) is based on the 1897 census and the 1905 Land Census, which only accounts for estate size, not productivity differences. It uses a fixed average return on land value, unlike our 1811 estimate based on direct income declarations from landowners. The 1905 survey aggregated holdings at the provincial level, reporting individual landowners’ landownership separately. The extraction ratio for 1904 was calculated using the Maddison Database’s GDP per capita estimate for Russia (Gregory Reference Gregory1982), and we assumed Moscow Province was 10 percent richer than the national average due to the lack of regional data.
Sources: Our estimations, Lindert and Nafziger (Reference Lindert and Nafziger2014). Maddison Project Database. World Inequality Database (WID).
We reinforce those findings based on the national income in all (European) Russia with a comparison of the provincial income distribution in the Moscow Province. We compare our estimates with those published by Lindert and Nafziger (Reference Lindert and Nafziger2014). The comparison identifies that the inequality levels remained roughly the same between 1811 and 1904. When taken at face value, Gini coefficients of the income distribution rose marginally from 57 to 59, while the measures of top income dropped slightly. This lends further support to the supposition that the effect of emancipation and land reform on inequality levels was limited. However, since the Russian economy grew in the last decades of the nineteenth century, the Maximum Feasible Inequality determined by the Inequality Possibility Frontier also increased. For this reason, the Extraction Ratio in 1904 was significantly lower than in 1811, despite similar inequality figures (Table 9). This suggests that while emancipation and land reform did not dramatically reduce the income levels, the abolishment of serfdom might have prevented further extraction of surplus. This speculative conjecture, based on our exploratory analysis, requires further detailed investigation.
DISCUSSION AND CONCLUSION
This article traces back high levels of inequality and income concentration by the elite to the beginning of the nineteenth century. The existing evidence begins to form a picture of the persistence of high inequality levels in Russian society, with the equality under communism in the twentieth century being the exception to the persistently high disparity levels. The high levels of inequality and surplus extraction in the early nineteenth century were associated with the institution of serfdom. We demonstrated that serfdom generated vast incomes for the elite and that opportunities for economic advancement in the country were restricted, with only 36 former serfs managing to reach the top-tier income group. Put differently, while serfs were 56 percent of the total population, they accounted for only 0.003 percent of the tier. While agriculture in Russia in the early nineteenth century remained relatively unproductive, by Western European standards, it was by far the largest sector of the economy due to the underdevelopment of services and industry. However, due to the high extraction levels in agriculture, despite the sector’s low productivity, serfdom was not only the most common source of income among the elite but also accounted for a high percentage of national income. Industry remained too underdeveloped to form an alternative base for elite incomes. In addition to barshchina and obrok, the main serf duties, most landlords imposed extra fees and fines for things like passports, marriage licenses, household separation, land transfers, and military exemptions, which were likely not included in their income declarations. This indicates that the extractive impact of serfdom was even greater. Those findings and discussions inspire further important questions regarding the persistence of serfdom, as well as high inequality and extraction levels.
Lastly, why did the inequality levels remain high even after emancipation? In this article, we tentatively linked the persistently high inequality levels in the nineteenth century despite emancipation to low levels of economic growth, as well as the land reform that effectively forced former serfs to remain in the agricultural sector to pay back the loans incurred by their village communes to buy the land from their former aristocratic landlords. This is parallel to the emancipation experiences from other countries that did not translate into the empowerment of the underprivileged group. For example, the first unsuccessful attempt to end serfdom in Poland in the late eighteenth century envisioned that former serfs would “lose their shackles together with their boots” by gaining legal autonomy but also losing the right to use the land, thus transforming them into landless wage workers. This is also broadly similar to the emancipation of slaves in many Western societies, which compensated the former slave owners for their loss but often placed former slaves in continued economic dependency on their former owners as so-called “wage slaves,” with limited economic agency. In the present-day United States of America, the legacy of slavery continues to have a profound impact on the distribution of economic assets (O’Connell Reference O’Connell2012). Similarly, Buggle and Nafziger (Reference Buggle and Nafziger2021) identified that the legacy of serfdom continues to have a negative impact on developmental outcomes. Our research invites further study into the exact mechanisms through which the legacy of serfdom persisted even after its emancipation, including a range of societal, political, cultural, and economic factors.


 Open access