

Latin America is experiencing a progressive aging of its population and stabilization of its population structure as a consequence of diminishing mortality rates and reduced fertility rates. By 2050, the proportion of elders will be higher than that of children. These transformations in age composition will inevitably exert a macroeconomic impact through different factors: labor supply, savings, productivity, and consumption.
If age-specific behaviors concerning labor supply and savings were fixed, the aging of the population would imply declining labor supply and savings, as the most dramatic increases of the population would be observed in the age groups with lower participation and savings rates. But in a process of fertility decline, it is reasonable to expect higher female participation in the labor market, and this can offset, at least partially, declining trends in labor supply. Along the same line, increases in life expectancy may lead individuals to work longer. Behavioral changes may also offset the declining trend in savings: higher life expectancy is expected to induce increased savings over the working life to finance a longer period of life in retirement (see Reference Bloom, Canning and GrahamBloom, Canning, and Graham 2003).
Similarly, the effects of workforce aging on productivity can operate in different ways. A more experienced labor force may potentially be more productive, but the depreciation of knowledge acquired many years ago may imply a negative effect on innovation and productivity, and the deterioration of physical and mental capabilities may operate in the same direction. While some authors argue that an aging workforce negatively affects productivity growth (Reference Aiyar and EbekeAiyar and Ebeke 2016; Reference Otsu and ShibayamaOtsu and Shibayama 2016; Reference Maestas, Mullen and PowellMaestas, Mullen, and Powell 2016), others contest that it is not a straightforward relationship and that productivity is a multidimensional issue (Reference SkirbekkSkirbekk 2004; Reference Ours and StoeldraijerOurs and Stoeldraijer 2010; National Research Council 2012). There may also be differences by sectors of the economy: in technological sectors, older workers might be at a disadvantage because of a diminished capacity to adapt to new technologies, but this might not be the case in sectors that require accumulated experience (Reference Göbel and ZwickGöbel and Zwick 2012).
If productivity changes along the life cycle, changes in the age distribution of the labor force will affect the aggregate productivity of a country. If forces reducing productivity prevail (basically if depreciation of knowledge and skills offsets the accumulation of experience), aggregate productivity or output per worker may end up declining in the medium or long run. Of course, this negative effect of ageing over productivity may be counteracted by factors such as improvements in public health that lead to better health status, or other technological advances in knowledge and organization that lead to higher productivity.
Even if the links between population aging and macroeconomic performance are multiple and difficult to grasp, it is worth trying to visualize potential paths for some relevant variables.Footnote 1 This article considers how changes in fourteen Latin American countries’ age structures may affect their economic performance in the long run, through the impact on labor supply, dependency ratios (ratios between dependent and active population) and productivity, proxied through wages.
The analysis is based on population projections for the 2015–2050 period. Given that the process of population aging is taking place at different speeds across the region, we construct groups of countries (clusters) with similar demographic characteristics and evaluate the consequences of aging considering three scenarios. The basic one assumes constant sex- and age-specific behavior with respect to employment: only demographic changes take place. The other two scenarios imply relevant changes in behavior: one considers that in addition to the demographic changes, the female activity rate would reach the current levels of the world front-runner countries (the Nordic countries, specifically Sweden). The other one assumes that the population’s educational level increases, following population projections by educational level developed by the Wittgenstein Centre for Demography and Global Human Capital (see Reference Lutz, Goujon, Samir, Stonawski and StilianakisLutz et al. 2018).
The results suggest that the expected evolution of the age and sex composition of the population will force the activity rate down in most of the region’s countries, accompanying the rise in the proportion of the elderly, whose participation in the labor market is lower. Only when female activity rates are assumed to increase, overall activity rates would improve in most countries by 2050.
With respect to dependency rates, they would increase in the demographic scenario in the better-off countries of the region, whereas in the poorer ones, in which the demographic transition is currently at early stages, decreased fertility rates would generate important reductions in the dependency rate. With increasing female participation or—to a lesser extent—a more educated workforce, the inclusion of new workers results in stability of the dependency rate compared to the demographic scenario, except for the poorer countries of the region, where an important reduction prevails.
In the purely demographic scenario, the differences observed in productivity per capita trends are explained by the stage in the demographic transition that countries have reached. Countries at the early stages of the transition would experience substantial increases in aggregate productivity by 2050 in the demographic scenario, but their productivity levels will remain low. Countries where the transition is most advanced would present reductions in productivity, albeit not very large ones. When women are incorporated into the labor market, productivity per capita improves in all the countries. Finally, the potential adverse effects of population aging on productivity growth shown in the demographic scenario can be reversed if economies rely on a smaller but more productive workforce.
Demographic Transition in Latin America: A Heterogeneous Process
Latin America’s population growth will significantly slow down and then fall before the start of the next century. According to UN population projections, by 2050, the population will reach 734 million, a minor increase of 17 percent with respect to the 2015 population level (620 million), with a significantly different age structure. In effect, as the number of children falls and the number of elders increases, the region is experiencing a progressive aging of its population. This process is the result of diminishing mortality rates and reduced fertility rates.
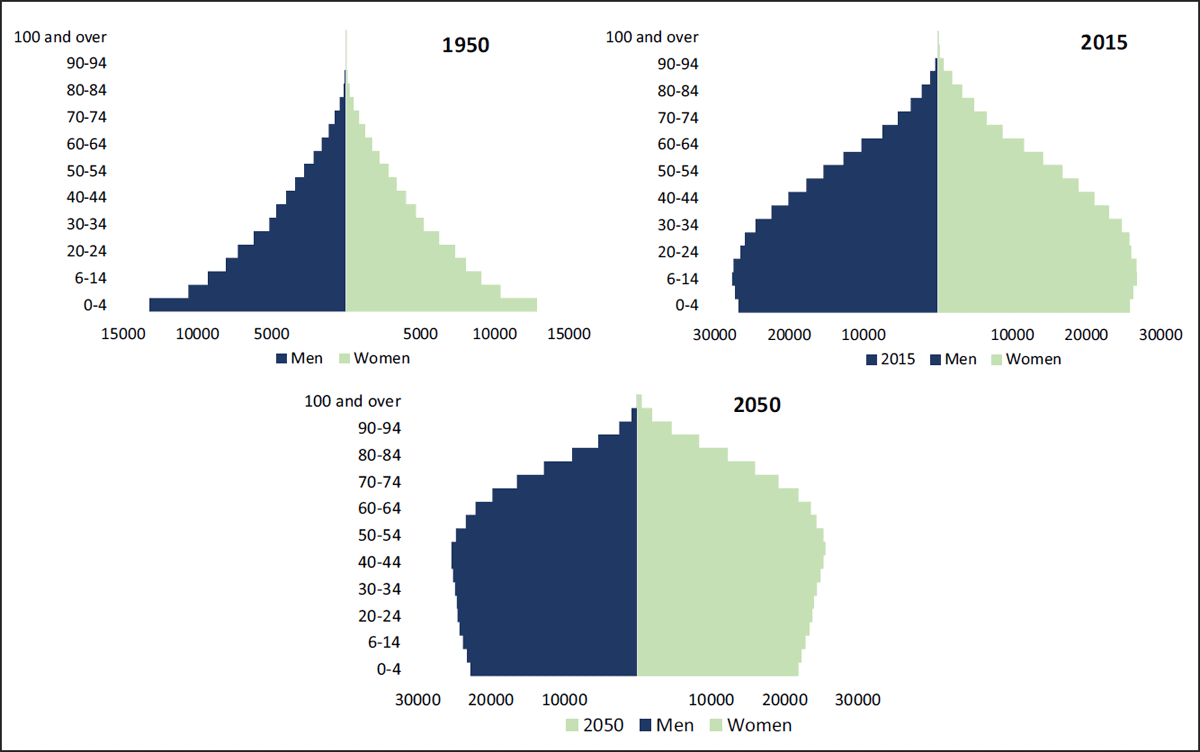
Because of these changes, the population has been aging at an accelerated pace. In 1950, children under fifteen represented 40 percent of the Latin American population; today they account for less than 30 percent, and by 2100 their weight will be reduced to 15 percent. On the other hand, the proportion of elders over sixty-four years of age has gone from 3.5 percent to 7 percent between 1950 and 2015; by 2050, they will surpass the weight of children (Figure 1). These transformations in the age composition will inevitably affect the dependency ratio (CELADE 2014). This decline in the dependency rate may produce economic benefits known as the “demographic dividend” or “demographic window” (Reference Bloom, Canning and GrahamBloom, Canning, and Graham 2003), given the associated increases in per capita income and also in physical and human capital per capita. This means that countries are in a favorable situation to generate savings. Again, there is variation concerning the level of progress in this phase in the region: in some countries, this window is yet to persist for many years, while in others it is close to its end.
Latin American population by sex and age group (in thousands). Data from ECLAC population database, 2017 revision.
The paces of these changes are very different among countries in the region. As presented in Figure 2, the proportion of children under fifteen ranges from 20.8 percent in Chile to 36.2 percent in Honduras. In general terms, the weight of the elderly moves in the opposite way among countries.
Proportion of population under fifteen and over sixty-five by country, 2015. Data from ECLAC population database, 2017 revision.

Demographic transformations have enormous implications in terms of public policy. For example, the state may be able to invest fewer resources in education because of the decline in the number of children, but it will have to invest more in pensions and health (CELADE 2014). Whatever the structure of pension systems, labor scarcity induced by population aging will constitute a serious challenge. Policy changes in terms of the retirement age, the contribution rates, or the way to finance potential deficits in pensions systems are among the aspects discussed at present in the region (see Reference ArenasArenas 2019; Reference Cavallo and SerebriskyCavallo and Serebrisky 2016; among others). Gragnolati et al. (Reference Gragnolati, Apella, Rofman and Troiano2014) find that, with the current policies, in Argentina, public spending would increase from 20 percent of GDP to 27 percent by 2050; spending on pensions would increase from 11 percent in 2010 to 15.5 percent of GDP in 2050. Rofman, Amarante, and Apella (Reference Rofman, Amarante and Apella2016) present similar findings for Uruguay: social public expenditure would remain stable in about 20 percent of GDP even when the public spending in pensions decreases because of the 1996 pension reform that increases dramatically the weight of the private pension spending.
In many countries, the demographic dividend will still last for several years; in others, it is closer to its end. In all cases, it is relevant to analyze the economic influence of changes in the age composition of the population. To consider how changes in age structures affect economic performance in the region, we group countries with similar characteristics and present full results for only one country per group. These groups are not intended as analytical categories but as instrumental ones, to help in the visualization of results. The grouping of the countries was based on seven variables that inform of the stage of the transition: fertility rates and life expectancy for 2010–2015, female and male labor force participation around 2015, female labor participation growth rate between 1990 and 2015, and demographic dependency rate for 2015 and 2050 (proportion of the population under fifteen and over sixty-four to working-age population).
The clusters were created using the nearest-neighbor clustering procedure. This technique creates a hierarchy of clusters by repeatedly grouping pairs or smaller groups of countries to form larger groups. The objective is to find groups whose individual members are as similar as possible within the group, and as different as possible between groups. It operates as an optimization problem of finding the point in a given set that is closest to another point, expressing closeness in terms of a dissimilarity function. The dissimilarity is defined by the distance between countries in the seven variables mentioned before. These variables are standardized for the inclusion because groups are defined based on the distance between countries, and the magnitudes of the variables must not interfere in this measurement. For a review on cluster analysis see (Reference Kaufman and RousseeuwKaufman and Rousseeuw 1990). Based on a graphical analysis of the clustering procedure (dendogram), five clusters were created.
Its main characteristics are illustrated in Table 1. Cluster 1 (Guatemala, Honduras, and Nicaragua) includes the countries with the least developed demographic transition and a very low female labor force participation; cluster 2 (Brazil and Uruguay) countries have a major advance in the demographic transition and high female labor force participation; cluster 3 (Bolivia, Colombia, Paraguay, and Peru) presents lower progress in the demographic transition and high female labor force participation; cluster 4 countries (Argentina, Chile, Costa Rica, and the Dominican Republic) characterized by their advanced demographic transition and low female labor force participation; cluster 5 (Ecuador, Panama, Venezuela, El Salvador, and Mexico) presents an intermediate demographic transition and an intermediate female labor participation rate.
Cluster-average value of variables used for clusters.

Sources: (1) UN World Population Prospects and (2) CEPALSTAT, based on household surveys. The reference year may change between countries because of availability of household surveys; the year used is the closest one to 1990 and 2015.
It is important to note that these clusters are only based on demographic dimensions, although country heterogeneity in the region goes beyond demography. Institutional contexts may mediate in the potential effects of demographic changes on labor participation and income and affect the results of our estimations. However, these demographic clusters are similar to groupings elaborated in the literature on social protection in Latin America, which has highlighted the heterogeneity in the development of social institutions. In a myriad of previous papers (e.g., Reference Ocampo and Gomez-ArteagaOcampo and Gomez-Arteaga 2017; and Reference FranzoniFranzoni 2008, among others) the region’s countries are grouped in three categories that mirror our cluster 2 and cluster 4 (advanced or comprehensive social protection systems), cluster 2 and cluster 5 (intermediate), and cluster 1 of our grouping (limited or weak systems). Four countries are differently classified in the demographic approach followed in this article: the Dominican Republic, which is included in the first group but is generally included in the intermediate cluster; and Bolivia, El Salvador, and Paraguay, included in the intermediate group, while they are classified as limited or weak social protection systems.
The countries selected to represent each group are Chile, Mexico, Brazil, Guatemala, and Peru. We footnote those cases where important differences are found between the selected representative country and another member of that cluster.
Methodological Aspects
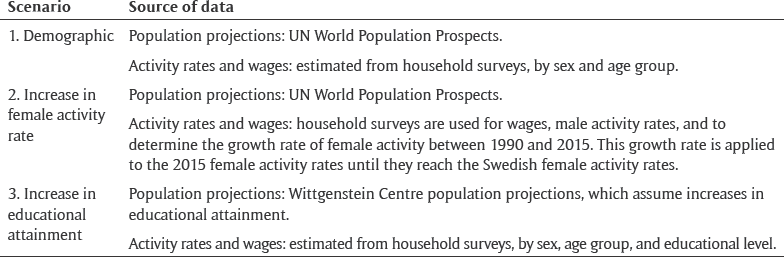
Three scenarios were designed to unveil the different possible effects of aging in labor and productivity in the region by 2050: (1) considering only demographic changes, with each country’s current levels of activity by sex and age group remaining unchanged; (2) if, in addition to the demographic changes, female activity rate rose to the levels of the world front-runner countries (Sweden); and (3) if, in addition to the demographic changes, the population’s level of education increased. These scenarios are not projections of what will happen to activity and productivity levels in the region but have been developed as the basis for analyzing possible trajectories and to identify the effects of these variables (sex and age composition, female labor force participation, and education).Footnote 2
Basically, we take population projections and multiply them by the activity rates of each sex and age group, therefore obtaining a possible size of future active/inactive populations. Both the population projections and the activity rates for each scenario vary, as discussed below. With these projections, we can estimate aggregate labor force participation rates as well as dependency rates.
The estimation of the effects of ageing on productivity is a difficult task. The literature has relied on the econometric estimation of augmented production functions, introducing the dependency ratio or other variables reflecting the age structure to capture the association between demographic factors and growth (Reference FeyrerFeyrer 2007; Reference Crespo Cuaresma, Loichinger and VinceletteCrespo Cuaresma, Loichinger, and Vincelette 2016; Reference Aiyar and EbekeAiyar and Ebeke 2016; Reference WongWong 2007). These econometric estimates—based on past trajectories of variables—are applied to population projections to estimate the future effects of aging on productivity growth. These studies offer relevant insights, mainly for developed countries, about the potential macroeconomic impacts of ageing. We rely on a different methodological approach, not based on a structural model. Instead, we depart from an individual conceptualization and assimilate productivity with wages. To obtain future estimations of productivity, we multiply the projected active population of each group (sex and age) by the current average wage of that group; the sum of all groups is our estimation of total productivity for that year and allows us to calculate productivity per capita and per worker.
This approximation to productivity is, of course, limited, but it is a way of illustrating—through differential wages—the potential increases in productivity associated with aging and with changes in educational attainments. With a very simple approach and assuming perfectly competitive markets, workers’ hourly wages would equal the value of their marginal product of an hour worked. Of course, wages and productivity may be decoupled depending on labor market institutions and regulations (OECD 2018). Asymmetric information, frictions in the searching and matching processes, monopsony power of the employee, bargaining power, are some of the factors that may influence the wage-productivity relation (Reference Van BiesebroeckVan Biesebroeck 2015). Fringe benefits may also explain deviations between wages and productivity. It has also been claimed that the link between productivity and growth may operate both ways (see, e.g., Reference MilleaMillea 2002; Reference Fuess and MilleaFuess and Millea 2006; Reference Policardo, Punzo and Sanchez CarreraPolicardo, Punzo, and Sanchez Carrera 2019). But even if the wage-productivity theory has many shortcomings, it does provide a useful benchmark for purposes of estimating the impact of a changing age structure (National Research Council 2012).
Three main components are required to obtain the projections in each scenario: population projections, activity rates, and wages. The disaggregation of these components depends on the requirements of each scenario. In the first two, all the components are estimated by sex and age groups. The third scenario introduces another consideration, the level of education. Thus the projections, participation rates, and wages are established for sex, age group, and education level. In the remainder of this section, we establish the details of each scenario and describe the three variables for the five representative countries.
The first scenario considers only the demographic changes that are embedded in the population projections and assumes constant age-specific behavior for employment. For this scenario, we use population projections from the United Nations (UN) Population Division; activity rates and wages by sex and age group are taken from household surveys for the year 2015 or the closer year available for each country.Footnote 3 Because labor force participation rates by age and productivity levels are not modified in this scenario, results exclusively reflect the effect of population size and age structure. It must be noted that this is not a “baseline” scenario, given that the expected changes in the aggregate labor force participation and productivity are also driven by changes in behavior, which are assumed to be constant in this scenario. The other two scenarios propose the consolidation of ongoing behavioral changes, in addition to the purely demographic modifications.
The second scenario builds on the demographic tendencies but also considers that the increase of female labor force participation will continue until reaching the rates of the best-performing countries in terms of gender equality in the world. Low fertility rates can free up time from childcare and this may exert a positive effect on female labor supply. Moreover, it is reasonable to expect that cultural factors and other social forces will also boost female participation in Latin America. Although the labor supply is bounded above and therefore cannot affect the rate of economic growth in the very long run, it can boost economic growth in a certain period. Higher female participation rates because of fertility reductions were found to have contributed to growth miracles in Asia and Ireland (e.g., Reference Bloom, Canning and MalaneyBloom, Canning, and Malaney 2000; Reference Bloom and WilliamsonBloom and Williamson 1998; among others). To consider this effect, we use the 2015 Swedish female participation rate by age groups, which was 69.5 percent for women over fifteen (74.4 percent for men). These alternative participation rates are applied to the population projections from the United Nations Population Division. For each country, we take the female activity rate by age group in 2015 and project it by using the observed growth rate for the total female activity rate between 1990 and 2015.Footnote 4 Once the activity rate has reached the established goal in the age group, we maintain that rate for the rest of the period. It must be noted that even if women’s participation keeps growing at the pace of the last decades, not every country reaches the established threshold by 2050. This is because the starting points of the female activity rate in some countries are very low and/or their observed growth in the last twenty-five years was too slow. In particular, Panama, Ecuador, El Salvador, Nicaragua, Paraguay, and Guatemala do not reach the Swedish rates in virtually any of the age groups.Footnote 5 The male activity rates and the wages by sex and age group are the same as in the first scenario (2015 household surveys).
One shortcoming of this scenario is that male participation rates remain unchanged. It should be noted that in Latin America the gap between male and female participation rates is relatively high, and the average male participation rate is 79 percent in 2015 (ranging from 71 percent in Chile to 86 percent in Guatemala), five points higher than the one corresponding to Swedish men. In case women increased their participation rate as proposed in this scenario, some decrease in male participation rates should be expected, as the burden of housework would need to be redistributed between men and women. We are not taking these potential changes into account in our simplified scenario, and so our results for this second scenario could be considered as an upward boundary for the possible effects of the increase of female labor force participation.
The third scenario considers the effect of the increase in the education level in addition to the demographic changes. For this scenario, we use the population projections by educational level developed by the Wittgenstein Centre for Demography and Global Human Capital, a collaborative effort between the University of Vienna, the International Institute for Applied Systems Analysis (IIASA), and the Austrian Academy of Science (OAW). These projections have been widely documented (see, e.g., Reference Lutz, Goujon, Samir, Stonawski and StilianakisLutz et al. 2018). The participation rates and wages used are taken from the household surveys and are kept unchanged in the projection. Unlike the other scenarios, in this case, they are estimated for each age group, sex, and educational level.
The projections used are based on the global, regional and country-level trends in educational attainment for the period 1970–2010.Footnote 6 A key aspect of these projections is that they consider the impact of educational attainment on demography (specifically on fertility rates and mortality by educational levels). As educational attainment (particularly women’s) increases, demographic tendencies change, leading to lower population growth. These projections stem from a model estimating assistance rates for three of the six educational levels considered (complete primary, incomplete secondary, and completed tertiary). The remaining levels are reconstructed in such a way that transitions are consistent (first half of secondary and complete secondary) or by difference (no education). The model is based on assistance records for 178 countries for the 1970–2010 period. Once the model is adjusted, the projection is extended to 2060. The model is built for thirty to thirty-four-year-olds. Projections for the following ages are built on mortality assumptions for each educational level, while data for the younger cohorts are based on the observed evolution of educational levels in each country.
Both the UN population projections and the Wittgenstein Centre population projections predict constant levels of migration until 2050. Basically, migration flows are averaged in the long term and maintained constant over the whole projection period. This methodological option respects the fact that forecasting migration presents particular challenges (Reference Lutz, Goujon, Samir, Stonawski and StilianakisLutz et al. 2018; Reference Sander, Abel and RiosmenaSander, Abel, and Riosmena 2017); moreover, there is no accepted theory on which to build assumptions about future trends. Studies of migration patterns in Latin America reveal important fluctuations across countries, across time periods, and across time within individual countries (Reference Clark, Hatton and WilliamsonClark, Hatton, and Williamson 2004; Reference Durand and MasseyDurand and Massey 2010; Reference Cerrutti and ParradoCerrutti and Parrado 2015). Given this, experts agree that the best choice is to assume that in- and out-migration rates will remain constant.
It is important to acknowledge that activity rates are determined by a multiplicity of factors and their exhaustive consideration is beyond the scope of this article. Our approach considers the direct influence of demographic factors, as well as education, in scenarios 1 and 3 respectively. Moreover, the increase in female labor participation in scenario 2, based on the assumption that countries reach the rates of the best-performing countries in terms of gender equality, is implicitly taking into consideration both the importance of public policies (as in general terms these best performing countries have strong social care and labor policies to foster female participation) and cultural norms.Footnote 7 Table 2 summarizes the main features of the three scenarios.
Data source for each scenario.
Latin America: Population Projections and Present Activity and Productivity
Before considering our results regarding labor supply, dependency ratios, and productivity, it is useful to illustrate the underlying population projections. As explained above, we present results for only one country in each cluster (Chile, Mexico, Brazil, Guatemala, and Peru).
Projections by the United Nations, used in scenarios 1 and 2 (Figure 3), are very similar to the ones adopted by the Wittgenstein Centre for scenario 3 (see Figure A.1 in the online appendix). Both present significant differences by country. Among the five selected countries, Guatemala has the highest growth rate: its population will grow by 66 percent between 2015 and 2050. Peru and Mexico have intermediate growth rates of approximately 30 percent. Chile, and especially Brazil, will grow at a slower pace (17 percent and 13 percent, respectively).
United Nations population projections by age groups, 2015–2050. Data from United Nations (2017).

Guatemala is the least advanced country in terms of the demographic transition. Currently, 36 percent of its population is under fifteen and elders (over sixty-four) represent 5 percent of the total population. Although the elder population will grow over the next thirty years, its weight in 2050 will still be less than the weight of children (11 percent vs. 23 percent). Mexico and Peru show a similar pattern than Guatemala, though they are slightly more advanced in the transition. Children under fifteen account for 27 percent of the population, the working-age population accounts for 65 percent, and elders over sixty-four are close to 6 percent. By 2050, the weight of the working-age population will remain virtually unchanged, though the proportion of children will fall to 18 percent, while elders will also represent close to 18 percent of the population. Finally, in Brazil and Chile, the transition is the most advanced: children represent less than a quarter of the population and elders approximately 10 percent. Note that the starting point for these two countries is similar to the distribution of Guatemala in 2050. By 2050, the elderly population in Brazil and Chile will amount to 25 percent of the population, while children will decrease to 15 percent (Figure 3).
Important differences among countries also emerge when considering educational levels in 2015 and their future evolution (Figure 4). When we consider population projections by the Wittgenstein Centre, used in scenario 3 to reflect changes in educational attainment, we find that in Guatemala the educational level is significantly lower than the other countries, with two-thirds of its population having primary education or less. Brazil and Mexico show a similar proportion of their population with low education (around 40 percent) but differ in the distribution of the intermediate levels, with a higher proportion of incomplete secondary in Mexico. The Peruvian and Chilean populations are the better-educated ones, with more than 50 percent of their population finishing high school. All the countries considered would experience an important increase in their educational level by 2050 if the global and national trends continue. The differences among countries would still be relevant, but the ordering remains unchanged: Chile and Peru with better educational results, followed by Brazil and Mexico, and Guatemala last with an important difference with the rest. Except for Guatemala, the proportion of the population with primary education or less would be under 20 percent and the population with complete tertiary education would almost reach 20 percent, peaking at 35 percent in Peru. Again, the situation of Guatemala in 2050 would almost mimic the one of Brazil in 2015.
Population structure by educational levels, 2015 and 2050. Data from Wittgenstein Centre (Reference Lutz, Goujon, Samir, Stonawski and StilianakisLutz et al. 2018) and UN population projections.

Turning to present labor force participation, Figure 5 shows activity rates according to sex and age groups in 2015, while additionally illustrating the Swedish female rates. As mentioned before, in scenario 2 we project rates as if women’s participation in Latin America would equal the participation of Swedish women. This implies a substantial change in activity rates. In 2015, 83 percent of Swedish women between the ages of twenty-five and sixty are active in the labor market; female activity rates do not reach this figure in any Latin American country. Swedish women tend to stay very active until they reach sixty-four (the retirement age in Sweden is sixty-five years for the guaranteed pension scheme and flexible between sixty-one and sixty-seven for earnings-related pensions), the age at which their activity decreases drastically. From this age on, Latin American female activity rates are higher than those of Swedish women, who have already retired from the labor market.
Labor force participation rates by sex and age group, 2015. Data from national household surveys, around 2015.
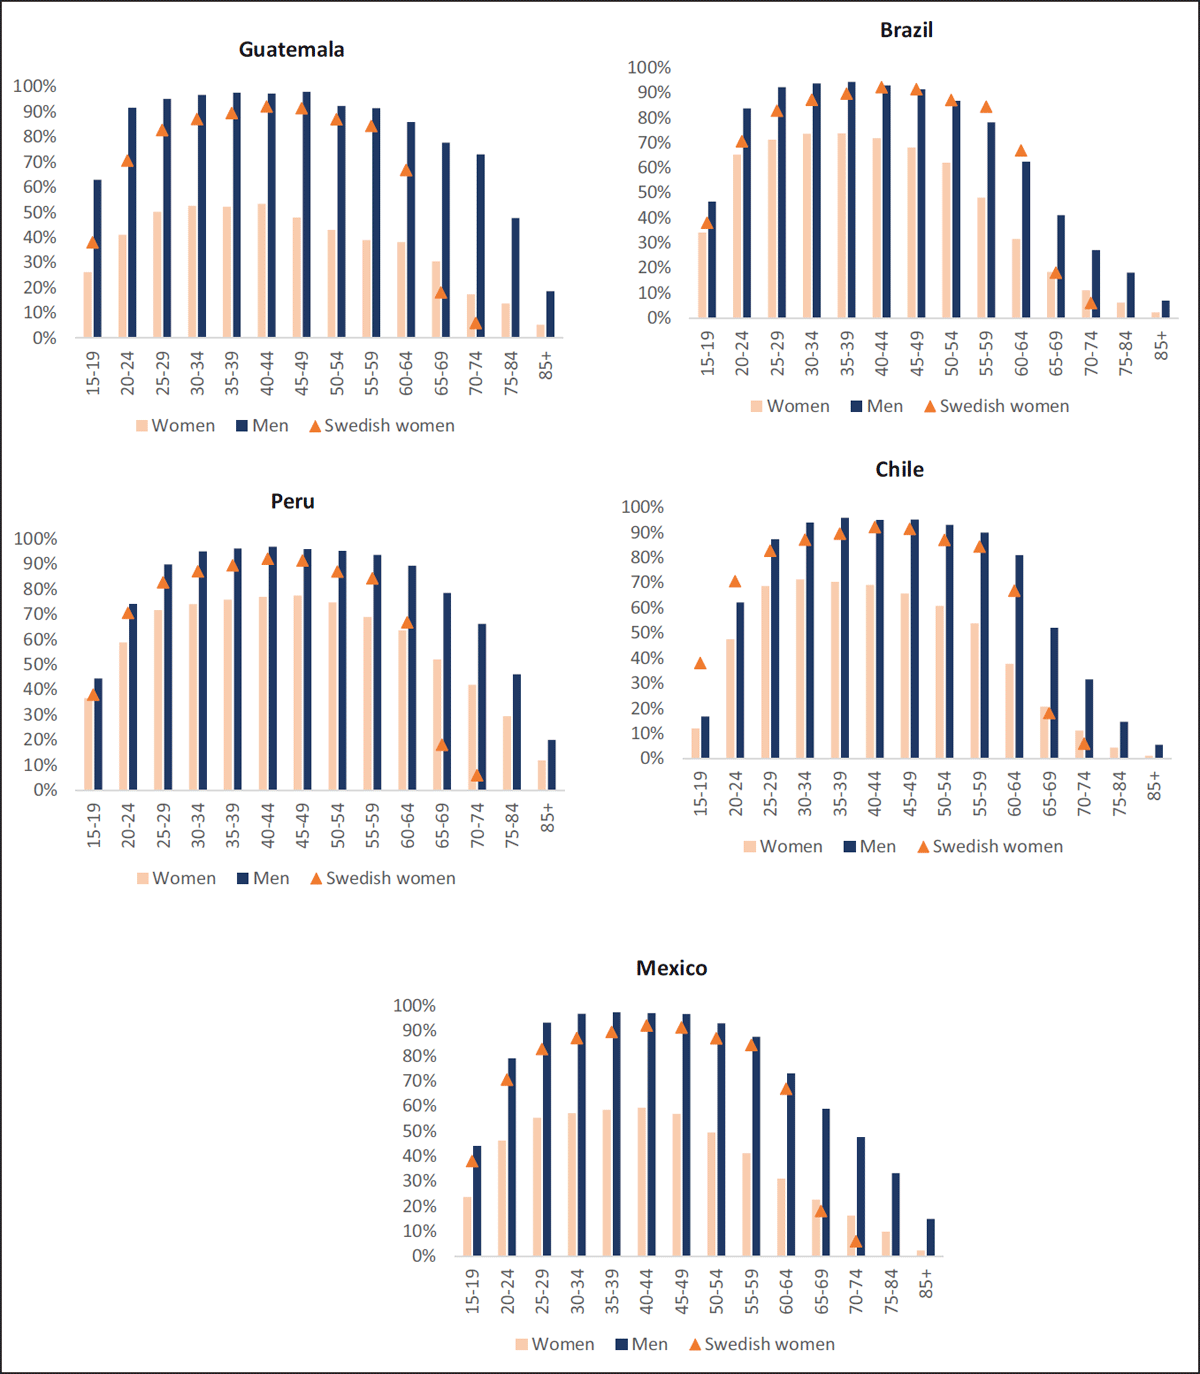
The lowest rates of female participation in the labor market are observed in Mexico (45 percent) and particularly Guatemala (41 percent). In these countries, the present gap with Swedish women is extremely large. For example, even when considering the highest level of participation in Guatemala (53 percent in the forty to forty-four age group), this would have to increase by 39 percentage points to reach the activity rate of Swedish women in that same age group. On the other end, Peru has the highest rates of female participation in the region (63 percent). Therefore, the difference with Swedish women is reduced to less than 15 percentage points among those under sixty-five. Although the Chilean total female participation rate is lower than in Brazil (48 percent vs. 54 percent), this difference is explained mainly by the elevated rates among young Brazilians. When comparing women over twenty-four years old, the rates between these two countries are very similar. Compared to Swedish rates, the differences increase with age (until sixty-four), reaching up to 35 percentage points (Figure 5).
The activity rates used for scenario 3 require further detail, by age group, sex, and education level. In every country, the gender differences persist for all the educational levels but become smaller as the education level increases. In addition the differences between educational levels are smaller among men than among women.
The weaknesses of productivity dynamics in Latin America have been widely debated in the literature (see Reference Daude and Fernández-AriasDaude and Fernández-Arias 2017; Reference Rodríguez-Apolinar and Fernández-AriasRodríguez-Apolinar and Fernández-Arias 2016; and Reference CaselliCaselli 2016; among others) and the consensus situates lagging productivity as a main problem for the region. The disappointing relative labor productivity of Latin American countries in relation to that of the United States (Figure 6) results in the fact that, in 2016, labor productivity in Latin America represented less than 30 percent of the labor productivity of the United States. Caselli (Reference Caselli2016) argues that differences in efficiency in using the production functions explain a large part of Latin America’s persistent income gap. These differences in efficiency arise mainly from resource misallocation (instead of factors such as technology adoption). Many authors agree that the fall in relative labor productivity can be explained by the loss of higher productivity jobs in Latin America, particularly in the industrial sector, and the migration of workers to other less productive activities, such as the services sector (ECLAC 2012; Reference McMillan and RodrikMcMillan and Rodrik 2011; Reference CaselliCaselli 2016).
Labor productivity in Latin America as percentage of labor productivity in the US, five-year moving averages, in PPP. Data from OECD/CAF/ECLAC, based on The Conference Board Total Economy Database™, May 2016.

In any case, the structural factors behind disappointing labor productivity growth in Latin America may be reinforced by the ageing process. As discussed above, the effects of workforce aging on productivity can operate in different ways and are a debated issue. The analysis of future trajectories of productivity is a complex task. In this article the wages of each group (by age, sex, and education level) are used as a proxy for productivity, and the ratios between the groups are assumed to remain unaltered over time. We are aware that this is a strong assumption, as wage gaps by educational groups are a result of the supply and demand of workers in each group and so may vary in the medium and long run as educational attainment improves. Despite the simplicity of this assumption, it is usual in exercises of static microsimulation whose main objective is to discuss potential future evolutions.
We consider the mean income earnings for active people, valued in 2011 productivity per capita dollars, by age and sex for the first two scenarios and also by educational level for the last one. The differences in the income level (a proxy of productivity) in our groups of countries are very important, with Guatemala at the lower end and Chile at the highest one (Figure 7). In all countries and for all ages, women’s earnings are lower than men’s.Footnote 8 Also, the wage structure through age is similar in all the countries considered, with the highest earnings between the ages of thirty and fifty-five, approximately. Note that in the first and second scenarios, no assumption is made about educational levels. Implicitly, it is assumed that the structure is the same as the observed in the current active population, to maintain the average wages within the age and sex groups.
Average labor income for active people by country, 2015 (in PPP dollars). Data from national household surveys, around 2015.

Results
We present the evolution of three key variables: labor force participation rate, which reflects the labor supply; the dependency rate, measured as the ratio between the inactive population (people under fifteen and those over sixty-four that do not participate in the labor market) over the active population; and productivity of the workforce, measured through labor income (by sex, age, and educational group) in 2015.
Figure 8 presents the evolution of the activity rate for the five selected countries. There are major differences between the countries and between the scenarios for each country regarding both levels and evolution. In the demographic scenario, the activity rate declines in three of the five groups of countries (Table 3). This means that the expected evolution of the age and sex composition of the population will force the activity rate down in most of the region’s countries, as there will be a rise in the proportion of the elderly, whose participation in the labor market is lower. This raises the challenge of maintaining the level of production with a significantly smaller workforce.
Labor force (over fifteen) participation rates by county and scenario, 2015–2050. Data from United Nations (2017) and Wittgenstein Centre (Reference Lutz, Goujon, Samir, Stonawski and StilianakisLutz et al. 2018).

Variation of activity rates (ages 15+) between 2015 and 2050, in percentage points.

Sources: United Nations (2017) and Wittgenstein Centre (Reference Lutz, Goujon, Samir, Stonawski and StilianakisLutz et al. 2018).
The effects are most pronounced in the countries where the demographic transition is most advanced, represented by Brazil and Chile, which reach the end of the period with significantly lower activity rates (with reductions of 10 and 7 percentage points, respectively). At the other extreme, the countries represented by Guatemala and Peru are at no risk of their active populations diminishing because of demographic factors, as their demographic transition is still in the early stages. Results for all countries in 2015 and 2050 are presented in Figure A.2 in the appendix.
When this rate is observed at the central ages (between twenty and fifty-nine) in the demographic scenario, the declines are much more moderate, indicating that the observed reduction is mainly explained by the rise in the relative size of the older age groups (Appendix Figure A.3). In Brazil the activity rate in these ages falls by 3 percentage points, in Mexico and Chile by just 1 point, and it remains unchanged in the rest of countries.
Results from the first scenario are likely to overestimate aging effects, as no behavioral changes are included. The other two scenarios consider factors that can directly influence the population’s activity levels: large-scale incorporation of women into the labor force and rising levels of education.Footnote 9
When female activity rates are assumed to increase, overall activity rates improve in all countries compared with the effect of only considering demographic factors of the first scenario (Figure 8). Activity levels in Guatemala and Mexico would also be higher than the observed levels in 2015, a finding explained by their low level of female activity and younger population structure. In these countries, the female participation rate would grow by approximately 20 percentage points (Table 3). In Chile and Peru, the large-scale incorporation of women into the labor market would mitigate the negative effects of demographic developments.Footnote 10 Indeed, the activity rate would increase in the medium run before the effect is offset by the weight of demographic factors. Conversely, rising female participation in the workforce in Brazil would not be enough to maintain the current activity levels, and the overall activity rate would drop by about 5 percentage points. When considering central ages (twenty to fifty-nine), the growth in activity rates is even larger in all countries, showing increases even in Brazil (Appendix Figure A.3), implying that the decreases observed in Brazil relate to demographic factors.
Lastly, in the increased education scenario, the trends are similar to those seen in the demographic scenario, though changes are smaller. The assumptions underlying this scenario produce two effects. On the one hand, increasing the level of education would push the activity rate up, because more-educated people have higher levels of participation (both by age and by sex). On the other hand, increasing the education levels has effects on fertility and mortality that strengthen the effects of the demographic shift, bearing down on the activity rate. In Guatemala, female participation rates increase by 5 percentage points, while men’s rates remain practically stable. In the remaining countries, female activity is reduced, but to a lesser extent than that observed in the demographic scenario (Table 3). Results for all countries are presented in Appendix Table A.1.
Variations in the labor supply, in addition to demographic changes, modify the dependency ratio, understood as the number of people that each active person must sustain. In general, as population ages, the dependency ratio grows, given the increase in the elderly population (that do not participate in the labor market). However, reduced fertility rates exert decreasing pressure on the dependency ratio. Additionally, the inclusion of new workers in the labor market also decreases the dependency ratio, while any change that implies fewer workers will produce an increase in the ratio.
In the demographic scenario, trends in dependency rates are consistent with each country’s progress in the demographic transition (Figure 9). In Brazil and Chile, dependency rates would increase in the analyzed period: despite the fall in the number of children, there is a greater increase in the number of elders and an important decrease in the number of workers. In contrast, in Mexico, Peru, and (to a greater extent) Guatemala, decreased fertility rates would generate important reductions in the dependency rate. It must be noted that, by the end of the analyzed period, most countries would have approximately one inactive person for each active person. The only exceptions are Peru—which would have more than one active person for each dependent—and Chile, which would have 1.15 inactive persons per active one.
Dependency rate by country and scenario, 2015–2050. Data from United Nations (2017) and Wittgenstein Centre (Reference Lutz, Goujon, Samir, Stonawski and StilianakisLutz et al. 2018).

The reduction of fertility rates presses downward on the dependency rate in every country. When we do not consider children in the dependency rate and instead measure it as the ratio between the inactive population over fourteen and the active population, the dependency rate increases in every country. In Mexico and Peru, this last measure increases while the global dependency rate (total inactive population per active population) decreases. This means that the fall in the number of workers and the increase in the number of inactive elders is compensated by the substantial fall in the number of children.
In scenario 2, the inclusion of new workers results in a reduction of the dependency rate compared to scenario 1. Under this context, every country has more than one active person per dependent. By the end of the period, Brazil has the largest value, switching places with Chile. This is explained by the low female participation rates in Chile compared to Brazil. These results reveal the potential of female labor force participation in light of the demographic processes of the region.
In the third scenario, we observe improvements in the dependency ratio compared to the first scenario, though these differences are small. This is because higher levels of educational attainment have ambiguous effects on the dependency ratio, as was mentioned before. Only in Brazil and Chile are changes in the dependency ratio positive. To sum up, with increasing female participation or—to a lesser extent—a more educated workforce, the inclusion of new workers results in the stability of the dependency rate compared to the demographic scenario, except for Guatemala, where an important reduction prevails (see Table 4). Results for all countries in 2015 and 2050 are presented in Appendix Figure A.4.
Variation in dependency rates between 2015 and 2050, in percentage points.

Sources: United Nations (2017) and Wittgenstein Centre (Reference Lutz, Goujon, Samir, Stonawski and StilianakisLutz et al. 2018).
Because changes in the composition of workers affect the value of their contribution to the production process, it is worth considering the productivity changes implicit in each of the scenarios, using wages as a proxy. As discussed above, the effects of aging on productivity are controversial and difficult to predict. In our exercise, we project changes using the available information to illustrate potential trends. The evolution of per capita productivity can be explained by three components: (1) the number of workers (the more workers there are, the greater the total productivity), (2) the contribution of each worker, which can be summed up in productivity per worker that depends on the age, sex and education level of the workers, and (3) the change in the country’s population, that changes the denominator of the per capita productivity. Figures 10 and 11 present the evolution of productivity per capita and per worker, respectively.
Productivity per capita (PPP dollars) by countries and scenarios, 2015–2050. Data from United Nations (2017) and Wittgenstein Centre (Reference Lutz, Goujon, Samir, Stonawski and StilianakisLutz et al. 2018).

Productivity per worker (PPP dollars) by countries and scenarios, 2015–2050. Data from United Nations (2017) and Wittgenstein Centre (Reference Lutz, Goujon, Samir, Stonawski and StilianakisLutz et al. 2018).

In the purely demographic scenario, the differences observed in the trends of per capita productivity are explained by the stage in the demographic transition that countries have reached.Footnote 11 Countries at the early stages of the transition (Guatemala, Mexico, and Peru) would experience substantial increases in aggregate productivity over the thirty-five years considered because of the evolution of the demographic composition of their population.Footnote 12 However, the productivity levels will remain low in comparison with the other countries of the region. Countries where the transition is most advanced (Brazil and Chile) would present reductions in productivity, albeit not very large ones (less than 5 percent). The main channel through which these changes are processed is the change in the number of people in the working-age group: it increases as a share of the total in the first group and declines in the second. In all countries, though, the share of workers in the most productive age groups (between thirty and fifty) is ex.
However, given that the weight of older workers would increase in the period (and older workers show higher productivity), every country shows improvements in productivity per worker. In Guatemala, Mexico, and Peru, the increases in productivity per capita are greater than the increase in productivity per worker.Footnote 13 In contrast, in Brazil and Chile the increase in productivity per worker is slightly diluted because of a reduced number of workers.
When women are incorporated into the labor market, productivity per capita improves in all the countries. This is because the number of people in the labor market increases, significantly raising overall output. However, productivity per worker improves less than productivity per capita. The reason is the assumption that incorporating women into the labor market would not alter the gender gaps currently affecting earnings, which stands in for productivity differences in this exercise. The implication is that the new female workers entering the labor market would have below-average productivity, forcing down productivity per worker. In Guatemala, for example, the productivity per capita increases by almost 50 percent in scenario 2, while productivity per worker only increases by 2 percent. In Peru and Mexico, productivity per capita grows by 15 percent and 26 percent respectively, but productivity per worker remains virtually unchanged.
As expected, the greatest increase in productivity is observed in scenario 3 (Table 5). In Guatemala, the 86 percent increase in productivity per capita means it would surpass Mexico’s productivity levels, even when considering the 41 percent growth in this country. The impact of education is also very strong in Peru, where productivity per capita would increase by 35 percent. Only under this scenario, we observe a significant increase in productivity in Brazil and Chile. The increases in productivity per worker are even higher than those for productivity per capita. The productivity changes in this scenario are very high and respond to an important increase in the educational level and to the assumption that wage differentials between educational groups would not change in response to the modification in the educational composition of the population. While the first factor is plausible,Footnote 14 a more realistic analysis of the variation of the wage differential would require the application of general equilibrium models, which is beyond the scope of this article.
Variation in productivity between 2015 and 2050, percentage variation.

Sources: United Nations (2017) and Wittgenstein Centre (Reference Lutz, Goujon, Samir, Stonawski and StilianakisLutz et al. 2018).
It is relevant to notice that these results about the potential evolution of productivity under the different scenarios consider only the effect of demographic and educational factors. The effect of public and private investment, as well as foreign direct investment, whose relevant role has been underlined for Latin America (Reference GutierrezGutierrez 2006; Reference MonteroMontero 2008), is not considered in our simplified framework. The exercise shows that one way to reverse the decline in overall productivity in the countries more advanced in the demographic transition is to increase education, as the higher productivity associated with this would offset the decline in the number of workers caused by demographic change. The potential adverse effects of population aging on productivity growth shown in the demographic scenario can be reversed if economies rely on a smaller but more productive workforce. Our exercise illustrates the prediction of Lee and Mason (Reference Lee and Mason2010), who state that if small cohorts of workers have high levels of human capital, standards of living may increase even in a context of apparent unfavorable age structure. Also, our exercise does not contemplate how other factors, such as soft skills, may boost productivity (Reference Adhvaryu, Kala and NyshadhamAdhvaryu, Kala, and Nyshadham 2018; Reference Prada, Rucci and UrzuaPrada, Rucci, and Urzua 2019).
Final Remarks
Population aging generates many challenges and concerns in Latin American countries, but these are not homogeneous across the region. In most of the region’s countries (Venezuela, the Dominican Republic, Ecuador, El Salvador, Guatemala, Honduras, Mexico, Nicaragua, Paraguay, Peru, and Bolivia) the demographic factor is still favorable and there is scope to exploit the demographic dividend and increase the population’s total labor force participation. In these countries, the main problem is low productivity. In another set of countries (Brazil, Chile, Colombia, Costa Rica, and Uruguay), major productivity increases can be achieved by substantial changes in the incorporation of women into the labor market and, especially, in the level of education. Two countries (Argentina and Panama) are in an intermediate situation, with very small productivity gains in the demographic scenario.
A main message of our analysis is the importance of policies that can mitigate the potentially negative impact of an aging workforce, especially in contexts of low productivity. In a region always compelled by short-run tensions and instabilities, the design of policy responses to medium- and long-run challenges constitutes a complex task. In all the countries, to secure the conditions for sustained growth there is a need to create institutional and political conditions for higher productivity by incorporating new workers or increasing their level of education. In the specific case of new workers, given the prevailing gender gaps in labor market participation and in contexts of high informality, policies promoting the creation of formal female jobs, childcare facilities, and the promotion of a system of values centered on gender equality seem crucial steps. The achievement of higher productivity can also benefit from complementary actions in terms of improvement of health outcomes and active labor market policies that help to mitigate the depreciation of skills over the work life and to develop soft skills to enhance productivity.
Additional Files
The additional files for this article can be found as follows:
Appendix Supplementary tables and figures. DOI: https://doi.org/10.25222/larr.924.s1
Data File Replication data set. DOI: https://doi.org/10.25222/larr.924.s2


 Open access