Introduction
In April and October 1994 two high-resolution (25 m) SARs flown on board the NASA space shuttle acquired images of much of the Earth’s land surface, including multiple acquisitions of part of Hielo Patagónico Sur (HPS; southern Patagonia ice field, South America) (Fig. 1). The Spaceborne Imaging Radar C (SIR-C) operated at L- and C-band (23 and 5 cm wavelengths) in fully polarimetric mode, while the X-band SAR (X-SAR) illuminated the ground at 3 cm wavelength, transmitted and received at vertical polarization (VV) (Jordan and others, 1995), This paper focuses on the changes detected in the X-SAR images, because the glacier responses were most prominent at this shorter wavelength.
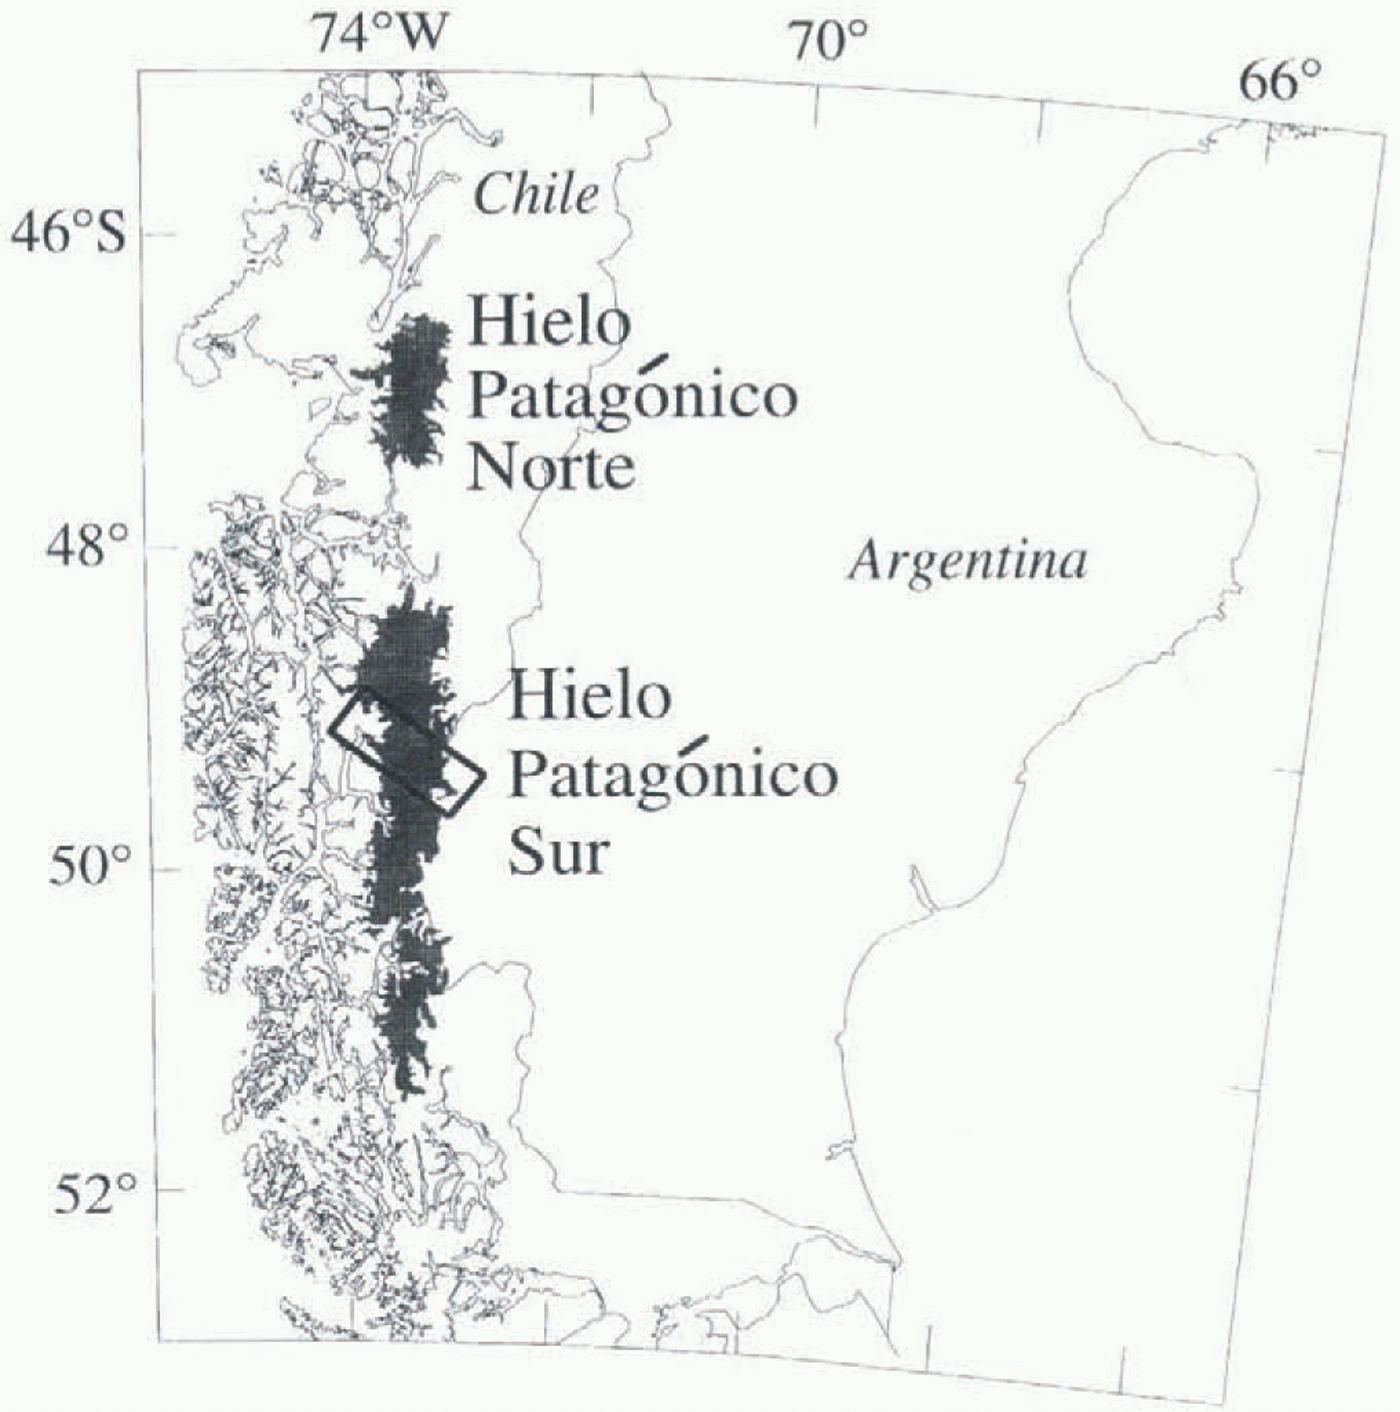
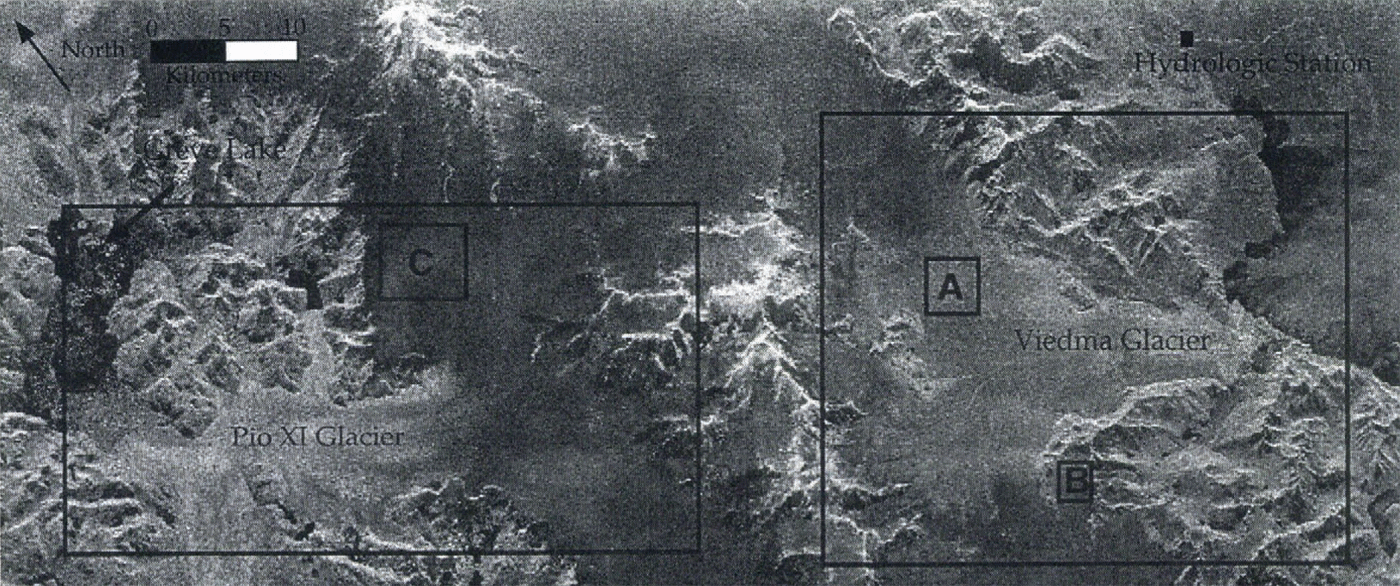
Fig. 1. The location of Hielo Patagónico Sur showing the position of Figure 2, the transect study area.
Synthetic aperture radar (SAR) has the ability to detect changes in surface and near-surface glacier conditions, because it responds to snow wetness, grain-size distribution, density and surface roughness. Year-round, all-weather observations are possible because SAR can penetrate clouds and darkness. Recent work has shown that spaceborne SAR has the ability to delineate glacier zones (radar glacier zones) which can be correlated with seasonal-scale meteorological conditions (Fahnestock and others, 1993; Forster and others, 1996; Smith and others, in press). The unique daily and sub-daily multi-temporal series of SIR-C/X-SAR images of part of HPS provides the opportunity to access the effects of individual meteorological events on the stability of seasonal trends in radar backscatter.
Transient Effects of Weather
Part of HPS which straddles the Chilean/Argentine border and includes the two major outlet glaciers, Pio XI and Viedma, is used as the study area (Fig. 2). Glaciar Pio XI is the largest glacier in HPS, with an approximate area of 1275 km2 which ranges in elevation from sea level to 3380 m a.s.l. (Aniya and others, 1996). Glaciar Viedma’s 964 km2 area is between 250 m a.s.l. and an unknown elevation, with the equilibrium-line altitude estimated at

1250 m a.s.l. (Aniya and others, 1996). The dark area in the renter of the image is the interior of the ice field, while the bright areas to the cast and west are the two outlet glaciers. Nunataks, bare rock ridges and steep slopes are imaged as the bright objects within the ice field, The dark/light boundary on Glaciar Viedma (near A in Fig. 2) is probably the upper limit of exposed ice, since its position changes between the two missions and it is close to the previous position of the exposed ice limit as seen in March 1975 aerial photographs. However, this boundary on Glaciar Pio XI probably does not represent the exposed ice boundary, since it is stationary on several ERS-1 and X-SAR images acquired at different times during the melt year, and snow cover is observable below this boundary on shuttle photographs acquired during the October mission. On Glaciar Pio XI, this dark/light boundary is more likely the up-glacier edge of a heavily crevassed area which produces a
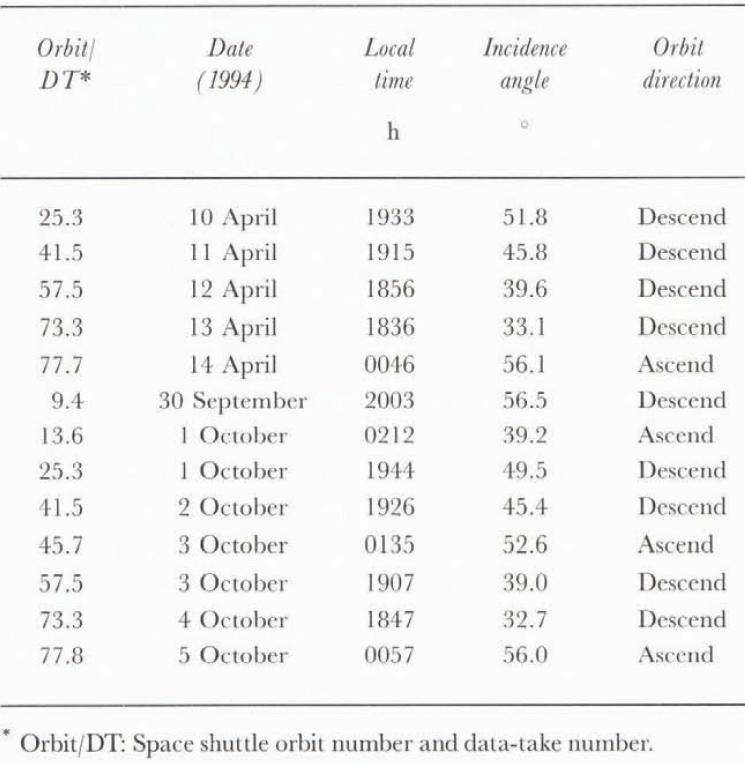
Table. 1. X-SAR scenes used in the April and October series
strong return from a very rough faceted surface even with wet snow at the surface. A detailed analysis and classification of these and other radar glacier zones which compares the differences between the two missions is possible with the polarimetric SIR-C data (Forster and others, 1996).
The Glaciar Pio XI–Viedma area was imaged for five consecutive days during both the April and October missions, providing an opportunity to observe daily changes in the ice field (table 1). Significant meteorological events occurred during each mission, including a major storm hitting HPS in April and a sharp decrease in temperature in October. Both episodes are recorded with spatial changes in the backscatter patterns in the mid-portions of the glaciers.
Storm during April mission
During the April mission the Glaciar Pio XI area was imaged on four successive descending orbits nearly 24 h apart a1 about 1900 h local time, then on one ascending orbit about 6 h after the last descending orbit. During this time a major cyclonic storm passed over the ice field. The formation and path of the cyclone is shown in the IR images from the geostationary GOES and NIMBUS satellites (Fig. 3a). The intensity of the storm is depicted in the SSMI-derived rain rates from the WETNFT program at the Marshall Space Flight Center (Fig. 3b). The sequence of X-SAR scenes is shown in figure 3c. The storm hit HPS a few hours before an X-SAR image acquisition shown in Fig. 3c(iii) (12 April 1994). By the next acquisition 1 d later, the storm had dissipated and moved to the south. At its peak intensity, the storm appears to have halted at the coast, but this is an artifact of the coastal mask used to separate the ocean- and land-based rain rate algorithms (Hollinger, 1991). The large gray areas in figure 3b are orbit-related data-acquisition gaps. Cyclonic fronts are common all through the year in Patagonia, and comprise approximately 80% of all precipitation delivery to the ice fields (Kondo and Nakajima, 1985). Therefore, it is important to understand the effect of such events.
Changes in the physical properties of the snow and ice
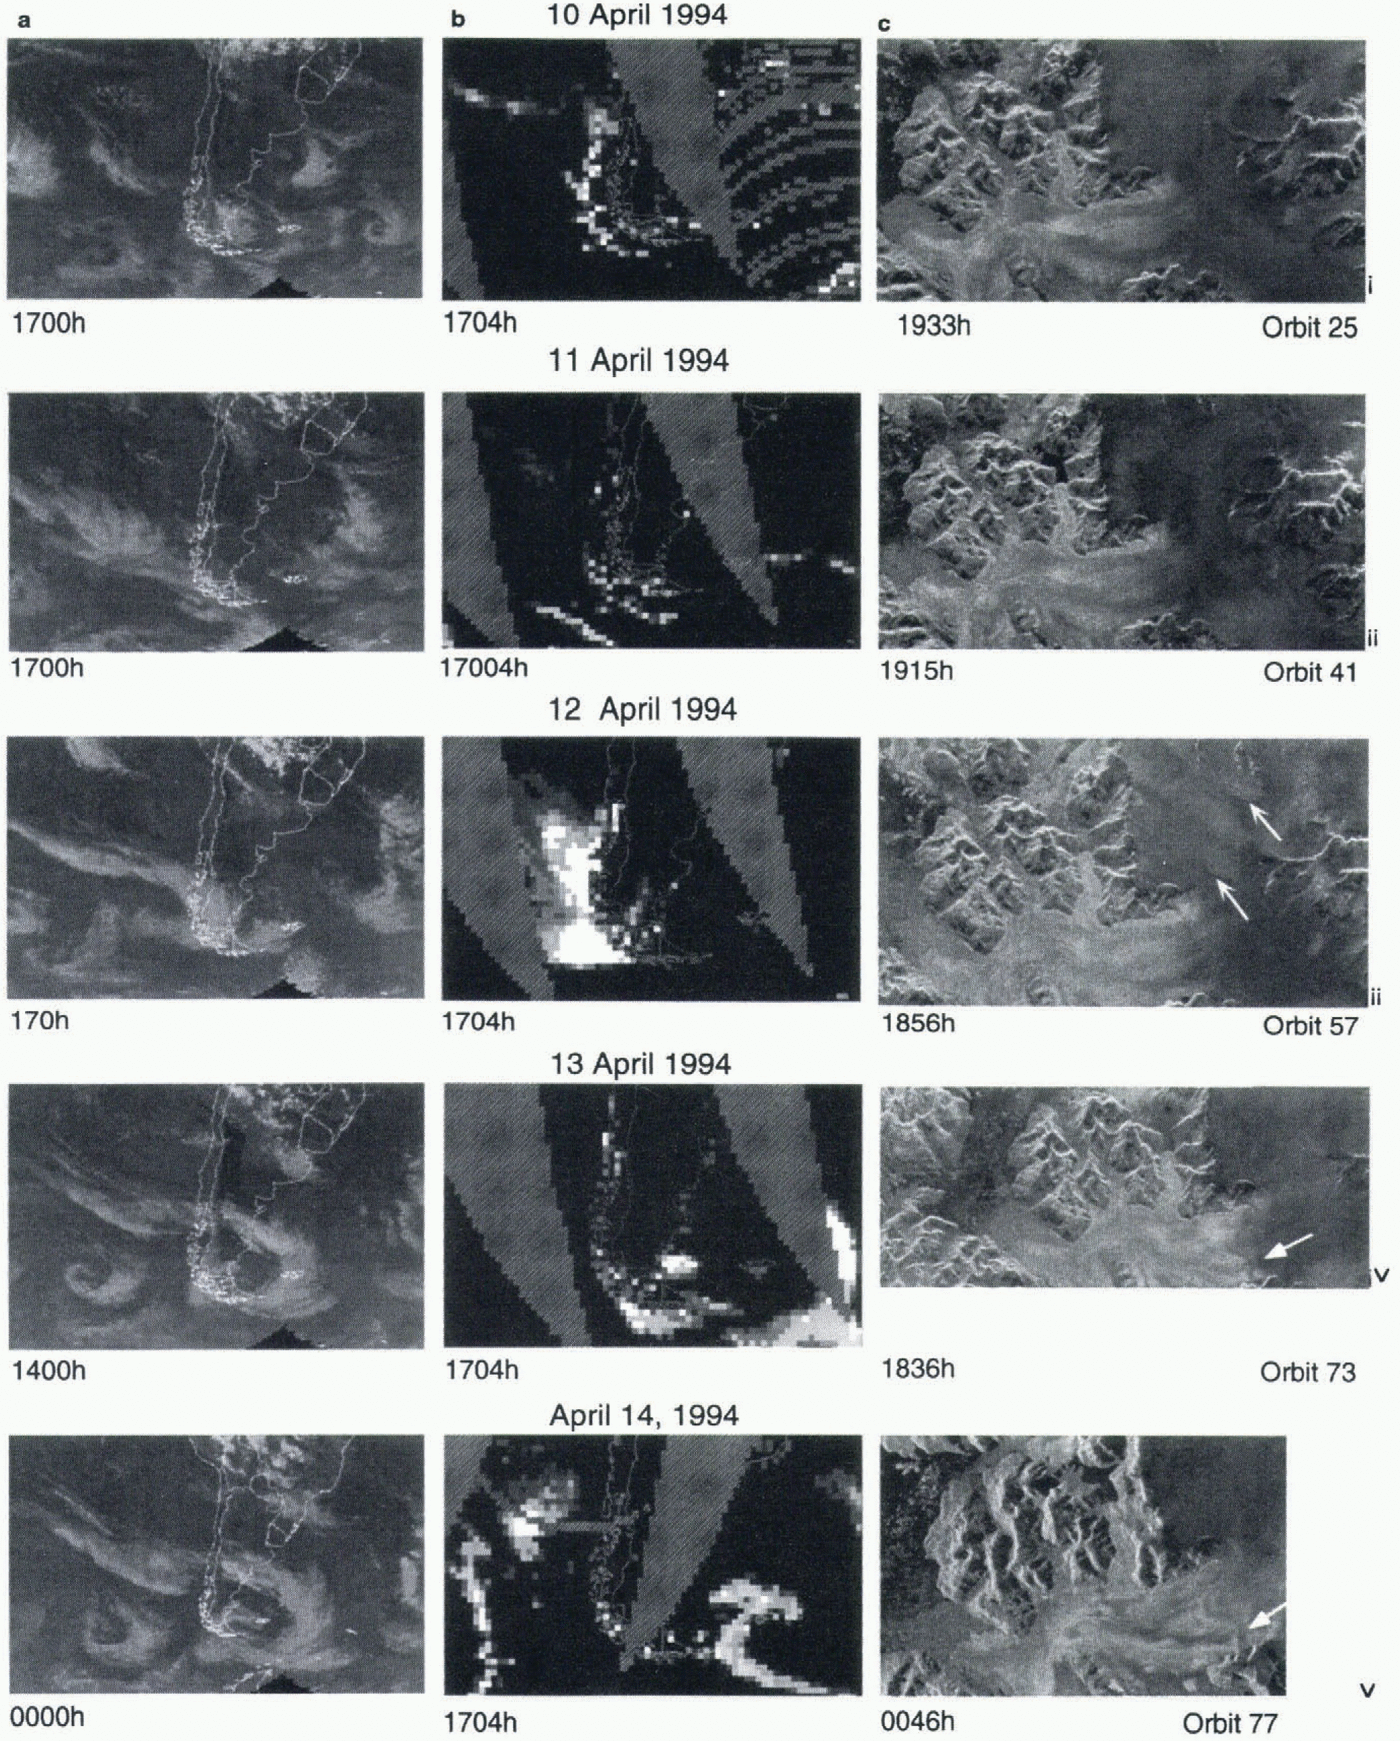
Fig. 3. A time series showing the April storm event, (a) Daily weather-satellite IR images from the geostationary GOES and NIMBUS, (b) Daily SSM/I-derived rain rates with values ranging from 3 mm h −1 (dark gray) to 22 mm h −1 (white). (c) X-SAR images of part of the HPS, acquired during the April mission. Arrows indicate areas of changing backscatter referred to in text.
on Glaciar Pio XI are inferred from the integration of X-SAR images with meteorological observations. The two pre-storm X-SAR scenes (Fig. 3c(i) and (ii)) show little change. However, the scene acquired during the storm shows a large increase in backscatter on the accumulation area of Glaciar Pio XI (Fig. 3c(iii) arrows), as well as an increase in backscatter on Greve Lake. A slight increase in backscatter over the entire scene is expected since the radar incidence angle (look angle) decreases between successive acquisitions (table 1). The changes attributed to the storm, however, occur only in isolated areas. The prominently streaked pattern of the brightened return implies a wind-driven

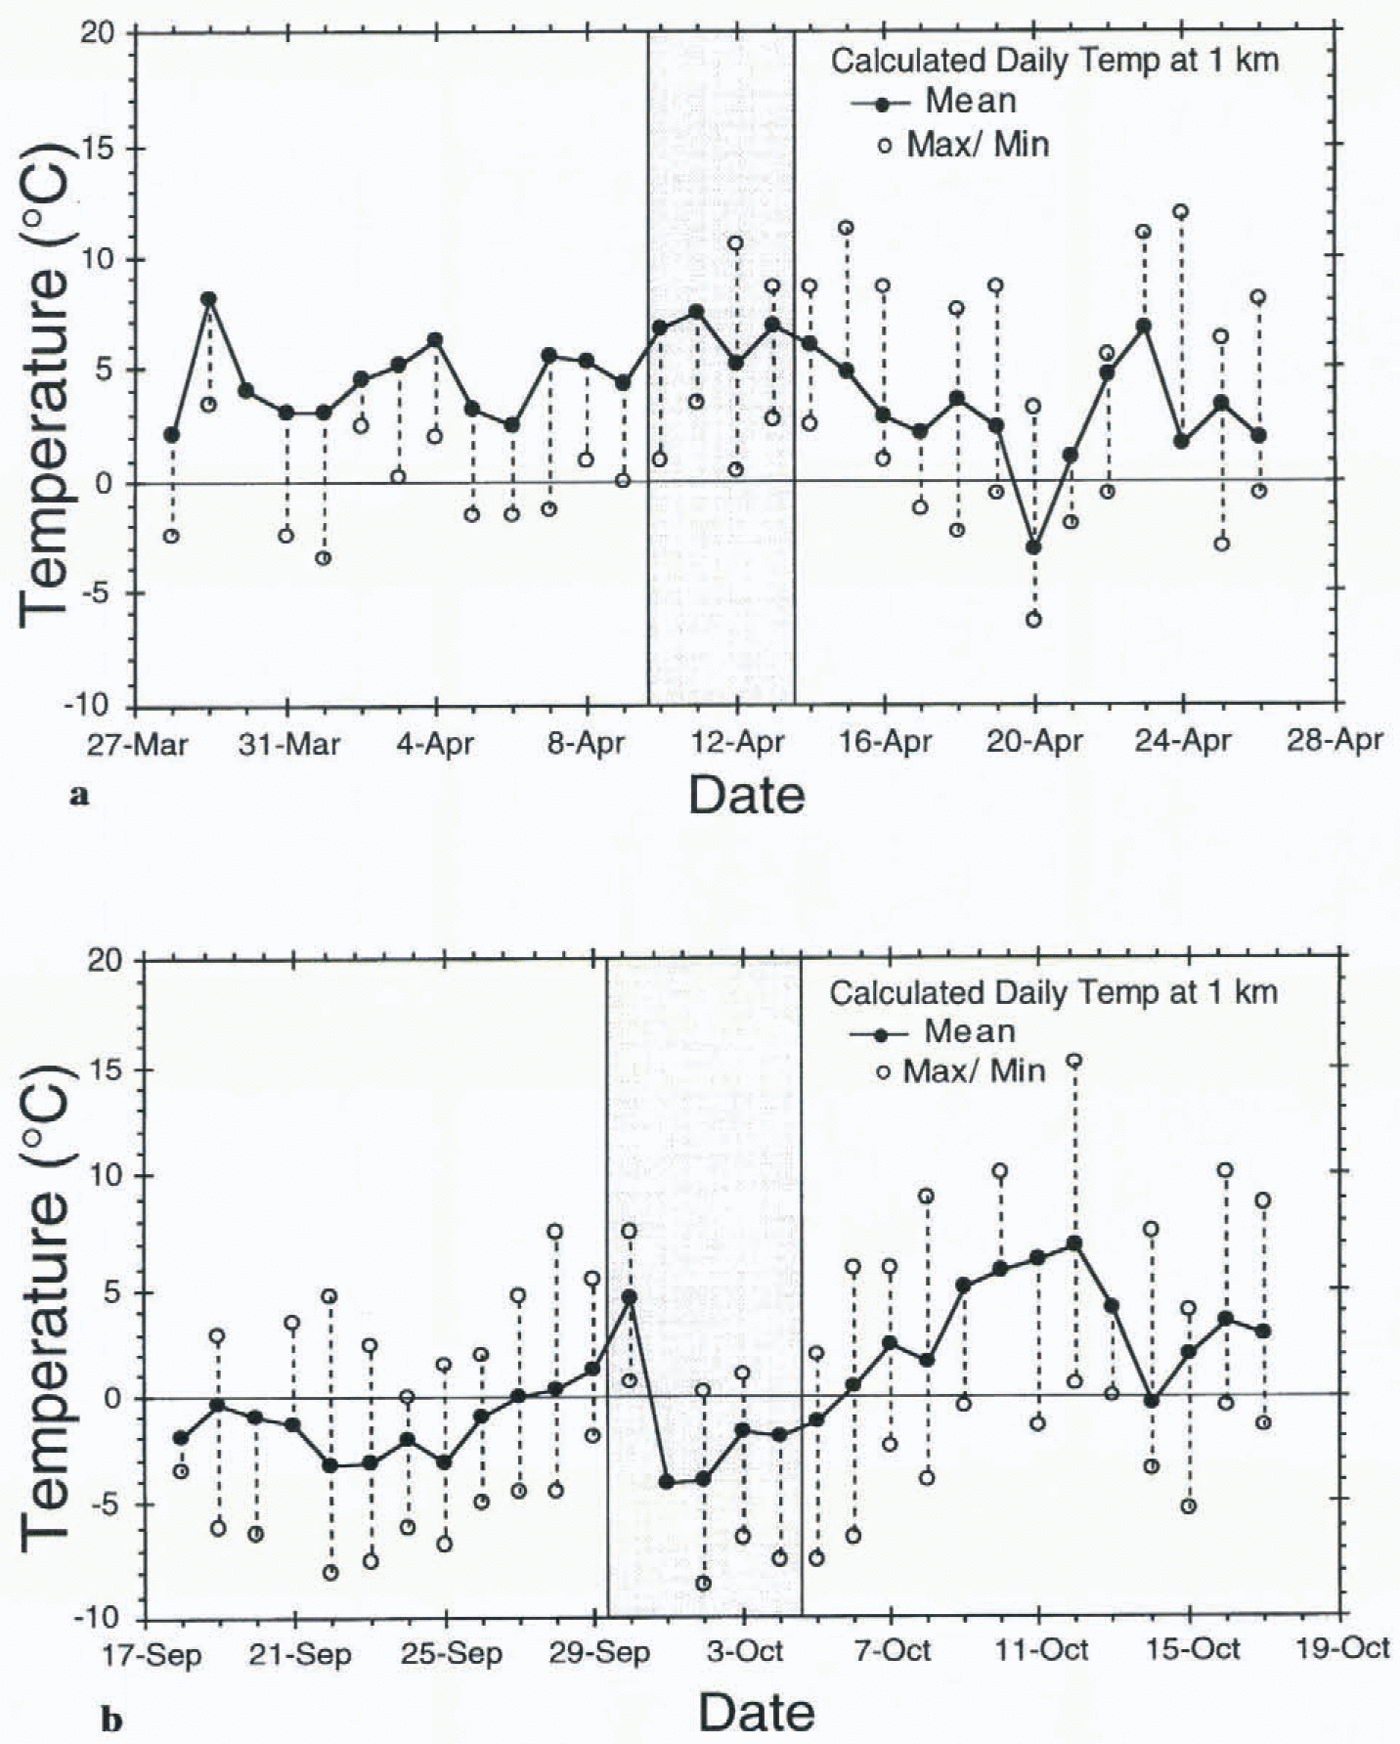
Fig. 4. Estimated daily temperatures at an elevation of 1000 m a.s.l. calculated from, the Lago Argentina station for weeks surrounding the (a) April and (b) October missions in 1994. The shaded areas represent the acquisition dates of scenes analyzed in this study.
source from the northwest which is consistent with the general storm track. We attribute the 5 dB increase in radar backscatter (σ °) to rain or hail roughening the wet-snow surface. The increase in backscatter was corrected for the change in look angle using the procedure discussed in the next section.
Mätzler and Schanda (1984) observed a similar response from a snow test field in the Swiss Alps. During a summer rainstorm, X-band backscatter at 45° incidence from a wet-snow surface showed an increase of >4.2 dB. The increase was found to result from surface roughening by raindrops. The backscatter increase was almost simultaneous with the start of the rain, and the backscatter returned to pre-storm levels within 3–4 h after the end of the event. During another event the scatterometer saturated for more than 6 h due to surface roughening by hail. The backscatter return may have been increased by scattering from the individual large ice grains covering the snow surface.
In contrast to the X-SAR, L-band backscatter on Glaciar Pio XI shows almost no increase, while C-band has a moderate sensitivity. This is consistent with the small-scale surface roughness change expected from rain roughening, and it implies that changes were limited to the surface and upper portions of the snowpack. An estimated temperature range of 0–10°C from the Lago Argentina station (approximately 110 km southeast of the study area and at an elevation of 200 m a.s.l.) using a 5.3°C km−1 lapse rate (Aristarain and Delmas, 1993) at the elevation of the site (Fig. 4a) indicates the precipitation could have initially been in the form of rain or hail.
The image acquired the day after the storm (Fig. 3c(iv)) shows significant changes from the storm scene (Fig. 3c(iii)). The bright zone in the accumulation area disappeared and the distribution of the icebergs in Greve Lake became more scattered. The boundary between the upper, dark and the lower, bright portion of Glaciar Pio XI moved down-glacier forming an arcuate boundary parallel to elevation contours (Fig. 3c(iv) arrow). This is probably not the lowering of the true wet-snow line. It is more likely the result of a fresh wet snowfall blanketing the heavily crevassed zone diminishing the return from the rough ice which may have already been covered with snow. The short duration of the precipitation-induced surface roughening found by Mätzler and Schanda (1984) is consistent with the decrease in backscatter in the accumulation area found in this study 1 d after the storm.
By the next acquisition 6 h later (Fig. 3c(v)), the large dark boundary has retreated up-glacier to near the pre-storm position, leaving the two concentric arcuate dark
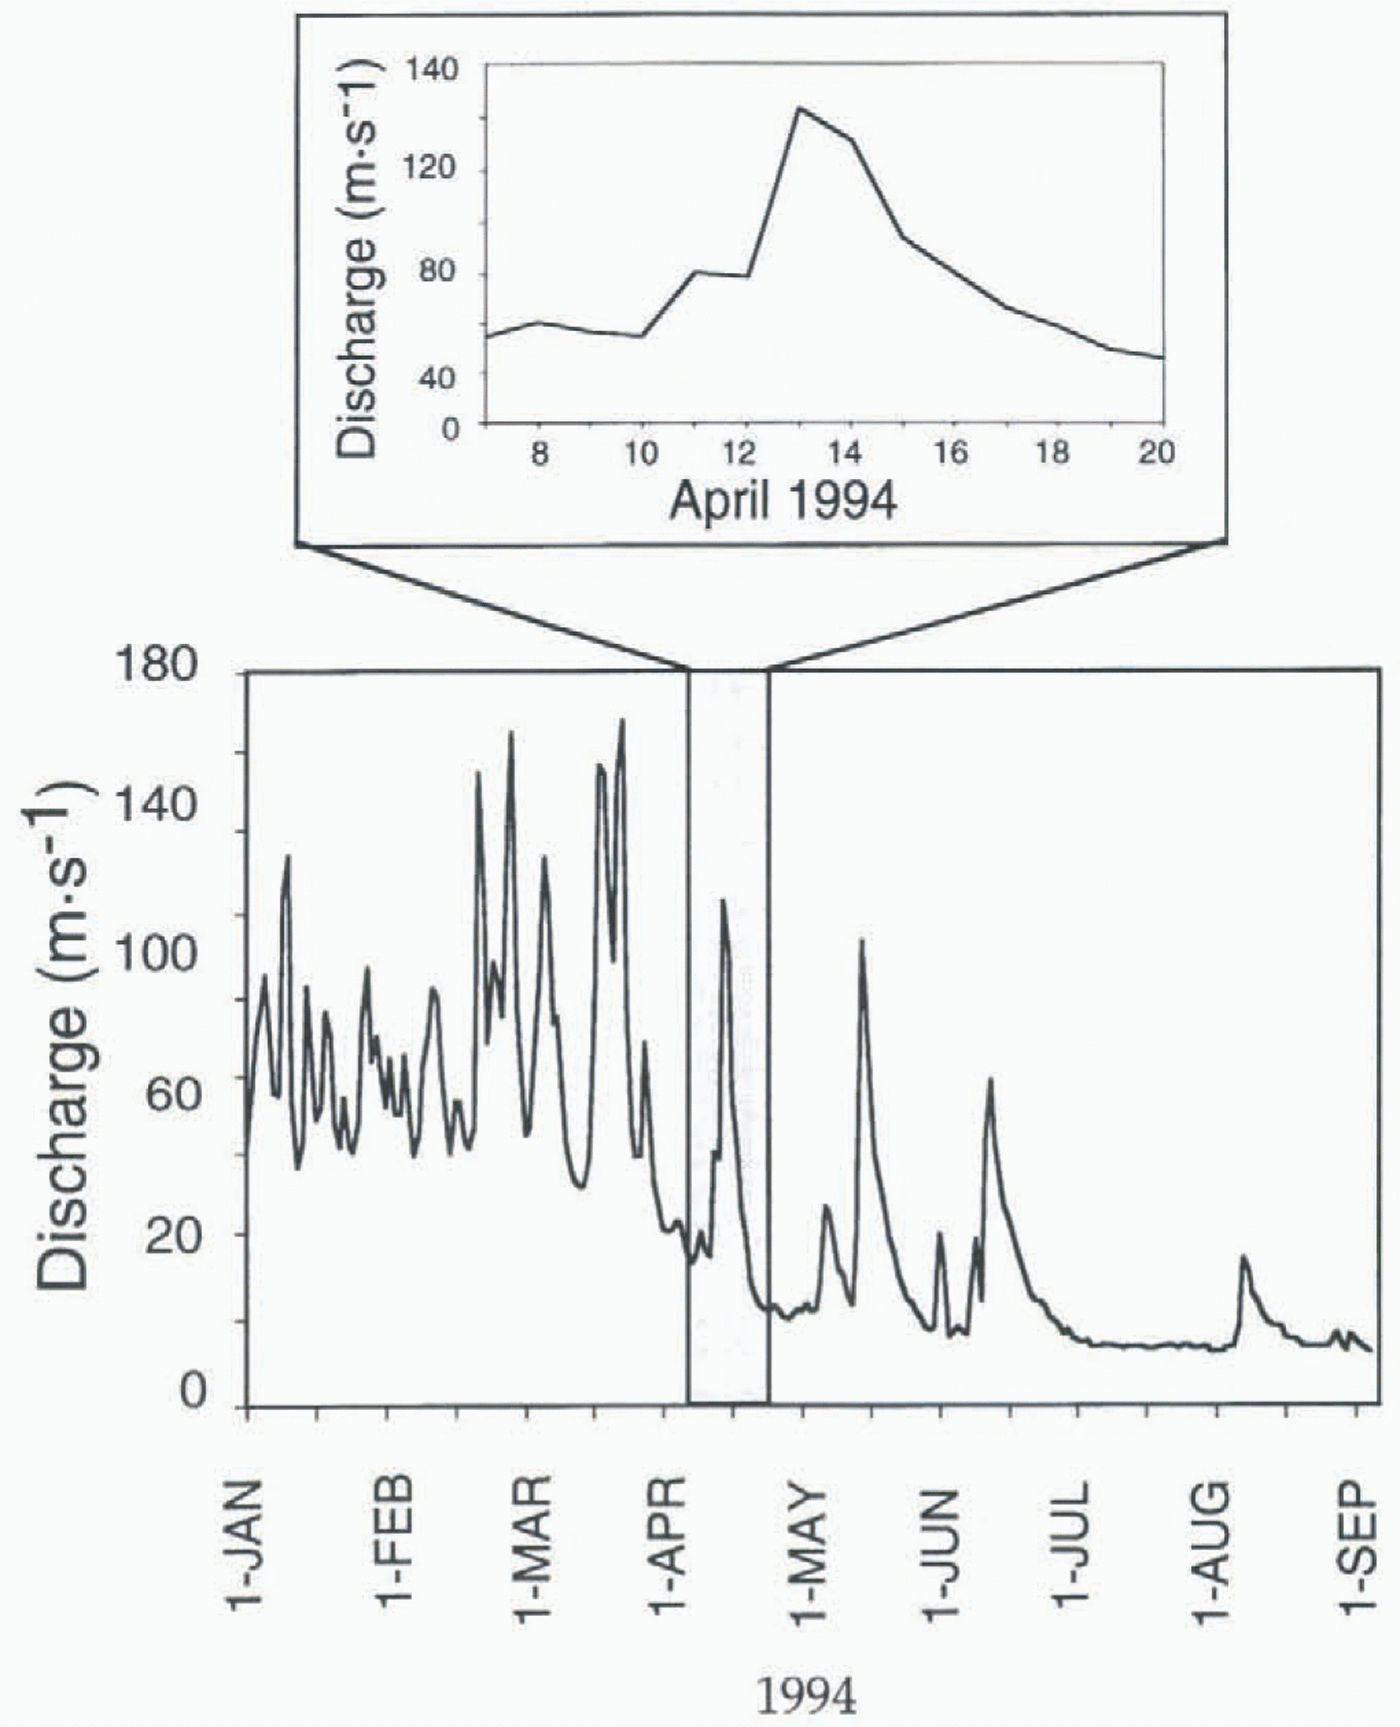
Fig. 5. A daily hydrograph of the Rio de Las Vueltas, Argentina (inset: the response due to the 12 April 1994 storm event). The location of the station is shown in Figure 2.
bands at the location of the former boundary. This movement up-glacier is probably clue to the wet snow melting enough to allow X-band scattering from the rough surface. This interpretation is consistent with the warm mean and minimum temperatures during this time (Fig. 4a).
The flow response to the storm event of Rio de Las Vueltas, a small glacier-fed river immediately north of Glaciar Viedma (location in Fig. 2), is shown by its hydro-graph (Fig. 5). The storm is identifiable as one of the significant runoff-producing events in 1994. A more detailed view shows the immediate response of the river to the passing storm on 12 April 1994 as a sharp increase in discharge followed by an exponential decay over the next 6d (Fig. 5 inset). The drainage basin contains small outlet glaciers immediately north of Glaciar Viedma and cirque glaciers on isolated peaks. The small ramp in discharge initiated the day prior to the storm may be a result of increased melt-water produced from the gradual warming trend evident in the temperature records from Lago Argentina (Fig. 4a).
Temperature drop during October mission
A sharp decrease in temperature was recorded at Lago Argentina (Fig. 4b) at the beginning of the October time series, which is coincident with an increase in backscatter from the glaciers. The increase in backscatter is evident in the Glaciar Viedma series of X-SAR images shown in Figure 6. Two test sites are chosen on Glaciar Viedma in order to study the temporal and spatial distribution of the backscatter changes (shown as boxes A and B in Figure 6). We first discuss site A which is common to all acquisitions and contains the area of greatest backscatter increase. The first scene (Fig. 6a) shows site A as very dark, but by the next acquisition about 6 h later (Fig. 6b) the site is considerably brighter. The brightening trend continues through the rest of the time series for site A, and in general for the lower part of the glacier. The time series comprises both ascending and descending orbits, which substantially changes (1) the acquisition time which could introduce a thaw-and-freeze signal into the images, and (2) local incidence angle which changes the backscatter response. However, the dominant trend of the time series is an increasing brightness of the lower portions of the glacier.
In order to access the changes in backscatter quantitatively, a correction for the different look angles for each acquisition was applied. As a consequence of imaging the same area on successive precessing space-shuttle orbits, the look angle (radar incidence angle) is different for each scene. Even in relatively fiat areas or areas of constant slope, this change in incidence angle affects the radar return if surface scattering is dominant, as is the case for X-band returns from bare glacial ice and wet snow. The radiation pattern of such a surface is not isotropic but more Lambertian-like, with a peak at normal incidence and decreasing return as the incidence angle increases (Ulaby and others, 1982). In order to compare quantitatively the change in backscatter from the sequence of X-SAR images, we calculate radar returns corrected to normal incidence angle (Θ = 0°) for areas which experienced change during the October sequence. To describe the backscatter dependence on incidence angle accurately, the specific physical properties of the snow and ice must be known. In the absence of this information an approximation of σ ° as a function of Θ is possible using a popular model (Ulaby and others, 1982):
where Θ i is the incidence angle at the scene center, and N is a constant usually chosen between 1 and 2. Backscattering from an isotropic surface is modeled with N = 1, while a pure Lambertian surface is described by N = 2. Most surfaces exhibit scattering dependencies between the two models. Shi and Dozier (1993) empirically chose N = 1.8 to normalize C-band SAR data for glacial ice discrimination. This correction is applied to the σ ° of the test sites discussed below. The choice of N does not effect the trend of the corrected σ °s.
The mean corrected and uncorrected backscatter for Glaciar Viedma test sites A and B and Glaciar Pio XI site C (location shown in Fig. 2) along with the estimated temperatures from figure 4b are shown in Figure 7. Test site A, at 1500 m, experiences the greatest increase in backscatter over the series (15 dB corrected). The dramatic increase of 4–6 dB in corrected backscatter between the evening of 30 September and the early morning of 1 October is coincident with the sudden temperature drop from 4.9° to −4.7°C at 1000 m a.s.l. between 30 September and 1 October. The sub-freezing temperatures continue for the duration of the X-SAR acquisitions, and the backscatter continues to increase. The other Glaciar Viedma site (B) at higher elevation, between 1500 and 2000 m, begins the time series with a high return, and fluctuates less than 3 dB during the acquisitions. The returns from test site C on Glaciar Pio XI (between 1000 and 1500 m) climb continuously, but increase less than 4 dB from the low initial return of −16 dB.
We interpret the increase in σ ° to be a result of a decrease in snow wetness due to refreezing of free water. Radar glacier zone classification from the polarimetric data indicates
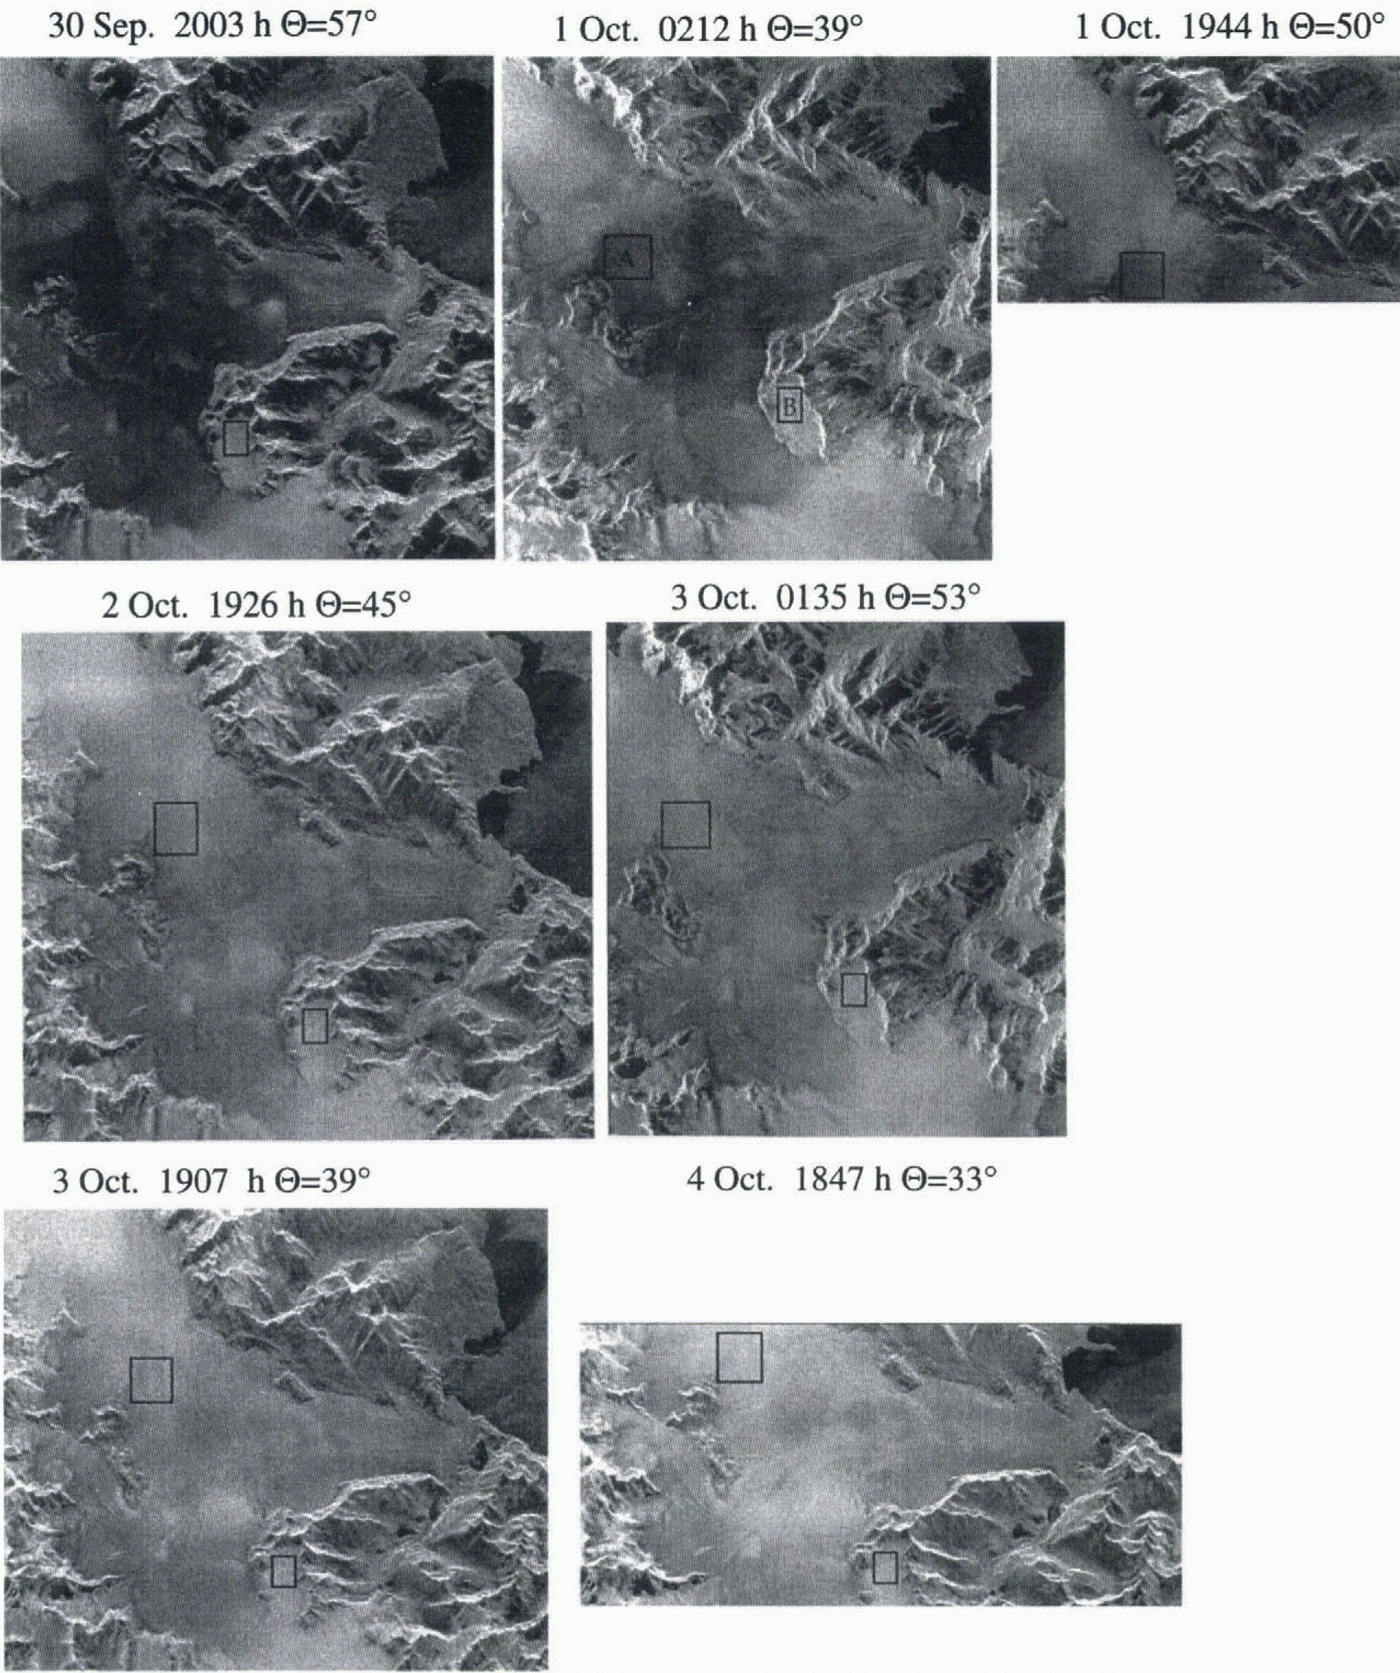
Fig. 6. X-SAR images of Glaciar Viedma during the October mission showing the increase in brightness during the time series. The black box is glacier test site A referred to in Figure 7. Radar illumination is from the top for descending orbits (a, c, d, f) and from the left for ascending orbits (b and e).
site A changed from a wet to a drier snow condition (Forster and others, 1996). The specific interpretations of the snowpack changes are presented below. The high dielectric loss of the wet snow, which extinguishes the volume-scattering component, decreases at freezing temperatures. The resultant reduction of free water increases the importance of volume scattering as a dominant scattering mechanism. Continued cold temperatures further reduce free-water content and cause snow grains to grow larger through melt metamorphism. Both processes increase the effectiveness of the snow grains as volume scatters. Thus, the backscatter may continue to increase as long as air temperatures remain below freezing.
The backscatter values for sites B and C are more stable because they may not experience a temperature transition through 0°C. Site C, at the lowest elevation, has X-band backscatter values characteristic of smooth wet snow (Rott and Mätzler, 1987). Here the temperature may have remained above freezing throughout the X-SAR acquisitions, thus showing less change in backscatter values. The entire western portion of the scene is characterized by little change during the time series. The snow at site B, the highest elevation, has X-band backscatter values characteristic of dry snow conditions (Rott and Mätzler, 1987). The temperature at this site may have remained below 0°C during the time series. The backscatter values at site A begin close to those
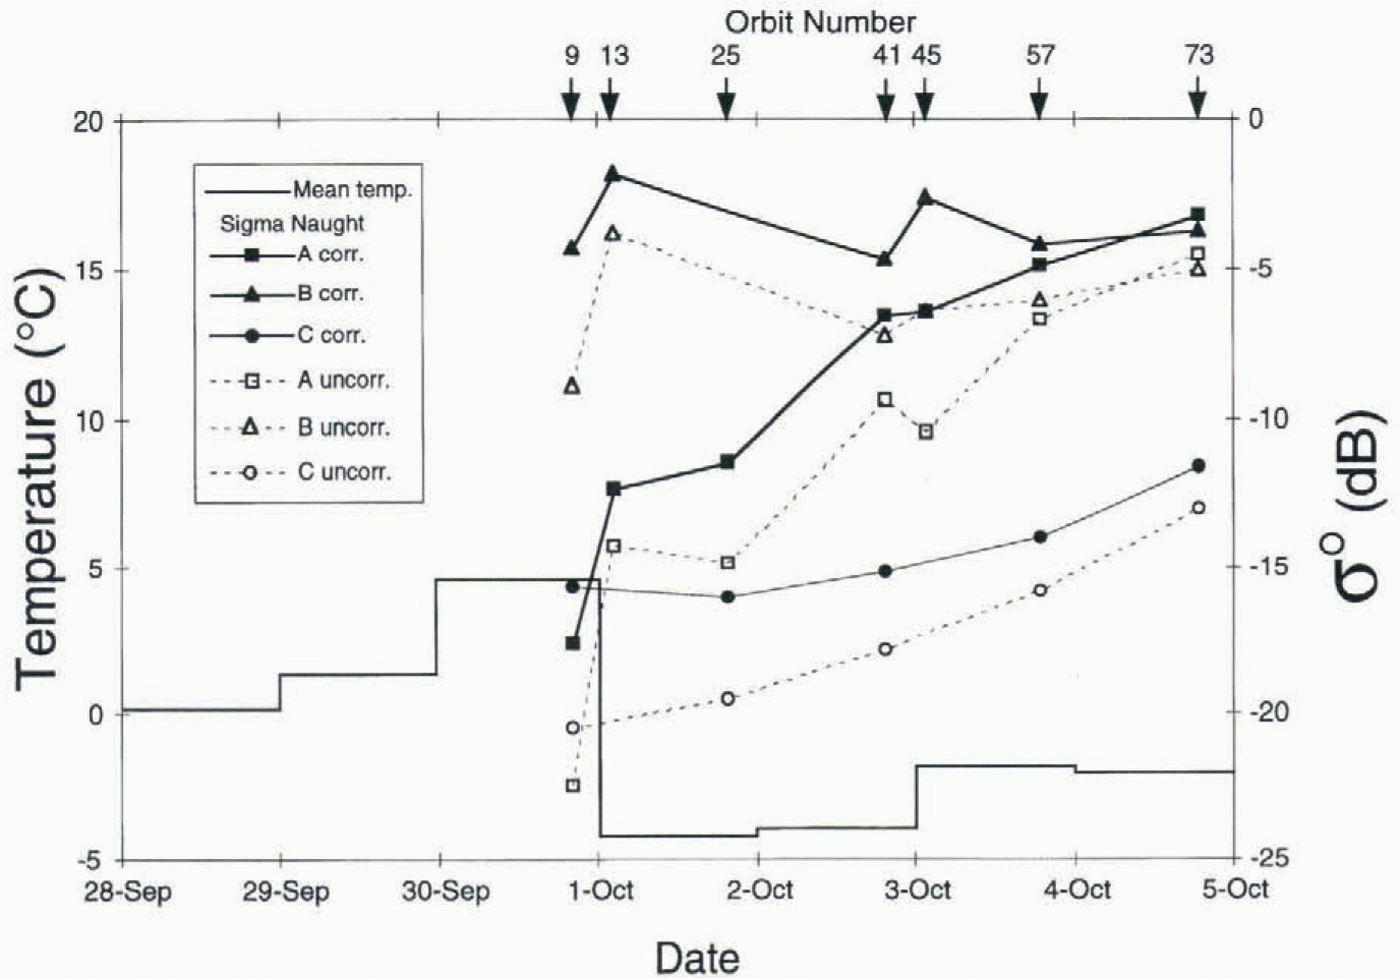
of site C, but at the end of the series are similar to site B values, implying the snow at site A changed from wet to dry conditions.
Discussion and Conclusions
While the April storm effects were visible on the western side of HPS, there were no observable changes on the eastern side. The hydrograph (Fig. 5) shows that significant precipitation occurred on the eastern side of the divide. The intensity of the wind-driven precipitation producing surface roughening on the west may be reduced on the cast. On the other hand, there is a large snow-covered plateau on the west, forming the accumulation area of Glaciar Pio XI, where the storm effects are displayed, while on the east only a small portion of smooth snow-covered area on Glaciar Viedma is imaged. Therefore, the storm effects may not be visible here because the storm roughening of the surface is not detectable on an existing rough surface. The change in position of the dark/bright backscatter boundary observed on the west due to an accumulation of wet snow may not be observed on the east because the precipitation may have fallen as rain.
The increase in backscatter during the October mission, which is correlated to a sharp decrease in temperature, is seen on both sides of HPS but is more pronounced on the eastern side (site A). The difference in elevation of the test sites cannot adequately explain this disparity. Backscatter increases can be seen within the narrowing terminal valley of Glaciar Viedma which is below the elevation of site C. One interpretation of the smaller and more gradual increase in backscatter during the October time series on the western side is that the temperature changes are less abrupt. Temperature gradients across HPS are unknown, but this interpretation is consistent with a buffered maritime climate on the west coast and a more continental climate on the eastern side.
These two examples demonstrate the ability of X-band SAR to detect daily variations in the physical properties of the snow and ice. Reasonable interpretations of these variations are possible without ground observations or topographical correction of the SAR images, because of (1) the frequent acquisition of the images and (2) the integration of satellite and ground meteorological data. The sub-daily acquisitions highlighted subtle changes in the presence of the dominant static scene responses. The variety of incidence angles from ascending and descending orbits made it possible to distinguish the robust changes from those caused by local incidence-angle effects. Without the meteorological observations it would have been difficult to explain the changes observed in the X-SAR images during either time series.
Although the presently orbiting and planned spaceborne SARs have near-monthly repeat cycles rather than SIR-C/X-SARs daily cycle, this data set has provided insight into the stability of radar glacier zones observable by these satellite-based SARs. The backscatter changes caused by the April storm event were relatively subtle. The change in the position of the boundary between the two prominent radar glacier zones on Glaciar Pio XI is small, and only 2 d after the storm the boundary is back to the pre-storm location. The abrupt temperature drop in October, however, caused significant backscatter and radar glacier-zone boundary changes which persisted throughout the time series. The C-baud images analyzed in this data set show similar but less intense changes than the X-SAR images. Therefore, we conclude that, at least for the HPS, the radar glacier zones observable by ERS-1, -2 and RADARSAT will not be significantly affected by synoptic-scale storms but can be altered by abrupt changes in temperature. This implies that the spatial and temporal distribution of melting may be inferred from shifts in the boundaries of the radar glacier zones.
Acknowledgements
Support for this work was provided by NASA through the Spaceborne Imaging Radar (SIR-C) grant 958745. Weather satellite images and temperature records are courtesy of the WETNET program at Marshall Space Flight Center. The hydrograph was obtained by B. Malamud courtesy of Agua y energia electrica of Argentina. The authors wish to thank T. Scambos for review of an early manuscript and R. Engeset and M. Kennett for insightful suggestions regarding the final manuscript.