


In the last few years, it has been recognised that the dietary intake of marine PUFA (fish oil rich in 20 : 5n-3 (EPA) and 22 : 6n-3 (DHA)) appears to play a key role against the adverse effects of the so-called metabolic syndrome, which includes type 2 diabetes, insulin resistance (IR), dyslipidaemia, hypertension, obesity and CVD(Reference Clarke1–Reference Lombardo and Chicco3), among other diseases. Another nutritionally important n-3 PUFA is α-linolenic acid (ALA, 18 : 3n-3). In human diets, the essential ALA is usually derived from plant sources. Epidemiological and clinical studies have suggested that a higher consumption of ALA is associated with a reduced risk of CVD(Reference de, Renaud and Mamelle4–Reference Djousse, Arnett and Carr6). Available information indicates that dietary fats rich in ALA such as linseed or perrilla oil, compared with those rich in linoleic acid, decrease serum lipid concentrations in rats(Reference Kim and Choi7–Reference Ghafoorunissa, Ibrahim and Natarajan9). One of the richest botanical sources of ALA is the chia seed (Salvia hispanica L.)(Reference Weber, Gentry and Kohlhepp10, Reference Bushway, Wilson and Houston11). Chia, which is also rich in fibre and minerals, was a major dietary component of the Mayans and Aztecs. Chia seed has also received increasing attention for its potential role in the prevention of dyslipidaemia. In this regard, some animal studies have shown a reduction in plasma TAG, NEFA and total cholesterol and an increase in HDL-cholesterol when this food ingredient was used as a source of dietary fat in normal or dyslipidaemic rats(Reference Ayerza and Coates12, Reference Chicco, D'Alessandro and Hein13). On the other hand, normal rats fed a sucrose-rich diet (SRD) developed dyslipidaemia and IR among other biochemical and metabolic alterations that mimic many aforementioned signs of the metabolic syndrome(Reference Lombardo and Chicco3, Reference Lombardo, Drago and Chicco14, Reference Pighin, Karabatas and Rossi15). We have recently demonstrated that feeding these rats for 3 weeks with a SRD in which chia seed was the source of dietary fat prevents the onset of dyslipidaemia and IR without changes in plasma glucose levels. Moreover, dyslipidaemia and IR in rats fed the SRD for a long term (5 months) were reversed without changes in plasma insulin levels when chia seed instead of maize oil became the dietary source of fat for the last 2 months of the feeding period(Reference Chicco, D'Alessandro and Hein13). In addition, dietary chia seed reduced increased epididymal and retroperitoneal fat pad weights present in long-term SRD-fed rats(Reference Chicco, D'Alessandro and Hein13), and induced lipid redistribution and attenuated metabolic cardiovascular and hepatic signs of rats fed a high-carbohydrate–fat diet(Reference Poudyal, Panchal and Waanders16). Ghafoorunissa et al. (Reference Ghafoorunissa, Ibrahim and Natarajan9) showed that in weanling normal rats fed a SRD, the partial substitution of dietary linoleic acid with ALA for 3 months resulted in lowered blood lipid levels and partially corrected sucrose-induced IR.
At present, the mechanisms by which dietary chia seed could normalise or improve altered plasma lipid levels are still not completely understood. It is possible that the proportion of ALA (64 % of total lipids) in the chia seed as a precursor of EPA and DHA, similar to the effect of fish oil, could modify fatty acid metabolism in the liver through the activation of PPARα and the down-regulation of sterol regulatory element-binding protein-1c (SREBP-1c), leading to a decrease in serum lipids.
Therefore, the aim of the present study was to determine whether changes in the fate of hepatic fatty acid metabolism (lipogenesis–oxidation) could play a role in the mechanisms underlying the effect of the dietary intake of chia seed in the prevention/reversion of liver steatosis and dyslipidaemia in rats fed a SRD. To achieve this goal, two experimental protocols were used. Both protocols were designed to investigate the effectiveness of chia seed as a dietary source of fat in SRD-fed rats in either: (1) preventing the development of the aforementioned metabolic abnormalities or (2) improving/reversing them in the presence of stable dyslipidaemia achieved after long-term SRD feeding.
In both protocols, we measured the activities of the following hepatic key enzymes involved in de novo lipogenesis and fatty acid oxidation: acetyl-CoA carboxylase (ACC); fatty acid synthase (FAS); glucose-6-phosphate dehydrogenase (G-6-PDH); carnitine palmitoyltransferase-1 (CPT-1 – the rate-limiting enzyme for mitochondrial β-fatty acid oxidation); fatty acid oxidase (FAO – generally used to monitor the activity of PPARα). Furthermore, in the liver, we analysed the protein mass levels of the transcription factors SREBP-1, which has a central role in the induction of the gene expression of lipogenic enzymes, and PPARα, which belongs to the superfamily of ligand-activated nuclear hormone receptors and regulates the expression of fatty acid oxidation enzymes.
Materials and methods
Animals
Male Wistar rats initially weighing 180–190 g and purchased from the National Institute of Pharmacology were maintained with unrestricted access to water and food under controlled temperature (22 ± 1°C), humidity and air flow conditions, with a fixed 12 h light–dark cycle (lights on from 07.00 to 19.00 hours). They were initially fed a standard non-purified diet (Ralston Purina). After 1 week of acclimatisation, the rats were randomly assigned to one of the two experimental protocols described in the following sections. The experimental protocols were approved by the Human and Animal Research Committee of the School of Biochemistry, University of Litoral, Argentina.
Dietary manipulations
Experimental protocol 1
A total of twenty-four rats were randomised into three groups and fed an assigned diet for 3 weeks (Table 1). The first group of rats received a semi-synthetic diet containing maize starch (60 % energy), protein (17 % energy) and maize oil as the source of fat (23 % energy) (control diet; CD). The other two groups received the same semi-synthetic diet with sucrose as the carbohydrate and fat provided by maize oil (SRD) or by chia seed (SRD+Chia).
Composition of the experimental diets* (based on the AIN-93 diet)
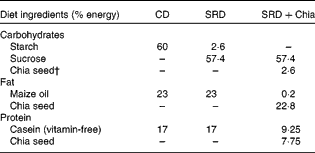
CD, control diet; SRD, sucrose-rich diet; SRD+Chia, SRD+chia seed.
* All diets contained by weight: salt mix, 3·5 % (AIN-93-MX(25)); vitamin mix, 1 % (AIN-93-VX(25)); choline chloride, 0·2 %; methionine, 0·3 %; fibre, 12 %. The SRD+Chia was balanced in the fibre and salt mix according to the amount of each one in the chia seed provided by the manufacturer.
† Chia seed (Salba; Salvia hispanica L.): 362 g/kg diet. Chia composition (g/100 g chia seed): carbohydrate, 37·45; insoluble fibre, 81 % of total carbohydrate; fat, 30·23; protein, 21·19. Mineral composition (mg/100 g chia seed): Na, 103·15; K, 826·15; Ca, 589·60; Fe, 11·90; Mg, 77·0; P, 604·0; Zn, 5·32; Cu, 1·66; Mn, 1·36.
Experimental protocol 2
A total of forty rats were divided into two groups and fed for 3 months with the CD (n 16) or SRD (n 16) described previously in experimental protocol 1. At that time, rats in the SRD group were randomly subdivided into two subgroups. The first subgroup continued with the SRD up to 5 months of feeding and the second subgroup received the SRD+Chia as the source of dietary fat for the next 2 months. The control group was fed with the CD throughout the experimental period. The fibre, vitamin mix and salt mix contents of each diet were similar. The carbohydrate, protein and fibre contents in the feed of the SRD+Chia group were balanced taking into account the amount of these nutrients present in the chia seed. The fatty acid composition of the chia seed was provided by the supplier (Table 2). The preparation and handling of the diets have been reported elsewhere(Reference Chicco, D'Alessandro and Hein13). The food in the animal cages was shaded from light and changed every day. All diets provided approximately 18·00 kJ/g of food. The weight of each animal and the energy intake were recorded twice per week during the experimental period in all groups and subgroups of rats.
Maize oil and chia seed fatty acid composition (g/100 total fatty acids)
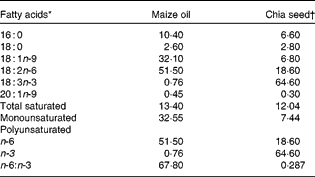
* Minor components made content up to 100 %.
† Salba; Salvia hispanica L. (Agrisalba SA, Buenos Aires, Argentina).
At least six rats from the three dietary groups were used in each procedure. They were anaesthetised with intraperitoneal sodium pentobarbital (60 mg/kg body weight). Blood samples were obtained from the jugular vein and rapidly centrifuged; plasma was either immediately assayed or stored at − 20°C. Liver, epididymal, retroperitoneal and omental adipose tissue were totally removed and weighed. Liver was immediately frozen and stored at the temperature of liquid N2. Visceral adiposity index (%) was calculated as follows and expressed as adiposity percentage(Reference Poudyal, Panchal and Waanders16):
 $$\begin{eqnarray} Visceral\ adiposity\ index\ (\%) = (retroperitoneal\ fat\ (g) + omental\ fat\ (g) + epididymal\ fat\ (g))/body\ weight\ (g)\times 100. \end{eqnarray}$$
Analytical methods
Plasma TAG, NEFA and glucose levels were determined by spectrophotometric methods and insulin by immunoreactive assays as described previously(Reference Rossi, Lombardo and Lacorte17). The insulin assays were calibrated against rat insulin standard (Novo Nordisk). TAG content was determined in the homogenate of frozen liver, as described previously(Reference Hein, Bernasconi and Montanaro18).
Enzymatic activity assays
ACC was assayed according to Zimmermann et al. (Reference Zimmermann, Haemmerle and Wagner19). The cytosolic fraction was obtained after centrifugation of the supernatant at 30 000 rpm for 1 h at 4°C. ACC was measured by an NADH-linked assay. FAS activity was assayed on the cytosolic fraction of liver tissue by measuring malonyl CoA-dependent oxidation of NADPH at 37°C, as described previously(Reference Hein, Bernasconi and Montanaro18). Liver tissue G-6-PDH, peroxisomal FAO and CPT-1 were determined as described recently(Reference Hein, Bernasconi and Montanaro18).
Western blot analysis of liver protein mass levels of PPARα and sterol regulatory element-binding protein-1
Liver homogenates were prepared for PPARα protein mass level analysis and Western blots were run under reduced–denatured protein (Laemmli buffer) as described by Hein et al. (Reference Hein, Bernasconi and Montanaro18). Kidney tissue extracts were employed as PPARα positive control. Nuclear and microsomal membrane extracts of SREBP-1 from the liver of rats were obtained by centrifugation in a sucrose gradient as described by Ascencio et al. (Reference Ascencio, Torres and Isoard-Acosta20) with slight modifications. Tissue was homogenised in lysis buffer (0·5 g tissue/3·75 ml) containing 0·3 m-sucrose, 5 mm-dithiothreitol, 5 mm-MgCl2, 0·05 % Triton X-100, 10 mm-Tris–HCl (pH 7·5) and tissue protease inhibitor cocktail (5 μl/100 mg). Tissue homogenates were centrifuged at 2000 rpm for 10 min at 4°C. The supernatant was used as the microsomal membrane extract. The pellet was resuspended in 2 ml of sucrose buffer containing 2·3 m-sucrose, 2 mm-MgCl2, 10 mm-Tris–HCl (pH 7·5) and tissue protease inhibitor cocktail (5 μl/100 mg). The suspension was centrifuged at 32 000 rpm for 60 min at 4°C. The pellet was used as the nuclear extract and resuspended in 600 μl of storage buffer containing 50 % glycerol, 2 mm-MgCl2, 0·1 mm-EDTA and 50 mm-HEPES (pH 7·5). The extracts were stored at − 70°C. The protein concentration of the extracts was determined by the Bradford assay. Protein samples were resolved on SDS–PAGE according to Laemmli. Before electrophoresis, all samples were boiled for 2 min in the presence of 1 % SDS with 200 μm-dithiothreitol. For immunoblotting, proteins in the SDS–PAGE gel were transferred to polyvinyldifluoride membranes. The membranes were probed with specific antibodies (rabbit anti-PPARα antibody and rabbit anti-SREBP-1 antibody; Santa Cruz Biotechnology, Inc.), respectively. The blots were then incubated with horseradish peroxidase-linked secondary antibody followed by chemiluminescence detection according to the manufacturer's instructions (Super Signal West Pico chemiluminescence detection; Pierce Biotechnology). β-Actin was used as a loading control. The intensity of bands was quantified by National Institutes of Health imaging software (http://rsb.info.nih.gov/nih-image/). The relationship between the amount of samples subjected to immunoblotting and the signal intensity observed was linear under the aforementioned conditions. In addition, the liver SREBP-1 analysis showed one electrophoretic band with an approximate molecular weight of 125 kDa and another band of 68 kDa; these bands represent the precursor and mature forms of SREBP-1, respectively(Reference Nakatani, Kim and Kaburagi21).
Statistical analysis
Sample sizes were calculated on the basis of measurements previously made with rats fed either a CD or a SRD(Reference Pighin, Karabatas and Rossi15, Reference Rossi, Lombardo and Lacorte17, Reference Hein, Bernasconi and Montanaro18), considering an 80 % power. Results are expressed as means with their standard errors. Statistical comparisons were done transversely between the different dietary groups. Statistical significance between the groups was determined by one-way ANOVA, with one factor (diet) followed by the inspection of all differences between pairs of means by the Newman–Keuls test(Reference Snedecor and Cochran22). Differences having P values lower than 0·05 were considered to be statistically significant (SPSS 15.0 for Windows; SPSS, Inc.).
Results
Body weight gain, energy intake, visceral adiposity index, plasma metabolite levels and liver TAG contents
Body weight and energy intake were carefully monitored in all groups of rats throughout both experimental periods. As shown in Table 3, after 3 weeks on the diet (experimental protocol 1), body weight and energy intake did not differ between the groups. The visceral adiposity index was similar in the three dietary groups. The values were as follows (six animals per group): 2·51 (sem 0·12) g in the CD group; 2·18 (sem 0·10) g in the SRD group; 2·58 (sem 0·08) g in the SRD+Chia group. As previously shown(Reference Chicco, D'Alessandro and Hein13), a significant increase in body weight and energy intake occurred in rats fed a SRD from 3 to 5 months compared with those fed a CD (Table 4, experimental protocol 2). However, in spite of a similar energy intake recorded in both the SRD and SRD+Chia groups during the last 2 months of the experimental period (3–5 months), weight gain at 5 months was slightly lower in the latter group. Moreover, the SRD-fed rats showed a significant increase in retroperitoneal, omental and epididymal fat pad weights, and therefore the visceral adiposity index was significantly higher compared with both CD and SRD+Chia groups. Chia seed as a dietary source of fat in the SRD significantly reduced the weight of the aforementioned fat tissues, reaching values similar to those recorded in the CD-fed group. The visceral adiposity index was as follows (six animals per group): 3·73 (sem 0·10) in the CD group; 6·23 (sem 0·70) in the SRD group; 4·09 (sem 0·21) in the SRD+Chia group (P< 0·05, SRD v. CD and SRD+Chia).
Body weight, energy intake, plasma metabolite levels and TAG liver of rats fed the control diet (CD), the sucrose-rich diet (SRD) or the SRD+chia seed (SRD+Chia)‡ (Mean values with their standard errors)
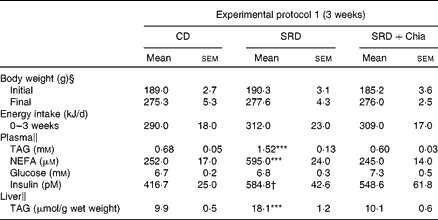
***Mean values were significantly different from those of the CD and SRD+Chia groups (P< 0·001).
† Mean value was significantly different from that of the CD group (P< 0·05).
‡ For details of procedures and diets, see the Materials and methods section and Table 1.
§ n 24.
∥ n 6.
Body weight, energy intake, plasma metabolite levels and TAG liver of rats fed the control diet (CD), the sucrose-rich diet (SRD) or the SRD+chia seed (SRD+Chia)‡ (Mean values with their standard errors)
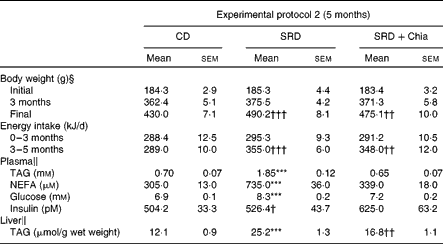
Mean values were significantly different from those of the CD and SRD+Chia groups: *** P< 0·001.
Mean values were significantly different from those of the CD group: †† P< 0·01, ††† P< 0·001.
‡ For details of procedures and diets, see the Materials and methods section and Table 1.
§ n 40.
∥ n 6.
At the end of 3 weeks on the diet (experimental protocol 1), both plasma TAG and NEFA levels were significantly higher in SRD-fed rats compared with CD-fed rats. The presence of chia seed as the principal dietary source of fat in the SRD group prevented the increase in these parameters. No changes in plasma glucose were recorded in the three dietary groups. Moreover, confirming previous reports(Reference Chicco, D'Alessandro and Hein13), hyperinsulinaemia was present in SRD-fed rats. When chia seed replaced maize oil in the SRD, insulin levels were not statistically different from the CD- or SRD-fed animals (Table 3). In agreement with previous publications(Reference Chicco, D'Alessandro and Hein13, Reference Chicco, D'Alessandro and Karabatas23), plasma TAG, NEFA and glucose levels were higher in rats fed the SRD for 5 months compared with the age-matched control fed the CD (Table 4). Similar values were observed in rats fed the SRD for 3 months (data not shown). All the variables returned to control values in SRD-fed rats in which chia seed replaced maize oil for the last 2 months of the feeding period (experimental protocol 2). No statistically significant differences in plasma insulin levels were observed at the end of the experimental period between the three dietary groups (Table 4).
Chia seed prevented the enhanced liver TAG content recorded in rats fed the SRD for 3 weeks. Furthermore, the replacement of maize oil by chia seed in the SRD for the last 2 months of the experimental period (5 months) significantly lowered the liver TAG content, although the values were still higher than those observed in CD-fed rats (Tables 3 and 4).
Hepatic enzyme activities involved in lipid metabolism
As shown in Table 5, the liver of SRD-fed rats, compared with that of CD-fed rats, showed an enhancement of ACC, FAS and G-6-PDH activities (key enzymes related to de novo fatty acid synthesis) either after 3 weeks or 5 months on the diet. However, the substitution of maize oil by chia seed as dietary fat in the SRD for 3 weeks was able to prevent these alterations. Furthermore, the activity of G-6-PDH decreased significantly, reaching values below those of the CD group. Besides, a significant reduction in ACC, FAS and G-6-PDH activities (which returned to values similar to those recorded in CD-fed rats) was observed in the liver of SRD-fed rats when chia seed replaced maize oil for the last 2 months of the feeding period (Table 5).
Acetyl-CoA carboxylase (ACC), fatty acid synthase (FAS) and glucose-6-phosphate dehydrogenase (G-6-PDH) activities in the liver of rats fed the control diet (CD), the sucrose-rich diet (SRD) or the SRD+chia seed (SRD+Chia)‡ (Mean values with their standard errors; n 6 per group)
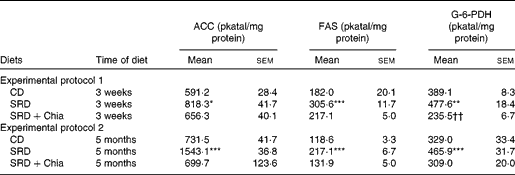
Mean values were significantly different from those of the CD and SRD+Chia groups: * P< 0·05, ** P< 0·01, *** P< 0·001.
Mean value was significantly different from that of the CD group: †† P< 0·01.
‡ For details of procedures and diets, see the Materials and methods section and Table 1.
On the other hand, Table 6 shows the hepatic activities of key enzymes related to mitochondrial (CPT-1) and peroxisomal (FAO) fatty acid oxidation in the three dietary groups. Chia seed as a source of dietary fat was able to prevent the decreased activity of CPT-1 observed in rats fed the SRD for 3 weeks, while FAO activity significantly increased (P< 0·05), reaching values above those recorded in the CD and SRD groups. Similarly, the presence of chia seed as dietary fat reverted the decreased CPT-1 activity recorded in rats fed the SRD for 5 months, reaching values above those observed in age-matched controls fed the CD. Moreover, FAO activity was also significantly increased in the SRD+Chia group. Interestingly, compared with the CD-fed group, no changes in FAO activity were observed in rats fed the SRD either for a short term (3 weeks) or 5 months in which maize oil was the source of dietary fat (Table 6).
Carnitine palmitoyltransferase-1 (CPT-1) and fatty acid oxidase (FAO) activities in the liver of rats fed the control diet (CD), the sucrose-rich diet (SRD) or the SRD+chia seed (SRD+Chia)§ (Mean values with their standard errors; n 6 per group)
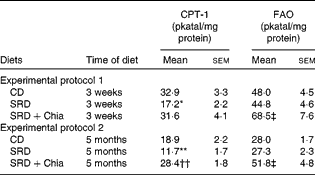
Mean values were significantly different from those of the CD and SRD+Chia groups: * P< 0·05, ** P< 0·01.
Mean value was significantly different from that of the CD group: †† P< 0·01.
Mean values were significantly different from those of the CD and SRD groups: ‡ P< 0·05.
§ For details of procedures and diets, see the Materials and methods section and Table 1.
Liver sterol regulatory element-binding protein-1 protein mass levels in the membrane fraction (precursor form) and nuclear extracts (mature form)
To examine whether or not chia seed feeding could alter the SREBP-1 protein mass, the precursor and mature forms of SREBP-1 protein mass levels in the liver of SRD- and SRD+Chia-fed rats were measured by immunoblotting. Since the antibody of SREBP-1 reacted with both SREBP-1a and SREBP-1c forms, we could not distinguish these two forms and thus used the non-committal term SREBP-1 (in the mouse liver, the ratio of SREBP-1c:1a transcriptors was 9:1(Reference Nakatani, Kim and Kaburagi21)). The 125 and 68 kDa proteins observed represent the precursor and mature forms of SREBP-1. Each gel contained an equal number of samples from the CD, SRD and SRD+Chia groups (Fig. 1(a) and (b)). After densitometry of immunoblots, the precursor and mature forms of SREBP-1 of the CD group were normalised to 100 % and both SRD and SRD+Chia were expressed relative to this. The quantitative and qualitative analysis of Western blots showed no changes in the relative abundance of the precursor form of SREBP-1 in the three dietary groups either after 3 weeks or 5 months on the SRD compared with CD-fed rats (Fig. 1(a), experimental protocols 1 and 2). However, the relative abundance of the mature form of the SREBP-1 protein was significantly increased (P< 0·05) in SRD-fed rats either after 3 weeks or 5 months on the diet (Fig. 1(b), experimental protocols 1 and 2). The substitution of maize oil by chia seed in the SRD for 3 weeks prevented the increase in the mature form of SREBP-1 protein mass levels (values were similar to those of the CD group), and when chia seed replaced maize oil for the last 2 months in rats fed the SRD for 5 months, the relative abundance of the mature form of SREBP-1 protein mass levels returned to the control values (Fig. 1(b), experimental protocols 1 and 2). The ratios of mature:precursor relative protein levels of SREBP-1 (six animals per group) after the 3-week feeding period were 1·35 (sem 0·11) in the SRD group v. 0·94 (sem 0·05) in the SRD+Chia group (P< 0·01), and after 5 months on the diet 1·21 (sem 0·04) in the SRD group v. 0·93 (sem 0·08) in the SRD+Chia group (P< 0·01).
Liver protein mass levels of (a) the precursor and (b) mature forms of sterol regulatory element-binding protein-1 (SREBP-1) of rats fed a control diet (CD, □), a sucrose-rich diet (SRD,  ) or a SRD+chia seed (SRD+Chia,
  ). (a) Experimental protocols 1 and 2. Top: a representative immunoblot of the liver precursor form of SREBP-1 from the CD-, SRD- and SRD+Chia-fed rats. Molecular marker is shown on the right. Lane 1, CD; lane 2, SRD; lane 3, SRD+Chia. Bottom: Densitometric immunoblot analysis of the precursor form of SREBP-1 protein mass levels in liver tissue of rats fed a CD, SRD or SRD+Chia. (b) Experimental protocols 1 and 2. Top: a representative immunoblot of the liver mature form of SREBP-1 from the CD-, SRD- and SRD+Chia-fed rats. Molecular marker is shown on the right. Lane 1, CD; lane 2, SRD; lane 3, SRD+Chia. Bottom: Densitometric immunoblot analysis of the mature form of SREBP-1 protein mass levels in the liver tissue of rats fed a CD, SRD or SRD+Chia. Values are means (six animals per group), with their standard errors represented by vertical bars, and expressed as a percentage relative to each CD, respectively. * Mean values were significantly different from those of the CD and SRD+Chia groups (P< 0·05).

Protein mass levels of PPARα
Since the activities of CPT-1 and FAO were modified in the liver of both SRD and SRD+Chia groups either after 3 weeks or 5 months on the diet, we examined the protein mass levels of the nuclear receptor PPARα. The immunoblotting of liver tissue revealed a single 55 kDa band consistent with PPARα. Each gel contained an equal number of samples from the CD, SRD and SRD+Chia groups (Fig. 2). After densitometry of immunoblots, PPARα of the CD group was normalised to 100 % and both SRD and SRD+Chia were expressed relative to this. The quantitative and qualitative abundance of Western blot showed that the relative abundance of PPARα protein levels significantly decreased (P< 0·05) in the liver of the SRD group either after 3 weeks or 5 months on the diet compared with rats fed the CD (Fig. 2). The replacement of maize oil by chia seed as the dietary source of fat was able to prevent the decrease in PPARα protein levels (3 weeks) in SRD-fed rats or even significantly increased (P< 0·05) in rats fed the SRD for 5 months (Fig. 2), reaching values above those of the CD group (P< 0·05, SRD+Chia v. CD).
Liver protein mass levels of PPARα of rats fed a control diet (CD, □), a sucrose-rich diet (SRD, ) or a SRD+chia seed (SRD+Chia, ). Experimental protocols 1 and 2. Top: a representative immunoblot of liver PPARα from the CD-, SRD- and SRD+Chia-fed rats. Molecular marker is shown on the right. Lane 1, kidney tissue as a positive control; lane 2, CD; lane 3, SRD; lane 4, SRD+Chia. Bottom. Densitometric immunoblot analysis of PPARα protein mass levels in the liver tissue of rats fed a CD, SRD or SRD+Chia. Values are means (six animals per group), with their standard errors represented by vertical bars, and expressed as a percentage relative to the CD. * Mean values were significantly different from those of the CD and SRD+Chia groups (P< 0·05). †† Mean values were significantly different from those of the CD group (P< 0·01).

Discussion
Extending our previous research, the present study provides new information concerning some of the possible underlying mechanisms sustaining the beneficial effects of chia seed as a dietary source of fat in the prevention, improvement and/or reversal of dyslipidaemia and liver steatosis that developed in rats rendering dyslipidaemic and insulin resistant by feeding them with a SRD.
The major new findings arising from these investigations are as follows. (1) Dietary chia seed simultaneously administered with a SRD for 3 weeks (experimental protocol 1) prevented the onset of dyslipidaemia and the increase in liver TAG storage (liver steatosis) present in SRD-fed rats by significantly decreasing both the protein mass levels of the mature form of SREBP-1 (without changes in the protein mass level of the precursor form) and the activities of key enzymes (ACC, FAS and G-6-PDH) involved in hepatic de novo lipogenesis, reaching values that did not differ from those observed in the control group fed a CD. In addition, dietary chia seed was able to normalise the low protein mass levels of PPARα and the activity of the enzyme (CPT-1) involved in mitochondrial fatty acid oxidation; at the same time, it significantly increased the FAO activity involved in peroxisomal fatty acid oxidation, reaching values above those recorded in the CD-fed group. (2) The significant increase in both the protein mass levels of the mature form of SREBP-1 and the enzymatic activities of hepatic ACC, FAS and G-6-PDH observed in rats fed a SRD for 5 months were completely normalised by shifting the source of fat in the SRD from maize oil to chia seed for the last 2 months of the experimental period (experimental protocol 2). Under these experimental conditions, chia seed increased both the low CPT-1 and FAO activities by 1·5- and 2-fold above the value observed in the CD-fed group, respectively. Moreover, dietary chia seed increased the protein mass levels of PPARα, reaching values significantly higher than those recorded in the CD group. This was accompanied by a significant reduction in hepatic TAG content, the visceral adiposity index without significant changes in energy intake and total body weight and, as previously shown, a normalisation of dyslipidaemia and plasma glucose levels despite the fact that there were no changes in insulinaemia.
Different studies including ours have demonstrated that in rats fed a high-sucrose or high-fructose diet for a short (3–5 weeks) or long (4–8 months) period, a combination of increased VLDL-TAG secretion and a defective removal mechanism of TAG from the circulation lead to a substantial hypertriacylglycerolaemia. This was accompanied by a significant increase in TAG storage within the liver tissue(Reference Lombardo and Chicco3, Reference Vrana, Kazdova and Dobesova24). The main transcription factor controlling lipid synthesis in the liver is SREBP-1. Several pieces of evidence suggested that the SREBP-1c isoform has a central role in the induction of the gene expression of a number of lipogenic enzymes including ACC and FAS, among others(Reference Yahagi, Shimano and Hasty25, Reference Shimomura, Shimano and Korn26). In this regard, hepatic gene expression of SREBP-1, protein mass levels and the gene expression and activities of lipogenic enzymes were increased in a high-sucrose/fructose diet(Reference Hein, Bernasconi and Montanaro18, Reference Nagai, Nishio and Nakamura27). In contrast, the mRNA contents and protein mass levels of PPARα as well as the gene expression and activities of key enzymes of fatty acid oxidation were significantly decreased in rats given a sucrose/fructose-rich diet for different lengths of time (2–8 months)(Reference Hein, Bernasconi and Montanaro18, Reference Nagai, Nishio and Nakamura27).
The present results are in agreement with the aforementioned studies showing that both hepatic lipogenic and oxidative mitochondrial fatty acid oxidation enzyme activities are coordinately increased and decreased, and this was accompanied by a parallel increase and decrease in the protein mass levels of SREBP-1 and PPARα, respectively. This suggests that sucrose induces a shift in the metabolic fate of lipid – synthesis v. oxidation – which could be one of the mechanisms involved in increased TAG storage within the liver cells leading to hepatic steatosis in rats fed a SRD. Interestingly, all these changes were expressed not only after long-term SRD feeding but early after 3 weeks on the diet.
On the other hand, it has been shown that n-3 PUFA (e.g. EPA, DHA) in vivo or in cell culture inhibited the transcription of gene encoding for key lipogenic enzymes such as ACC, FAS, SCD-1, among others(Reference Clarke1, Reference Yahagi, Shimano and Hasty25, Reference Jump, Botolin and Wang28, Reference Pegorier29). Increases in cellular n-3 EPA have also resulted from ingestion of vegetable sources rich in ALA such as flaxseed and perrilla oils and chia seed(Reference Garg, Sebokova and Wierzbicki8, Reference Chicco, D'Alessandro and Hein13, Reference Kim30). ALA could be converted to long-chain n-3 PUFA (mainly EPA) and to a lesser extent to DHA in the liver. It is well known that both the absolute amount of ALA and the ratio LA:ALA influence the ALA conversion to EPA as a result of the known competition between n-6 and n-3 fatty acids for desaturation since LA reduces Δ-6 desaturase(Reference Benatti, Peluso and Nicolai31). The ratio of LA:ALA in the SRD+Chia group was 0·287 v. 67·8 in the SRD group (maize oil as dietary fat), and Jeffery et al. (Reference Jeffery, Newsholme and Calder32) recorded that the maximum hypertriacylglycerolaemic and hypercholesterolaemic effects were obtained at a LA:ALA ratio of 0·33. To the best of our knowledge, the present study is the first one to demonstrate that in dyslipidaemic, insulin-resistant SRD-fed rats, the higher amount of ALA in the dietary chia seed, or their metabolites EPA and, to a minor extent, DHA, opposite to LA, prevents the increase in both the hepatic lipogenic enzyme activities of ACC, FAS and G-6-PDH and the mature form of SREBP-1 protein mass levels. Moreover, when chia seed replaced maize oil for the last 2 months of the 5-month SRD feeding period, the normalisation of hepatic ACC, FAS and G-6-PDH activities was accompanied by the decrease in the mature form of SREBP-1 protein mass levels. Interestingly, either under the 3-week or 5-month feeding period, the precursor form of SREBP-1 protein mass levels remained unchanged. Therefore, the ratio of mature:precursor relative protein levels that increased in SRD-fed rats returned to normal in the SRD+Chia group. In addition, the concomitant administration of dietary chia seed for 3 weeks enhanced the activity of FAO, contributing to the prevention of the increases in hepatic TAG content by increased peroxisomal fatty acid oxidation. It also prevents the decreased activity of CPT-1 observed in SRD-fed rats, without significant changes in the protein mass levels of PPARα. The latter was an unexpected finding since FAO enzymatic activity is generally used to monitor the activity of PPARα(Reference Hein, Bernasconi and Montanaro18). However, Neschen et al. (Reference Neschen, Moore and Regittnig33) showed a significant increase in hepatic peroxisome and both FAO mRNA and 3 ketoacyl-CoA mRNA without changes in the expression of PPARα and CPT-1 in rats fed for 3 weeks a high-fat diet containing 59 % of fat-derived energy as fish oil. On the other hand, increased PPARα protein levels and higher activities of the key enzymes of mitochondrial (CPT-1) and peroxisomal (FAO) fatty acid oxidation were recorded when chia seed replaced maize oil for the last 2 months of the 5-month SRD feeding period. These results clearly suggest that the opposite hepatic changes induced by dietary chia seed in the activities of key enzymes involved in lipogenesis and fatty acid oxidation, accompanied by similar changes in the protein mass levels of mature SREBP-1 and PPARα, could be involved in the mechanisms leading to a reduction in liver TAG synthesis, normalising/improving liver steatosis and dyslipidaemia (TAG and NEFA reached control values) in rats fed a SRD. Interestingly, Poudyal et al. (Reference Poudyal, Panchal and Waanders16) recently demonstrated a decrease in hepatic steatosis and reduced fibrosis and inflammation in the histological analysis of the liver of rats fed a high-carbohydrate–high-fat diet supplemented with 5 % of chia seed for 8 weeks. Since ALA is metabolised to EPA and DHA, it is also possible that these metabolites rather than ALA per se could induce the aforementioned changes. In this regard, in mice fed a high-carbohydrate–fat-free diet, Yahagi et al. (Reference Yahagi, Shimano and Hasty25) showed that EPA ethyl ester-specific suppression of liver lipogenic enzymes is mediated by the reduction of mature SREBP-1c protein. Moreover, in B57BL/6J mice, Nakatani et al. (Reference Nakatani, Kim and Kaburagi21) showed that low fish oil – rich in EPA and DHA – feeding inhibits the SREBP-1 proteolytic cascade, while a high increase in fish oil decreases mRNA SREBP-1 levels in the liver. Kim(Reference Kim30) showed a reduction in the activities of FAS, G-6-PDH and malic enzyme and mRNA FAS expression in the liver of rats fed perrilla oil compared with those fed beef tallow, while Ide et al. (Reference Ide, Kobayashi and Ashakumary34, Reference Ide35) showed that normal rats fed 15 % of perrilla oil for 15 d significantly increased the mRNA levels and activities of CPT-1 and FAO compared with those of age-matched controls fed safflower oil.
In addition to the prevention and/or normalisation of dyslipidaemia and the increase in liver TAG content, dietary chia seed was able to normalise plasma glucose levels without changes in insulinaemia in rats fed the SRD for a long time (5 months). Moreover, the whole-body peripheral IR present in rats fed a SRD was prevented (3 weeks) or completely normalised (5 months) under chia seed administration(Reference Chicco, D'Alessandro and Hein13). This effect could also be related to the subsequent changes in fatty acid content in membrane phospholipids of insulin target tissues including liver tissue, due to the absolute and relative amounts of LA and ALA in the diet and the competitive interactions in the metabolism of LA and ALA to long-chain n-6 and n-3 PUFA, which could in turn improve insulin sensitivity. Interestingly, a high content of EPA and DHA was observed in the hepatic membrane of rats fed perrilla oil, although this oil contained neither EPA nor DHA(Reference Kim and Choi7). In this regard, we have recently demonstrated a significant increase in plasma ALA, EPA and DHA in rats fed a SRD when chia seed replaced maize oil as the source of dietary fat(Reference Chicco, D'Alessandro and Hein13).
On the other hand, the present results extend our previous observations and show that the increased visceral adiposity index recorded in long-term SRD-fed rats was significantly reduced in the SRD+Chia group, and this effect is not related to energy differences. Okuno et al. (Reference Okuno, Kajiwara and Imai36) also observed a reduction of fat pad in rats fed perrilla oil compared with those fed a saturate fat or LA-rich fat diet, and Poudyal et al. (Reference Poudyal, Panchal and Waanders16) showed a reduction in the visceral adiposity index due to a decrease in both retroperitoneal and omental but not epididymal fat pad in rats fed a high-carbohydrate–high-fat diet supplemented with 5 % of chia seed. Moreover, in rats fed diets containing 0·095–6·3 % of ALA and constant n-6 PUFA levels for 3 weeks, Muhlhausler et al. (Reference Muhlhausler, Cook-Johnson and James37) have recently shown that fat depots in different anatomical locations have different degrees of responsiveness to altered levels of n-3 and n-6 long-chain PUFA in the body.
In brief, the present study provides new data regarding some key mechanisms related to the fate of hepatic fatty acid metabolism (lipogenesis/oxidation) that could be involved in the effect of dietary chia seed in preventing, normalising or improving dyslipidaemia, liver steatosis and altered glucose homeostasis in a dyslipidaemic insulin-resistant rat model. Finally, these results, although promising, warrant further research before extrapolating the use of chia seed as a complementary nutrient that could help in the treatment of some signs of the metabolic syndrome in humans, especially considering the few human studies published so far. Interestingly, in healthy individuals receiving 0, 7·5, 15 or 25 g of Salba (S. hispanica L.), baked into white bread, Vuksan et al. (Reference Vuksan, Jenkins and Dias38) have recently shown a reduction in postprandial glucose excursion and a prolongation of satiety independently of the amount of Salba used. In addition, they have previously shown a reduction in systolic blood pressure, coagulation and inflammatory markers after 12 weeks of dietary Salba supplement in well-controlled subjects with type 2 diabetes(Reference Vuksan, Whitham and Sievenpiper39). Muramatsu et al. (Reference Muramatsu, Yatsuya and Toyoshima40) showed that a higher ALA intake was significantly associated with a lower prevalence of IR in middle-aged, normal-weight Japanese individuals, both male and female.
Acknowledgements
A preliminary report was presented at the 29th International Symposium on Diabetes and Nutrition of the Nutrition Study Group of EASD, June 2011, Rome, Italy. The present study was carried out with the financial support of CONICET and University of Litoral (grants PIP 0105/2010 and CAI+D PI-8-37/2009). The authors thank Agrisalba SA, Buenos Aires, Argentina for providing the chia seed Salba and Mr Walter Da Ru for his skillful technical assistance. A. S. R. was involved in the analysis of hepatic enzyme activities and protein mass levels of PPARα; M. E. O. was involved in the analysis of the precursor and mature forms of SREBP-1 and contributed to the analysis of the results. M. R. F. was involved in the determination of the visceral adiposity index and analytical methods. A. C. was involved in the discussion of the results and the whole manuscript. Y. B. L. wrote the manuscript and discussed it with the whole group of authors. The authors declare that there is no conflict of interest.



