

Subjective appetite is typically assessed using the well-established, valid and reliable visual analogue scale (VAS) method(Reference Flint, Raben and Blundell1,Reference Stubbs, Hughes and Johnstone2) . This method usually consists of a set of questions assessing hunger, fullness/satisfaction, desire to eat and prospective food intake(Reference Blundell, de Graaf and Hulshof3). The question is presented with a 100 mm horizontal line scale representing the continuum of subjective perceptions of these constructs of appetite and anchored at each end with extreme responses. Participants answer, by making a vertical mark on the horizontal line, representing their current perception on the continuum. The distance from the left-hand anchor to the vertical mark is measured and a score, in mm, is generated.
The VAS method of subjective appetite is typically completed using pen and paper. While inexpensive and quick to complete, data processing can be time consuming with a risk of human error, resulting in the misreporting of behaviour. Although suitable for laboratory and supervised settings, the pen and paper version of VAS harbours limitations for unsupervised, free-living settings. Adherence to pen and paper scales and diaries is low(Reference Stone, Shiffman and Schwartz4), errors in the completion and timing of measures can be prevalent(Reference Stratton, Stubbs and Hughes5) and ensuring the pen and paper are always about one’s person can be burdensome. In addition, the use of a pen and paper method for large-scale data collection is not environmentally friendly and in free-living studies, data are usually returned through the posting of hard-copy VAS, which may result in data loss. The regulation of appetite and eating behaviour is complex and multifaceted, particularly in a free-living setting with social and environmental influences and cues, as well as physiological and behavioural determinants. As such, a valid, efficient, affordable and user-friendly method for the large-scale, free-living assessment of appetite perceptions is sought.
Electronic scales for the measure of subjective appetite have been developed to overcome some of these limitations. Electronic scales have been shown to elicit comparable data to pen and paper methods for the measure of patient outcomes in clinical settings(Reference Muehlhausen, Doll and Quadri6), with high rates of compliance(Reference Hufford and Shields7). The electronic appetite rating systems EARS I(Reference Delargy, Lawton and Smith8) and EARS II(Reference Gibbons, Caudwell and Finlayson9), variations of an electronic VAS and sliding-bar scales have been developed for the measure of subjective appetite. Iterations of the EARS I, with differing operating systems and screen size, proved effective at detecting changes in appetite with differing feeding loads in a laboratory setting; however, some disagreement in measure with the pen and paper VAS tool was evident, with a tendency for constrained scores with EARS in some instances(Reference Delargy, Lawton and Smith8) and evidence of higher appetite ratings with EARS in women(Reference Whybrow, Stephen and Stubbs10). When used in a free-living setting, the EARS demonstrated high test-retest reliability and produced appetite ratings not different to those of pen and paper VAS(Reference Stratton, Stubbs and Hughes5). However, participants rated a preference for the pen and paper tool, with it deemed more accessible and easier to use, compared with an unfamiliar handheld electronic device(Reference Stratton, Stubbs and Hughes5). In contrast, the EARS was perceived easier to use in the study(Reference Whybrow, Stephen and Stubbs10), although participants did find it more time consuming to use than the pen and paper method. Achieving high user satisfaction is vital for effective and compliant adoption of mobile technology and applications(Reference Zhang and Adipat11), so a better understanding of the usability of electronic devices for the measure of free-living appetite is warranted.
The EARS II, using questions assessing ‘hunger’, ‘fullness’ and ‘desire to eat’ and completed by using a stylus to mark a response on a 84 mm, 100 unit horizontal line, has been validated in a laboratory setting(Reference Gibbons, Caudwell and Finlayson9). EARS II appetite scores correlated strongly with pen and paper VAS scores with controlled dietary manipulation, with Bland–Altman analysis demonstrating very low bias between measures. Despite the pen and paper method being perceived as easier to use by 55 % of participants, the EARS II was rated the preferred tool(Reference Gibbons, Caudwell and Finlayson9). However, the reasons for this preference were not explored.
Despite evident benefits of these electronic systems, there are limitations to their use in free-living settings and on a large scale. These measures require specific devices and software with limited accessibility. This means that large-scale data collection is limited, and there remains some participant burden to collecting data, especially at specific times when appetite may be of particular interest (e.g., immediately upon waking, immediately post-exercise, immediately post-feeding, when eating ‘on-the-go’). This limitation is somewhat overcome with the wrist-worn PRO-Diary© device, which has been shown to be a valid tool for monitoring free-living subjective appetite in children(Reference Rumbold, Dodd-Reynolds and Stevenson12). However, such a device is not widely available and accessible.
A widely available, accessible and easy-to-use smartphone application for the measure of subjective appetite in real time was therefore developed to overcome these limitations. Smartphones are well placed to monitor behaviour, given the common habit of carrying them on one’s person at all times. Using the same questions as the traditional VAS method, and with answers provided using an eleven-point Likert scale, the APPetite application was developed to allow for date and time-stamped measures of subjective appetite that are immediately relayed to the researcher, allowing for real-time, remote measures within real-life contexts. Such ecological momentary assessment (EMA) methods – those obtaining measures of behaviour or perceptions in real-time and in one’s natural setting – have proved effective for measures of free-living food intake(Reference Stone and Shiffman13–Reference Rollo, Ash and Lyon-Wall16), but similar tools for the measure of subjective appetite have not yet been developed and validated. While the Likert scale of APPetite deviates from the more traditional ungraded line scale, it has been previously shown that categorical and line scale can produce comparable data and both are accepted and appropriate approaches for measuring subjective appetite(Reference Blundell, de Graaf and Hulshof3,Reference Jeon, O’Mahony and Kim17) . However, this method is yet to be assessed for validity, reproducibility and usability.
The purpose of this study was to determine the validity, reproducibility and usability of an app-based tool for the remote measure of subjective appetite in free-living settings. Face validity was assessed by determining the sensitivity of APPetite to hourly changes in subjective appetite. Concurrent validity was assessed by determining agreement in subjective appetite scores obtained with APPetite and with the criterion tool of VAS. To understand user compliance and satisfaction, usability was assessed using a mixed methods approach.
Experimental methods
Study design
Two experiments were conducted to assess validity, test-retest reproducibility, compliance and preference of the APPetite smartphone application (compatible with both Apple and Android platforms) for the measure of subjective appetite perceptions. Experiment 1 was a within-subject, counterbalanced, cross-over study assessing the face and concurrent validity of APPetite, in comparison with the widely used, validated, criterion tool of the pen and paper VAS. Experiment 2 was also a within-subject, counterbalanced, cross-over study assessing test-retest reproducibility and compliance. Participants of Experiment 2 also completed a qualitative questionnaire to assess preferences of APPetite and VAS. This design has previously been adopted to assess validity and reproducibility of other appetite rating systems(Reference Stratton, Stubbs and Hughes5).
This study was conducted in accordance with the principles and guidelines laid down in the Declaration of Helsinki, 2013. All procedures were approved by the Ethics Advisory Committee at Leeds Beckett University.
Participants and enrolment
A convenience sample of participants was recruited predominantly from the West Yorkshire and the Scottish Highlands regions via word-of-mouth and through email and social media advertisement. Inclusion criteria were aged 18–70 years, own and able to access a smartphone and able to complete a pen and paper questionnaire, able to read English. No incentives were offered for participation.
Those willing to partake and meeting the inclusion criteria provided written informed consent either in person or remotely, via email. At this point, participants provided their age, height and weight. Prior to the experimental trials, participants were provided with paper copies of VAS for each trial day, clearly labelled and sent the link to download the APPetite smartphone app, via either email or WhatsApp. Written and telephone instructions on how to complete both VAS and APPetite were provided and a test measure using both tools was completed to ensure participant competence and technical proficiency. Participants were then randomly allocated to Experiment 1 or Experiment 2.
Experiment 1 – validity
Participants completed two 12-h trials on consecutive days. Upon waking, participants completed a measure of subjective appetite perceptions using both APPetite and VAS tools, one immediately after the other. This was repeated hourly for 12 h. In one trial, the APPetite measure was completed first, followed immediately by the VAS measure, with this order reversed in the other trial. Participants were encouraged to consider the repeat measure as a separate measure, and not to simply copy their first measure. The order of the trials was counterbalanced across participants. Participants were encouraged to set hourly reminders (on a separate application or device, as this function was not available on the APPetite app) to ensure compliance. Throughout the trial days, participants were encouraged to consume their habitual diet.
Experiment 2 – test-retest reproducibility and usability
Participants completed two 12-h trials, separated by 7 d. The protocol was similar to Experiment 1; on one trial, two measures of APPetite were completed, one immediately after the other, hourly for 12 h, from the point the waking. On the other trial, two measures of VAS were completed, one immediately after the other, hourly for 12 h, from the point the waking. Participants were encouraged to consider the repeat measure as a separate measure, and not to simply copy their first measure. The order of the trials was counterbalanced across participants. Participants were encouraged to set hourly reminders (on a separate application or device, as this function was not available on the APPetite app) to ensure compliance. As data were received by the researcher in real-time, missed or late measures using APPetite were identified. If a measure was late by five minutes, a text reminder was sent to the participant. If measures were late by > 15 min, this was deemed a missed or non-compliant measure. Throughout the trial days, participants were encouraged to consume their habitual diet.
On completion of trial two, participants were provided a link to an online survey to evaluate satisfaction with the app (see Appendix 1). This included two closed and three open questions. The closed questions were ‘Which method did you find easier to use?’; ‘If you were going to undertake the study again what method would you prefer to use’. Both questions allowed participants to select the following answers: APPetitite smartphone; pen and pencil; none. The three open questions were (i) reasons for preferred choice, (ii) advantages of the APPetite compared with the pen and pencil method (iii) disadvantages of the APPetite compared with the pen and pencil method.
Measures of subjective appetite perceptions
Subjective appetite perceptions were measured using VAS and APPetite. Both consisted of four items relating to four constructs of appetite (‘How hungry are you?’, ‘How full are you?’, ‘How strong is your desire to eat?’ and ‘How much would you expect to eat right now?’). These are validated, commonly used questions for the VAS method of measuring subjective appetite(Reference Flint, Raben and Blundell1,Reference Blundell, de Graaf and Hulshof3) . The VAS method uses an ungraded 100 mm horizonal line, anchored on either end by extreme answers to the question. The participant answers the question by making a vertical mark on the horizontal line, representing their feeling on the continuum. This is completed with a pen, on paper. The score, in mm, is obtained by measuring the distance from the left-hand side anchor. The participant was asked to note the exact time of recording each measure.
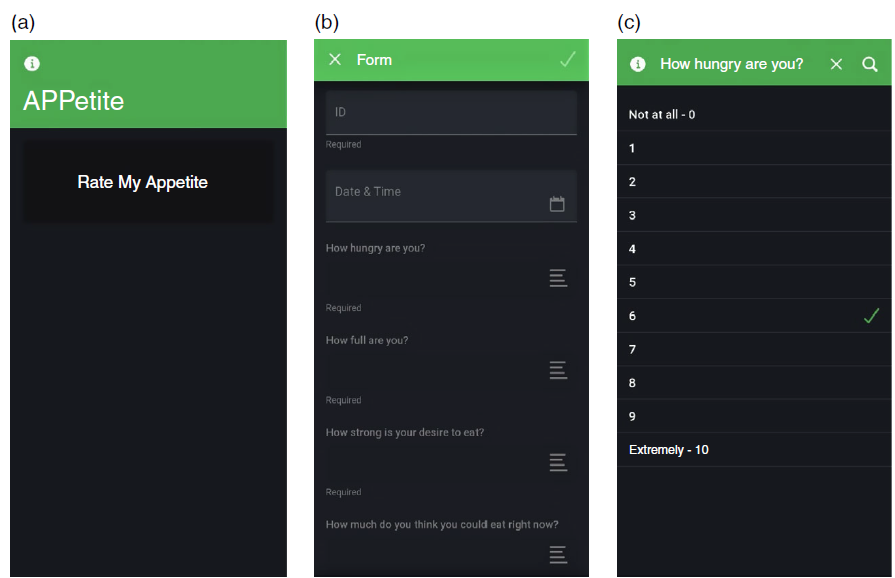
The APPetite application uses the same four items. The question is answered using an eleven-point Likert scale (0–10), anchored with the same extreme answers as the VAS. The participant selects the answer by tapping the screen of their smartphone. The exact time of the measure was automatically recorded. The data from APPetite are automatically and instantly transferred to a Google Sheets document of the principle investigator. The APPetite interface can be seen in Fig. 1.
APPetite smartphone application. (a) Welcome page; (b) questionnaire interface; (c) hunger item of the questionnaire.
For both VAS and APPetite, a single composite appetite score was calculated from the four items as of and adapted from the 150 mm scale of that study for the 100 mm scale of the present study(Reference Holliday and Blannin18). This was calculated as hunger score + (100-fullness score) + desire to eat score + expected intake score for VAS and hunger score + (10-fullness score) + desire to eat score + expected intake for APPetite. The composite score for APPetite was multiplied by 10, giving a score out of a maximum of 100, for data analysis and direct comparison with VAS score.
Data analysis
Validity
The Bland–Altman test was used to assess agreement between APPetite and VAS scores for Experiment 1(Reference Bland and Altman19). Bias and limits of agreement (LOA), with 95 % CI(Reference Stöckl, Rodríguez and Van Uytfanghe20), were calculated. Standardised mean bias was calculated as bias divided by sd of the criterion (VAS) measure Hopkins etal. and interpreted according to the Cohen scale(Reference Cohen21). A difference or change in VAS appetite score of 10 mm (10 %) is accepted as a ‘reasonable and realistic difference’(Reference Flint, Raben and Blundell1); therefore, a value of <± 10 mm/units was set as the a priori maximum allowed difference(Reference Stöckl, Rodríguez and Van Uytfanghe20). For Bland–Altman analyses, AUC values, calculated using the trapezoid method, were used. AUC was calculated separately for the two experimental days and summated. Regression analysis was also used to provide further indication of agreement (correlation and se of the estimate) and for visual representation of agreement between raw values. Difference in appetite profiles obtained from APPetite and VAS was assessed using 2 × 12 factorial ANOVA with repeated measures.
Test-retest reproducibility
The Bland–Altman test was used to assess agreement between test-retest measures for Experiment 2(Reference Bland and Altman19). The AUC, bias, LOA, standardised mean bias and maximum allowed difference were calculated and interpreted as described above. Regression analysis was also used to provide further indication of agreement (correlation and standard error of the estimate) and for visual representation of agreement between raw values. Agreement between pairs of measures was also assessed by calculating CV. The mean CV across the recording period was then calculated for each participant, with mean CV values compared between APPetite and VAS tools using a paired samples t test.
Usability
Compliance of measure for Experiment 2 was compared using a paired samples t test. Data obtained from quantitative question of the evaluation questionnaire were tallied and presented as frequencies. Participants’ open-ended responses to the survey were analysed using content analyses, acknowledging its recognised usefulness for health research(Reference Nandy and Sarvela22), and a general inductive approach was used (Bryman & Burgess, 1994). Answers were read several times to identify themes and categories. All responses were coded by the first and third authors independently into label categories to increase trustworthiness. The authors agreed on > 80 % of emerging categories and during critical discussions established consensus and resolution on all responses coded.
A sample size calculation was conducted for Bland–Altman analysis of agreement(Reference Lu, Zhong and Liu23). Based on the mean difference between EARS I and pen-and-paper VAS scores and standard deviation of the differences of the study(Reference Stratton, Stubbs and Hughes5), a maximum allowed difference of 10 mm/units, and an α level of 0·05 and a power of 0·8, a sample size of 20 was required.
Throughout, data are presented as means ± sd in text and as means ± sem in figures. Where relevant, for t tests, effect size was calculated as Cohen’s d (d), with 95 % CI expressed. An effect size of 0·2 or greater was considered small, 0·5 or greater considered medium and 0·8 or greater considered large(Reference Cohen21). For ANOVA, effect size was calculated as partial eta squared (η2 p). Data were analysed using Statistical Package for Social Science (SPSS).
Results
Participant characteristics
Experiment 1
Twenty-six participants were enrolled and allocated to Experiment 1. Twenty-two participants completed the study (6 men, 16 women; age = 36 ± 15 years; height = 1·69 ± 0·10 m; weight = 66·5 ± 14·8 kg; BMI = 23·1 ± 3·4 kg·m–2; 18–24·9 kg·m–2, n 16; 25–29·9 kg·m–2, n 5; 30–34·9 kg·m–2, n 1). Two participants failed to complete data collection and withdrew, while two were excluded due to insufficient data (< 90 % of measures obtained; for those included, 98·1 ± 2·7 % of measures were obtained).
Experiment 2
Twenty-six participants were enrolled and allocated to Experiment 2. Twenty-two participants completed the study (7 men, 15 women; age = 32 ± 12 years; height = 1·71 ± 0·12 m; weight = 70·0 ± 18·1 kg; BMI = 23·6 ± 4·1 kg·m–2; 18–24·9 kg·m–2, n 15; 25–29·9 kg·m–2, n 5; 30–34·9 kg·m–2, n 2). Four participants failed to complete data collection and withdrew from the study.
Validity
Three participants mistakenly omitted the final measure of each day (obtaining twelve measures, rather than thirteen measures over a 12-h period). To avoid loss of data or extensive missing data analysis, data for an 11-h data collection period were analysed for all participants.
Appetite profiles as measured by APPetite and VAS are shown in Fig. 2. There was no difference in appetite profiles produced by the two tools (measure × time interaction: F(23 483) = 1·008, P = 0·45, η2 p = 0·046).
Appetite profiles (mean ± sem) for Day 1 and Day 2, as measured using APPetite (solid line, black circles) and VAS (dashed line, white circles).

The AUC values for the total two-day (22-ho) recording period obtained by APPetite and VAS correlated strongly and significantly (r = 0·980 (95 % CI = 0·865, 0·997), P < 0·001, β = 0·889 (95 % CI = 0·808, 0·969), intercept = 6·324 (95 % CI = 2·825, 9·823), SEE = 2·476; Fig. 3), but did differ significantly (43·6 ± 11·0 v. 41·9 ± 12·1 units/mm·hour–1, t(21) = 3·018, P = 0·007, d = 0·665). Bland–Altman plot for AUC values is shown in Fig. 4. Mean bias was –1·654 units/mm·h–1 (95 % CI = –2·764, –0·514 units/mm·h–1), and standardised mean bias was –0·151 (95 % CI = –0·255, –0·047), representing a trivial bias. Upper and lower LOA were 3·386 units/mm·h–1 (95 % CI = 1·521, 5·250 units/mm·h–1) and –6·694 units/mm·h–1 (95 % CI = –8·559, –4·830 units/mm·h–1), respectively. Regression analysis revealed a β value of 0·099 (95 % CI = 0·005, 0·193, P = 0·04), indicating proportional bias.
Correlation between APPetite and VAS AUC scores over the two-day recording period. Dashed grey line = line of equity (y = x). Solid line = regression line (y = 0·889x + 6·324).

Bland–Altman plot for APPetite and VAS scores over the two-day recording period. Solid black line = mean (grey shaded region = 95 % CI). Dashed line = upper and lower limits of agreement (light/green shaded area represents 95 % CI). Extremity/red lines = upper and lower maximum allowed difference. Grey line = regression line.

Test-retest reproducibility
The AUC for the first measure and repeat measure obtained with APPetite correlated strongly and significantly (r = 0·993 (95 % CI = 0·954, 0·999), P < 0·001, β = 0·989 (95 % CI = 0·935, 1·042), intercept = –0·075 (95 % CI = –2·527, 2·377), SEE = 1·037; Fig. 5). Bland–Altman plots for APPetite test-retest scores is shown in Fig. 6. Mean bias was –0·578 units·h–1 (95 % CI = –1·029, –0·127 units·h–1), and standardised mean bias was –0·065 (95 % CI = –0·117, –0·014), representing a trivial bias. Upper and lower LOA were 1·416 units·h–1 (95 % CI = 0·825, 2·416 units·h–1) and –2·571 units·h–1 (95 % CI = –3·571, –1·980 units·h–1), respectively. Regression analysis revealed a β value of –0·003 (95 % CI = –0·058, 0·049, P = 0·86), indicating no proportional bias.
Correlation between measure 1 and measure 2 APPetite AUC scores. Dashed grey line = line of equity (y = x). Solid line = regression line (y = 0·989x – 0·075).

Bland–Altman plot for measure 1 and measure 2 APPetite AUC scores. Solid line = mean (blue shaded/shaded area represents 95 % CI). Dashed line = upper and lower limits of agreement (light/green shaded area represents 95 % CI). Extremity/red lines = upper and lower maximum allowed difference. Grey line = regression line (y = −0·003x − 0·374).

The AUC for the first measure and repeat measure obtained with VAS correlated strongly and significantly (r = 0·974 (95 % CI = 0·829, 0·996), P < 0·001, β = 0·987 (95 % CI = 0·877, 1·097), intercept = 0·738 (95 % CI = –4·021, 5·497), SEE =1·883; Fig. 7). Bland–Altman plots for VAS test-retest scores is shown in Fig. 8. Mean bias was –0·195 mm·h–1 (95 % CI = –1·031, 0·642 mm·h–1), and standardised mean bias was 0·066 (95 % CI = 0·014, 0·117), representing a trivial bias. Upper and lower LOA were 3·408 mm·h–1 (95 % CI = 2·043, 4·774 mm·h–1) and –3·797 mm·h–1 (95 % CI = –5·163, –2·432 mm·h–1), respectively. Regression analysis revealed a β value of –0·014 (95 % CI = –0·124, 0·096, P = 0·80), indicating no proportional bias.
Correlation between measure 1 and measure 2 VAS AUC scores. Dashed grey line = line of equity (y = x). Solid line = regression line (y = 0·987x + 0·738).

Bland–Altman plot for measure 1 and measure 2 VAS AUC scores. Solid line = mean (blue shaded/shaded area represents 95 % CI). Dashed line = upper and lower limits of agreement (light/green shaded area represents 95 % CI). Extremity/red lines = upper and lower maximum allowed difference. Grey line = regression line (y = −0·014x + 0·384).

Mean CV, calculated as the mean for each pair of measures across the recording period, for each participants, did not differ between APPetite and VAS (3·47 % v. 4·66 %, t(21) = 1·11, P = 0·279). Mean CV for AUC values also did not differ between APPetite and VAS (1·29 ± 1·42 % v. 1·54 ± 2·36 %, t(21) = 0·481, P = 0·64).
Usability
There was no difference in measurement compliance between APPetite and VAS in Experiment 2 (92·7 ± 8·0 % v. 91·6 ± 20·4 %, t = 0·244, P = 0·81).
Twenty-one of the twenty-two participants of Experiment 2 completed the measurement tool online evaluation survey. Eighteen of the twenty-one (85·7 %) found the APPetite tool the easiest of the two tools to use. The other three participants found no difference in ease of use. Nineteen of the twenty-one (90·4 %) participants expressed a preference for APPetite, should they be asked to repeat the data collection process using just one of the two tools. The other two participants expressed no preference. In response to the first open question ‘what are the reasons for preferring the selected method’ from the answers from the nineteen participants selecting the APPetite two main categories emerged labelled Accessibility and Simplified Process and Easy and Quick numerical display. For Accessibility and Simplified Process category answers included ‘easier when going out to places and completing on the phone’. Regarding the Easy and Quick numerical display, an example of raw answers was ‘preferred a number scale and easy to use’ For the second question ‘what, if any do you consider to be an advantage of the APPetite compared with pen and paper?’ three main categories emerged; the first two categories were the same as in the previous question and a new category labelled Environmental Friendly emerged, with answers explicitly stating that APPetite was ‘environmentally friendly’. For the third question ‘what, if any do you consider to be disadvantages of the APPetite compared with pen and paper?’ two main categories emerged including Visual reminders of completion and Connectivity and IT issues. Visual reminders of completion included answers such as ‘less visual reminder to record results’. Connectivity and IT issues included raw answers such as ‘No battery, malfunctions and no internet’.
Discussion
We have developed a novel smartphone application – APPetite – for the measure of free-living subjective appetite. This study aimed to determine the validity, test-retest reproducibility and usability of Appetite. Experiment 1 suggests that APPetite is a valid tool for the measure of subjective appetite. The appetite profiles obtained by APPetite and VAS were not different, with comparable traces of subjective appetite over time. This suggests that APPetite is sensitive to typical intra-day changes in subjective appetite and hence indicates suitable face validity for free-living measures(Reference Blundell, de Graaf and Hulshof3). Bland–Altman analysis revealed trivial bias of just 1·65 units/mm·h–1 between APPetite- and VAS-derived AUC appetite scores. Further, the LOA and 95 % CI were within the a priori maximum allowed difference of 10 %, or 10 mm. This indicated strong agreement between the two tools. However, although AUC values correlated very strongly, mean AUC values were significantly different. Further, Bland–Altman analysis did indicate proportional bias; APPetite appears to produce greater values than VAS at lower perceive appetite, but lower values than VAS at higher perceived appetite. As such, while it can be determined with confidence that APPetite does provide a valid measure of subjective appetite, the two tools – APPetite and pen and paper VAS – should not be used interchangeably. Similar conclusions were drawn when previous electronic appetite rating systems were assessed for validity(Reference Stratton, Stubbs and Hughes5,Reference Gibbons, Caudwell and Finlayson9,Reference Whybrow, Stephen and Stubbs10,Reference Holliday, Batey and Eves24) .
Experiment 2 demonstrated a high degree of test-retest reproducibility and usability with APPetite. Low CV values and trivial bias values compared favourably with the criterion tool of pen and paper VAS, which has previously been shown to be a reliable and reproducible tool for measuring subjective appetite(Reference Flint, Raben and Blundell1). Limits of agreement, along with 95 % CI, was comfortably within the a priori maximum allowed difference for both APPetite and VAS tools. It is possible that the numbered scale of APPetite did facilitate a higher test-retest reproducibility, compared with the ungraded line of VAS. Repeat measures, in both Experiment 1 and Experiment 2, were obtained immediately after one another. This practice is common in studies of this nature(Reference Stratton, Stubbs and Hughes5,Reference Gibbons, Caudwell and Finlayson9,Reference Whybrow, Stephen and Stubbs10,Reference Holliday, Batey and Eves24) , as is it important for any measures of agreement to measure the same phenomenon in the exact same conditions (i.e., at the same time). While one might not expect appetite to vary much with a small delay of, say one minute, in a free-living setting it is possible for food cues to impact on appetite perceptions almost immediately. However, it is acknowledged that agreement between measures could be biased by the participants’ memory of the measure they have just provided, despite the efforts of the researchers to ensure measures were independent and not simply replicated. This is likely of greater threat to the internal validity for the reproducibility of APPetite, than for the validity in comparison with VAS, due to the numbered scale on APPetite. It is more likely that a numbered score out of ten was remembered and replicated, than a placement of a mark on an ungraded line was remembered and replicated (or translated into a score out of ten in the case of Experiment 1). As such, the very high test-retest reproducibility of APPetite should perhaps be interpreted with some caution, but the methodological approach adopted was deemed the preferred option for assessing validity.
Compliance did not differ between APPetite and VAS, with a high proportion of measures being successfully obtained with both tools. Compliance values were similar to those seen in the study(Reference Stone, Shiffman and Schwartz4), when administering paper and electronic diaries for the free-living reporting of pain in chronic pain patients. Previous studies investigating the validity of electronic systems for the measure of subjective appetite have typically been conducted in laboratory setting, which does not allow for measures of free-living compliance(Reference Gibbons, Caudwell and Finlayson9,Reference Whybrow, Stephen and Stubbs10) , while one free-living study did not report compliance(Reference Stratton, Stubbs and Hughes5). The inclusion of this important assessment in the current study strengthens the evidence of APPetite proving a pioneering tool of high usability in a free-living environment.
When assessing compliance, it is important to also consider participant dropout and withdrawal. Only two participants were excluded form Experiment 1 due to low compliance (< 90 % of measures obtained). A further two participants did consider the time commitment of providing measures every hour too burdensome and withdrew, while two participants withdrew without providing a reason. The EMA approach of APPetite also allowed for the identification of two participants who provided multiple measures retrospectively at the end of the day, rather than at the desired time points.
Despite no difference in compliance, participants expressed a clear preference for using APPetite than completing the pen and paper VAS. Findings that over 90 % of participants would prefer to use APPetite for any future recording of free-living subjective appetite – for reasons associated with accessibility, a simplified process, and easy and quick use – support the rationale for developing a tool such as APPetite. While previously developed electronic rating systems have been perceived easy to use(Reference Whybrow, Stephen and Stubbs10), the development of APPetite as a smartphone application afforded the additional benefit of participants having the tool on their person for much of the time. Our qualitative findings suggest that participants found that advantages of using the tool related with accessibility, easy to use and environmentally friendly compared with providing answers in pen and paper. This is of interest, as the pen and paper method was preferred to the EARS I tool for very similar reasons in the study(Reference Stratton, Stubbs and Hughes5). It seems the smartphone platform, with which people are familiar and which people tend to carry on their person, overcomes some of the limitations of earlier electronic devices with regard to usability. Indeed, these reasons seem to be very promising factors for usability purposes across time and context(Reference Trull and Ebner-Priemer25). Regarding potential disadvantages of the APPetite tool, these seem to be mainly related with reminders for completion and IT and connectivity issues. Automated reminders would prove a useful additional function of APPetite; this should be a primary focus of future development of this, or similar tools.
Although an increased number of people in the 21st century use mobile phones and have internet connection, it is important to consider barriers for certain specific populations where digital literacy or connectivity limitations may be a problem. It is acknowledged that the study cohort of the present study is largely young-to-middle aged women, representing a demographic of low deprivation from a more economically developed country. As such, conclusions regarding usability, in particular, should be limited to similar cohorts. Usability may be compromised for those with limited access to smartphone devices and internet connection and older adults (> 65 years) are less likely to have and adopt to smartphone use(Reference Choudrie, Pheeraphuttranghkoon and Davari26). However, the simplicity of APPetite, with few steps required, simple display of numbered scales and clear instructions aid usability for older adults(Reference Morey, Stuck and Chong27). Of the cohort of the present study, two participants (both of whom complete Experiment 1 and Experiment 2) were aged over 65 years (both 67 years of age). Compliance was high for both (both 100 % in Experiment 1 and 100 % and 85 % in Experiment 2), suggesting suitable usability. Nonetheless, future research should assess validity, reproducibility and, in particular, usability of APPetite in older adults. As such, we recommend that researchers and practitioners using the APPetite ensure that participants have equal access to, and capability to use the tool(Reference Fortney, Burgess and Bosworth28).
APPetite, as a novel EMA method, may represent a progressive approach to measuring free-living subjective appetite. Mobile phone-based EMA methods for measuring free-living food intake have proved valid and reliable(Reference Martins, Correa and Han15,Reference Rollo, Ash and Lyon-Wall16,Reference Rangan, Tieleman and Louie29) , exhibiting greater precision than traditional pen and paper food diaries(Reference Costello, Deighton and Dyson14). With specific relation to measuring subjective appetite, there are a number of operational and practical advantages of APPetite, as an EMA method, for the researcher. The automatic transfer of data reduces researcher burden and eliminates the risk of error when recording and inputting pen and paper VAS data. The real-time collection and transfer of the data to the researcher allow for a more cost-effective and time-efficient data collection and for closer monitoring of measurements. This real-time tracking allows for prompts and reminders should measures be missed, late or completed incorrectly(Reference Stratton, Stubbs and Hughes5), and data are collected ‘time-stamped’, which affords the research greater confidence in the validity of the data. In the present study, two participants were excluded due to observing inaccurate completion of data collection with APPetite that would not have otherwise been detected with the pen and paper VAS tool (mis-reported timing of measures and apparent retrospective measures). Hence, the collection of measures of subjective appetite using APPetite is likely to prove preferable for researchers as well as participants.
It is appreciated that for insightful monitoring and understanding of free-living eating behaviour, there is benefit in obtaining a number of measures, using an ‘appetite toolkit’(Reference Gibbons, Hopkins and Beaulieu30), especially when considering the limitations of measuring free-living energy intake(Reference Blundell, de Graaf and Hulshof3). As such, the smartphone app-based APPetite tool may prove a useful addition to such a toolkit for researchers. Combining the use of APPetite with a smartphone-based EMA method of dietary analysis may prove an effective approach for assessing multiple components of free-living eating behaviour. It is worth acknowledging that the current study did not assess the ability of APPetite score of subjective appetite to predict free-living food intake. VAS score has been shown to be a weak predictor of food intake(Reference Flint, Raben and Blundell1,Reference Sadoul, Schuring and Mela31) ; it would be of interest to determine the ability of APPetite-derived measures of subjective appetite to predict food intake and other parameters of eating behaviour in free-living settings.
Despite encouraging evidence of validity, reproducibility and usability, there remain areas for improvement in APPetite. Monitoring compliance in real-time and sending reminders is a time-consuming process for researchers. An in-built reminder or alarm would reduce researcher burden and could improve compliance, especially as some participants perceived the VAS to be easier to remember due to the visual cue of the paper questionnaire. The limitations of this study must also be acknowledged. As mentioned earlier, the study cohort was predominantly young-to-middle aged, non-obese women, and recruited from areas of low-deprivation, which limits recommended use to similar populations at this stage. The BMI measure also relied on accurate self-report of height and weight, which was necessary given the free-living, remote nature of data collection. The efficacy of APPetite to predict eating behaviour was not assessed, which at this stage limits the application of APPetite to assessing subjective appetite. The sample is also somewhat heterogeneous, with regard to age, BMI and gender, which must be acknowledged when considering the external validity of the findings. However, there are also some pertinent strengths of this study. The two-experiment, mixed methods design allowed for the rigorous assessment of validity, reproducibility and usability, all of which are important considerations for a measurement tool. The statistical analyses conducted provide a thorough and rigorous assessment of agreement between measures, using a priori LOA and an a priori sample size calculation to ensure an appropriate sample size. Further, studies of this nature are typically not conducted in a free-living setting and hence this study affords assessment of APPetite’s effectiveness as well as efficacy as a tool for free-living, remote measures of appetite.
In conclusion, the app-based APPetite tool appears a valid, repeatable and preferred tool for measuring changes in subjective appetite, compared with the criterion tool of the pen and paper VAS. However, proportional bias between the two measures suggests that the two tools should not be used interchangeably. These findings promote APPetite as a viable tool to be used by researchers and practitioners who wish to remotely measure changes in appetite in free-living settings, specifically in a cohort of predominantly young-to-middle aged, non-obese women in areas of low deprivation and high access to mobile phone technology. Further research to assess the validity and usability of APPetite in other cohorts is needed. Nonetheless, the accessibility to such monitoring could help further our understanding of appetite regulation, modulation and impact on eating behaviour.
Acknowledgements
None.
This research received no specific grant from any funding agency, commercial or not-for-profit sectors
A. H. formulated the research question. A. H. and D. C. designed the study. A. H., K. J. and D. C. conducted the study data collection and data processing. A. H. and M. K. conducted data analysis. A. H., K. J., M. K. and D. C. interpreted the findings. A. H. and M. K. wrote the manuscript. K. J. and D. C. edited the manuscript. All authors approved the final manuscript draft for submission.
There are no conflicts of interest.
Appendices
Appendix 1– Method Evaluation Survey
METHOD EVALUATION
Please think back to both methods used to measure appetite and answer the following questions:
*Required
This questionnaire is part of the study, titled “APPetite: Validation of an app-based method for the remote measure of free-living subjective appetite”.


