


Introduction
In a deforming polycrystalline aggregate of ice, the rotation of any particular grain, which depends on the activation of crystallographically controlled glide, can be complex because of the bulk kinematics and the effect of local grain interactions. The most commonly reported glide system in hexagonal ice at higher temperatures is slip on (0001) with the only dislocations ever observed to participate in plastic deformation have the 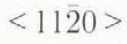 Burgers vector lying in this plane (Shearwood and Whitworth, 1993). The activation of slip is dependent on the resolved shear stress and hence the orientation of (0001) with respect to the bulk deformation axes. However, the plastic deformation of polycrystalline ice aggregates is often influenced by compatibility problems between the deformation of the different crystals calling for accommodation processes such as (1) sliding along non-coherent boundaries, producing spinning and translation of adjacent crystals, (2) migration of grain boundaries and (3) kinking of the crystals. On the scale of an ice sheet the bulk flow is not identical throughout a volume of the ice mass (Thwaites and others. 1984; Paterson. 1994) and the complexities of this deformation may be superimposed on the pre-existing crystallographic fabric and grain shape.
On a microscale, many investigators assume that crystal plasticity can be locally homogeneous but it is not always possible to extend this assumption to a mesoscale, as pre-existing fabrics often control the behaviour of the ice mass. Localized deformation with non-uniform patterns of lattice rotations and the effects of grain-boundary migration related to dynamic recrystallization processes are important if we are to understand the highly localized plastic flow as seen in natural ice masses. In this paper, we will consider the factors that relate to the development of inhomogeneous flow in ice masses by considering the two-dimensional deformation of initially tabular samples of polycrystalline ice. These will illustrate how different grain structures influence the bulk deformation with the samples deformed under identical conditions, except for a change in the external reference frame or kinematic factors. An external reference frame can be defined by the instantaneous shortening axis as it relates to the edges of the sample so that:
-
(1) There is no bulk rotation and the deformation is axial-symmetric with respect to the instantaneous shortening axis and the flow can be considered as axial shortening.
-
(2) The deformation is non-axial with translation of the boundaries with respect to the instantaneous shortening direction and includes a component of simple shear.
The microstructural evolution in typical polycrystalline ice aggregates with axial shortening from top to bottom (experiment BW 91). (a) Starting sample; (b) after 8% shortening; (c) after 23% shortening.

The main concerns of this study are the development of microstructures and the grain-scale deformation behaviour at temperatures of −1°C or higher as seen in a variety of polycrystalline ice types. Understanding the accommodation processes has a very practical impact on the development of the lattice fabrics observed in slow moving natural ice masses (e.g. Thwaites and others, 1984: Paterson, 1994). The current observations suggest that it is not possible to accept the homogeneous strain and stress assumptions used in some other ice models (e.g. Van der Veen and Whillans, 1994), because pre-existing grain microstructure and fabrics contribute significantly to the nature of the deformation. It is the unique relationship between the orientation of the slip-plane and bulk-deformation axes with the dominance of the one-slip system in ice that controls its deformation. In this paper, we will present experimental observations and compare these to results obtained from mechanical models integrating one slip system. In particular, deformed ice aggregates composed of randomly oriented polycrystals (Fig. 1) with uniform grain-sizes and shapes will be compared to the behaviour of large elongate crystals interspersed with smaller crystals (Fig. 2), in which the large aspect ratios of the principal lengths are parallel to the dominant orientation of slip planes and initially sub-parallel to the instantaneous shortening orientation.
The microstructural evolution in an anisotropic ice aggregate with axial shortening from top to bottom (experiment BW 82). (a) After 13% shortening; (b) after 23% shortening; (c) after 33% shortening, the detailed grain structure observed in the boxed area is seen in Figure 4.

Experimental Methods
The transmitted light plane-strain experiments described here used the micro-deformation apparatus described by Wilson (1984) and the samples were either equigranular polygonal aggregates or samples dominated by elongate grains with (0001) perpendicular to the constraining glass plates and parallel to the bulk-shortening axis. The ice polycrystals are comparable in grain morphology and fabric to the polycrystalline aggregate described by Wilson (1981). The anisotropic ice was prepared in the laboratory and was composed of large elongate grains with a common (0001) orientation, between which were smaller grains with variable orientations (Fig. 1a); this ice type is comparable to the ice described by Wilson and others (1986). The sample (approximately 40 mm × 20 mm × 0.7 mm) was deformed in plane strain between the two glass plates by driving a 0.7 mm thick platen into one end of the sample at a constant displacement rate, causing the sample to deform al an axial rate of ≠ = 9 × 10⁻⁵s−1. The load was up to 6 Pa on the driving platen and measured using a load cell positioned between the platen and the motor drive (Wilson and others, in press). These conditions span the ductile region where the ice deforms predominantly by grain-boundary migration and where strain rates are higher than natural situations (Paterson, 1994). However, the microstructural evolution can be meaningfully extrapolated to natural conditions due to the fact that neither microstructural nor mechanical steady state is approached even at high sample strains.
The samples were secured on the glass plate by a coaling of silicon grease and the lower and upper surfaces of the sample were lubricated with a film of silicon oil. During the deformation the sample was contained in a small volume of silicon oil in order to maintain a uniform temperature across the sample. The sample has to remain unstrained in the third direction perpendicular to the deformation plane (plane strain) as the thickness of the sample is kept approximately constant by the glass windows. In the deformed sample, the ambient temperature was maintained at approximately −1°C, using a platinum resistance temperature probe that constantly monitored and controlled the air temperature that was circulated around the specimen within an insulated container (Wilson, 1984). No direct measurement of temperature was undertaken on the ice surface or on the glass plates. An external source of heat that may have affected the temperature in the sample was the flash unit attached to the camera, located adjacent to the deforming sample. However, before the load was applied the temperature was stabilized and there was no observed melt or other microstructural change to any sample; during this period there was continuous activation of the flash unit. Dynamic events in the deforming specimen were recorded in transmitted polarized light using a time-lapse camera over a period of up to 6 × 10⁵ s.
Experimental Axial Shortening
In this situation the bulk instantaneous shortening axis does not change position with respect to the deformed ends of the sample. In all axial deformation experiments, undertaken in this particular deformation apparatus, it was noted that there was initiation of melt as described by Wilson (1994) and Wilson and others (in press). However, it is the nature of the initial grain structure, that is the grain orientation and shape, which determines whether the aggregate deforms nearly homogeneously (Fig. 1) or is markedly heterogeneous (Fig. 2). In order to establish a specific understanding of how ice aggregates deform and what produces the grain structures and crystallographic fabrics, the behaviour of two different end-member ice types will be described below.
Polycrystalline grain aggregate
The first microstructural changes are obvious grain-boundary adjustments with the development of sutured grain boundaries, contemporaneous with the development of slip bands parallel to (0001). Original grain-boundary outlines (fig. 1a) rapidly became obscured (fig. 1b) as grain rotation takes place and a new c-axis preferred orientation pattern begins to develop within the first 10% of shortening. The distribution of deformation in the samples is non-uniform with easy glide being activated in many grains well before deformation occurs in grains with obvious hard-glide orientations. The development of undulose extinction (grain a in figure 1b), sub-grains (grain b in figure 1b) and kinks are evident in some grains, in the early stages of deformation but many of these grains are destroyed by subsequent grain-boundary migration (fig. 1c). This is particularly obvious where crystals with caxes that are initially oriented either at a low or high angle to the shortening direction become progressively smaller and are removed from the sample. The c-axis pattern in such samples is a double maximum lying between the 25° and 50° small-circle girdles and at strains of greater than 20% it typically includes an angle of approximately 50° to the bulk shortening axis (fig. 3a).
It is obvious that the bulk deformation is achieved by deforming only those crystals that are favourably aligned for easy slip. In contrast, the other grains accommodate the deformation by neighbouring-grain interactions and by grain-boundary processes. These grain interactions lead to large variations of the deformation field within single grains, particularly adjacent to grain boundaries and the overall effect is a non-uniform deformation between grains as seen in the irregular outline of the deformed sample margins (Fig. 1c).
Microstructure and corresponding c-axis preferred orientations, related to the shortening axis Z and extension axis X. (a) Polygonal ice, experiment BW 91, after 23% shortening and (b) anisotropic ice after 33% shortening, experiment BW 82.

Anisotropic grain aggregate
In the more anisotropic grained samples a large number of experiments were undertaken at −1°C with different proportions and distributions of smaller grains, with variable orientations, occurring between the highly anisotropic grains. The axial shortening direction is parallel to the set of elongate grains that had a common (0001) direction parallel to the length of the sample. Examples of such experiments are found in Figure 2 and in Wilson (1994, experiment F3, Fig. 3). The shape of the deformed sample (Fig. 2) is primarily a function of the initial grain structure, particularly the spatial distribution of the smaller grains and the misorientation of the crystallographic slip planes with respect to the shortening axis.
In the elongate grains with (0001) perpendicular to the direction of shortening the slip bands are progressively rotated away from their initial orientations, This leads to the development of kink hands at a high angle to (0001) combined with a gentle buckling of the aggregate. These anisotropic grains are in a hard-glide orientation, involving little intragranular deformation and most of the strain involves passive rigid rotation.
The scale of buckling is controlled by the location of the smaller grains which act as ductile areas adjacent to the apparently stronger grains. These variably oriented smaller grains are the first grains to show the onset of deformation with the immediate development of slip bands but evidence for their existence becomes less as grain-boundary migration begins to dominate (e.g. region a in figure 2a). In the anisotropic grains, after a gentle crystal-lattice bending, new grain boundaries start to evolve (area c in figure 2c) and develop small new grains that overprint and destroy the original grain structure (Fig. 4).
The degree of re-orientation in the inequant-shaped grain aggregates is not as extensive as in the polycrystalline aggregate. This does influence the final fabric, as the initial fabric is non-random; the fabric is a combination of both rotated old grains and the new recrystallized grains (fig. 3b). It is also noticeable that there is the development of a domainal pattern and grain elongation, by a combination of grain rotation and grain-boundary migration, perpendicular to the direction of shortening. At shortenings greater than 20% (fig. 2b and c) two obvious wedge-shaped zones develop adjacent to both platens and extensive recrystallization and grain growth occur. In these areas, the intragranular deformation inevitably becomes highly localized non-uniform crystal-plastic flow with a marked elongation of the recrystallized grains perpendicular to the shortening axis.
Recrystallized grains (a–f) overgrowing deformed anistropic grains in a zone of bending in experiment BW 82. For location see insert indicated in figure 2c. The trace of the slip bands in the anisotropic ice is preserved because of the silicon oil film that exists between the sample and the constraining glass plate.

Experimental Non-axial Shortening
Figure 5 illustrates the general sequence of deformation recognized where the bulk of the crystals do not maintain their general starting orientations, but undergo a dextral translation and gentle bulk rotation as the elongate sample slides adjacent to the moving platen. This situation appears to be caused by the initiation of a sliding instability along the sample–platen interface as the sample begins to buckle. Along this interface, a fluid pressure may develop in the silicon oil which is capable of locally reducing the shear stress that facilitates the sliding of the sample. In fact, it is the bulk grain-aggregate rotation that strongly influences the activation of the ensuing localized slip and the magnitude of grain rotations.
During this process it is obvious that much of the initial deformation is accommodated in the smaller variably oriented grains (e.g. grain a in figure 5a) involving slip, grain rotation and extensive grain-boundary migration. Such regions also localize subsequent bending of the sample and accommodate much of the intragranular strain. These smaller pre-existing grains undergo obvious grain-boundary adjustments (Fig. 5b and c) with the development of sutured boundaries comtemporaneous with the appearance of slip bands parallel to (0001). This is particularly obvious in the finer-grained crystals with c-axes that are initially oriented either at a low or high angle to the shortening axis and in the region adjacent to the restraining platen.
As the sample is progressively shortened, the more elongate crystals continue to buckle and develop marked undulose bands perpendicular to the (0001) slip planes. As buckling progresses, the ice adjacent to the fixed platen generally remains stationary while the ice adjacent to the driven platen progressively rotates with respect to the shortening axis (Fig. 5c and d). The long limb of the buckle is rotated into an orientation for easy glide and does not show any recrystallization nor any significant changes in grain-size through processes of grain-boundary migration. In contrast, the inner are of the buckle is a region of high compressive stresses and undergoes extensive dynamic recrystallization. In these experiments there is no evidence of melt initiation.
The microstructural evolution in an anistotropic ice aggregate with non-axial shortening that involves a dextral shear of the sample (experiment BW 67). (a) Starting sample: (b–e) are 5%, 8%, 13% and 16% average longitudinal shortening strains, respectively.

Simulation of polygonal aggregate of ice. (a) Initial slip-plane traces in the numerical model; (b) the initial orientation distribution of slip-plane normals with respect to the specimen orientation; (c) final spatial distribution of slip-plane traces after 29% axial shortening; (d) final orientation distribution of slip-plane normals with respect to the orientation of the deformed specimen. The scale bar represents 2% frequency distribution of orientations.

Numerical Model
To understand the processes that may contribute to the observed microstructures and to comprehend the mechanical factors that control the deformation, numerical models have been constructed using a finite-difference computer code FLAC (fast Lagrangian analysis of continua; Cundall and Board, 1988; Itasca Consulting Group Inc., 1992). This code is based on the finite-difference method whereby the discretized equations for the elastic-plastic constitutive laws are solved by a dynamic relaxation scheme and is capable of mechanically modelling polycrystalline deformation involving one slip system. The theoretical basis of the model has been previously described by Zhang and others (1993, 1994) and an application to the modelling of deformation and microstructural development in polycrystalline ice (Wilson and Zhang, 1994) has produced results that are in agreement with experimental observations.
In the present computer models, the ice is treated as an elastic–perfectiy plastic material containing one slip system, which follows the Mohr–Coulomb yield criterion and a non-associated plastic flow law (Jaeger and Cook, 1979; Vermeer and de Borst, 1984; Ord, 1991); the Mohr–Coulomb elastic–plastic constitutive relation is considered appropriate to describe ductile deformation (Jaeger and Cook, 1979; Ranalli, 1987; Ord, 1991), where temperature is relatively low and strain rate is high. Such a material plastically deforms dominantly by dislocation glide on one slip plane (Zhang and others, 1993, 1994). The resulting fabrics in the polycrystals modelled here are primarily a function of initial grain stucture, the orientation of the operative slip system and bulk-deformation kinematics (Wilson and Zhang, 1994). It should be pointed out that the elastic-perfectly plastic flow law assumed here for the deforming medium will result in some deviation from the power-law rheology which is usually assumed for ice deformation but it allows us to obtain an approximation to intracrystalline-mechanism-based polycrystalline deformation and some insights into the operating processes.
Numerical bulk deformation was achieved by specifying appropriate boundary conditions. This involved defining fixed mesh boundaries and assigning constant displacement rates comparable to the experiments described above. The mechanical properties of ice used in the models are those discussed and adopted by Wilson and Zhang (1994). Three deformation situations involving (1) initially equi-axed hexagonal grains (Fig. 6), (2) an anisotropic ice aggregate (Fig. 7), both subjected to axial shortening and (3) a four-grain polycrystal subjected to pure shearing (Fig. 8) have been simulated.
Basic features of the axial shortening of the ice experiments, (a) Four undeformed polygonal grains (A, B, C and D) with basal planes (0001) and grain boundaries oriented at a high angle to the viewing plane (left), and possible c-axis orientations for each grain under the axial-shortening deformation frame. A has an orientation favourable for kinking, B and C have an easy-glide based-plane orientation and D has a stable orientation. (b) A pure-shear deformation with 20% bulk shortening and showing the relationship to the finite strain ellipse, (c) Stress distribution within a grain (see text for further explanation).

Polycrystalline grain aggregate
The two-dimensional hexagonal-grain model is shown in Figure 6. This model (Zhang and others, 1993) simulates a numerical polycrystalline specimen containing 49 full hexagonal grains with variable slip-plane traces, subjected to axial shortening (Fig. 6a). The orientation of the initial slip-plane normals is random (Fig. 6b). The results highlight the feature of polycrystalline deformation with a single slip-system operation (Fig. 6c). Upon deformation, intragranular slip accommodates most of the deformation and the initial equi-axed grain geometry has been deformed into non-equi-axed shapes. Because of the limited slip system, the distribution of deformation is clearly inhomogeneous, on both the intragranular and intergranular scales. The grains showing high strain are mostly those with deformation-favourable lattice orientations. Intragranular microstructures are also well developed, including undulatory lattice orientations (smooth slip-plane bending], sub-grains, kink structures and flattened grains. In areas near the free boundaries of the specimen the inhomogeneity of strain is more marked. This is related to both the starting lattice orientation and the boundary conditions.
The final orientation distribution of slip-plane normals (Fig. 6d) shows that, after 29% bulk shortening, two maxima of slip-plane normals develop approximately symmetrically about the bulk shortening direction. The angle between the two maxima in the model is about 50°. This is compatible with the results from the experimentally deformed sample (Fig. 3a). As pointed out by Zhang and others (1994), the preferred orientation of the slip-plane normals strengthens as the bulk deformation increases with slip plane normals generally rotating towards the bulk shortening axis. However, the maxima of the slip-plane normals do not lie in this direction, due to the deviations between the orientations of local maximum principal stresses and the bulk shortening axis as caused by grain interactions.
Simulation of deformation in anisotropic ice. The basic features are a direct copy of the microstructure in experiment F2 (see Wilson, 1994). The fixed platen is at the base of the sample, (a) Starting sample; (b) after 10% axial shortening; (c) after 20% axial shortening.

The model also illustrates a number of significant features that are highlighted in a simplified pure shear deformation illustrated in Figure 7. Grains in easy-glide orientations (grains B and C in figure 8a) will produce bending of the (0001). However, in the experiments there is little lattice bending, instead, these are the first grains to undergo extensive grain-boundary migration and recrystallization. Grains in hard-glide orientations (grains A and D in figure 8a) undergo only limited glide but if they lie parallel to the bulk compression direction will kink or buckle. The strain in individual grains would therefore be markedly different from the bulk finite strain (Fig. 8b). Similarly, the stress distribution (Fig. 8c) is inhomogeneous both on the inter-grain and intra-grain scales as explained by Wilson and Zhang (1994). Significant stress variations are therefore occurring at grain triple junctions and these are the sites where significant grain-boundary migration or the first melts occur (Wilson and others, in press).
Anisotropic grain aggregate
Where there was a significant proportion of elongate grains lying in a hard-glide orientation the strain distribution was clearly inhomogeneous (Fig. 8). Grains that initially bad (0001) parallel to the shortening direction (Fig. 6a) shortened to produce prominent intracrystalline deformation features, such as kinks. Grains in an initial easy-glide orientation generally became markedly elongate and produced gentle lattice bending of (0001). Grains with (0001) perpendicular to the shortening axis always appeared undeformed, whereas in the experiments (Fig. 2) grain-boundary migration modified their shape until they disappeared. Many of these features continued to be amplified as the model was shortened to 20% (Fig. 8b and c).
The modelled shear-strain contour distribution for such an experimental sample (Fig. 9) appears to lie in broad zones that transect the sample in a conjugate pattern. The zones of highest shear-strain concentration are oriented at 45° the shortening direction and emanate from either the moving platen end or unconstrained boundaries of ihe sample. As grain distortions across grain boundaries become more prominent (cf. Fig. 8b and c), the magnitude and distribution of the shear-strain contours become more marked. The distribution of these shear-strain contours bears a strong resemblance to the inhomogeneous plane-strain deformations described by Johnson and Mellor (1973) where the distribution of strain in the samples varies as a rigid indentor pushes into a ductile material. For various indentation geometries, a field of shear or slip lines can be calculated and predicted Johnson and Mellor, 1973). In this experiment, the area of specimen widening and the location of initial sites of melting closely correspond to regions in the samples that would be parallel to a set of slip lines.
Simulation of shear-stress distribution in the ice-deformation experiment F2 at 20% shortening (cf. Fig. 8c). The contour intervals represent 1.50 × 10⁻¹ steps in shear stress (MPa), increasing from unstippled, stippled to black.

Discussion
It is obvious that the microstructure and accompanying crystallographic fabrics are closely dependent upon bulk strain and displacement history. Simultaneous slip occurs concurrently in several grains and with different lattice orientations, producing nearest-neighbour grain interactions and local variations in stress. When using numerical models of the type described and summarized by Van der Veen and Whillans (1994), it has been usual to take axial deformation to be centro-symmetric. This is probably justified for initially isotropic aggregates but would not necessarily be so for anisotropic ones because of the development of buckling instabilities. Nonetheless, in many previous modelling studies there has been no attempt to address the fact that when grains undergo very large changes in shape they are bound to respond differently than if they had remained equi-axed.
Similarly, another source of difference between the experiments and previous models is the non-uniform deformation that is typical of the actual grain deformation. In the models, even after relatively high strains are reached, each of the grains remains in contact with the same neighbours it started out with. In the experiments, it is evident that grain interactions create large grain-boundary migrations and it is only grains in hard glide orientations that may remain in contact with the same neighbour. However, this is difficult to discern because of the extensive amount of grain-boundary migration.
In contiguous grains, the slip modes are different and the lattice rotations that occur within them are also different. This leads to a larger spread in the orientations developed in a given grain as seen in both the experiments and the models, with the development of sub-grains and undulose extinction. An insight concerning the influence of non-uniform deformation on an aggregate was gained by considering the interactions of only four grains (Fig. 7). In this situation the localized incompatibility of strain across grain boundaries, particularly at triple-point junctions, probably creates significant differential stresses that relate to increases in internal lattice-defect energy.
In the vicinity of the grain boundaries, grain growth is dominant and melting is first noticed (Wilson, 1994; Wilson and Zhang, 1994). In such areas, these processes are a response to the stress differences (Fig. 7c) and, as the ice crystals do not undergo any further significant crystallographic grain rotations, the resolved shear stress rises (Fig. 9). At larger strains the development of a new microstructure results in a probable strain hardening of the aggregate. As a result, the axial stress required for yielding also increases and there must be an expenditure of the mechanical energy. Two possible situations may exist where the mechanical energy produced by deformation is converted into either (1) heat energy, which coupled with an external heat source, may facilitate the formation of melts (Wilson and others, in press) or (2) a grain-boundary energy. In the latter case, the lattice-defect energy would equal the grain-boundary driving force with the strain energy being dissipated as new dislocations are constantly generated behind the migrating boundary.
On a larger scale, there is a set of axes that relates to the entire aggregate and how it undergoes a bulk deformation. If the ice is deformed parallel to an anisotropy, then a domainal pattern of deformation is produced predominantly by grain rotation. The associated pattern of heterogeneous strain occurs at a local and on a bulk scale with partitioning of strain into rotated or buckled sections versus areas where there is extensive recrystallization. An imposed bulk shearing motion results in a progressive selection of orientation domains so that strain can be partitioned into domains dominated by either easy glide or extensive dynamic recrystallization. The recrystallization is a strain-softening process. When the anisotropic grains are rotated to orientations sub-perpendicular to the bulk shortening direction, that is parallel to the extension direction, these grains undergo only limited glide that produces minimal shape changes.
Conclusions
By imposing strict kinematic constraints, a number of accommodation processes are needed to complement intracrystalline slip and produce distinct microstructures. These processes do not co-exist in the same experiment and the orientation of the basal plane in the ice is critical for the selection of the major accommodation process.The examples described demonstrate that:
-
The orientation distribution of intracrystalline slip planes determines the deformation history, particularly if there is it pre-existing grain-shape or orientation fabric.
-
Starting from an initial random distribution of polygonal grains, intracrystalline slip is favoured in grains with easy-glide orientations and these are the first grains to undergo dynamic recrystallization.
-
Patterns of heterogeneous deformation and fabric development occur both on a local and on a bulk scale and can be related to nearest-neighbour grain interactions.
-
Dynamic recrystallization involving grain-boundary migration, new grain nucleation or localized melting are convenient mechanisms that allow strain softening to occur in anisotropic ice masses.
Acknowledgements
This research was supported by grants from the Australian Research Grants Committee and we acknowledge Itasca Consulting Group Inc. for use of the code FLAC. P. Duval and A. Ord are thanked for their reviews of the paper.



