


Methotrexate (MTX, 4-amino-N10-methyl folic acid), an antagonist of folic acid, is commonly used as a chemotherapeutic drug to treat a variety of cancers and inflammatory diseases(Reference Puig1). It is converted to 7-hydroxy MTX in the liver. Both MTX and 7-hydroxy MTX are excreted by the kidneys, and a small part is also excreted in the bile(Reference Saka and Aouacheri2). MTX is used in dose-dependent manner, which demonstrates that the treatment dose varies depending on the disease to be treated.(Reference Mager3). Due to dose-dependent hepatotoxicity and nephrotoxicity, MTX’s clinical usage is restricted. Even at modest dosages, MTX can cause hepatic fibrosis and cirrhosis as a significant adverse effect. The use of low-dose MTX in the treatment of psoriasis was found to increase the risk of cirrhosis by 7 %. In 8 % of the patients, transaminase levels were found to be three times higher than usual(Reference Walker, Rhodes and Westmoreland4,Reference Uraz, Tahan and Aygun5) . The pathogenesis of MTX-induced renal impairment is thought to be mediated by either MTX and its metabolites precipitating in the renal tubules or MTX’s direct toxic impact on the renal tubules(Reference Widemann and Adamson6). Although the actual mechanisms of MTX-induced liver and kidney damage are unknown, one of the hypotheses is the breakdown in cellular antioxidant defences, which increases the production of reactive oxygen species and nitrogen species, inhibits cytosolic NADP-dependent dehydrogenase and NADP malic enzyme, lowers glutathione (GSH), superoxide dismutase (SOD) and catalase levels and reduces the effectiveness of the antioxidant defence system protecting the cell against reactive oxygen species(Reference Savran, Cicek and Doguc7). Endogenous antioxidant defence systems against oxidative stress appear to benefit from dietary antioxidant consumption(Reference Mann, Athira and Sharma8). Milk proteins can produce peptides with antioxidant properties. Whey (also known as lactoserum) is a turbid pale yellow-green liquid formed after the casein in milk has been coagulated by the action of a protease enzyme or by acid treatment(Reference Brandelli, Daroit and Corrêa9). Whey fraction of milk contains whey proteins (β-lactoglobulin, α-lactalbumin, Ig, bovine serum albumin, glycomacropeptide, lactoferrin and lactoperoxidase)(Reference Barone, Moloney and O’Regan10) and bioactive peptides(Reference Tonolo, Folda and Cesaro11). Whey proteins can be utilised as functional foods to improve human health and prevent diseases like cancer, CVD, diabetes mellitus, gut function disturbances, obesity management and muscle synthesis augmentation(Reference Layman, Lönnerdal and Fernstrom12,Reference Khaire and Gogate13) . Mansour et al. reported that whey protein isolate ameliorates cyclophosphamide-induced liver and kidney damage in rats via its antioxidant and anti-inflammatory activities(Reference Mansour, Salama and Hegazy14). Athira et al. demonstrated the protective effect of whey protein hydrolysate against oxidative damage caused by paracetamol(Reference Athira, Mann and Sharma15). In these studies, the mechanism for the antioxidant effects of whey proteins has been related to the inhibition of lipid peroxidation (LPO), scavenging of reactive oxygen species and chelation of transition metals. Accordingly, this study aimed to investigate the possible antioxidant mechanism of whey protein concentrate (WPC) against MTX-induced hepatic and renal damage in rats.
Materıals and methods
Materials
MTX was obtained from David Bull Laboratories, Mulgrave-Victoria, Australia. Whey protein beverage (Tazelen) was obtained from Kaanlar Food Industry and Trade, Turkey, and standard rat chow was purchased from MBD Feed Manufacturer, Turkey. All chemicals used were in analytical grade and were obtained from Sigma-Aldrich.
Animals and experimental design
The study was approved by the Marmara University School of Medicine Animal Care and Use Committee (Protocol Number: 55.2021.mar). Male Sprague–Dawley rats weighing 250–300 g were housed in wire-bottom cages in a constant temperature room of 22 (sd 2)°C with 12-h light and dark cycles and fed standard rat chow.
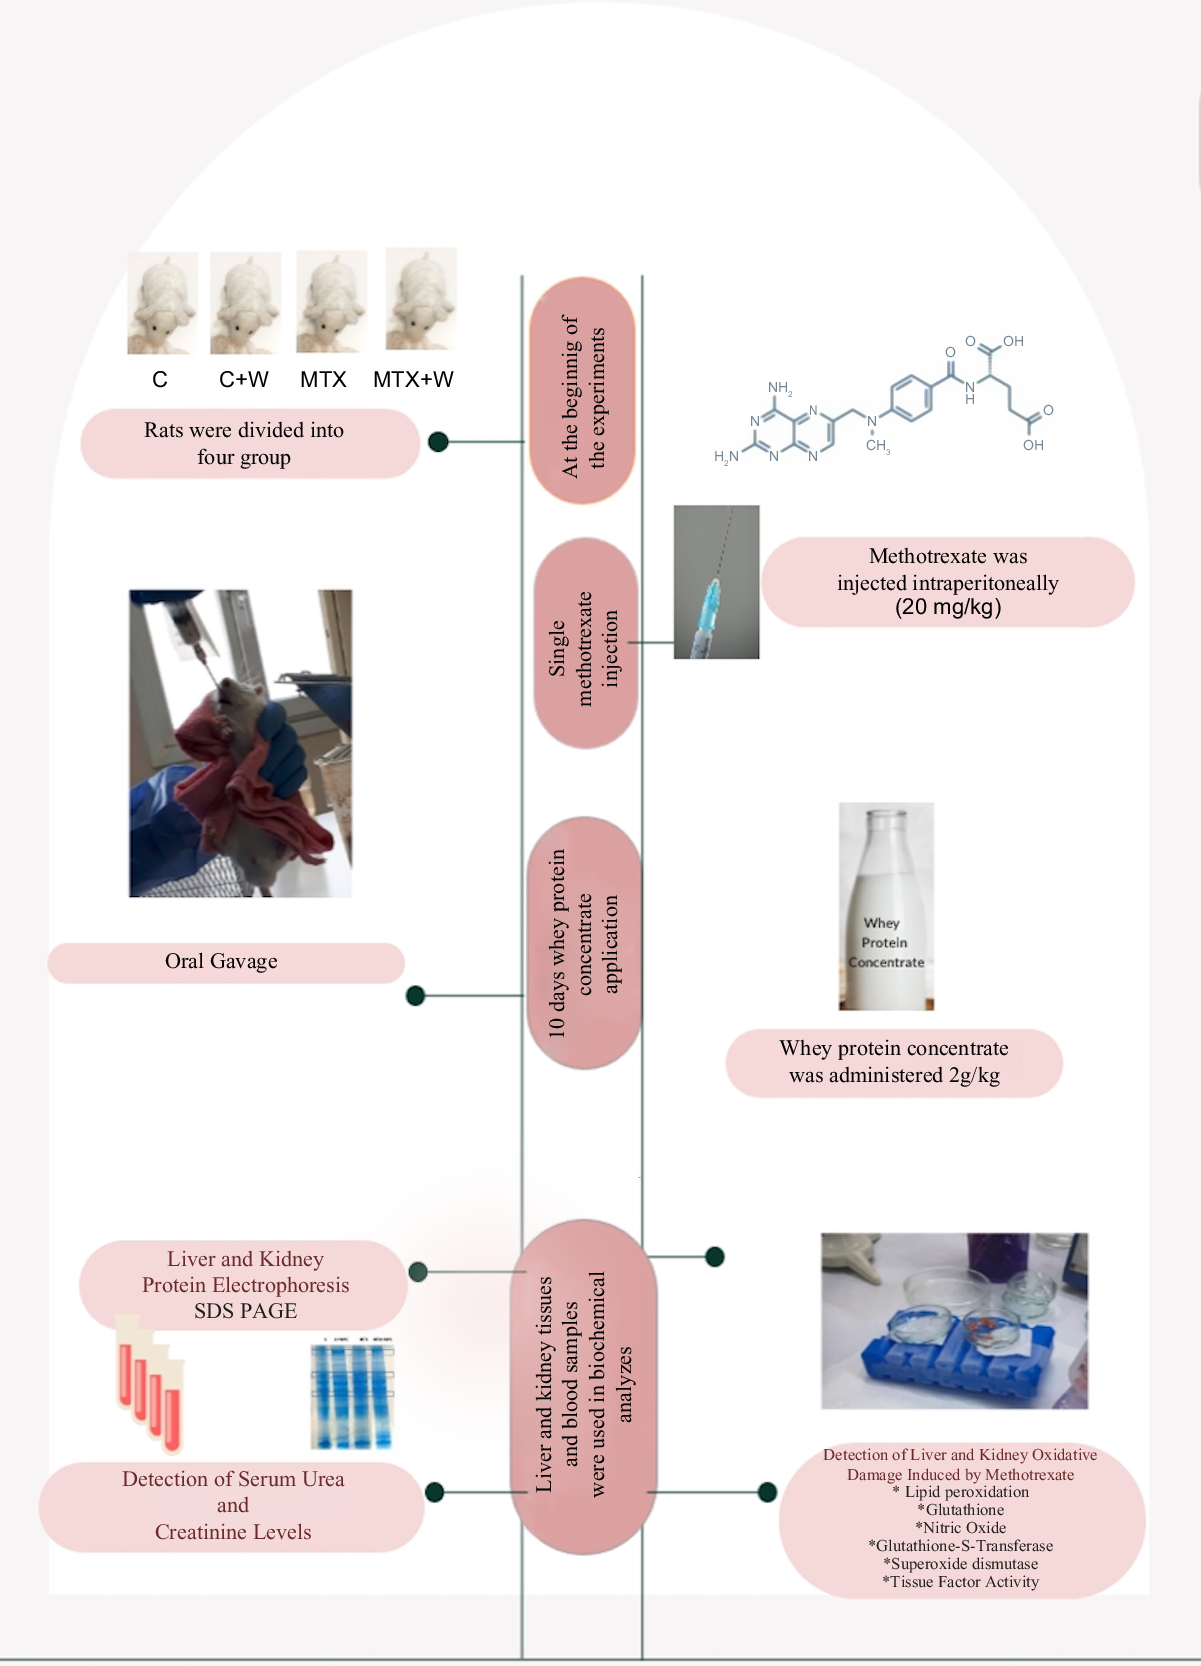
The thirty rats were divided into the following four groups control (C), whey protein concentrate-treated control (C + WPC), methotrexate administration (MTX) and whey protein concentrate-treated methotrexate administered (MTX + WPC) groups. In experimental models for the induction of tissue damage, 20 mg/kg MTX was a commonly used dose for rats(Reference Moodi, Hosseini and Abedini16–Reference Azadnasab, Kalantar and Khorsandi20).
Following MTX injection (in physiological saline, 20 mg/kg, single dose), either saline (MTX group, n 8) or WPC (2 g/kg, oral gavage, MTX + WPC group; n 8) was administered for the consecutive 10 d. In other rats, saline (C group, n 6) or WPC (2 g/kg, oral gavage C + WPC group, n 8) was administered for 10 d, following a single dose of saline injection. Trunk blood samples were drawn and liver and kidney tissue samples were taken on day 10.
Preparation of whey protein concentrate
The whey protein beverage was lyophilised using a VIRTIS (SP Industries Inc.) freeze drier at −50°C under a vacuum. Fifty millilitre whey protein beverage was approximately 20 g after lyophilisation. WPC was orally administered in a dose of 2 g/kg.(Reference Shimizu, Hara and Hira21,Reference Radic, Mijovic and Tatalovic22) . The administered dose of WPC provides less than 1 % contribution to the daily energy intake of rats.
Biochemical analysis
Serum urea and creatinine levels were measured according to the methods of Rosenthal and Slot(Reference Rosenthal23,Reference Slot24) . Liver and kidney tissues were homogenised in physiological saline. A motor-driven tissue homogeniser (IKA Ultra-Turrax T25 Basic; Labortechnik) was used to homogenise the tissue samples. The homogenates were centrifuged at 3000 × g for 10 min at 4°C. The supernatant was used for the analysis of LPO(Reference Ledwozyw, Michalak and Stepień25), nitric oxide (NO)(Reference Miranda, Espey and Wink26), GSH(Reference Beutler27), glutathione-S-transferase (GST)(Reference Habig and Jakoby28), SOD(Reference Mylroie, Collins and Umbles29) and tissue factor (TF)(Reference Ingram30) activities. SDS-PAGE was also carried out in the liver and kidney tissues according to the method of Laemmli(Reference Laemmli31).
Histological analysis
For light microscopic investigation, liver and kidney tissue samples were fixed in 10 % neutral buffered formaldehyde. After routine tissue processing, samples were embedded in paraffin. Approximately 5-µm-thick sections were stained with haematoxylin and eosin, and at least five microscopic areas in each sample were examined for morphologic analysis. Histopathologic scoring for the liver was performed by the following criteria: degeneration of hepatocytes, vascular congestion and sinusoidal dilatation, inflammatory cell infiltration and the number of activated Kupffer cells. For the kidney, degeneration of glomerular structure and dilatation of Bowman’s space, degeneration of proximal and distal tubule, vascular congestion and inflammatory cell infiltration were taken into consideration.
The microscopic scores of liver and kidney tissues were calculated as the total of the scores given to each criterion. Each of the criteria was scored semiquantitatively as 0: none; 1: mild; 2: moderate and 3: severe. The maximum total score for both tissues was calculated as ‘12’. Staining sections were examined and photographed with a digital camera (Olympus DP72) attached to a photomicroscope (Olympus BX51).
Statistical analysis
Statistical analyses were performed using GraphPad Prism 6.0 package programme (GraphPad Software). Results were presented as mean values and standard deviations. The normality of the distribution of all data was determined. The data showed a normal distribution; thus, parametric tests were used. ‘One-way ANOVA’ was used to compare the means of more than two groups and identify differences. The post hoc Tukey test was also utilised to analyze the differences in variable subgroups. The cutoff point for significance was applied to interpretations, where P < 0·05 was regarded as significant.
Results
Nutritional analysis of whey protein concentrate
The nutritional components of WPC are presented in Table 1.
Nutritional components of whey protein concentrate

Rat chow consumption and body weights
The chow consumption of rats significantly decreased in the MTX group compared with the control group. WPC administration to the MTX group caused a significant increase in chow consumption compared with the MTX group. Administration of WPC to the control group also caused a significant increase in chow consumption (Table 2).
Rat chow consumption and body weights
(Mean values and standard deviations)
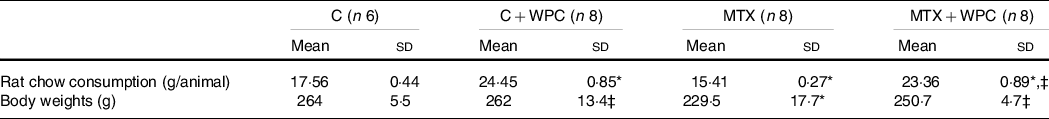
C, control group; C + WPC, whey protein concentrate-administered control group; MTX, methotrexate-administered group; MTX + WPC, methotrexate and whey protein concentrate-administered group.
* P < 0·05 compared with the control group.
‡ P < 0.05 compared with the MTX group.
There was no significant difference between the weights of the animals at the beginning of the experiment. When the weights were evaluated on day 10, MTX administration caused a significant weight reduction compared with the control group. WPC administration to the MTX group caused significant weight gain (Table 2). Although WPC administration caused weight gain in the MTX group, this increase was significantly lower than in the WPC-given control group (Table 2).
Biochemical analysis
Serum urea and creatinine levels
While the serum urea level of the MTX group significantly decreased, the serum creatinine level significantly increased compared with the control group (Table 2). Administration of WPC to the MTX group brought the urea and creatinine levels to the levels of the C + WPC group. The application of WPC to the control group significantly decreased the urea and creatinine levels compared with the control group, but the urea and creatinine levels were still within the normal range (Table 3).
Serum urea and creatinine levels
(Mean values and standard deviations)

C, control group; C + WPC, whey protein concentrate-administered control group; MTX, methotrexate-administered group; MTX + WPC, methotrexate and whey protein concentrate-administered group.
* P < 0·05 compared with the control group.
‡ P < 0.05 compared with the MTX group.
Liver results
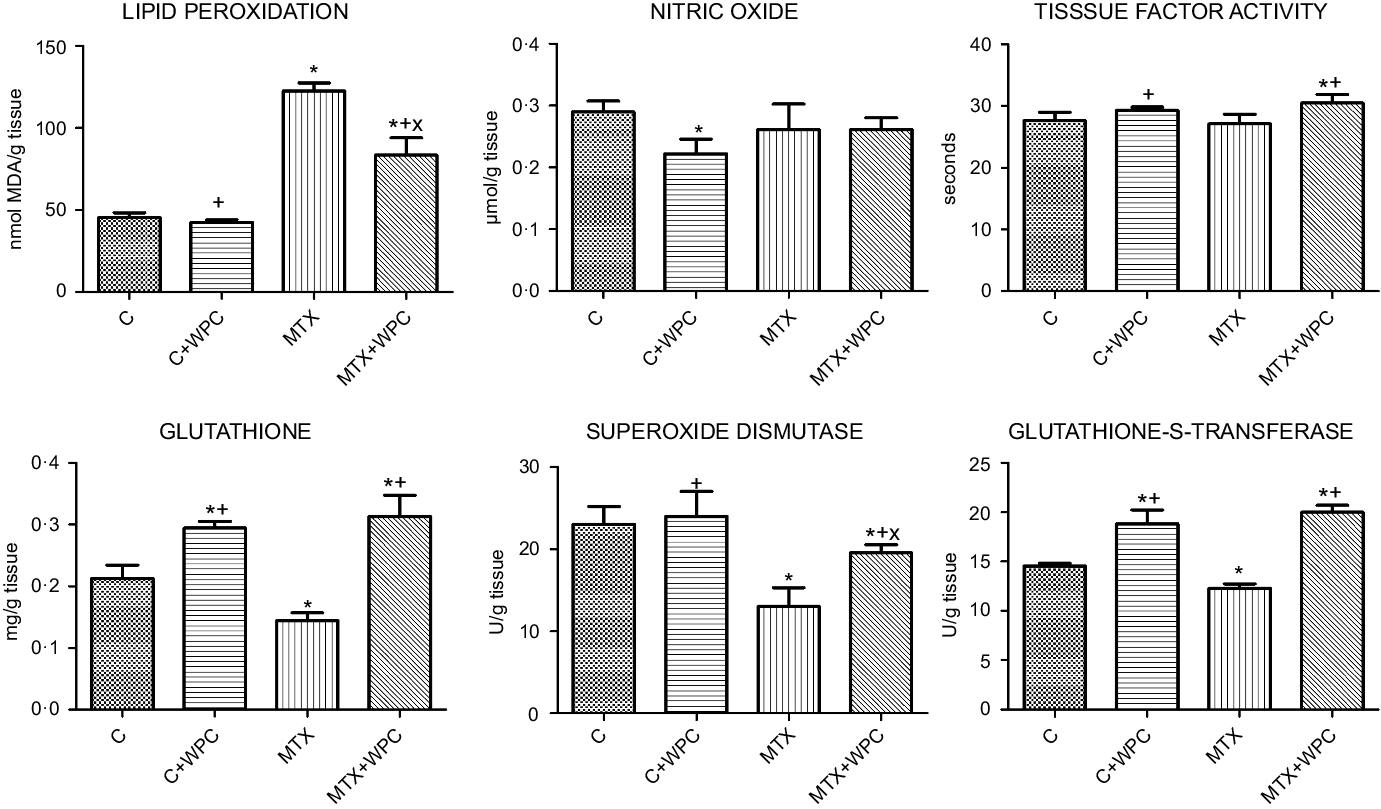
When compared with the control group, the liver LPO level significantly increased in the MTX group. GSH level, SOD and GST activities were significantly decreased, and NO level and TF activity did not significantly change in the MTX group compared with the control group. WPC administration to both MTX and C groups significantly decreased the LPO level. The LPO level of the MTX + WPC group was significantly higher than the C + WPC group. WPC administration to the MTX group also significantly increased GSH level, SOD, GST and TF activities and significantly decreased the NO level compared with the MTX group. Whey protein administration to the C group also increased the GSH level, SOD, GST and TF activities compared with the control group (Fig. 1).
MDA, GSH, NO levels, SOD, GST and TF activities of liver tissue. C, control group; C+WPC, whey protein concentrate-administered control group; MTX, methotrexate-administered group; MTX+WPC, methotrexate and whey protein concentrate-administered group; MDA, malondialdehyde; GSH, glutathione; SOD, superoxide dismutase; GST, glutathione-S-transferase; NO, nitric oxide; TF, tissue factor. (*): P < 0·05 compared with the control group, (+): P < 0·05 compared with the MTX group, (x): P < 0·05 compared with the C + WPC group, n 8.

Kidney results
LPO level was significantly increased, and GSH level, SOD and GST activities significantly decreased in the MTX group compared with the C group. WPC administration to control group decreased NO level and increased GSH level and GST activity. WPC administration to the MTX group significantly decreased LPO level and TF activity and significantly increased GSH level, SOD and GST activities (Fig. 2).
MDA, GSH, NO levels, SOD, GST and TF activities of kidney tissue. C, control group; C + WPC, whey protein concentrate-administered control group; MTX, methotrexate-administered group; MTX + WPC, methotrexate and whey protein concentrate-administered group; MDA, malondialdehyde; GSH, glutathione; SOD, superoxide dismutase; GST, glutathione-S-transferase; NO, nitric oxide; TF, tissue factor. (*): P < 0·05 compared with the control group, (+): P < 0·05 compared with the MTX group, (x): P < 0·05 compared with the C + WPC group, n 8.
SDS-PAGE
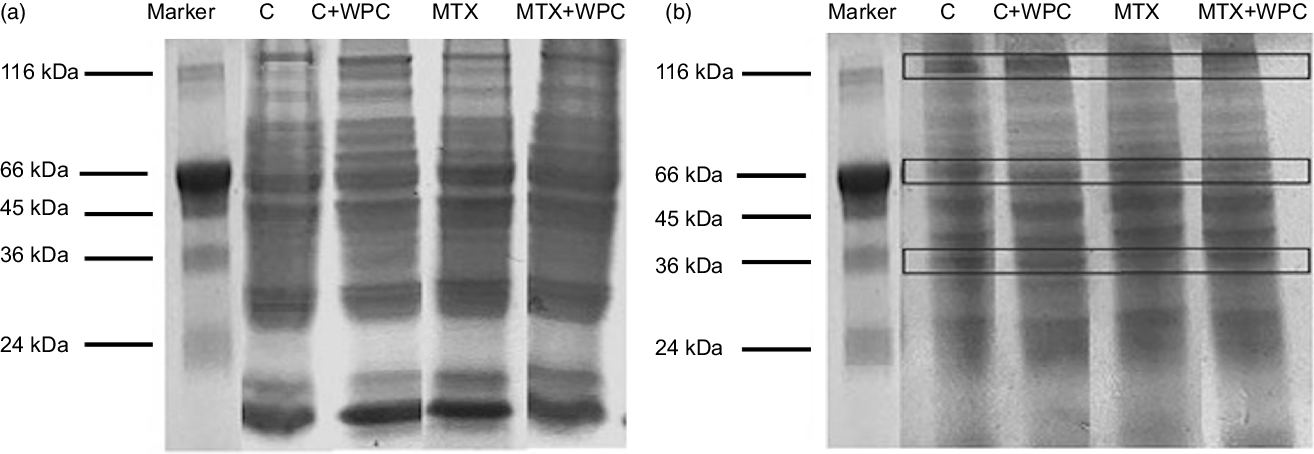
Figure 3 shows the electrophoretic patterns of liver and kidney tissue in all groups. While no significant changes were detected in the intensity of the liver protein bands, differences in the density of the kidney protein bands were detected in the electrophoretic examination of the kidney and liver tissue. Changes in the protein profile of the kidney tissue occurred in the form of decreased protein band density with MTX administration and increased protein band density with the WPC administration in the control and MTC groups.
Electrophoretic pattern of methotrexate and whey protein concentrate-administered liver and kidney proteins. C, control group; C + WPC, whey protein concentrate-administered control group; MTX, methotrexate-administered group; MTX + WPC, methotrexate and whey protein concentrate-administered group.
Histological analysis
Light microscopic evaluation of the control and C + WPC groups revealed normal liver morphology including the regular arrangement of hepatocytes and sinusoids (Fig. 4(a) and (b)). In the MTX group, severe vacuolar degeneration and pyknotic nucleus in hepatocytes, increased number of activated Kupffer cells, inflammatory cell infiltration and marked sinusoidal dilatation and congestion were prominent features of the morphologic damage (Fig. 4(c)). On the other hand, reduction in the number of activated Kupffer cells and inflammatory cell infiltration, diminished sinusoidal dilatation and congestion in addition to mild vacuolar degeneration in hepatocytes were observed in the MTX + WPC group (Fig. 4(d)). MTX treatment significantly increased the histopathologic score of liver tissue compared with control and C + WPC groups (P < 0·05; Fig. 4(i)). A higher histopathologic score of liver tissue in the MTX group was significantly reduced by treatment with WPC (P < 0·05; Fig. 4(i)).
Representative light micrographs of liver and kidney tissues in experimental groups. Regular liver parenchyma in control and C + WPC groups (a) and (b). In MTX group (c), degenerated hepatocytes (arrows), marked sinusoidal dilatation and congestion (**), increased number of activated Kupffer cells (broken arrows), inflammatory cell infiltration (arrowheads). In the MTX + WPC group (d), improvement in hepatocyte structure (arrows) besides mild vacuolar degeneration in hepatocytes in some regions of the liver parenchyma. Regular kidney morphology in control and C + WPC groups (e), (f). In the MTX group (g), marked glomerular congestion and dilatation in Bowman’s space (arrow), inflammatory cell inflammation (arrowhead), severe vascular congestion (*) and tubular degeneration (broken arrows). In the MTX + WPC group (h) normal glomerular (arrow) and tubular (broken arrow) structures in most regions of the kidney. (a–h); haematoxylin and eosin staining, bar: 50 μm inset: 20 μm. The graph of the histopathologic score of the liver (i) and kidney (j) tissue in experimental groups. (*): P < 0·05 compared with the control group, (+): P < 0·05 compared with the MTX group, (x): P < 0·05 compared with the C + WPC group, n 8.
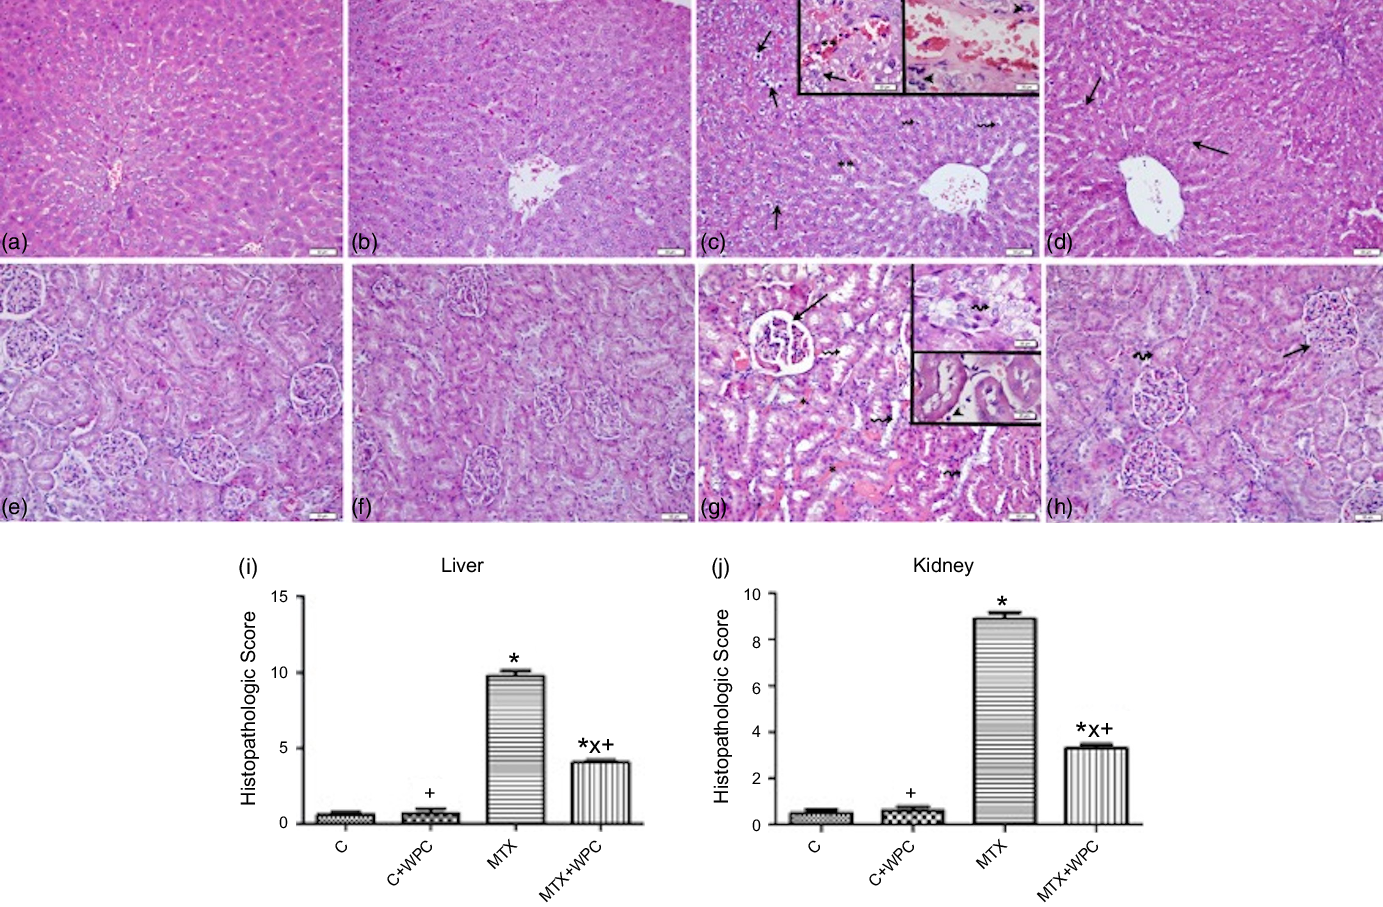
In control and C + WPC groups, regular kidney parenchyma including glomeruli and tubules was observed (Fig. 4(e) and 4(f)). MTX treatment caused a prominent dilatation of tubules and degeneration in tubular cells, marked vascular and glomerular congestion, dilatation in Bowman’s space and inflammatory cell infiltration in the interstitium (Fig. 4(g)). On the other hand, mild glomerular and vascular congestion, regression in the dilatation of Bowman’s space and inflammatory cell inflammation in the interstitium and improvement in dilated tubules and degenerated tubular cells were observed in the MTX + WPC group (Fig. 4(h)). The histopathologic score of kidney tissue in the MTX group was significantly increased compared with control and C + WPC groups (P < 0·05; Fig. 4(j)). Administration of WPC to MTX group significantly reversed this histopathologic score (P < 0·05; Fig. 4(j)).
Discussion
The findings of this study show that MTX treatment causes oxidative tissue damage in the liver and kidney, as measured by increased LPO and decreased GSH levels, SOD and GST activities, whereas whey protein administration protects against this oxidative damage. Histological findings also supported these findings, demonstrating the severity of the damage induced by MTX and the ameliorative effect of whey proteins on this damage. Histological findings supported these findings, demonstrating the severity of the MTX-induced damage and the ameliorative effect of whey proteins on this damage.
The anti-metabolite drug MTX is frequently used to treat cancer and inhibit the immune system; however, organ damage during MTX treatment reduces its therapeutic effectiveness(Reference Shinde, Venkatesh and Kumar32). There are many potential processes underlying MTX toxicity(Reference Chan and Cronstein33), but no effective treatments to ameliorate the condition exist. In addition to being administered as a drug to cause oxidative stress, MTX has also been used to induce cachexia, anorexia, intestinal mucositis and digestive absorption problem in experimental animal models(Reference Boukhettala, Leblond and Claeyssens34–Reference Sinno, Coquerel and Boukhettala36). There are some findings regarding the effects of MTX on the gastrointestinal system. Fox et al. reported that MTX caused weight loss in rats without causing enteritis, while Jahovic et al. reported that MTX caused weight loss due to malabsorption and enterocolitis in rats(Reference Fox, Kripke and De Paula37,Reference Jahovic, Cevik and Sehirli38) . In this study, while enteritis was not observed in MTX-treated rats, severe appetite loss was. WPC administration increased the feed consumption in MTX-treated rats. As a result of the prevention of appetite loss, weight gain has been observed in WPC-administered MTX-treated rats. Giving WPC to healthy rats also increased chow consumption.
While there are studies on the role of MTX-induced oxidative stress in liver and kidney damage(Reference Uraz, Tahan and Aygun5,Reference Jahovic, Cevik and Sehirli38–Reference Moghadam, Tutunchi and Namvaran-Abbas-Abad40) , there is no study related to the effect of whey proteins on MTX-induced liver and kidney damage.
In this study, MTX administration increased LPO and decreased GSH levels, SOD and GST activities and did not change NO levels in liver and kidney tissues. It is thought that the reason for detecting the NO level as unchanged may be related to the administration of a single dose of MTX or the 10-d trial period. Regarding liver and kidney damage in MTX treatment, Bedoui stated that MTX hepatotoxicity may occur due to the depletion of folate reserves and MTX-polyglutamate formation in the liver(Reference Bedoui, Guillot and Sélambarom41). Li et al. also stated that MTX-induced oxidative stress may cause glomerular and tubular damage by causing MTX accumulation in the kidney(Reference Li, Abe and Yamakawa42).
Since MTX induces oxidative stress by increasing reactive oxygen species in tissues(Reference Jahovic, Cevik and Sehirli38,Reference Moghadam, Tutunchi and Namvaran-Abbas-Abad40,Reference Olayinka, Ore and Adeyemo43) , the effects of various antioxidant substances against MTX-induced oxidative stress have been investigated(Reference Savran, Cicek and Doguc7,Reference Jahovic, Cevik and Sehirli38,Reference Olayinka, Ore and Adeyemo43–Reference Yuksel, Yuksel and Yagmurca45) .
Jahovic et al. determined that melatonin decreased LPO levels and increased GSH levels in hepatorenal oxidative damage induced by MTX(Reference Jahovic, Cevik and Sehirli38). In the study of Çetinkaya et al., they stated that n-acetylcysteine decreased LPO in the liver tissue and increased GSH level and SOD activity in the MTX-induced oxidative stress(Reference Cetinkaya, Kurutas and Bulbuloglu46). Abdel-Daim et al. showed that MTX-induced liver, kidney and heart damage was ameliorated with a flavonoid derivative diosmin(Reference Abdel-Daim, Khalifa and Abushouk47). Similar to these studies, there are studies in which vitamin C(Reference Savran, Cicek and Doguc7), resveratrol(Reference Özgöçmen and Yeşilot44), quercetin(Reference Yuksel, Yuksel and Yagmurca45), berberine(Reference Mehrzadi, Fatemi and Esmaeilizadeh48) and gallic acid(Reference Olayinka, Ore and Adeyemo43) were used to treat MTX-induced tissue damage. In this study, whey proteins, which are known to have antioxidant properties, ameliorated MTX-induced oxidative damage by decreasing MDA level and increasing GSH level, SOD and GST activities. This progress was also supported by the histological findings. In addition, it was determined that the whey proteins given to the control group rats did not adversely affect the liver and kidney tissues.
TF activity was another parameter investigated in this study. Tissue factor (FIII) is a coagulation protein that is involved in the coagulation mechanism’s extrinsic pathway. A variety of clinical conditions can cause TF expression in monocytes and endothelium, which can lead to thrombotic consequences. Pathological conditions caused by infection or disease can raise TF levels in the blood, which can then activate the coagulation mechanism(Reference Butenas49). In this study, TF activity did not change in MTX-induced liver and kidney damage, and whey protein application to this group increased liver TF activity and decreased kidney TF activity. Since there is no study related to the effect of whey proteins on TF activity in MTX-induced liver and kidney damage, the obtained TF activity findings should be taken into consideration during whey protein use.
In many experimental animal models, MTX has been found to increase serum urea and creatinine levels(Reference Moodi, Hosseini and Abedini16,Reference Tousson, Zaki and Abu-Shaeir50,Reference Jafaripour, Naserzadeh and Alizamani51) , but there are also studies showing that MTX reduces serum urea concentration(Reference Budancamanak, Kanter and Demirel52–Reference Severin, Campagno and Brandoni54). According to Severin et al., serum urea concentration increased for the first 4 d after MTX administration and then decreased and returned to normal levels by the eighth day. The low urea level, obtained at the end of 10 d of this study, is consistent with the findings of Severin et al. In this study, MTX administration decreased serum urea levels while increasing serum creatinine levels compared with the control group. Although the serum urea concentration appeared to be lower than in the control, it was still within the normal range. Low blood urea levels are often associated with malnutrition, but liver damage can also decrease urea synthesis, as urea synthesis occurs in the liver. The administration of whey proteins restored the urea level, which had been decreased as a result of MTX administration and also reduced the increased creatinine level.
Boukhettala et al. revealed that MTX treatment altered protein metabolism(Reference Boukhettala, Leblond and Claeyssens34). In their study, MTX administration reduced protein synthesis in the jejunal mucosa of rats; it also increased proteolysis, particularly in the lysosomal pathway. In this study, when the protein profile of the liver and kidney was investigated with SDS-PAGE, MTX did not change the liver protein profile, but it caused a decrease in some protein bands in the kidney tissue. WPC administration to the MTX group improved the deteriorated protein profile of the kidney tissue and did not change the liver protein profile. This finding indicates that whey proteins help the compensation of the decreased kidney proteins.
It is thought that bioactive peptides derived from whey proteins as a result of gastrointestinal digestion or bioactive peptides in the whey protein mixture with antioxidant properties may also play a role in improving liver and kidney damage caused by MTX.
In conclusion, whey proteins demonstrated a protective effect against MTX-induced liver and kidney damage. Whey proteins and their bioactive protein contents can provide nutritional support to MTX treatment.
Acknowledgements
This study was funded by a grant from Marmara University Scientific Research Project Department (Project ID: TYL-2021-10435).
Elif Tufan: Biochemical Investigation, Animal Care, Formal Analysis. Güzin Göksun Sivas: Biochemical Investigation, Animal Care. Begüm Gürel-Gökmen: Biochemical Investigations Animal Care. Sümeyye Yılmaz-Karaoğlu: Biochemical Investigation, Animal Care. Ercan Dursun: Biochemical Investigation, Animal Care. Esin Çalışkan-Ak: Histologic Investigation and Evaluation. Aleyna Muhan: Histologic Investigation. Dilek Özbeyli: Animal Surgery Göksel Şener: Conceptualization, Methodology. Tuğba Tunalı Akbay: Conceptualization, Supervision, Writing – Original Draft.
The authors have no relevant financial or non-financial interests to disclose.


