

Hydration plays a key role in human homeostasis. Insufficient water consumption can lead to the dysregulation of water balance, which may provoke cognitive impairments and, in the most severe cases, may result in delirium, coma and, finally, death in a few days(Reference Wilson and Morley1). Thus, it is important to recognise signs of dehydration at an early stage. Most previous studies of dehydration were conducted in athletes and/or under extreme conditions (heat, sustained physical exercise or a combination of both; for reviews, see Grandjean & Grandjean(Reference Grandjean and Grandjean2), Lieberman(Reference Lieberman3) and Armstrong et al. (Reference Armstrong, Pumerantz and Fiala4)). Consequently, they do not provide information on the effects of dehydration in more normal circumstances. Moreover, accurate control of dehydration is difficult to achieve(Reference Armstrong5).
In real life, under normal conditions, human fluid consumption varies widely and can lead to suboptimal hydration levels in some cases(Reference Le Bellego, Jean and Jeménez6), but the effects of dehydration in real life are not well documented. Progressive fluid deprivation (FD) appears to be the most appropriate method to induce dehydration under usual daily conditions, but this method has rarely been used. According to two studies using FD periods of 24–37 h in healthy volunteers(Reference Shirreffs, Merson and Fraser7, Reference Szinnai, Schachinger and Arnaud8), subjects felt less alert, more tired and believed it was more difficult to concentrate during the dehydration period compared with a control session with ad libitum fluid intake. Concomitantly, plasma and urine osmolality were significantly increased in both studies. In another study, 24 h FD altered working energy but no changes were found in depression, anxiety and self-confidence(Reference Petri, Dropulic and Kardum9). Petri et al. (Reference Petri, Dropulic and Kardum9) reported significant alterations on several objective cognitive tasks, whereas Szinnai et al. (Reference Szinnai, Schachinger and Arnaud8) did not observe any major dehydration-induced impairment of cognitive performance. Interestingly, women displayed some deterioration in reaction time in a verbal task but men did not after 24 h FD. Several factors may have biased the interpretation of FD effects in these studies: times and number of assessments; types of subjective items and cognitive tasks; number of subjects; sex effects; exact amount of fluid intake during euhydrated control trials.
In the present study, these potential confounding factors were avoided: (1) the different parameters were assessed at various time points throughout the 24 h FD period in order to avoid a circadian bias on performance and mood parameters and to assess the progressive dehydration effect throughout the day; (2) mood and cognition were assessed with validated and standardised tests and scales; (3) statistical power was calculated on the primary objective (i.e. cognition); (4) only women were included since they may be more sensitive to the effects of mild dehydration than men(Reference Armstrong, Pumerantz and Fiala4, Reference Szinnai, Schachinger and Arnaud8); (5) fluid and energy intakes were strictly controlled. Furthermore, to optimise potential FD effects, a homogeneous population of drinkers in terms of daily fluid consumption was chosen. The aim of the present study was to find variables (mood and related parameters, cognitive performance, physiological parameters) that are easily measured and sensitive to mild dehydration under standard and well-controlled conditions. We also determined whether ad libitum water intake could reverse the deleterious effects of progressive dehydration.
Materials and methods
Study design and procedures
The study was conducted at a single centre according to the ethical principles stated in the revised version of the Declaration of Helsinki(10) and after approval by an independent ethics committee.
After having given their written informed consent, thirty-seven healthy women were screened. Among these thirty-seven screened participants, fifteen were not eligible (eight, because water intake did not match with protocol requirements; seven, due to other reasons, for example urinary tract infection, positive drug screening), two were enrolled as backup participants (and were finally not included) and twenty subjects (mean age 25 (se 0·78) years; mean BMI 22 (sd 2·5) kg/m2) participated finally in the study. Their daily water intake varied from 2 to 2·84 litres as assessed by the computerised Neometis®-24WQ-Waters questionnaire (http://www.mxs.fr) which the volunteers completed on three consecutive days. The subjects were determined to be healthy as established by medical, clinical and laboratory examinations. All smoked less than five cigarettes per d and typically consumed moderate levels of alcohol ( ≤ 20 g/d) and caffeine-containing beverages ( ≤ 250 mg/d). Only subjects with an oral contraceptive treatment (monophasic oral contraceptive pills and outside the period of menstruation during the study periods) were included. They were also asked to refrain from consuming xanthine-containing beverages, and to refrain from intensive physical exercise during the study conduct (from the screening visit until the end of the study visit). Smoking, alcohol or caffeine consumption was not permitted during the study periods. Subjects were excluded from the study if they used any medications within 2 weeks before inclusion or if they presented with any sleep-disrupting factors (e.g. shift work, recent transmeridian flight) or extreme chronotypes determined using the Morningness–Eveningness Questionnaire(Reference Horne and Ostberg11).
This was a within-subject, cross-over design study with two randomised testing sessions separated by a washout period of 10–30 d. Each experimental period lasted 1·5 d (starting from the evening of day 0), during which the subjects were asked to stay at the study centre. They were also required to sleep 8 h per night (lights off at 23.00 hours–lights on at 07.00 hours). For one session (FD condition), total FD of the subjects was required. They were not allowed to drink starting at 19.00 hours on day 0 (after a final natural mineral water intake of 2 × 250 ml) until the end of the evaluation at about 18.00 hours of day 1. Thereafter, they could drink ad libitum. The other session was a control condition during which mineral water consumption was standardised (i.e. 500 ml at meal time points and 250 ml at snack and hydration time points) to achieve a total daily intake of 2 litres on day 1, provided as indicated in Fig. 1. Each glass of water had to be consumed in less than 5 min. Activities during the two test sessions were identical and included various self-rating scales for the evaluation of mood and several subjective feelings (Fig. 1). Cognitive performance (attention, vigilance, verbal learning and memory, assessed by the Psychomotor Vigilance Test, by a driving simulator and the Mackworth Clock test, and by the Rey Auditory Verbal Learning Test, respectively) was also evaluated, but these data will be presented in a separate paper. Meals were standardised to limit their water content (about 50 g/d) and taken at fixed times (Fig. 1). Safety was assessed by regular monitoring of vital signs (blood pressure and heart rate, orthostatic hypotension) and continuous monitoring and recording of any adverse events (AE). Hydration status was assessed by recording a variety of physiological parameters (urine, blood and saliva, as detailed below).
Study design. Note: water intake was only allowed during the control period. Mealtimes were as follows: 07·00 hours for breakfast, 09·45 hours and 15·45 hours for snacks and 12·00–13·30 hours for lunch. RAVLT, Rey Auditory Verbal Learning Test; PVT, Psychomotor Vigilance Test; VAS, visual analogue scales; B&L VAS, Bond and Lader VAS; sVAS: sensation VAS; eVAS: emotional VAS; POMS: Profile of Mood States; KSS, Karolinska sleepiness scale; VS, vital signs.

Subjective mood and feelings
A variety of validated self-rating scales were used including the Profile of Mood States (POMS)(Reference McNair, Lorr and Droppleman12), the Bond and Lader(Reference Bond and Lader13) visual analogue scales (VAS) and the emotional VAS (adapted from Lees & Lloyd-Williams(Reference Lees and Lloyd-Williams14)), which consist of one 100 mm line with a sad smiley and a happy smiley face at each extreme. The sensation VAS was used to rate thirst and headache(Reference Rolls, Wood and Rolls15). Sleepiness and sleep were assessed with the Karolinska sleepiness scale(Reference Akerstedt and Gillberg16) and the sleep VAS (performed within 30 min after awakening), respectively, which were analysed to derive four factors: sleep onset; sleep quality; ease of awakening; awakening behaviour(Reference Parrot and Hindmarch17). A French translation was employed for these scales.
Physiological assessments of hydration status
Urine parameters
Urine was collected from day 0 after dinner until the end of the assessments that were conducted on day 1 (18.00 hours). The following three urine parameters were recorded at each void:
(1) Urine specific gravity (USG) measured with the digital USG ‘pen’ refractometer, Pen-Urine SG (Atago Co. Limited) at a temperature between 10 and 40°C and using a urine volume (Uvol) of 0·3 ml.
(2) Coloration using the urine colour (Ucol) scale with the lightest colour scored as 0 and the darkest colour scored as 8, as described previously(Reference Armstrong, Maresh and Castellani18, Reference Armstrong, Soto and Hacker19).
(3) Uvol (total and for each void).
Plasma osmolality
Venous blood samples (5 ml) were collected into non-heparinised tubes and held at room temperature for at least 30 min. Then, each sample was centrifuged (2500 rpm, 4°C, × 10 min) to separate out plasma. All samples were immediately stored at − 20°C until analysis.
Saliva osmolality
Unstimulated saliva samples ( ≥ 200 μl) were collected according to a standard method(Reference Walsh, Laing and Oliver20). Briefly, a polyester insert form (‘Salivette’; Sarstedt) was placed under the tongue for 2 min. Then, the insert form was returned to its container, which was immediately centrifuged (3000 g× 5 min, room temperature). The Salivette tube was weighed before and after each saliva collection, and saliva weight was recorded before immediate storage at − 80°C until analysis.
Statistical analyses
All data are presented as means with their standard errors. ANOVA were conducted on data from subjective scales and urine parameters, when means appeared to be clinically different between the two experimental conditions for at least one time point. According to Nyenhuis et al. (Reference Nyenhuis, Yamamoto and Luchetta21), means were considered as clinically different when they differed by more than 1·5 standard errors. The ANOVA model included fluid condition, time (except for sleep VAS) and sequence as fixed effects, with the interaction between condition and time (except for sleep VAS). Subjects within the sequence of testing were considered a random effect. If a significant condition effect was observed, contrast analyses were performed. Physiological blood and saliva parameters were analysed in the same manner using ANCOVA, with baseline values as a covariate. Results are presented as estimates, 95 % CI and P values (statistical level of significance at P< 0·05, two-tailed).
Attention was focused on the influence of the transition from dehydration to acute rehydration by comparing the scores on the mood scales conducted within 5 min after ad libitum water intake at the end of the FD period v. the scores at 16·00 hours on day 1.
Results
Subjects
All the twenty subjects randomised were included in the safety analyses. Only one was excluded from the subjective mood analyses because of many missing or inoperable values.
Physiological parameters of hydration status
Urine parameters
Mean values for the three urine parameters were comparable across the experimental conditions on day 0. When the hydration cut-off values for USG and Ucol established for athletes were used, individual USG ( < 1·02) and Ucol scores ( < 4) indicated that subjects started the sessions in a well-hydrated state for both conditions(Reference Armstrong, Maresh and Castellani18, Reference Armstrong, Soto and Hacker19, Reference Sawka, Burke and Eichner22). However, clinically and statistically significant mean differences in the three parameters were observed between the experimental conditions on day 1. These between-group differences were due to a progressive increase in urine concentration during the 24 h FD period as demonstrated by progressively increasing USG over the course of day 1. In the control condition, USG was lower for the time frames 09·00–12·00, 12·00–15·00 and 15·00–18·00 hours compared with the first morning sampling (6·00–9·00 hours) (P< 0·001; Fig. 2(a)). In a similar manner, individual Ucol were higher during the FD period (5–7) compared with the control (1–5) (Fig. 2(b)). In addition, total Uvol collected on day 1 dramatically decreased in the FD condition (529·8 (sd 37·4) ml) compared with the control condition (1717·1 (sd 68·9) ml), resulting in a significant difference ( − 1137·8 ml, 95 % CI − 1335·91, − 939·691, P< 0·001).
Effects of the progressive acute water restriction on urinary parameters: (a) urine specific gravity (USG) and (b) urine colour (Ucol). Values are means for each experimental condition and for differences between the two conditions, with standard errors represented by vertical bars. *** Mean values were significantly different between the two experimental conditions at the corresponding time point (P< 0·001; ANCOVA). □, Control; ![]() , fluid deprivation; ▲, fluid deprivation minus control.
, fluid deprivation; ▲, fluid deprivation minus control.

Plasma osmolality
Although few individual plasma osmolality values were outside the normal range (N= 280–300 mOsm/kg), in both experimental conditions, none was considered to be clinically abnormal. Clinically relevant differences could be observed between the two experimental conditions only at the last measure (day 1) but did not reach statistical significance (Table 1).
Effects of fluid deprivation (FD condition) compared with controlled water intake (CTRL condition) on saliva osmolality, blood osmolality and heart rate* (Mean values, standard errors and 95 % confidence intervals)

bpm, Beats per min.
* Statistical comparisons were performed using ANOVA or ANCOVA.
† Analyses done on changes from baseline for heart rate; baseline corresponds to measures on day 1 before water intake and dinner.
‡ Baseline corresponds to measures on day 0 before water intake and dinner.
Saliva osmolality
In spite of large inter-subject variability, significant differences could be observed between the two experimental conditions at the last measure (see Table 1).
Safety parameters
No subject was withdrawn due to an AE. AE were more frequently reported under the FD condition (n 13) compared with the control condition (n 4). The most frequent AE were vagal malaise (a vasovagal response), headache and asthenia (weakness), of mild to moderate intensity; all recovered spontaneously or after appropriate treatment (i.e. paracetamol (paralyoc) in sublingual administration form). It should be noted that one subject was excluded from statistical analysis because a vagal malaise followed by a headache led to many missing and inoperable data.
There were no abnormal clinical findings in vital signs. No clinically significant differences were reported between the two fluid conditions for blood pressure measures. However, heart rate values expressed as changes from baseline were higher in the FD condition compared with the control condition at all time points (Table 1).
Scales and questionnaires
No clinical significant differences were observed for the sleep parameters (sleep VAS), for the headache-like symptoms (sensation headache VAS) or for anger/hostility and depression/dejection measured by the POMS.
Clinically significant differences between the experimental conditions were observed for the remaining parameters; statistical tests were conducted on these variables and the results are reported below and detailed in Table 2.
Results of the mood questionnaires assessed during the fluid deprivation (FD) condition and the controlled water intake condition (CC)*(Mean values with their standard errors)
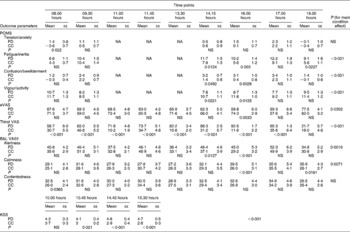
POMS, Profile of Mood States; NA, not available; VAS, visual analogue scale; eVAS, emotional VAS; B&L VAS, Bond and Lader VAS; KSS, Karolinska sleepiness scale.
* Statistical comparisons were performed using ANOVA.
† An increase in Bond & Lader VAS scores corresponds to mood lowering and a decrease in scores corresponds to mood improvement.
Subjective thirst
Thirst perception increased over the course of the FD condition. The subjects felt significantly more thirsty throughout the FD period compared with the control condition (46·8903, 95 % CI 43·384, 50·396, P< 0·001; Fig. 3).
Subjective sleep/wake parameters
A main time effect was observed for two POMS subscales (fatigue/inertia, P< 0·001 and vigour/activity, P< 0·01) and for the Bond and Lader alertness subscale (P< 0·01), but not for the Karolinska sleepiness scale. Contrast analyses are detailed in Table 2. Generally, higher sleepiness scores and lower alertness scores were observed at all time points, but these differences were only significant from 14·15 to 16·00 hours.
Other subjective mood aspects
No main condition effect was observed for the Bond and Lader contentedness subscore (1·7359, 95 % CI − 0·379, 3·851, P= 0·1072), and only a trend towards an increase in the POMS tension/anxiety score was observed (0·6798, 95 % CI − 0·044, 1·403, P= 0·0653). Significant contrast analyses are summarised in Table 2. The earliest parameter to be significantly altered by FD was confusion/bewilderment with higher scores at 14·15 hours (1·7895, 95 % CI 0·006, 3·573, P< 0·05) and 16·00 hours (2·7368, 95 % CI 0·953, 4·521, P< 0·01), whereas lower emotional VAS scores ( − 14·5158, 95 % CI − 24·178, − 4·854, P< 0·01) and higher calmness scores (13·4842, 95 % CI 5·535, 21·433, P< 0·001) were statistically significant only at 16·00 hours.
Rehydration effects on subjective physiological and mood parameters
Ad libitum water intake at the end of the progressive dehydration period (i.e. at 18·00 hours) reversed dehydration-induced decreases in happiness (emotional VAS) and alertness (Bond and Lader VAS), and reversed the confusion/bewilderment (POMS) increase as indicated by the significant differences at 18·00 v. 16·00 hours observed in the FD condition (18·44, 95 % CI 8·635, 28·243, P< 0·001; − 10·867, 95 % CI − 19·908, − 1·827, P< 0·05; − 1·868, 95 % CI − 3·679, − 0·057, P< 0·05, for emotional VAS, alertness and confusion/bewilderment, respectively).
As expected, thirst feeling was reversed by ad libitum water intake at the end of the progressive acute dehydration period (18·00 v. 16·00 hours in the FD condition: − 70·918, 95 % CI 81·479, − 60·358, P< 0·001; Fig. 3).
Effects of the progressive acute water restriction on subjective thirst sensation (visual analogue scale). Values are means for each experimental condition and for differences between the two conditions, with standard errors represented by vertical bars. The time point 18.00 hours corresponds to ad libitum water intake in both conditions. *** Mean values were significantly different between the two experimental conditions at the corresponding time point (P< 0·001; ANCOVA). ![]() , Control condition;
, Control condition; ![]() , fluid deprivation;
, fluid deprivation; ![]() , fluid deprivation minus control.
, fluid deprivation minus control.

Interestingly, ad libitum water intake was not sufficient to reverse the deleterious effects of progressive acute dehydration on vigour, fatigue (POMS subscales) and calmness (Bond and Lader VAS) as indicated by the absence of significant differences at 18·00 v. 16·00 hours observed in the FD condition (0·78, 95 % CI − 1·687, 3·246, P= 0·53; − 1·274, 95 % CI − 4·364, 1·816, P= 0·42; − 3·962, 95 % CI − 12·027, 4·104, P= 0·33, for vigour/activity, fatigue/inertia and calmness, respectively).
Discussion
The present study investigated the effects of FD on subjective mental state while assessing physiological measures of dehydration in healthy young women under basal activity conditions. The FD condition was conducted in a well-controlled manner as demonstrated by the significant reduction of Uvol and the significant increase of perceived thirst.
With respect to mood state, the earliest and the most important effects of FD concerned sleep/wake parameters including increased sleepiness and fatigue, lower levels of vigour/activity and alertness and increased confusion. Interestingly, these effects appear time- and hydration-dependent with higher levels of impairments in the first part of the afternoon (14·00–16·00 hours). There was also some evidence of later changes in calmness and happiness but at an isolated time point only (16·00 hours). The lack of significant differences between the groups on these mood parameters at 17·00 hours is related to worsening of the scores in the control condition at this time and not to an improvement under the FD condition (see Table 2). This worsening might be due to the fact that ratings were performed after completion of a sustained cognitive task. A possible confounding effect of cognitive load on mood is beyond the objectives of the present study and will be further studied elsewhere. These results confirm those described previously in two published studies(Reference Shirreffs, Merson and Fraser7, Reference Szinnai, Schachinger and Arnaud8). However, the latter suffered from several limitations with respect to attributing the observed effects to dehydration: (1) energy intake was not standardised; (2) exact amount of fluid intake was not controlled during the control periods; (3) caffeine-containing beverages were not forbidden during the control periods, although caffeine is known to affect cognition, mood and physiological parameters. In the present study of pure water deprivation, confounding factors, including sleep quality and quantity, caffeine and alcohol consumption, energy intake, likely to interfere with the study purposes were strictly controlled.
Mood was also assessed at the end of the afternoon (about 18·00 hours) within 5 min after ad libitum fluid intake in both conditions. In these conditions, deleterious effects of FD on alertness, happiness and confusion were immediately reversed by drinking, but the women did not feel improvement in fatigue, vigour and calmness. One may argue that the time interval between ad libitum water intake and mood assessments was too short to affect vigour, fatigue and calmness. In this respect, it was found that ingested water is rapidly detected in plasma and blood cells (within 5 min) and reached a peak at 20 min on average (with large inter-subject variability) but about 75 min are needed for the complete absorption of 300 ml of plain water(Reference Péronnet, Mignault and du Souich23). In the present study, the mean volume of water ingested after FD was about 526 ml, i.e. twice the mean volume when not previously water deprived, thus it is likely that about 130 min are needed for its complete absorption. In a previous study, using a longer time interval (20 min) between water intake following a FD period and mood assessments in young healthy subjects under resting conditions(Reference Neave, Scholey and Emmett24), an improvement of alertness but no improvements of calmness and contentedness were reported. Another study was conducted in children to assess the effects of ad libitum water intake on cognition and happiness(Reference Edmonds and Jeffes25). After baseline measurements, children were divided into two groups: one could drink water ad libitum, whereas the other one had no access to water. Cognition and happiness were reassessed in both groups, 45 min after the drink in the ‘water group’. The results showed that water intake had beneficial effects on happiness ratings. No other mood feelings were assessed in the present study. So, the present results are in agreement with those reported in these two previous studies in spite of different methodological conditions: controlled amount of water intake in the first study; shorter period of FD in the first study (about 11 v. 23 h in the present study) and very short period of FD in the children study (90–120 min); longer delay between fluid intake and mood evaluations (20 and 45 v. 5 min in the present study); different baseline for comparisons of rehydration scores (baseline values recorded in the morning following an overnight fast in the study by Neave et al. (Reference Neave, Scholey and Emmett24)v. comparisons with data recorded at the end of the afternoon, at a time where mood scores are significantly different between the groups in the present study). Overall, the present study shows that FD has prolonged deleterious effects on several mood aspects that are not systematically and/or rapidly reversed by ad libitum fluid intake.
Overall, the 24 h FD period was well tolerated with few AE. No clinically significant abnormalities of vital signs were observed, although heart rate was higher throughout the FD period. One may explain this increase in heart rate by the fact that FD led probably to a little blood volume decrease. This slight change in homeostasis was then balanced by an increase in heart rate in order to compensate the effect of blood volume fluctuation(Reference Popkin, D'Anci and Rosenberg26). Headache was reported as an AE only in two subjects and subjective rating of headaches at different times did not reveal any significant differences between the two periods. These results are in contrast with increased rating of headaches reported in young subjects after 15 h of fluid restriction followed by exercise(Reference Patel, Mihalik and Notebaert27) or 24 h of fluid restriction(Reference Shirreffs, Merson and Fraser7). However, it cannot be excluded that exercise in the former study and possible caffeine-withdrawal effects during the FD period in the latter might be responsible for higher headache scores.
Although urine parameters (USG, Ucol and Uvol) have been shown to be valid markers of hydration status in athletes or military personnel in extreme conditions of acute dehydration(Reference Armstrong5), limited data are available on hydration status of healthy sedentary individuals. The statistical differences in these parameters between experimental conditions suggest that these urine parameters are a valid measure of hydration status in healthy young women engaged in minimal physical activity. A recent study attempted to determine reference values for euhydration and various levels of dehydration in free-living conditions by the repeated assessment of hydration state over 12 d in fifty-nine healthy young men(Reference Armstrong, Pumerantz and Fiala4). The authors have suggested that normally active subjects should be considered dehydrated when 24 h values of USG and Ucol are above 1·2 and 5, respectively, and Uvol is below 1·525 litres. The present results in the 24 h FD condition are in agreement with these values. Despite its obvious interest because of its non-invasive character, the usefulness of saliva osmolality to assess hydration status in normal conditions has rarely been studied before(Reference Cheuvront, Ely and Kenefick28). The present results show that dehydration occurring after 24 h of FD is detected by significant saliva osmolality increases, as is the case for dehydration induced by heat/exercise(Reference Walsh, Laing and Oliver20, Reference Oliver, Laing and Wilson29, Reference Taylor, van der Heuvel and Kerry30, Reference Ely, Cheuvront and Kenefick31). Finally, plasma osmolality remained within a normal variability interval and did not return to the control level immediately after ad libitum water intake. These observations corroborate Armstrong's observations that plasma osmolality did not respond rapidly to changes in hydration status and have substantial inter-subject variability(Reference Armstrong5). Thus, lack of water intake for 24 h did not prevent physiological compensation by the kidney, including urine concentration (decreased volume associated with increased gravity and darker urine colour), to maintain blood homeostasis.
Study limits
Even if the present study's protocol was well controlled, some limitations should be acknowledged. Regarding the physiological markers, urine osmolality was not measured. Also, the level of dehydration was not expressed by changes in body weight, making a precise comparison of the present data with other dehydration protocols difficult. However, before the study, the assumption was made that body weight might change over a 24 h period due to factors other than dehydration (e.g. food intake) or water loss. Moreover, body mass changes are frequently used to quantify rapid body water loss related to intensive exercise over a short period. Our experimental conditions were quite different: no exercise but total water restriction for 24 h with minimal basal activity and minimal sweat loss; consequently, the present results cannot be directly compared with these previous studies.
Another point of concern is the measure of heart rate, which was not assessed after ad libitum water intake. Regarding the heart rate increase observed in the present study, it would be interesting in future research to verify how much time it needs to normalise after ad libitum water intake. Regarding the mood parameters, another limitation of the present study is that treatment condition was not blinded. Therefore, the participant's expectations may have affected the mood assessments. Even if it seems difficult to refute such a supposition, recent data showed that similar mood impairments were obtained in females in a double-blind dehydration protocol(Reference Armstrong, Ganio and Casa32).
Conclusions and recommendations for future research
This is the first study to investigate the effects of mild dehydration induced by strict water deprivation for 24 h under basal environmental conditions on a variety of subjective feelings. Progressive negative effects of mild dehydration on confusion, alertness, vigour and fatigue were evident. Interestingly, only confusion and alertness, but not vigour and fatigue, were improved immediately after ad libitum water intake. Future investigations should extend these results by comparing mood parameters at different times after rehydration. Also, the present study underlines the importance of controlling environmental and individual factors, and to have the subjects in a comparable hydrated state when assessing mood in clinical settings.
With respect to physiological parameters in the blood, saliva and urine, USG appears as the most reliable marker to monitor mild dehydration in the present study conditions. Saliva osmolality could be another useful marker of hydration; further studies should be undertaken to confirm these findings.
Acknowledgements
This study was supported by Danone Research, Palaiseau, France. F. S. is the principal investigator of the study and supervised the trial. N. G. was involved in designing the statistical plan and performed the data analyses. N. P., R. B., L. L. B., E. C. and A. K. participated in designing and writing the trial protocol. A. D. and N. P. were involved in writing the manuscript. All the authors participated in the revision of the manuscript. Conflict of interest: L. L. B., A. K. and E. C. are employed by Danone Research, France, a division of Danone, a company which has commercial interest in mineral water. The other authors are employed by Forenap, the contract research organisation where the study was conducted, and have no personal or financial conflict of interest in relation to the present study.


 Open access