


1. Introduction
The solidification of water droplets holds substantial importance in various fields, including the food industry (George Reference George1993; James, Purnell & James Reference James, Purnell and James2015), energy storage (Sharma et al. Reference Sharma, Parth, Shobhana, Bobin and Hardik2022) and freeze-drying processes (Franks Reference Franks1998; Assegehegn et al. Reference Assegehegn, Brito-de la Fuente, Franco and Gallegos2019). However, in applications such as aircraft operation (Gent, Dart & Cansdale Reference Gent, Dart and Cansdale2000; Cao et al. Reference Cao, Wu, Su and Xu2015, Reference Cao, Tan and Wu2018), marine vessels (Zhou, Liu & Yi Reference Zhou, Liu and Yi2022), food storage facilities (Zhu, Zhang & Sun Reference Zhu, Zhang and Sun2021) and wind energy generation (Fakorede et al. Reference Fakorede, Feger, Ibrahim, Ilinca, Perron and Masson2016; Kraj & Bibeau Reference Kraj and Bibeau2010), the solidification of water droplets can yield negative consequences.
The freezing process of a sessile droplet on a cold substrate unfolds in two discernible phases. During the early recalescence phase, an ice-crystal scaffold is rapidly formed, accompanied by a rise in temperature within the remaining liquid (Hu & Jin Reference Hu and Jin2010; Jung, Tiwari & Poulikakos Reference Jung, Tiwari and Poulikakos2012). This phase is characterised by the release of energy as liquid transitions into ice, leading to a temperature increase. A slower second phase ensues after the recalescence phase, solidifying the remaining liquid through isothermal freezing. As this occurs, additional heat is released as the freezing front advances towards the apex of the droplet. The vapour condenses on the substrate around the droplet, forming frost halos (Jung et al. Reference Jung, Tiwari and Poulikakos2012; Kavuri et al. Reference Kavuri, Karapetsas, Sharma and Sahu2023). Numerous researchers have investigated the freezing of stationary water drops and uncovered intriguing physics, such as freezing front propagation, cusp formation, volume expansion and frost halo formation (Angell Reference Angell1983; Anderson, Worster & Davis Reference Anderson, Worster and Davis1996; Ajaev & Davis Reference Ajaev and Davis2004; Hu & Jin Reference Hu and Jin2010; Marin et al. Reference Marin, Enriquez, Brunet, Colinet and Snoeijer2014; Tembely & Dolatabadi Reference Tembely and Dolatabadi2019). The evolution of the water–ice freezing front, including its behaviour in the recalescence phase, was examined by Meng & Zhang (Reference Meng and Zhang2020) theoretically. Nauenberg (Reference Nauenberg2016) and Zhang et al. (Reference Zhang, Zhao, Lv and Yang2016) studied the evolution of the freezing front during the freezing of a sessile water drop on different surfaces through theory and experiments. Zhang et al. (Reference Zhang, Liu, Wu and Min2018b, Reference Zhang, Liu, Min and Wu2019) conducted experiments to investigate the volume expansion and shape variations of various volumes of freezing water drops on hydrophilic and hydrophobic surfaces and compared these findings with a numerical model they developed. Marin et al. (Reference Marin, Enriquez, Brunet, Colinet and Snoeijer2014) explored the universality of tip singularity for a droplet deposited on a cold substrate. In contrast, Starostin et al. (Reference Starostin, Strelnikov, Dombrovsky, Shoval, Gendelman and Bormashenko2022, Reference Starostin, Strelnikov, Dombrovsky, Shoval, Gendelman and Bormashenko2023) investigated the freezing of water drops on metallic surfaces and surfaces lubricated with silicone oil, including analysis of the effect of asymmetric cooling of sessile droplets on the orientation of the freezing tip. Other studies also focused on the effect of surface roughness (Fuller, Kant & Pitchumani Reference Fuller, Kant and Pitchumani2024), curvature (Jin, Zhang & Yang Reference Jin, Zhang and Yang2017; Liu et al. Reference Liu, Min, Zhang, Hu and Wu2021; Ju et al. Reference Ju, Jin, Zhang, Yang and Zhang2018; Zhang et al. Reference Zhang, Jin, Jiao and Yang2018a) and wettability (Pan et al. Reference Pan, Shi, Duan and Naterer2019; Peng et al. Reference Peng, Wang, Wang, Li, Xia, Du, Zheng, Zhou and Ye2020) on the freezing of the drops. Many studies also focused on the freezing delay phenomenon (Jung et al. Reference Jung, Dorrestijn, Raps, Das, Megaridis and Poulikakos2011; Boinovich et al. Reference Boinovich, Emelyanenko, Korolev and Pashinin2014; Hao, Lv & Zhang Reference Hao, Lv and Zhang2014; Guo, Zhang & Hu Reference Guo, Zhang and Hu2021; Shi & Duan Reference Shi and Duan2022) of the sessile water droplets as it helps in designing better ice-phobic surfaces.
Additionally, several researchers have explored the freezing dynamics of sessile droplets using various numerical simulation techniques. These include approaches based on Navier–Stokes equations with front-tracking (Vu et al. Reference Vu, Tryggvason, Homma and Wells2015, Reference Vu, Dao and Pham2018), level-set and volume-of-fluid (Blake et al. Reference Blake, Thompson, Raps and Strobl2015; Tembely, Attarzadeh & Dolatabadi Reference Tembely, Attarzadeh and Dolatabadi2018) and lattice Boltzmann methods (Pérez et al. Reference Pérez, Leclaire, Ammar, Trépanier, Reggio and Benmeddour2021; Wang et al. Reference Wang, Xu, Zhang, Zheng, Hao, He and Zhang2022). Zadražil et al. (Reference Zadražil, Stepanek and Matar2006) and Tembely & Dolatabadi (Reference Tembely and Dolatabadi2019) employed the lubrication approximation method, which resolved shear stress singularities at the solid–liquid interface using a precursor layer, to investigate the freezing of sessile drops. Sebilleau et al. (Reference Sebilleau, Ablonet, Tordjeman and Legendre2021) conducted experimental and theoretical studies on the influence of humidity on freezing fronts and cusp formation. In contrast to earlier numerical studies that frequently disregarded evaporation, our prior research focusing on the freezing of sessile droplets and the formation of frost halos, employing the lubrication approximation, examined the influence of evaporation on these phenomena (Kavuri et al. Reference Kavuri, Karapetsas, Sharma and Sahu2023). Our findings reveal a direct association between the formation of frost halos and the inherent evaporation process during the early stages of freezing.
While all the studies mentioned above concentrated on the freezing dynamics of individual drops on a surface, realistic scenarios typically involve multiple drops in close proximity. In such situations, these drops can undergo freezing and dynamically interact with one another during the process. The droplet interaction during the freezing process is caused by significant vapourisation effects, leading to different frost propagation mechanisms. Yancheshme, Momen & Aminabadi (Reference Yancheshme, Momen and Aminabadi2020) suggest four different mechanisms for frost propagation: ice-bridge formation, cascade freezing, frost halos and droplet explosion. Graeber et al. (Reference Graeber, Dolder, Schutzius and Poulikakos2018) found that multiple droplets interact with each other through strong vapourisation, and this vapour front leads to cascade freezing. Nath, Ahmadi & Boreyko (Reference Nath, Ahmadi and Boreyko2017) discuss frost halos, inter-droplet bridging and dry zones occurring during condensation frosting. Castillo et al. (Reference Castillo, Huang, Pan and Weibel2021) found that the droplet–droplet interactions lead to asymmetric solidification. For volatile fluids, the interaction through vapourisation is much more significant. Moosman & Homsy (Reference Moosman and Homsy1980); Ajaev & Homsy (Reference Ajaev and Homsy2001); Craster, Matar & Sefiane (Reference Craster, Matar and Sefiane2009); Karapetsas, Sahu & Matar (Reference Karapetsas, Sahu and Matar2016); Williams et al. (Reference Williams, Karapetsas, Mamalis, Sefiane, Matar and Valluri2021) explored the evaporation of sessile drops on a hot substrate using the lubrication approach. The spreading of a sessile drop due to Marangoni flow has also been studied using lubrication theory (Karapetsas et al. Reference Karapetsas, Sahu and Matar2013, Reference Karapetsas, Sahu, Sefiane and Matar2014). Additionally, several researchers have experimentally investigated the evaporation of sessile drops (Karapetsas et al. Reference Karapetsas, Matar, Valluri and Sefiane2012; Katre et al. Reference Katre, Gurrala, Balusamy, Banerjee and Sahu2020; Hari Govindha et al. Reference Hari Govindha, Katre, Balusamy, Banerjee and Sahu2022, Reference Hari Govindha, Balusamy, Banerjee and Sahu2024; Karapetsas et al. Reference Karapetsas, Matar, Valluri and Sefiane2012). Sadafi et al. (Reference Sadafi, Dehaeck, Rednikov and Colinet2019) and Wen et al. (Reference Wen, Kim, Shi, Wang, Man, Doi and Russell2019) conducted experimental studies on the evaporation-driven coalescence of single-component volatile droplets on high-energy substrates at room temperature and ambient humidity. Similar behaviours were observed across various organic fluids, including n-hexane, n-pentane, cyclohexane, ethyl acetate, HFE7000, HFE7100, HFE7200 and polypropylene glycol (Man & Doi Reference Man and Doi2017; Sadafi et al. Reference Sadafi, Dehaeck, Rednikov and Colinet2019; Wen et al. Reference Wen, Kim, Shi, Wang, Man, Doi and Russell2019). In addition, Man & Doi (Reference Man and Doi2017) investigated the theoretical aspects of attraction, repulsion and chasing behaviours of evaporating droplets, demonstrating that droplet motion can result from asymmetries in the evaporation flux, even in the absence of the Marangoni effect. In contrast to these single-component systems, the behaviour of binary droplets (Cira, Benusiglio & Prakash Reference Cira, Benusiglio and Prakash2015; Man & Doi Reference Man and Doi2017) is influenced by the Marangoni effect, leading to more complex interactions driven by differences in evaporation rates and surface tensions of the components. Furthermore, Sadafi et al. (Reference Sadafi, Dehaeck, Rednikov and Colinet2019) found that single-component volatile droplets can coalesce due to substrate-mediated forces, thermal Marangoni forces and evaporation-induced effects. A similar study, albeit for droplets on soft substrates, has been recently presented by Malachtari & Karapetsas (Reference Malachtari and Karapetsas2024), where it was shown that, in addition to the thermal Marangoni and evaporation-induced effects, the droplets might also interact through the deforming elastic substrate.
Due to its practical relevance, the interaction of sessile droplets, even in the absence of evaporation and freezing, has been extensively studied by several researchers (Kapur & Gaskell Reference Kapur and Gaskell2007; Paulsen, Burton & Nagel Reference Paulsen, Burton and Nagel2011; Hernández-Sánchez et al. Reference Hernández-Sánchez, Lubbers, Eddi and Snoeijer2012; Eddi, Winkels & Snoeijer Reference Eddi, Winkels and Snoeijer2013; Sui et al. Reference Sui, Maglio, Spelt, Legendre and Ding2013; Xia, He & Zhang Reference Xia, He and Zhang2019; Varma, Saha & Kumar Reference Varma, Saha and Kumar2021). Additionally, investigations into the coalescence of drops on a substrate and the coalescence of volatile drops at room temperatures have been conducted (Sadafi et al. Reference Sadafi, Dehaeck, Rednikov and Colinet2019; Malachtari & Karapetsas Reference Malachtari and Karapetsas2024). However, despite experimental studies on the freezing of multiple drops (Jung et al. Reference Jung, Tiwari and Poulikakos2012; Graeber et al. Reference Graeber, Dolder, Schutzius and Poulikakos2018; Yancheshme et al. Reference Yancheshme, Momen and Aminabadi2020; Castillo et al. Reference Castillo, Huang, Pan and Weibel2021), the freezing behaviour of volatile drops has not been theoretically explored.
To the best of our knowledge, the present study is the first attempt to theoretically explore the interaction between two volatile drops undergoing freezing, employing the lubrication approximation while considering evaporation and condensation. Our findings suggest that when the freezing front propagation exhibits limited advancement and fails to restrict the contact line of the drops, rapid coalescence occurs between the two volatile sessile drops closely placed on a substrate. We explore the coalescence mechanism of volatile drops undergoing freezing and also study the effect of relative humidity and the initial separation between the two drops on the coalescence dynamics.
The remainder of this paper is structured as follows. In § 2, we present the problem formulation, governing equations, scaling considerations and the numerical approach used within the framework of the lubrication approximation. The results are discussed in § 3. It also presents the coalescence mechanism of volatile drops undergoing freezing, accompanied by an extensive parametric study. Finally, concluding remarks are provided in § 4.
2. Problem formulation
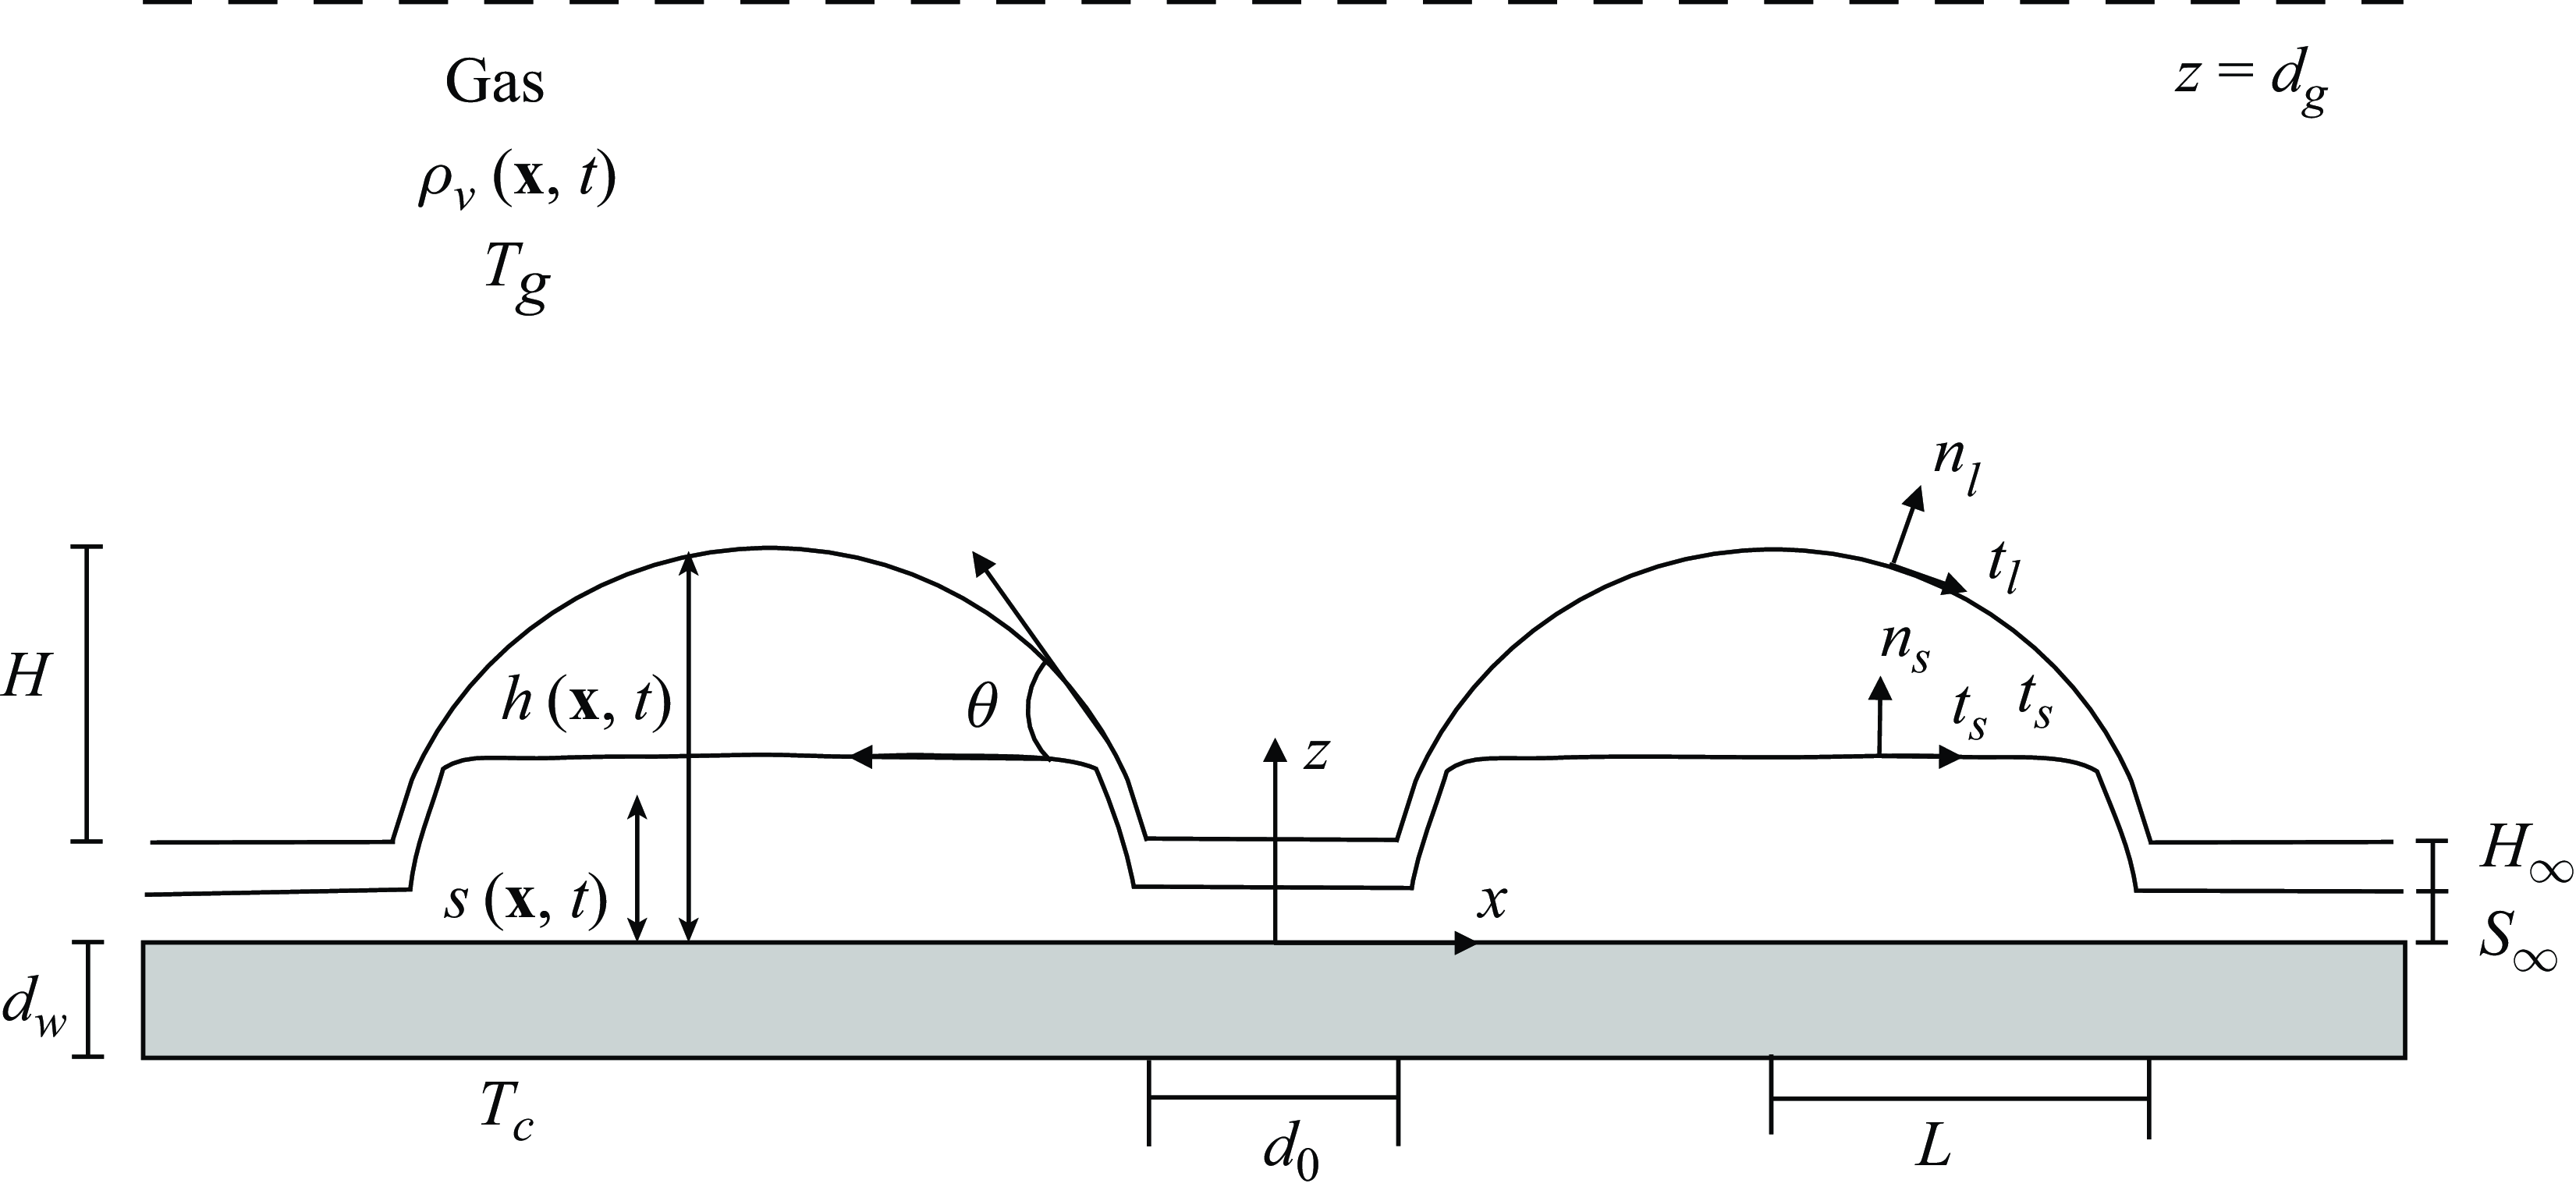
The freezing process of two thin sessile liquid droplets separated by an initial distance of $d_0$
placed on a cold, horizontal solid substrate is investigated numerically using the lubrication approximation. Figure 1 depicts a schematic diagram of two droplets separated by an initial distance
$d_0$
placed on a cold, horizontal solid substrate is investigated numerically using the lubrication approximation. Figure 1 depicts a schematic diagram of two droplets separated by an initial distance $d_0$
, during freezing, along with various parameters used in our modelling. The bottom of the substrate with thickness
$d_0$
, during freezing, along with various parameters used in our modelling. The bottom of the substrate with thickness $(d_w)$
, thermal conductivity
$(d_w)$
, thermal conductivity $(\lambda _w)$
and specific heat
$(\lambda _w)$
and specific heat $(C_{pw})$
is maintained at a constant temperature,
$(C_{pw})$
is maintained at a constant temperature, $T_c$
. We assume that at
$T_c$
. We assume that at $t=0$
, the early recalescence phase has already taken place with the liquid having reached the melting temperature. At this point, the slower solidification step driven by the heat conduction ensues and a very thin layer of ice of uniform thickness,
$t=0$
, the early recalescence phase has already taken place with the liquid having reached the melting temperature. At this point, the slower solidification step driven by the heat conduction ensues and a very thin layer of ice of uniform thickness, $S_\infty$
, has formed along the solid substrate. The height and half-width of the droplets are denoted by
$S_\infty$
, has formed along the solid substrate. The height and half-width of the droplets are denoted by $H$
and
$H$
and $L$
, respectively. The liquid is assumed to be incompressible and Newtonian, with constant density
$L$
, respectively. The liquid is assumed to be incompressible and Newtonian, with constant density $(\rho _l)$
, specific heat capacity
$(\rho _l)$
, specific heat capacity $(C_{pl})$
, thermal conductivity
$(C_{pl})$
, thermal conductivity $(\lambda _l)$
and viscosity
$(\lambda _l)$
and viscosity $(\mu _l)$
. The surface tension of the liquid–gas interface
$(\mu _l)$
. The surface tension of the liquid–gas interface $(\gamma _{lg})$
is assumed to be constant. The frozen solid phase has constant density
$(\gamma _{lg})$
is assumed to be constant. The frozen solid phase has constant density $(\rho _s)$
, specific heat capacity
$(\rho _s)$
, specific heat capacity $(C_{ps})$
and thermal conductivity
$(C_{ps})$
and thermal conductivity $(\lambda _s)$
. The droplet is bounded from above by an inviscid gas. A Cartesian coordinate system
$(\lambda _s)$
. The droplet is bounded from above by an inviscid gas. A Cartesian coordinate system $(x,z)$
with its origin at the centre of the droplet on the solid substrate is employed in our study, as shown in figure 1. Here,
$(x,z)$
with its origin at the centre of the droplet on the solid substrate is employed in our study, as shown in figure 1. Here, $z=s(x,t)$
and
$z=s(x,t)$
and $z=h(x,t)$
represent the liquid–ice and liquid–gas interfaces, respectively. In the present work, we consider the drop to be very thin
$z=h(x,t)$
represent the liquid–ice and liquid–gas interfaces, respectively. In the present work, we consider the drop to be very thin $(H \ll L)$
. Thus, the aspect ratio of the droplet,
$(H \ll L)$
. Thus, the aspect ratio of the droplet, $\epsilon =H/L$
, is assumed to be very small. This assumption permits us to use the lubrication theory, employed below, to derive a set of evolution equations that govern the freezing dynamics of the sessile droplet considering the liquid, ice and gas phases. However, earlier studies demonstrated the validity of lubrication model for contact angles up to
$\epsilon =H/L$
, is assumed to be very small. This assumption permits us to use the lubrication theory, employed below, to derive a set of evolution equations that govern the freezing dynamics of the sessile droplet considering the liquid, ice and gas phases. However, earlier studies demonstrated the validity of lubrication model for contact angles up to $60^\circ$
(Tembely & Dolatabadi Reference Tembely and Dolatabadi2019; Charitatos & Kumar Reference Charitatos and Kumar2020).
$60^\circ$
(Tembely & Dolatabadi Reference Tembely and Dolatabadi2019; Charitatos & Kumar Reference Charitatos and Kumar2020).
2.1. Dimensional governing equations
2.1.1. Liquid phase
The dynamics in the liquid phase is governed by the mass, momentum and energy conservation equations, which are given by
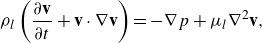 \begin{align} \rho _l \left ( \frac {\partial {\mathbf {v}}}{\partial t} + {\mathbf {v}} \cdot \nabla \mathbf {v} \right ) & = - \nabla p + \mu _l \nabla ^2 \mathbf {v},\end{align}
 \begin{align} \nabla \cdot \mathbf {v}& = 0,\end{align}
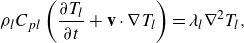 \begin{align} \rho _l C_{pl} \left ( \frac {\partial T_l}{\partial t} + \mathbf {v} \cdot \nabla T_l \right )& = \lambda _l \nabla ^2 T_l,\end{align}
where $\mathbf {v}$
,
$\mathbf {v}$
, $p$
and
$p$
and $T_l$
denote the velocity, pressure and temperature in the liquid phase, respectively;
$T_l$
denote the velocity, pressure and temperature in the liquid phase, respectively; $\nabla$
represents the gradient operator. At the free surface (
$\nabla$
represents the gradient operator. At the free surface ( $z=h(x,t)$
), the liquid velocity,
$z=h(x,t)$
), the liquid velocity, $\mathbf {v}$
, and the velocity of the liquid–gas interface,
$\mathbf {v}$
, and the velocity of the liquid–gas interface, $\mathbf {v}_{lg}$
, are related as
$\mathbf {v}_{lg}$
, are related as
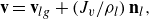 \begin{align} \mathbf {v} & = \mathbf {v}_{lg} + (J_v/\rho _l) \; \mathbf {n}_l,\end{align}
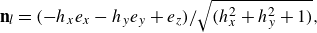 \begin{align} \mathbf {n}_l & = (-h_{x}e_x - h_{y}e_y + e_z)/\sqrt {(h_{x}^2+h_{y}^2+1)},\end{align}
where $J_v$
denotes the evaporative flux and
$J_v$
denotes the evaporative flux and $\mathbf {n}_l$
is the outward unit normal on the interface. However, the tangential components of both velocities,
$\mathbf {n}_l$
is the outward unit normal on the interface. However, the tangential components of both velocities, $\mathbf {v}_{\tau } = \mathbf {v} - (\mathbf {v} \cdot \mathbf {n}_l) \mathbf {n}_l = \mathbf {v}_{lg} -$ $(\mathbf {v}_{lg} \cdot \mathbf {n}_l) \mathbf {n}_l$
, are the same. Moreover, at
$(\mathbf {v}_{lg} \cdot \mathbf {n}_l) \mathbf {n}_l$
, are the same. Moreover, at $z=h(x,t)$
, the velocity field satisfies the local mass, force and energy balance in the liquid and gas phases (Karapetsas et al. Reference Karapetsas, Sahu and Matar2016). Thus,
$z=h(x,t)$
, the velocity field satisfies the local mass, force and energy balance in the liquid and gas phases (Karapetsas et al. Reference Karapetsas, Sahu and Matar2016). Thus,
 \begin{align} \rho _l (\mathbf {v} -\mathbf {v}_{lg}) \cdot \mathbf {n}_l & = \rho _g (\mathbf {v}_g -\mathbf {v}_{lg}) \cdot \mathbf {n}_l,\end{align}
 \begin{align} J_v (\mathbf {v} -\mathbf {v}_g) - \mathbf {n}_l \cdot \left [-p \mathbf {I} + \mu _l \left ( \nabla \mathbf {v} + \nabla \mathbf {v} ^T \right ) \right ]& = p_g \mathbf {n}_l - \gamma _{lg} \kappa _l \mathbf {n}_l - \Pi \mathbf {n}_l ,\end{align}
 \begin{align} J_v L_v + \lambda _l \nabla T_l \cdot \mathbf {n}_l - \lambda _g \nabla T_g \cdot \mathbf {n}_l & = 0,\end{align}
where $\rho _g$
,
$\rho _g$
, $\lambda _g$
,
$\lambda _g$
, $\mathbf {v}_g$
and
$\mathbf {v}_g$
and $T_g$
denote the density, thermal conductivity, velocity field and gas phase temperature, respectively. Here,
$T_g$
denote the density, thermal conductivity, velocity field and gas phase temperature, respectively. Here, $\mathbf {I}$
represents the identity tensor,
$\mathbf {I}$
represents the identity tensor, $T_{lg}$
indicates the temperature at the liquid–gas interface,
$T_{lg}$
indicates the temperature at the liquid–gas interface, $L_v$
is the specific internal latent heat of vapourisation,
$L_v$
is the specific internal latent heat of vapourisation, $\kappa _{lg} = - \nabla _{s,l} \cdot \mathbf {n}_l$
denotes the mean curvature of the free surface and
$\kappa _{lg} = - \nabla _{s,l} \cdot \mathbf {n}_l$
denotes the mean curvature of the free surface and $\nabla _{s,l} = (I-\mathbf {n}_l\mathbf {n}_l) \cdot \nabla$
represents the surface gradient operator. The disjoining pressure (
$\nabla _{s,l} = (I-\mathbf {n}_l\mathbf {n}_l) \cdot \nabla$
represents the surface gradient operator. The disjoining pressure ( $\Pi$
) that accounts for the van der Waals interaction is defined as
$\Pi$
) that accounts for the van der Waals interaction is defined as
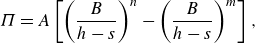 \begin{equation} \Pi = A \left [ \left ( \frac {B}{h-s} \right )^n - \left ( \frac {B}{h-s} \right )^m \right ], \end{equation}
where $A= A_{Ham}/B^n \geq 0$
is a constant that describes the magnitude of the energy of the intermolecular interactions between the liquid–gas and liquid–ice interfaces, and
$A= A_{Ham}/B^n \geq 0$
is a constant that describes the magnitude of the energy of the intermolecular interactions between the liquid–gas and liquid–ice interfaces, and $B$
denotes the precursor layer thickness. Here,
$B$
denotes the precursor layer thickness. Here, $n \gt m \gt 1$
and
$n \gt m \gt 1$
and $A_{Ham}$
denotes the dimensional Hamaker constant.
$A_{Ham}$
denotes the dimensional Hamaker constant.
Schematic representation of two sessile droplets undergoing freezing on a solid substrate. Here, $S_\infty$
,
$S_\infty$
, $H_\infty$
and
$H_\infty$
and $d_0$
are the initial thickness of microscopic ice-layer, the thickness of the precursor layer and the distance between the two drops, respectively;
$d_0$
are the initial thickness of microscopic ice-layer, the thickness of the precursor layer and the distance between the two drops, respectively; $T_{g}$
and
$T_{g}$
and $T_{c}$
are the temperatures of the ambient and the bottom of the substrate.
$T_{c}$
are the temperatures of the ambient and the bottom of the substrate.
At the liquid–ice interface $(z=s(x,t))$
, the velocity is given by
$(z=s(x,t))$
, the velocity is given by
 \begin{align} \mathbf {v}& = \mathbf {v}_{ls} - (J_s/\rho _l) \; \mathbf {n}_s,\end{align}
 \begin{align} \mathbf {n}_l& = (-s_{x}e_x - s_{y}e_y + e_z)/\sqrt {(s_{x}^2+s_{y}^2+1)},\end{align}
where $J_s$
denotes the freezing mass flux and
$J_s$
denotes the freezing mass flux and $\mathbf {v}_{ls}$
the velocity of the liquid–ice interface. As we impose the no-slip condition at the liquid–ice interface, the tangential component of the velocity is given by
$\mathbf {v}_{ls}$
the velocity of the liquid–ice interface. As we impose the no-slip condition at the liquid–ice interface, the tangential component of the velocity is given by
 \begin{equation} \mathbf {v} \cdot \mathbf {t}_s = 0. \end{equation}
Here, $\mathbf {n}_s$
and
$\mathbf {n}_s$
and $\mathbf {t}_s$
are the outward unit normal and unit tangential vectors on the liquid–ice interface, respectively.
$\mathbf {t}_s$
are the outward unit normal and unit tangential vectors on the liquid–ice interface, respectively.
2.1.2. Solid (ice) phase
The energy conservation equation in the solid (ice) phase is given by
 \begin{equation} \rho _s C_{ps} \frac {\partial T_s}{\partial t} = \lambda _s \nabla ^2 T_s, \end{equation}
where $T_s$
denotes the temperature in the solid phase.
$T_s$
denotes the temperature in the solid phase.
At the solid substrate ( $z=0$
), we impose continuity of temperature
$z=0$
), we impose continuity of temperature
 \begin{equation} T_s = T_w, \end{equation}
where $T_w$
is the temperature of the substrate at
$T_w$
is the temperature of the substrate at $z=0$
.
$z=0$
.
At the freezing front ( $z=s(x,t)$
), the boundary condition for the temperature is expressed as
$z=s(x,t)$
), the boundary condition for the temperature is expressed as
 \begin{equation} T_s = T_l = T_f. \end{equation}
We also assume that equilibrium temperature at the freezing front, $T_f$
, is the same as the melting temperature,
$T_f$
, is the same as the melting temperature, $T_m$
.
$T_m$
.
At $z=s(x,t)$
, the conservation of mass and energy between the liquid and solid phases leads to
$z=s(x,t)$
, the conservation of mass and energy between the liquid and solid phases leads to
 \begin{align} J_s = \rho _l (\mathbf {v}_{ls} - \mathbf {v}) \cdot \mathbf {n}_s & = \rho _s (\mathbf {v}_{ls} - \mathbf {v}_s) \cdot \mathbf {n}_s,\end{align}
 \begin{align} \rho _s (\mathbf {v}_{ls} - \mathbf {v}_s) \cdot \mathbf {n}_s H_s - \lambda _s \nabla T_s \cdot \mathbf {n}_s & = \rho _l (\mathbf {v}_{ls} - \mathbf {v}) \cdot \mathbf {n}_s H_l - \lambda _l \nabla T_l \cdot \mathbf {n}_s,\end{align}
where $\mathbf {v}_s$
denotes the velocity of the ice phase;
$\mathbf {v}_s$
denotes the velocity of the ice phase; $H_s$
and
$H_s$
and $H_l$
denote the enthalpy of the ice and liquid, respectively. By combining (2.16) and (2.17) and assuming that
$H_l$
denote the enthalpy of the ice and liquid, respectively. By combining (2.16) and (2.17) and assuming that $\mathbf {v}_s=0$
, we get
$\mathbf {v}_s=0$
, we get
 \begin{equation} J_s \triangle H_{sl} - \lambda _s \nabla T_s \cdot \mathbf {n}_s + \lambda _l \nabla T_l \cdot \mathbf {n}_s = 0, \end{equation}
where $\triangle H_{sl} = H_s - H_l$
denotes the enthalpy jump at the liquid–ice interface. Considering that
$\triangle H_{sl} = H_s - H_l$
denotes the enthalpy jump at the liquid–ice interface. Considering that $H_s = C_{ps} (T_f - T_m) + L_f(T_m)$
and
$H_s = C_{ps} (T_f - T_m) + L_f(T_m)$
and $H_l = C_{pl} (T_f - T_m)$
, we evaluate
$H_l = C_{pl} (T_f - T_m)$
, we evaluate
 \begin{equation} \triangle H_{sl} = (C_{ps} - C_{pl}) (T_f - T_m) + L_f, \end{equation}
where $L_f$
denotes the latent heat of fusion considering the melting temperature,
$L_f$
denotes the latent heat of fusion considering the melting temperature, $T_m$
, as the reference temperature. As will be shown below, (2.18) can be used to evaluate the position of the freezing front,
$T_m$
, as the reference temperature. As will be shown below, (2.18) can be used to evaluate the position of the freezing front, $s(x,t)$
.
$s(x,t)$
.
2.1.3. Gas phase
To account for situations when a droplet freezes in an environment with varying humidity, we consider that the gas phase is inviscid and consists of both air and vapour. The gas phase velocity ( $\mathbf {v}_{g}$
) is assumed to be varied linearly between the liquid–gas interface and far away from the droplet, such that
$\mathbf {v}_{g}$
) is assumed to be varied linearly between the liquid–gas interface and far away from the droplet, such that $\mathbf {v}_g \cdot \mathbf {t}_l=\mathbf {v}_{lg} \cdot \mathbf {t}_l$
at
$\mathbf {v}_g \cdot \mathbf {t}_l=\mathbf {v}_{lg} \cdot \mathbf {t}_l$
at $z=h$
and
$z=h$
and $\mathbf {v}_{g}=0$
at
$\mathbf {v}_{g}=0$
at $z=D_g$
. The dynamics in the gas phase is governed by
$z=D_g$
. The dynamics in the gas phase is governed by
 \begin{equation} \frac {\partial \rho _v}{\partial t} + \mathbf {v}_g \cdot \nabla \rho _v = D_{m}\nabla ^2\rho _v, \end{equation}
where $\rho _v$
is the concentration of the vapour in the gas phase and
$\rho _v$
is the concentration of the vapour in the gas phase and $D_{m}$
represents the diffusion coefficient of the vapour in the gas phase. We consider the case of a well-mixed gas phase where proper ventilation maintains constant vapour concentration at some distance from the droplet
$D_{m}$
represents the diffusion coefficient of the vapour in the gas phase. We consider the case of a well-mixed gas phase where proper ventilation maintains constant vapour concentration at some distance from the droplet $(\rho _{vi})$
. Thus, at
$(\rho _{vi})$
. Thus, at $z=D_g$
,
$z=D_g$
, $\rho _v = \rho _{vi}$
.
$\rho _v = \rho _{vi}$
.
The energy conservation equation in the gas phase is given by
 \begin{equation} \rho _g C_{pg} \frac {\partial T_g}{\partial t} = \lambda _g \nabla ^2 T_g, \end{equation}
where $T_g$
denotes the temperature in the gas phase. At the liquid–gas interface (
$T_g$
denotes the temperature in the gas phase. At the liquid–gas interface ( $z=h(x,t)$
), we impose continuity of temperature
$z=h(x,t)$
), we impose continuity of temperature
 \begin{equation} T_g = T_l, \end{equation}
where $T_l$
is the temperature of the drop at
$T_l$
is the temperature of the drop at $z=h(x,t)$
. Equations (2.14) and (2.22) imply that the contact resistance between ice and substrate, as well as the interfacial resistance between liquid and gas, are neglected.
$z=h(x,t)$
. Equations (2.14) and (2.22) imply that the contact resistance between ice and substrate, as well as the interfacial resistance between liquid and gas, are neglected.
The liquid in the droplet and the vapour in the gas phase are coupled as a consequence of the evaporation and condensation at the liquid–gas interface. In the gas phase, the vapour mass flux is related to the departure from the uniform vapour density, which is given by
 \begin{equation} J_v = - D_m \left ( \mathbf {n}_l \cdot \nabla \rho _v \right ) \quad \mbox {at} \; z = h(x,t). \end{equation}
Additionally, the kinetic theory leads to a linear constitutive relation between the mass and the departure from equilibrium at the interface, which is known as the Hertz–Knudsen relationship (Prosperetti & Plesset Reference Prosperetti and Plesset1984; Sultan, Boudaoud & Amar Reference Sultan, Boudaoud and Amar2005; Karapetsas et al. Reference Karapetsas, Sahu and Matar2016). This is given by
 \begin{equation} J_v = \alpha \left ( \frac {R_g T_{m}}{2 \pi M} \right )^{1/2} \left ( \rho _{ve} (T_{lg}) - \rho _v \right ), \end{equation}
where $R_g$
is the universal gas constant,
$R_g$
is the universal gas constant, $M$
is the molecular weight and
$M$
is the molecular weight and $\alpha$
is the accommodation coefficient (close to unity). The equilibrium vapour concentration,
$\alpha$
is the accommodation coefficient (close to unity). The equilibrium vapour concentration, $\rho _{ve} (T_{lg})$
, can be obtained by employing a linear temperature-dependent equation of state:
$\rho _{ve} (T_{lg})$
, can be obtained by employing a linear temperature-dependent equation of state:
 \begin{equation} \rho _{ve} (T_{lg}) = \rho _{ve} (T_m) \left [ 1 + \frac {M(p - p_{g})}{\rho _{l}R_gT_{m}} + \frac {ML_{v}}{R_{g}T_{m}}\left (\frac {T_{lg}}{T_{m}} - 1\right )\right ]. \end{equation}
Here, $L_{v}$
is the latent heat of evaporation. The combination of (2.23) and (2.24) leads to
$L_{v}$
is the latent heat of evaporation. The combination of (2.23) and (2.24) leads to
 \begin{equation} D_{m} \left ( \mathbf {n}_l \cdot \nabla \rho _v \right ) = - \alpha \left ( \frac {R_g T_{m}}{2 \pi M} \right )^{1/2} \left ( \rho _{ve} (T_{lg}) - \rho _v \right ), \end{equation}
which can be used to evaluate the local interfacial vapour concentration, $\rho _v$
. We use (2.26) as the boundary condition at
$\rho _v$
. We use (2.26) as the boundary condition at $z=h(x,t)$
to solve (2.20).
$z=h(x,t)$
to solve (2.20).
2.1.4. Solid substrate
The energy conservation equation in the solid substrate is given by
 \begin{equation} \rho _w C_{pw} \frac {\partial T_w}{\partial t} = \lambda _w \nabla ^2 T_w, \end{equation}
where $\rho _{w}$
represents the density of the substrate. The above equation is subjected to the continuity of thermal flux at the ice–substrate interface (
$\rho _{w}$
represents the density of the substrate. The above equation is subjected to the continuity of thermal flux at the ice–substrate interface ( $z=0$
):
$z=0$
):
 \begin{equation} \lambda _s \frac {\partial T_s}{\partial z} = \lambda _w \frac {\partial T_w}{\partial z}, \end{equation}
and at the bottom of the substrate, $z=-d_w$
,
$z=-d_w$
,
 \begin{equation} T_w = T_c. \end{equation}
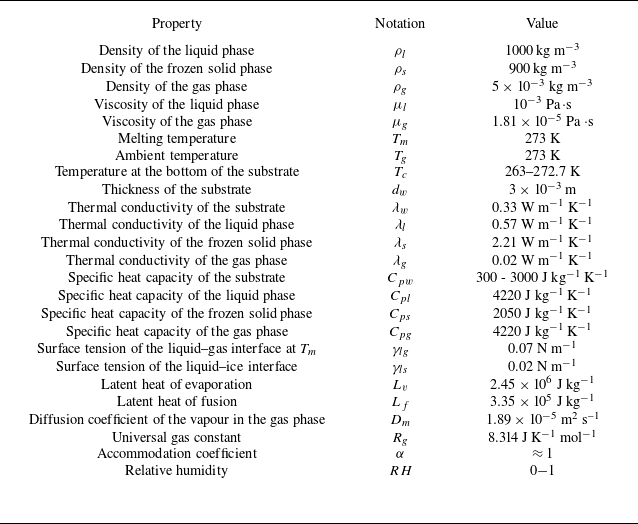
The properties of fluids and range of physical conditions considered in our study are listed in table 1.
Typical values of the physical parameters considered in our simulations. These properties are for water–air system and polymethyl methacrylate (PMMA) substrate.
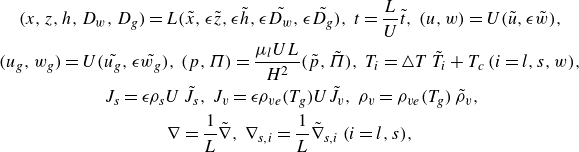
2.2. Scaling
The governing equations and boundary conditions are non-dimensionalised using the following scalings (wherein tilde denotes the dimensionless variable):
 \begin{equation} \begin{gathered} ( x, z, h, D_{w}, D_{g} ) = L ( \tilde {x}, \epsilon \tilde {z}, \epsilon \tilde {h} , \epsilon \tilde {D_{w}}, \epsilon \tilde {D_{g}}), \, t = \frac {L}{U} \tilde {t}, \, ( u, w ) = U ( \tilde {u}, \epsilon \tilde {w} ),\\ (u_g, w_g ) = U ( \tilde {u_{g}}, \epsilon \tilde {w_{g}} ), \, (p,\Pi ) = \frac {\mu _l U L}{H^2} (\tilde {p},\tilde {\Pi }), \, T_i = \triangle T \; \tilde {T}_i + T_c \; (i=l,s,w), \\ \, J_s = \epsilon \rho _s U \; \tilde {J}_s, \, J_v = \epsilon \rho _{ve}(T_g) U \tilde {J}_v, \, \rho _v = \rho _{ve}(T_g) \; \tilde {\rho }_v, \\ \nabla = \frac {1}{L} \tilde {\nabla }, \, \nabla _{s,i} = \frac {1}{L} \tilde {\nabla }_{s,i} \; (i=l,s), \end{gathered} \end{equation}
where $\triangle T = T_m - T_c$
,
$\triangle T = T_m - T_c$
, $\widetilde {\nabla } = \mathbf {e}_x\widetilde {\partial }_x + \mathbf {e}_z \epsilon ^{-1}\widetilde {\partial }_z$
and
$\widetilde {\nabla } = \mathbf {e}_x\widetilde {\partial }_x + \mathbf {e}_z \epsilon ^{-1}\widetilde {\partial }_z$
and $\widetilde {\nabla }_{s,i} = (I-\mathbf {n}\mathbf {n}) \cdot \widetilde {\nabla } \; (i=l,s)$
. The velocity scale
$\widetilde {\nabla }_{s,i} = (I-\mathbf {n}\mathbf {n}) \cdot \widetilde {\nabla } \; (i=l,s)$
. The velocity scale $U = \epsilon ^3 \gamma _{lg} / \mu _l$
, such that
$U = \epsilon ^3 \gamma _{lg} / \mu _l$
, such that $Ca/\epsilon ^2 = 1$
. Here,
$Ca/\epsilon ^2 = 1$
. Here, $Ca=\mu _l U / (\epsilon \gamma _{lg})$
denotes the capillary number. Henceforth, the tilde notation is suppressed, and
$Ca=\mu _l U / (\epsilon \gamma _{lg})$
denotes the capillary number. Henceforth, the tilde notation is suppressed, and $\partial / \partial x$
,
$\partial / \partial x$
, $\partial / \partial z$
and
$\partial / \partial z$
and $\partial / \partial t$
are represented by the subscripts
$\partial / \partial t$
are represented by the subscripts $x$
,
$x$
, $z$
and
$z$
and $t$
, respectively. By employing these scalings and incorporating the lubrication approximation (
$t$
, respectively. By employing these scalings and incorporating the lubrication approximation ( $\epsilon \ll 1$
), we obtain the following dimensionless governing equations and boundary conditions in the liquid, ice and gas phases.
$\epsilon \ll 1$
), we obtain the following dimensionless governing equations and boundary conditions in the liquid, ice and gas phases.
2.2.1. Liquid phase
The dimensionless governing equations in the liquid phase are given by
 \begin{align} \partial ^2_z u & = \partial _x p,\end{align}
 \begin{align} \partial _z p & = 0,\end{align}
 \begin{align} \partial _x u + \partial _z w &= 0,\end{align}
 \begin{align} \partial ^2_z T_l &= 0.\end{align}
The boundary conditions at the liquid–gas interface ( $z=h(x,t)$
) are
$z=h(x,t)$
) are
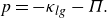
 \begin{align} p & = - \kappa _{lg} - \Pi ,\end{align}
 \begin{align} \partial _z u & = 0,\end{align}
 \begin{align} \partial _z T_l & = - \chi J_v + \Lambda _g \partial _z T_l,\end{align}
 \begin{align} \partial _t h + u \partial _x h - w & = -D_v J_v.\end{align}
Here, $D_v = \rho _{ve}(T_g)/ \rho _l$
represents the density ratio,
$D_v = \rho _{ve}(T_g)/ \rho _l$
represents the density ratio, $\Lambda _g = \lambda _g/\lambda _l$
represents the thermal conductivity ratio of the gas phase to the liquid phase and
$\Lambda _g = \lambda _g/\lambda _l$
represents the thermal conductivity ratio of the gas phase to the liquid phase and $\chi = \epsilon \rho _{ve}(T_g) U L_v H / (\lambda _l \triangle T)$
denotes the scaled latent heat of vapourisation.
$\chi = \epsilon \rho _{ve}(T_g) U L_v H / (\lambda _l \triangle T)$
denotes the scaled latent heat of vapourisation.
The boundary conditions at the liquid–ice interface (at $z=s(x,t)$
) are
$z=s(x,t)$
) are
 \begin{equation} u = 0 \quad \textrm {and} \quad T_l = T_f, \end{equation}
where $T_f=T_m = 1$
.
$T_f=T_m = 1$
.
The dimensionless disjoining pressure is given by
 \begin{equation} \Pi = {A_{n} \epsilon ^{-2}} \left [ \left ( \frac {\beta }{h-s} \right )^n - \left ( \frac {\beta }{h-s} \right )^m \right ], \end{equation}
where $\beta$
is of the same order as the equilibrium precursor layer thickness (Pham & Kumar Reference Pham and Kumar2019) and
$\beta$
is of the same order as the equilibrium precursor layer thickness (Pham & Kumar Reference Pham and Kumar2019) and $A_{n} = H A / \gamma _{lgo}$
denotes the dimensionless Hamaker constant. The interaction between the repulsive and attractive components of (2.40) dictates the value of the equilibrium contact angle
$A_{n} = H A / \gamma _{lgo}$
denotes the dimensionless Hamaker constant. The interaction between the repulsive and attractive components of (2.40) dictates the value of the equilibrium contact angle $\theta _{eq}$
(Schwartz & Eley Reference Schwartz and Eley1998; Zadražil et al. Reference Zadražil, Stepanek and Matar2006; Espín & Kumar Reference Espín and Kumar2015; Pham & Kumar Reference Pham and Kumar2019; Tembely & Dolatabadi Reference Tembely and Dolatabadi2019). This can be approximated by (Pham & Kumar Reference Pham and Kumar2019)
$\theta _{eq}$
(Schwartz & Eley Reference Schwartz and Eley1998; Zadražil et al. Reference Zadražil, Stepanek and Matar2006; Espín & Kumar Reference Espín and Kumar2015; Pham & Kumar Reference Pham and Kumar2019; Tembely & Dolatabadi Reference Tembely and Dolatabadi2019). This can be approximated by (Pham & Kumar Reference Pham and Kumar2019)
 \begin{equation} \theta _{eq} \approx \sqrt {\beta A_{n}}. \end{equation}
The full mean curvatures at the liquid–gas and liquid–ice interfaces, retaining higher order contributions, are given by
 \begin{equation} \kappa _{lg} = \frac {h_{xx}}{(1+\epsilon ^2 h_x^2)^{\frac {3}{2}}} \quad \textrm {and} \quad \kappa _{sl} = \frac {s_{xx}}{(1+\epsilon ^2 s_x^2)^{\frac {3}{2}}}. \end{equation}
2.2.2. Solid (ice) phase
Under the lubrication approximation ( $\epsilon \ll 1$
), the dimensionless energy conservation equations for the ice phase is given by
$\epsilon \ll 1$
), the dimensionless energy conservation equations for the ice phase is given by
 \begin{equation} \partial ^2_z T_s = 0. \end{equation}
The energy balance at the liquid–ice interface ( $z=s(x,t)$
) gives
$z=s(x,t)$
) gives
 \begin{equation} Ste \left ( \Lambda _s \partial _z T_s - \partial _z T_l \right ) = J_s, \end{equation}
where $\Lambda _s = \lambda _s / \lambda _l$
is the thermal conductivity ratio and
$\Lambda _s = \lambda _s / \lambda _l$
is the thermal conductivity ratio and $Ste = \lambda _l \triangle T / ( \epsilon \rho _s U L_f H )$
denotes the Stefan number. At
$Ste = \lambda _l \triangle T / ( \epsilon \rho _s U L_f H )$
denotes the Stefan number. At $z=s(x,t)$
, the conservation of mass (2.10) gives
$z=s(x,t)$
, the conservation of mass (2.10) gives
 \begin{equation} \partial _t s - w = D_s J_s, \quad \textrm {where} \, J_s = \partial _t s. \end{equation}
where $D_s=\rho _s/\rho _l$
is the density ratio of the frozen phase to the liquid phase.
$D_s=\rho _s/\rho _l$
is the density ratio of the frozen phase to the liquid phase.
At the ice–solid interface ( $z=0$
), we impose
$z=0$
), we impose
 \begin{equation} T_s = T_w. \end{equation}
2.2.3. Gas phase
The dimensionless conservation equation for the vapour concentration becomes
 \begin{equation} Pe_v({\partial _t\rho _v}+u_g\partial _x\rho _v+w_g\partial _z\rho _v) = \partial ^2_z\rho _v +\epsilon ^2\partial ^2_x\rho _v. \end{equation}
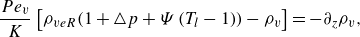
At the liquid–gas interface ( $z=h(x,t)$
), (2.26) reduces to
$z=h(x,t)$
), (2.26) reduces to
 \begin{equation} \frac {Pe_v}{K} \left [ \rho _{veR}(1 + \triangle p + \Psi \left (T_{l}-1 \right )) - \rho _v \right ]= - \partial _z \rho _v, \end{equation}
while the constitutive equation for the evaporation flux gives
 \begin{equation} K J_v = \rho _{veR}(1 + \triangle p + \Psi \left (T_{l}-1 \right )) - \rho _v. \end{equation}
The boundary condition far from the droplet ( $z = D_g$
) is given by
$z = D_g$
) is given by
 \begin{equation} \rho _v = RH, \end{equation}
where $RH$
denotes the relative humidity. The various dimensionless numbers appearing in (2.47)–(2.49) are
$RH$
denotes the relative humidity. The various dimensionless numbers appearing in (2.47)–(2.49) are
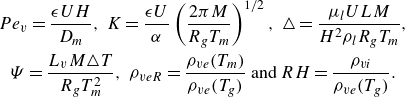 \begin{equation} \begin{gathered} Pe_v = \frac {\epsilon U H}{D_m}, \ K = \frac {\epsilon U}{\alpha } \left ( \frac {2 \pi M}{R_g T_{m}} \right )^{1/2}, \ \triangle = \frac {\mu _{l}ULM}{H^{2}\rho _{l}R_gT_m}, \\ \Psi = \frac {L_{v}M\triangle T}{R_{g}T_{m}^2}, \ \rho _{veR} = {{\rho _{ve}(T_m)} \over \rho _{ve}(T_g)} \ \textrm {and} \ RH ={\rho _{vi} \over \rho _{ve}(T_g)}. \end{gathered} \end{equation}
Under the lubrication approximation ( $\epsilon \ll 1$
), the dimensionless energy conservation equations for the gas phase is given by
$\epsilon \ll 1$
), the dimensionless energy conservation equations for the gas phase is given by
 \begin{equation} \partial ^2_z T_g = 0. \end{equation}
The boundary condition far from the droplet ( $z = D_g$
) is given by
$z = D_g$
) is given by
 \begin{equation} T_g = T_v. \end{equation}
At the liquid–gas interface ( $z=h(x,t)$
),
$z=h(x,t)$
),
 \begin{equation} T_g = T_l. \end{equation}
2.2.4. Solid substrate
The scaled energy conservation equation for the solid substrate is given by
 \begin{equation} \partial ^2_z T_w = 0. \end{equation}
The boundary condition at the solid–ice interface ( $z=0$
) is
$z=0$
) is
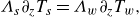 \begin{equation} \Lambda _s \partial _z T_s = \Lambda _w \partial _z T_w, \end{equation}
where $\Lambda _w = \lambda _w / \lambda _l$
denotes the thermal conductivity ratio. At the bottom of the substrate (at
$\Lambda _w = \lambda _w / \lambda _l$
denotes the thermal conductivity ratio. At the bottom of the substrate (at $z=-D_w$
), we impose
$z=-D_w$
), we impose
 \begin{equation} T_w = 0. \end{equation}
2.3. Evolution equations
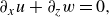
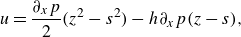
By integrating (2.31) and (2.32) with respect to $z$
and using (2.36), (2.39) and (2.35), we get
$z$
and using (2.36), (2.39) and (2.35), we get
 \begin{align} u & = \frac {\partial _x p}{2} (z^2 - s^2) - h \partial _x p (z-s),\end{align}
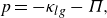
 \begin{align} p & = - \kappa _{lg} - \Pi .\end{align}
By integrating (2.33) and using (2.38), we get the following evolution equation:
 \begin{equation} \partial _t h - \partial _t s = - \partial _x q_l - D_v J_v - D_s J_s, \end{equation}
where
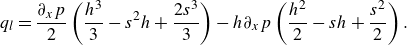 \begin{equation} q_l = \frac {\partial _x p}{2} \left (\frac {h^3}{3} - s^2 h + \frac {2s^3}{3} \right ) - h \partial _x p \left (\frac {h^2}{2}-s h + \frac {s^2}{2} \right ). \end{equation}
Similarly, by integrating (2.34) and using (2.37) and (2.39), we get
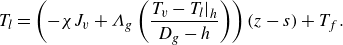 \begin{equation} T_l = \left (-\chi J_v+\Lambda _g\left (\frac {T_{v}-T_{l}\big |_{h}}{D_g-h}\right )\right ) (z-s) + T_f. \end{equation}
The temperature distribution in the ice phase is governed by
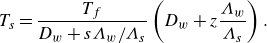 \begin{equation} T_s = \frac {T_f}{D_w+s \Lambda _w/\Lambda _s} \left ( D_w + z \frac {\Lambda _w}{\Lambda _s} \right ). \end{equation}
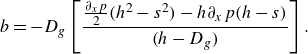
Using the above expression along with (2.45) and introducing them into (2.44), we get
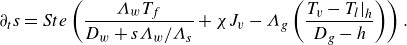 \begin{equation} \partial _t s = Ste \left ( \frac {\Lambda _w T_f}{D_w+s \Lambda _w/\Lambda _s} + \chi J_v - \Lambda _g\left (\frac {T_{v}-T_{l}\big |_{h}}{D_g-h}\right )\right ). \end{equation}
The temperature profile in the solid substrate is given by
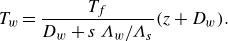 \begin{equation} T_w = \frac {T_f}{D_w + s \; \Lambda _w/\Lambda _s}(z+D_w). \end{equation}
2.3.1. Gas phase – Kármán–Pohlhausen approximation
To retain the advection terms in the vapour concentration balance equation, we apply the Kármán–Pohlhausen integral approximation and define the integrated form of $\rho _v$
, which is given by
$\rho _v$
, which is given by
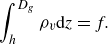 \begin{equation} \int _{h}^{D_g} \rho _v {\rm d}z = f. \end{equation}
To be able to evaluate (2.66), we need to prescribe the form of $\rho _v$
as a function of the vertical coordinate. To this end, we assume that
$\rho _v$
as a function of the vertical coordinate. To this end, we assume that $\rho _v$
can be approximated by a polynomial of the form
$\rho _v$
can be approximated by a polynomial of the form
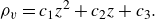 \begin{equation} \rho _v = c_1z^2 + c_2z+c_3. \end{equation}
By substituting the corresponding polynomial in (2.66) and applying the appropriate boundary conditions, i.e. (2.48) and (2.50), it is possible to evaluate the polynomial constants and eventually derive the following expressions for the constants $c_1$
,
$c_1$
, $c_2$
and
$c_2$
and $c_3$
:
$c_3$
:
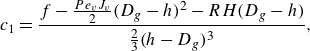 \begin{align} c_1 &= \frac {f-\frac {Pe_v J_v}{2}(D_g-h)^2-RH(D_g-h)}{\frac {2}{3}(h-D_g)^3}, \end{align}
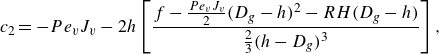 \begin{align} c_2 & = -Pe_ vJ_v - 2h\left [\frac {f-\frac {Pe_v J_v}{2}(D_g-h)^2-RH(D_g-h)}{\frac {2}{3}(h-D_g)^3}\right ], \end{align}
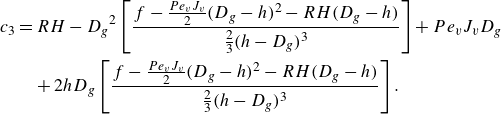 \begin{align} c_3 & = RH-{D_g}^2\left [\frac {f-\frac {Pe_vJ_v}{2}(D_g-h)^2-RH(D_g-h)}{\frac {2}{3}(h-D_g)^3}\right ] + Pe_v J_vD_g \nonumber \\ &\quad + 2h D_g\left [\frac {f-\frac {Pe_v J_v}{2}(D_g-h)^2-RH(D_g-h)}{\frac {2}{3}(h-D_g)^3}\right ]. \end{align}
Then, by integrating (2.47) and using the boundary conditions, we get the following integrated form of the concentration equation:
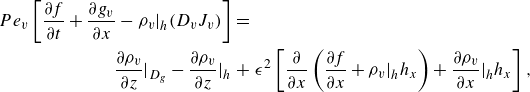 \begin{eqnarray} Pe_v\left [\frac {\partial f}{\partial t} + \frac {\partial g_v}{\partial x} - \rho _{v}\big |_{h}(D_v J_v)\right ] &=& \nonumber \\ \frac {\partial \rho _v}{\partial z}\big |_{D_g} - \frac {\partial \rho _v}{\partial z}\big |_{h} &+& \epsilon ^2 \left [\frac {\partial }{\partial x}\left (\frac {\partial f}{\partial x} + \rho _v\big |_{h}h_x\right ) + \frac {\partial \rho _v}{\partial x}\big |_{h}h_x\right ], \end{eqnarray}
where
 \begin{equation} \int _{h}^{D_g} u_g\rho _v {\rm d}z = g_v. \end{equation}
To evaluate (2.70), we need to prescribe the $x$
-component of the velocity profile in the gas phase, which can be approximated by considering the following linear profile:
$x$
-component of the velocity profile in the gas phase, which can be approximated by considering the following linear profile:
 \begin{equation} u_g = a z + b. \end{equation}
The constants $a$
and
$a$
and $b$
can be evaluated by simply considering that, at the liquid–gas interface (
$b$
can be evaluated by simply considering that, at the liquid–gas interface ( $z=h(x,t)$
), the velocity of the gas is equal to the velocity of liquid
$z=h(x,t)$
), the velocity of the gas is equal to the velocity of liquid
 \begin{equation} u_{g} = u\quad \textrm {and} \quad w_{g} = w, \end{equation}
and at the far-field ( $z = D_g$
),
$z = D_g$
),
 \begin{equation} u_{g} = 0\quad \textrm {and} \quad w_{g} = 0. \end{equation}
Thus,
 \begin{align} a &= \frac {\frac {\partial _x p}{2} (h^2 - s^2) - h \partial _x p (h-s)}{(h-D_g)}, \end{align}
 \begin{align} b &= -D_g\left [\frac {\frac {\partial _x p}{2} (h^2 - s^2) - h \partial _x p (h-s)}{(h-D_g)}\right ]. \end{align}
2.4. Initial and boundary conditions – numerical procedure
In our modelling, the droplet is deposited on a thin precursor layer that resides on top of a thin layer of ice. By selecting the value of the dimensionless Hammaker constant $A_{n}$
appropriately, we ensure that the droplets achieve an equilibrium contact angle with the substrate. This choice governs the equilibrium contact angle by balancing the repulsive and attractive components of the disjoining pressure interaction. The following initial conditions are imposed on the domain:
$A_{n}$
appropriately, we ensure that the droplets achieve an equilibrium contact angle with the substrate. This choice governs the equilibrium contact angle by balancing the repulsive and attractive components of the disjoining pressure interaction. The following initial conditions are imposed on the domain:
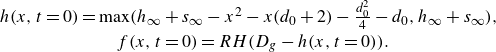 \begin{eqnarray} & h(x,t=0) = \max (h_{\infty }+s_{\infty }-x^{2}-x(d_{0}+2)-\frac {d_{0}^2}{4}-d_{0},h_{\infty }+s_{\infty }),\, \nonumber \\ & f(x,t=0) = RH(D_{g}-h(x,t=0)). \end{eqnarray}
The dimensionless equilibrium precursor layer thickness ( $h_{\infty }=(h-s_{\infty })= H_{\infty }/{H}$
) far from the droplet can be estimated by considering that in this region, the fluid is flat with zero mean curvature and sufficiently thin such that the attractive van der Waals forces suppress evaporation. Therefore, by taking the constitutive equation for the evaporation flux and setting it to zero, the dimensionless equilibrium precursor thickness
$h_{\infty }=(h-s_{\infty })= H_{\infty }/{H}$
) far from the droplet can be estimated by considering that in this region, the fluid is flat with zero mean curvature and sufficiently thin such that the attractive van der Waals forces suppress evaporation. Therefore, by taking the constitutive equation for the evaporation flux and setting it to zero, the dimensionless equilibrium precursor thickness $h_{\infty }$
can be evaluated by solving the following nonlinear equation:
$h_{\infty }$
can be evaluated by solving the following nonlinear equation:
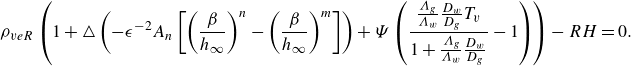 \begin{equation} \rho _{veR}\left (1 + \triangle \left (-{\epsilon ^{-2}A_{n}} \left [ \left ( \frac {\beta }{h_\infty } \right )^n - \left ( \frac {\beta }{h_\infty } \right )^m \right ]\right ) + \Psi \left (\frac {\frac {\Lambda _g}{\Lambda _w}\frac {D_w}{D_g}{T_v}}{1 + \frac {\Lambda _g}{\Lambda _w}\frac {D_w}{D_g}}-1\right )\right ) - RH= 0. \end{equation}
In all our simulations, we have taken $\beta =0.01$
. The initial thickness of the thin ice layer is taken to be
$\beta =0.01$
. The initial thickness of the thin ice layer is taken to be $s_{\infty }=10^{-3}$
, but we have verified that our findings remain unchanged when considering, e.g. one or two orders of magnitude smaller values of
$s_{\infty }=10^{-3}$
, but we have verified that our findings remain unchanged when considering, e.g. one or two orders of magnitude smaller values of $s_{\infty }$
. To prevent the precursor layer from freezing, we adopt a similar approach to that of Zadražil et al. (Reference Zadražil, Stepanek and Matar2006) and introduce the thickness-dependent Stefan number
$s_{\infty }$
. To prevent the precursor layer from freezing, we adopt a similar approach to that of Zadražil et al. (Reference Zadražil, Stepanek and Matar2006) and introduce the thickness-dependent Stefan number $(Ste (x))$
, which is given by the following expression:
$(Ste (x))$
, which is given by the following expression:
 \begin{equation} Ste(x) = \frac {1}{2}(1+\tanh [4\times 10^{3}((h-s)-1.4\beta )])Ste. \end{equation}
We also assume that when the thickness of the ice layer is very low ( $s_{\infty }=10^{-3}$
), the temperature of the liquid–gas interface and the ice–liquid interface are the same as the top of the substrate by using a thickness-dependent boundary condition at the liquid–ice interface (
$s_{\infty }=10^{-3}$
), the temperature of the liquid–gas interface and the ice–liquid interface are the same as the top of the substrate by using a thickness-dependent boundary condition at the liquid–ice interface ( $z=s(x,t)$
) and the liquid–gas interface (
$z=s(x,t)$
) and the liquid–gas interface ( $z=h(x,t)$
). This is given by
$z=h(x,t)$
). This is given by
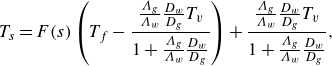 \begin{equation} T_s = F(s)\left (T_{f}-\frac {\frac {\Lambda _g}{\Lambda _w}\frac {D_w}{D_g}{T_v}}{1 + \frac {\Lambda _g}{\Lambda _w}\frac {D_w}{D_g}}\right ) + \frac {\frac {\Lambda _g}{\Lambda _w}\frac {D_w}{D_g}{T_v}}{1 + \frac {\Lambda _g}{\Lambda _w}\frac {D_w}{D_g}}, \end{equation}
where
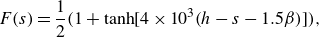 \begin{equation} F(s)=\frac {1}{2}(1+\tanh [4\times 10^{3}(h-s-1.5 \beta )]), \end{equation}
 \begin{equation} T_{l}\big |_{h} = F(s) \left (\frac {\left (-\chi J_v+\left (\frac {\Lambda _g T_{v}}{D_g-h}\right )\right )(h-s) + {T_f}}{1+\frac {\Lambda _g}{D_{g} - h}(h-s)}-\frac {\frac {\Lambda _g}{\Lambda _w}\frac {D_w}{D_g} {T_v}}{1 + \frac {\Lambda _g}{\Lambda _w}\frac {D_w}{D_g}}\right ) + \frac {\frac {\Lambda _g}{\Lambda _w}\frac {D_w}{D_g} {T_v}}{1 + \frac {\Lambda _g}{\Lambda _w}\frac {D_w}{D_g}}. \end{equation}
Finally, we impose the following set of boundary conditions:
 \begin{align} h_{x}(0,t) = h_{xxx}(0,t) = h_{x}(x_{\infty },t) = h_{xxx}(x_{\infty },t)&= 0,\end{align}
 \begin{align} s_{x}(0,t) = s_{xxx}(0,t) = s_{x}(x_{\infty },t) = s_{xxx}(x_{\infty },t)&= 0,\end{align}
 \begin{align} h(x_{\infty },t)-s(x_{\infty },t) = h_{\infty }, \, s(x_{\infty },t) &= s_{\infty },\end{align}
 \begin{align} f_x(0,t)& = 0,\end{align}
 \begin{align} f(x_{\infty },t) = RH(D_{g}-s(x_{\infty },t)-h_{\infty }),\end{align}
where $x_{\infty }$
represents the end of the domain.
$x_{\infty }$
represents the end of the domain.
The dimensionless governing equations are discretised using the Galerkin finite element method, with weak forms derived for each equation. The solutions are iteratively obtained using the Newton–Raphson scheme, advancing in time via an implicit Euler method with an adaptive time step. The time step adapts based on the maximum residual errors from the previous step, a characteristic feature of the adaptive implicit Euler method. The LAPACK linear algebra package is used, with the iterative programme written in FORTRAN. We validate our model by comparing the tip angle at the end of freezing with the angle observed in the experimental study by Marin et al. (Reference Marin, Enriquez, Brunet, Colinet and Snoeijer2014) for a typical set of parameters, as shown in figure 14. Further validation was conducted by simulating a scenario previously examined by Kavuri et al. (Reference Kavuri, Karapetsas, Sharma and Sahu2023) and Zadražil et al. (Reference Zadražil, Stepanek and Matar2006) in figure 15 that illustrates the temporal evolution of the droplet shape, $h$
(solid line), and the freezing front,
$h$
(solid line), and the freezing front, $s$
(dash-dotted line), for a drop placed on a cold substrate. Our simulations employ a one-dimensional mesh along the
$s$
(dash-dotted line), for a drop placed on a cold substrate. Our simulations employ a one-dimensional mesh along the $x$
-direction, covering a computational domain of twelve dimensionless units with 9601 grid points. The optimal computational domain size and grid density were determined through a thorough investigation of domain size effects and a grid convergence test. Appendix A presents the details about the validation of the present numerical model (figures 14 and 15) and the grid convergence test (figure 17). For more information, refer to Kavuri et al. (Reference Kavuri, Karapetsas, Sharma and Sahu2023); Wang et al. (Reference Wang, Karapetsas, Valluri and Inoue2024); Williams et al. (Reference Williams, Karapetsas, Mamalis, Sefiane, Matar and Valluri2021).
$x$
-direction, covering a computational domain of twelve dimensionless units with 9601 grid points. The optimal computational domain size and grid density were determined through a thorough investigation of domain size effects and a grid convergence test. Appendix A presents the details about the validation of the present numerical model (figures 14 and 15) and the grid convergence test (figure 17). For more information, refer to Kavuri et al. (Reference Kavuri, Karapetsas, Sharma and Sahu2023); Wang et al. (Reference Wang, Karapetsas, Valluri and Inoue2024); Williams et al. (Reference Williams, Karapetsas, Mamalis, Sefiane, Matar and Valluri2021).
3. Results and discussion
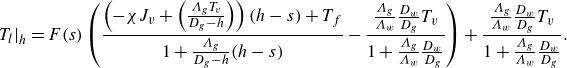
We investigate the evaporation-driven coalescence phenomenon of two volatile droplets placed in close vicinity on a cold substrate undergoing freezing. To demonstrate this phenomenon, we begin the presentation by considering two scenarios. In the first scenario (depicted in figure 2a), we examine a system comprising two droplets initially separated by a distance of $d_0 = 0.5$
on a cold substrate undergoing freezing. In this case, we neglect the evaporation by setting
$d_0 = 0.5$
on a cold substrate undergoing freezing. In this case, we neglect the evaporation by setting $RH = 1.0$
,
$RH = 1.0$
, $\chi = 0$
,
$\chi = 0$
, $\triangle = 0$
,
$\triangle = 0$
, $\Psi = 0$
and
$\Psi = 0$
and $Pe_{v} = 0$
. In the second scenario (illustrated in figure 2b), we analyse the same system but with evaporation taken into account by setting
$Pe_{v} = 0$
. In the second scenario (illustrated in figure 2b), we analyse the same system but with evaporation taken into account by setting $RH = 0.9$
,
$RH = 0.9$
, $\chi = 1.6$
,
$\chi = 1.6$
, $\triangle = 10^{-4}$
,
$\triangle = 10^{-4}$
, $\Psi = 0.02$
and
$\Psi = 0.02$
and $Pe_{v} = 1$
. The remaining dimensionless parameters (
$Pe_{v} = 1$
. The remaining dimensionless parameters ( $Ste = 2.53\times 10^{-5}$
,
$Ste = 2.53\times 10^{-5}$
, $T_{v} = 1.0$
,
$T_{v} = 1.0$
, $A_{n} = 17.0$
,
$A_{n} = 17.0$
, $D_v = 10^{-3}$
,
$D_v = 10^{-3}$
, $D_{g} = 2.0$
,
$D_{g} = 2.0$
, $D_{s} = 0.9$
,
$D_{s} = 0.9$
, $\Lambda _{S} = 3.89$
,
$\Lambda _{S} = 3.89$
, $\Lambda _{W} = 0.33$
,
$\Lambda _{W} = 0.33$
, $\Lambda _{g} = 0.041$
,
$\Lambda _{g} = 0.041$
, $K = 8\times 10^{-4}$
,
$K = 8\times 10^{-4}$
, $D_{w} = 15.0$
,
$D_{w} = 15.0$
, $\epsilon =0.2$
and
$\epsilon =0.2$
and $\rho _{veR} = 1.0$
) are kept the same in both the systems. The dimensionless parameters considered in figure 2(b) are termed as ‘base’ parameters. It is to be noted that the volatility of the liquid considered in our study is significantly higher than that of water. The value of the dimensionless parameter characterising the volatility (
$\rho _{veR} = 1.0$
) are kept the same in both the systems. The dimensionless parameters considered in figure 2(b) are termed as ‘base’ parameters. It is to be noted that the volatility of the liquid considered in our study is significantly higher than that of water. The value of the dimensionless parameter characterising the volatility ( $D_v$
) is set at
$D_v$
) is set at $10^{-3}$
, which corresponds to highly volatile liquids, e.g. butane, pentane, ammonia, propyl benzene, benzol and toluene. Figures 2(a) and 2(b) depict the temporal evolution of the shape of the droplet
$10^{-3}$
, which corresponds to highly volatile liquids, e.g. butane, pentane, ammonia, propyl benzene, benzol and toluene. Figures 2(a) and 2(b) depict the temporal evolution of the shape of the droplet $(h)$
and the freezing front
$(h)$
and the freezing front $(s)$
. It can be seen in figure 2(a) that for the system, when the evaporation is neglected, the contact line of the droplets remains fixed, while the freezing front propagates upwards at later times, keeping the volume of liquid the same. In contrast, in the system undergoing evaporation, the droplets migrate closer at early times, leading to their coalescence at
$(s)$
. It can be seen in figure 2(a) that for the system, when the evaporation is neglected, the contact line of the droplets remains fixed, while the freezing front propagates upwards at later times, keeping the volume of liquid the same. In contrast, in the system undergoing evaporation, the droplets migrate closer at early times, leading to their coalescence at $t=400$
. Subsequently, the droplets merge to form a single droplet, whose size decreases due to the associated evaporation.
$t=400$
. Subsequently, the droplets merge to form a single droplet, whose size decreases due to the associated evaporation.
Temporal evolution of the shape of droplets, $h$
(solid line) and the freezing front,
$h$
(solid line) and the freezing front, $s$
(dash-dottedline) for two droplets placed on a cold substrate with initial separation distance
$s$
(dash-dottedline) for two droplets placed on a cold substrate with initial separation distance $d_0 = 0.5$
. (a) Without evaporation (
$d_0 = 0.5$
. (a) Without evaporation ( $RH = 1.0$
,
$RH = 1.0$
, $\chi = 0$
,
$\chi = 0$
, $\triangle = 0$
,
$\triangle = 0$
, $\Psi = 0$
and
$\Psi = 0$
and $Pe_{v} = 0$
) and (b) with evaporation (
$Pe_{v} = 0$
) and (b) with evaporation ( $RH = 0.9$
,
$RH = 0.9$
, $\chi = 1.6$
,
$\chi = 1.6$
, $\triangle = 10^{-4}$
,
$\triangle = 10^{-4}$
, $\Psi = 0.02$
and
$\Psi = 0.02$
and $Pe_{v} = 1$
). The remaining dimensionless parameters in both the systems are
$Pe_{v} = 1$
). The remaining dimensionless parameters in both the systems are $Ste = 2.53\times 10^{-5}$
,
$Ste = 2.53\times 10^{-5}$
, $T_{v} = 1.0$
,
$T_{v} = 1.0$
, $A_{n} = 17.0$
,
$A_{n} = 17.0$
, $D_v = 10^{-3}$
,
$D_v = 10^{-3}$
, $D_{g} = 2.0$
,
$D_{g} = 2.0$
, $D_{s} = 0.9$
,
$D_{s} = 0.9$
, $\Lambda _{S} = 3.89$
,
$\Lambda _{S} = 3.89$
, $\Lambda _{W} = 0.33$
,
$\Lambda _{W} = 0.33$
, $\Lambda _{g} = 0.041$
,
$\Lambda _{g} = 0.041$
, $K = 8\times 10^{-4}$
,
$K = 8\times 10^{-4}$
, $D_{w} = 15.0$
,
$D_{w} = 15.0$
, $\epsilon =0.2$
and
$\epsilon =0.2$
and $\rho _{veR} = 1.0$
.
$\rho _{veR} = 1.0$
.
3.1. Mechanism
Evolution of the evaporation flux ( $J_v$
) profile at (a) early and (b) later times. (c) Enlarged view of the evaporation flux (
$J_v$
) profile at (a) early and (b) later times. (c) Enlarged view of the evaporation flux ( $J_v$
) profile, shown in panel (a), at
$J_v$
) profile, shown in panel (a), at $t = 1$
,
$t = 1$
, $5$
and
$5$
and $10$
for the right drop. The rest of the dimensionless parameters are the same as figure 2(b) (‘base’ parameters).
$10$
for the right drop. The rest of the dimensionless parameters are the same as figure 2(b) (‘base’ parameters).
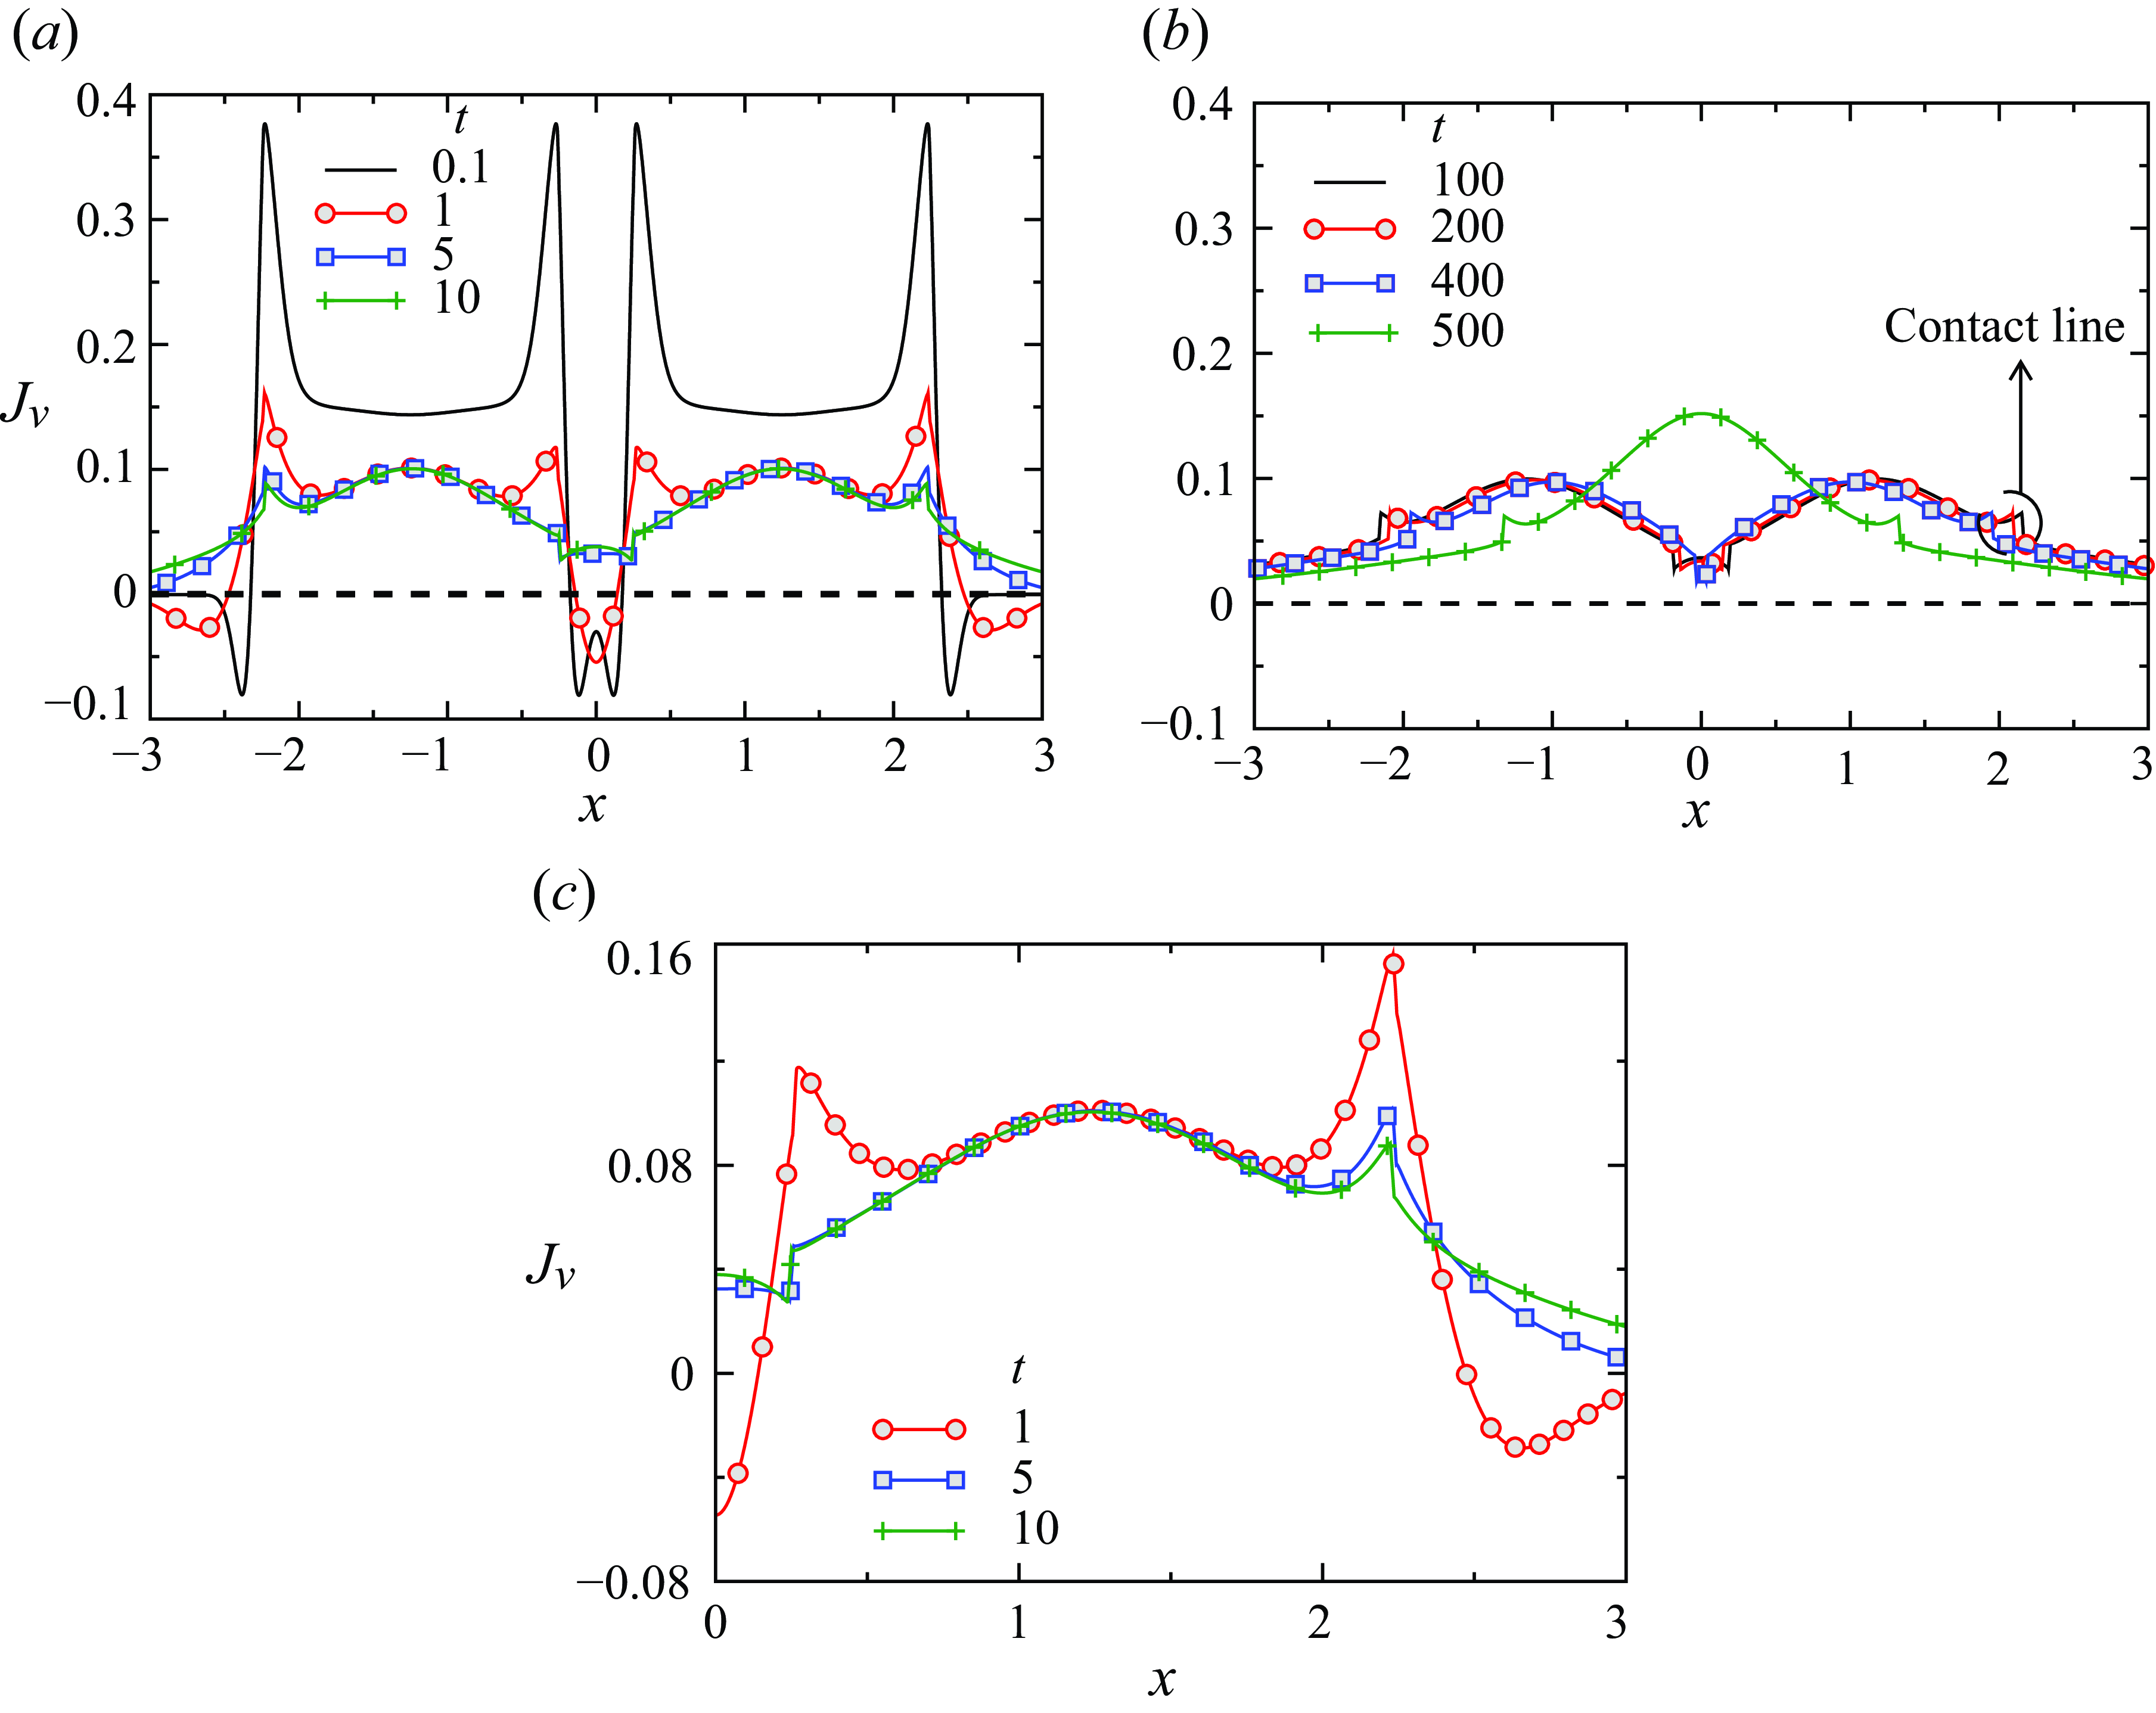
To understand the behaviour, in figures 3(a) and 3(b), we analyse the evaporation flux $(J_v)$
during early and later stages for the system depicted in figure 2(b). At
$(J_v)$
during early and later stages for the system depicted in figure 2(b). At $t = 0.1$
, the droplets exhibit a symmetrical evaporation flux profile, as it takes some time for evaporation to initiate. As time progresses, the evaporation becomes asymmetrical, with higher
$t = 0.1$
, the droplets exhibit a symmetrical evaporation flux profile, as it takes some time for evaporation to initiate. As time progresses, the evaporation becomes asymmetrical, with higher $J_v$
values in the outer region and lower
$J_v$
values in the outer region and lower $J_v$
values in the inner area of the droplets due to the effect of vapour shielding, while the droplets migrate inwards. The asymmetry in the evaporation is clearly noticeable at times
$J_v$
values in the inner area of the droplets due to the effect of vapour shielding, while the droplets migrate inwards. The asymmetry in the evaporation is clearly noticeable at times $t = 1$
,
$t = 1$
, $5$
and
$5$
and $10$
in figure 3(a). An enlarged view of figure 3(a) at
$10$
in figure 3(a). An enlarged view of figure 3(a) at $t = 1$
,
$t = 1$
, $5$
and
$5$
and $10$
, highlighting the asymmetry in the evaporation flux
$10$
, highlighting the asymmetry in the evaporation flux $(J_v)$
at the inner and outer edges of the right drop, is shown in figure 3(c). It is to be noted that when vapour from one droplet intersects with vapour from another droplet, it creates a more concentrated region, thereby diminishing the evaporation flux near the neighbouring droplet (Lee, Choi & Lee Reference Lee, Choi and Lee2023). This asymmetry in the evaporation flux persists until the droplets coalesce. After coalescence, the evaporation flux profile again becomes symmetrical, as observed at
$(J_v)$
at the inner and outer edges of the right drop, is shown in figure 3(c). It is to be noted that when vapour from one droplet intersects with vapour from another droplet, it creates a more concentrated region, thereby diminishing the evaporation flux near the neighbouring droplet (Lee, Choi & Lee Reference Lee, Choi and Lee2023). This asymmetry in the evaporation flux persists until the droplets coalesce. After coalescence, the evaporation flux profile again becomes symmetrical, as observed at $t = 500$
in figure 3(b). The slight spikes observed near the outer contact line of the drops (highlighted in figure 3
b) indicate a slightly higher evaporation flux in that region, a common characteristic observed in thin droplets (Karapetsas et al. Reference Karapetsas, Sahu and Matar2016). This observation suggests that increased evaporation at the outer edges of the droplets triggers a capillary flow towards this side to replenish the lost mass, which in turn pushes the droplet inwards where evaporation is low utilising viscous friction from the substrate (Sadafi et al. Reference Sadafi, Dehaeck, Rednikov and Colinet2019). This effect can be quantified by examining the capillary velocity (
$t = 500$
in figure 3(b). The slight spikes observed near the outer contact line of the drops (highlighted in figure 3
b) indicate a slightly higher evaporation flux in that region, a common characteristic observed in thin droplets (Karapetsas et al. Reference Karapetsas, Sahu and Matar2016). This observation suggests that increased evaporation at the outer edges of the droplets triggers a capillary flow towards this side to replenish the lost mass, which in turn pushes the droplet inwards where evaporation is low utilising viscous friction from the substrate (Sadafi et al. Reference Sadafi, Dehaeck, Rednikov and Colinet2019). This effect can be quantified by examining the capillary velocity ( $u_{ca}(x)$
) and the average capillary velocity (
$u_{ca}(x)$
) and the average capillary velocity ( $\bar {u}_{ca}$
) inside a drop, which are given by
$\bar {u}_{ca}$
) inside a drop, which are given by
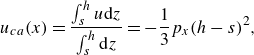 \begin{align} u_{ca} (x) = \frac {\int _{s}^{h}u{\rm d}z}{\int _{s}^{h}{\rm d}z} = -\frac {1}{3}p_{x}(h-s)^{2},\end{align}
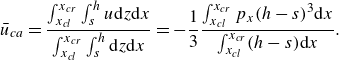 \begin{align} \bar {u}_{ca} = \frac {\int _{x_{cl}}^{x_{cr}}\int _{s}^{h}u{\rm d}z{\rm d}x}{\int _{x_{cl}}^{x_{cr}}\int _{s}^{h}{\rm d}z{\rm d}x} = -\frac {1}{3}\frac {\int _{x_{cl}}^{x_{cr}}p_{x}(h-s)^{3}{\rm d}x}{\int _{x_{cl}}^{x_{cr}}(h-s){\rm d}x}.\end{align}
Variation of the capillary velocity ( $u_{ca}(x)$
) along the substrate at different times in scenarios (a) without evaporation (
$u_{ca}(x)$
) along the substrate at different times in scenarios (a) without evaporation ( $RH = 1.0$
,
$RH = 1.0$
, $\chi = 0$
,
$\chi = 0$
, $\triangle = 0$
,
$\triangle = 0$
, $\Psi = 0$
and
$\Psi = 0$
and $Pe_{v} = 0$
) and (b) with evaporation (
$Pe_{v} = 0$
) and (b) with evaporation ( $RH = 0.9$
,
$RH = 0.9$
, $\chi = 1.6$
,
$\chi = 1.6$
, $\triangle = 10^{-4}$
,
$\triangle = 10^{-4}$
, $\Psi = 0.02$
and
$\Psi = 0.02$
and $Pe_{v} = 1$
). (c) Variation of the average capillary velocity (
$Pe_{v} = 1$
). (c) Variation of the average capillary velocity ( $\bar {u}_{ca}$
) with time till coalescence for the left and right drops (with evaporation). The remaining dimensionless parameters in both the systems are
$\bar {u}_{ca}$
) with time till coalescence for the left and right drops (with evaporation). The remaining dimensionless parameters in both the systems are $Ste = 2.53\times 10^{-5}$
,
$Ste = 2.53\times 10^{-5}$
, $T_{v} = 1.0$
,
$T_{v} = 1.0$
, $A_{n} = 17.0$
,
$A_{n} = 17.0$
, $D_v = 10^{-3}$
,
$D_v = 10^{-3}$
, $D_{g} = 2.0$
,
$D_{g} = 2.0$
, $D_{s} = 0.9$
,
$D_{s} = 0.9$
, $\Lambda _{S} = 3.89$
,
$\Lambda _{S} = 3.89$
, $\Lambda _{W} = 0.33$
,
$\Lambda _{W} = 0.33$
, $\Lambda _{g} = 0.041$
,
$\Lambda _{g} = 0.041$
, $K = 8\times 10^{-4}$
,
$K = 8\times 10^{-4}$
, $D_{w} = 15.0$
,
$D_{w} = 15.0$
, $\epsilon =0.2$
and
$\epsilon =0.2$
and $\rho _{veR} = 1.0$
.
$\rho _{veR} = 1.0$
.
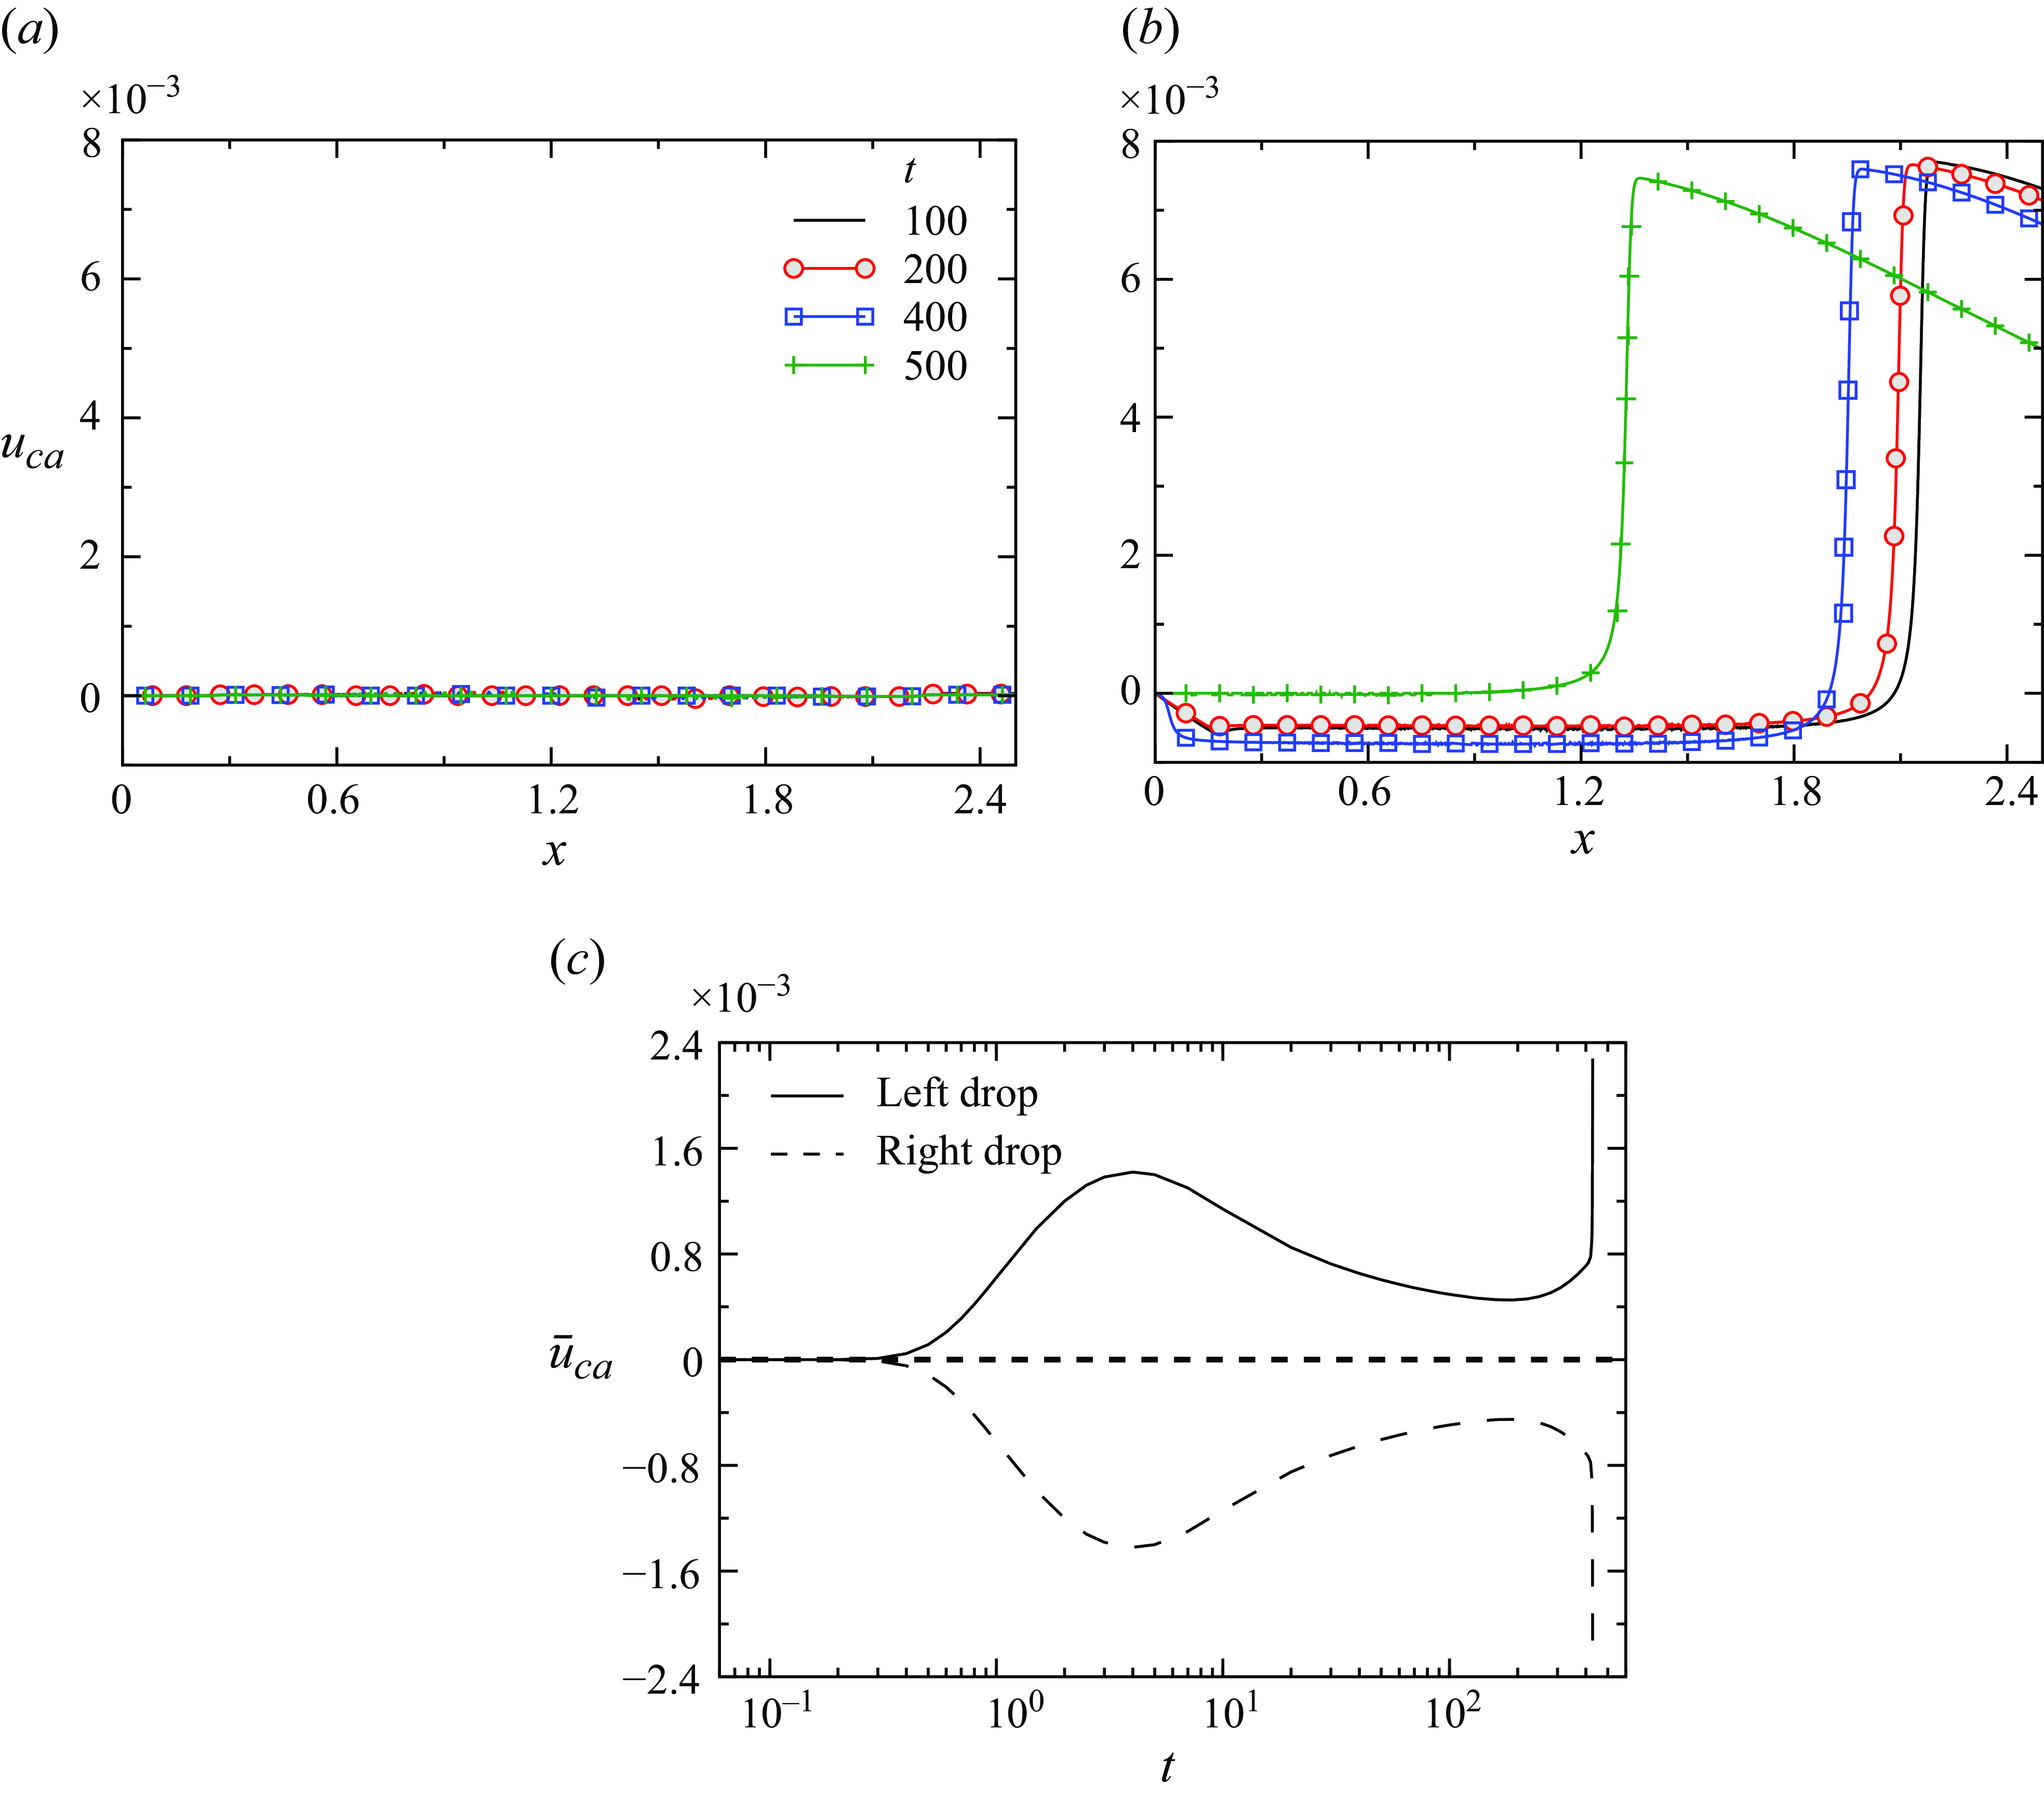
Variation of evaporation flux ( $J_v$
) in the region between the two drops at the (a) early and (b) later times. (c) Variation of the total mass of the condensate deposited in between the two drops at different times. The remaining dimensionless parameters are
$J_v$
) in the region between the two drops at the (a) early and (b) later times. (c) Variation of the total mass of the condensate deposited in between the two drops at different times. The remaining dimensionless parameters are $d_0 = 0.5$
,
$d_0 = 0.5$
, $RH = 0.90$
,
$RH = 0.90$
, $\chi = 1.6$
,
$\chi = 1.6$
, $\triangle = 10^{-4}$
,
$\triangle = 10^{-4}$
, $\Psi = 0.02$
,
$\Psi = 0.02$
, $Pe_{v} = 1$
,
$Pe_{v} = 1$
, $Ste = 2.53\times 10^{-5}$
,
$Ste = 2.53\times 10^{-5}$
, $T_{v} = 1.0$
,
$T_{v} = 1.0$
, $A_{n} = 17.0$
,
$A_{n} = 17.0$
, $D_v = 10^{-3}$
,
$D_v = 10^{-3}$
, $D_{g} = 2.0$
,
$D_{g} = 2.0$
, $D_{s} = 0.9$
,
$D_{s} = 0.9$
, $\Lambda _{S} = 3.89$
,
$\Lambda _{S} = 3.89$
, $\Lambda _{W} = 0.33$
,
$\Lambda _{W} = 0.33$
, $\Lambda _{g} = 0.041$
,
$\Lambda _{g} = 0.041$
, $K = 8\times 10^{-4}$
,
$K = 8\times 10^{-4}$
, $D_{w} = 15.0$
,
$D_{w} = 15.0$
, $\epsilon =0.2$
and
$\epsilon =0.2$
and $\rho _{veR} = 1.0$
(‘base’ parameters).
$\rho _{veR} = 1.0$
(‘base’ parameters).
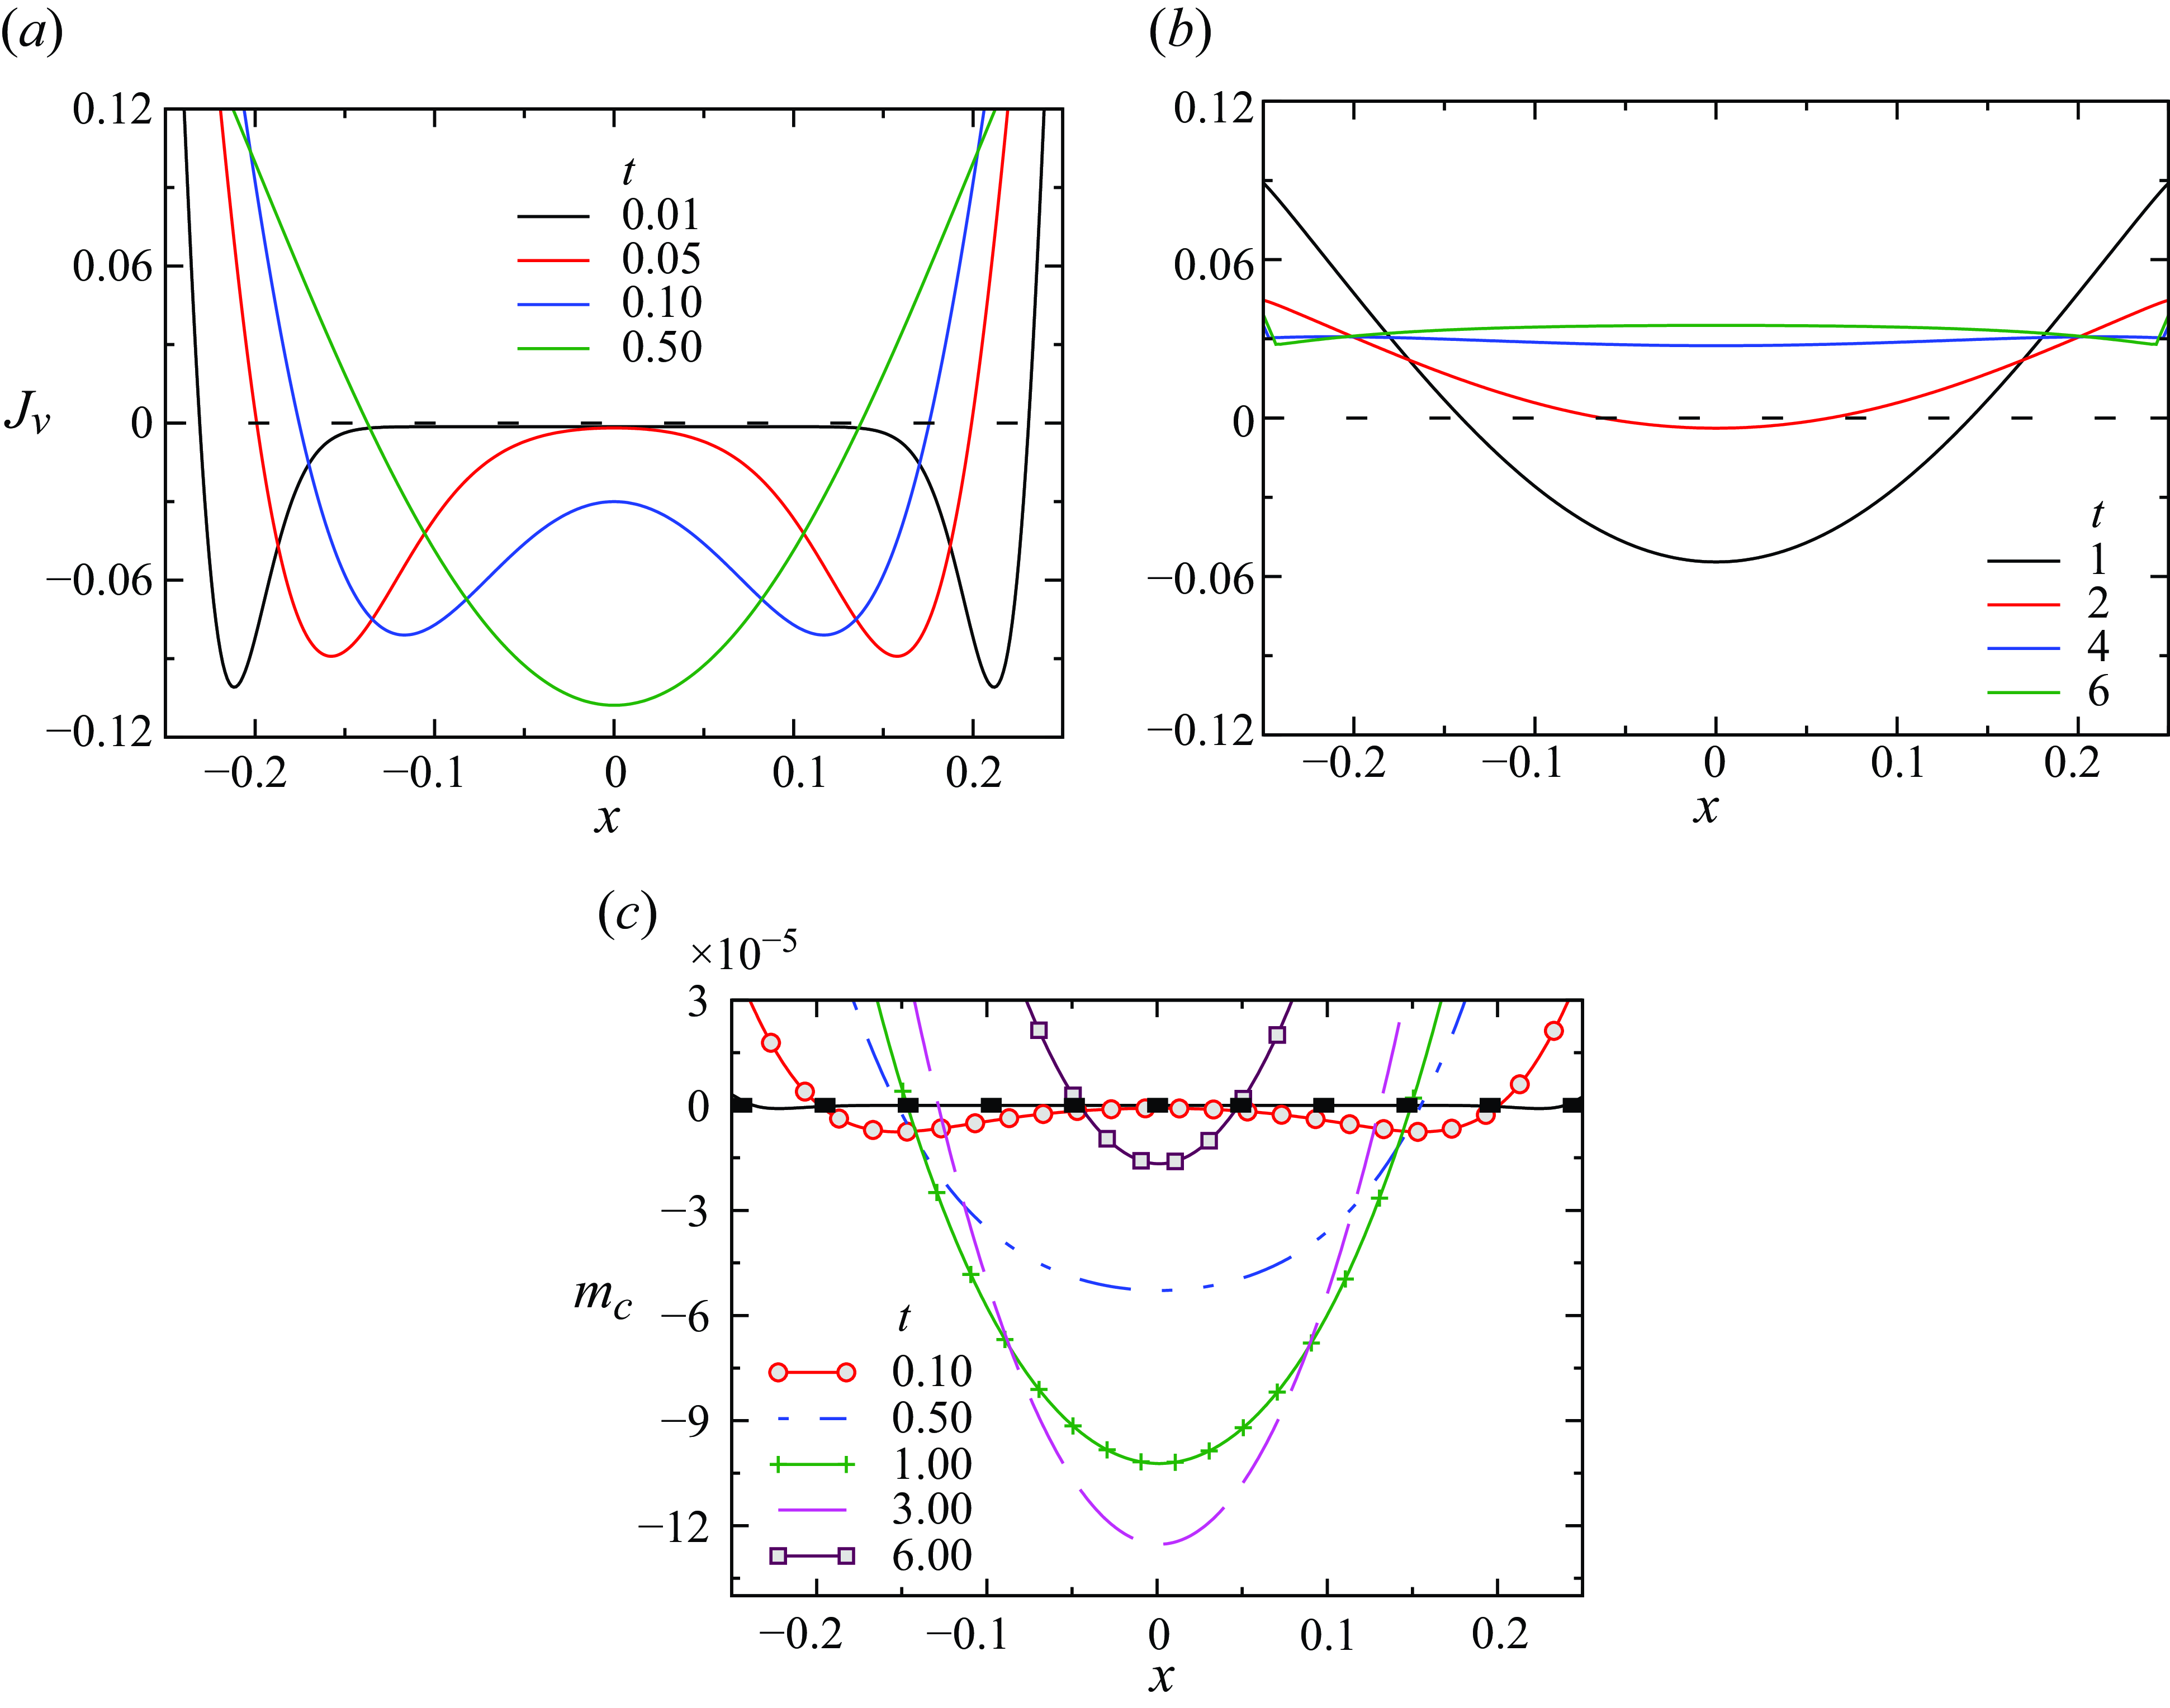
Here, $x_{cl}$
and
$x_{cl}$
and $x_{cr}$
represent the left and right contact lines of the drop. As the temperature of the unfrozen liquid remains near the melting point during the freezing process, we have not accounted in the Marangoni flow in our investigation. Consequently, the average capillary velocity of the droplet aligns with the velocity of its centre of mass. Figures 4(a) and 4(b) illustrate the variation of capillary velocity (
$x_{cr}$
represent the left and right contact lines of the drop. As the temperature of the unfrozen liquid remains near the melting point during the freezing process, we have not accounted in the Marangoni flow in our investigation. Consequently, the average capillary velocity of the droplet aligns with the velocity of its centre of mass. Figures 4(a) and 4(b) illustrate the variation of capillary velocity ( $u_{ca}(x)$
) along the substrate at different times, without and with evaporation, for the set of parameters considered in figures 2(a) and 2(b), respectively. It can be observed that while the scenario without evaporation displays negligible capillary velocity, the system undergoing evaporation exhibits a finite capillary velocity. The temporal evolution of the average capillary velocity
$u_{ca}(x)$
) along the substrate at different times, without and with evaporation, for the set of parameters considered in figures 2(a) and 2(b), respectively. It can be observed that while the scenario without evaporation displays negligible capillary velocity, the system undergoing evaporation exhibits a finite capillary velocity. The temporal evolution of the average capillary velocity $\bar {u}_{ca}$
for the left and right drops, as depicted in figure 4(c), shows a positive value for the left drop and a negative value for the right drop. This indicates migration of the drops towards each other. The asymmetry in evaporation, shown in figure 3 during the early stages
$\bar {u}_{ca}$
for the left and right drops, as depicted in figure 4(c), shows a positive value for the left drop and a negative value for the right drop. This indicates migration of the drops towards each other. The asymmetry in evaporation, shown in figure 3 during the early stages $(t \lt 5)$
, results in a notable average capillary velocity within the drop. This velocity decreases as the freezing front evolves, followed by a rapid increase at
$(t \lt 5)$
, results in a notable average capillary velocity within the drop. This velocity decreases as the freezing front evolves, followed by a rapid increase at $t \approx 430$
(figure 4
c), coinciding with the proximity of the two drops and subsequent coalescence. The following subsection provides a detailed examination of the interaction between the two drops through halos.
$t \approx 430$
(figure 4
c), coinciding with the proximity of the two drops and subsequent coalescence. The following subsection provides a detailed examination of the interaction between the two drops through halos.
3.2. Early dynamics: interaction of frost halos
In the initial stages, when evaporation is considered in the model, vapour generated by both drops due to the presence of unsaturated ambient conditions begins to condense on the substrate near their respective contact lines. The condensation in the vicinity of the drops can be identified by the negative values of evaporation ( $J_v$
), as depicted in figure 3(a). Inspection of this figure reveals that the condensate is initially deposited closer to the droplet contact lines. As time progresses, the condensate accumulated closer to the contact lines of the drops re-evaporates, and the region where the net condensate is present moves away from the contact lines, as also reported by Kavuri et al. (Reference Kavuri, Karapetsas, Sharma and Sahu2023) in the case of freezing of a single drop on a cold substrate. To understand the interactions between droplets, we examine the region close to the substrate between them
$J_v$
), as depicted in figure 3(a). Inspection of this figure reveals that the condensate is initially deposited closer to the droplet contact lines. As time progresses, the condensate accumulated closer to the contact lines of the drops re-evaporates, and the region where the net condensate is present moves away from the contact lines, as also reported by Kavuri et al. (Reference Kavuri, Karapetsas, Sharma and Sahu2023) in the case of freezing of a single drop on a cold substrate. To understand the interactions between droplets, we examine the region close to the substrate between them $(-0.25 \le x \le 0.25)$
. From figure 5(a), it is clear that in this region, condensation occurs closer to the right contact line (
$(-0.25 \le x \le 0.25)$
. From figure 5(a), it is clear that in this region, condensation occurs closer to the right contact line ( $x = -0.25$
) of the left drop and the left contact line (
$x = -0.25$
) of the left drop and the left contact line ( $x = 0.25$
) of the right drop, which can be identified by the negative value of the evaporation flux (
$x = 0.25$
) of the right drop, which can be identified by the negative value of the evaporation flux ( $J_v$
). As time progresses, as shown in figures 5(a) and 5(b), the region where the evaporation flux is negative moves away from the respective contact lines of the droplets, and for
$J_v$
). As time progresses, as shown in figures 5(a) and 5(b), the region where the evaporation flux is negative moves away from the respective contact lines of the droplets, and for $t\gt 2$
, condensation is no longer observed in the region between the two drops.
$t\gt 2$
, condensation is no longer observed in the region between the two drops.
Two-dimensional schematic representation of the top view of the left ( $x_{l}$
) and right (
$x_{l}$
) and right ( $x_{r}$
) edges of the condensate mass and the thickness of the halo (
$x_{r}$
) edges of the condensate mass and the thickness of the halo ( $d_{halo}=x_{r}-x_{l}$
) in the vicinity of the drops. (b) Temporal variation of the left (
$d_{halo}=x_{r}-x_{l}$
) in the vicinity of the drops. (b) Temporal variation of the left ( $x_{l}$
) and right (
$x_{l}$
) and right ( $x_{r}$
) ends of the condensation halo in between two drops. (c) Temporal variation of the width of the condensation halo (
$x_{r}$
) ends of the condensation halo in between two drops. (c) Temporal variation of the width of the condensation halo ( $d_{halo}$
). The remaining dimensionless parameters are
$d_{halo}$
). The remaining dimensionless parameters are $d_0 = 0.5$
,
$d_0 = 0.5$
, $RH = 0.90$
,
$RH = 0.90$
, $\chi = 1.6$
,
$\chi = 1.6$
, $\triangle = 10^{-4}$
,
$\triangle = 10^{-4}$
, $\Psi = 0.02$
,
$\Psi = 0.02$
, $Pe_{v} = 1$
,
$Pe_{v} = 1$
, $Ste = 2.53\times 10^{-5}$
,
$Ste = 2.53\times 10^{-5}$
, $T_{v} = 1.0$
,
$T_{v} = 1.0$
, $A_{n} = 17.0$
,
$A_{n} = 17.0$
, $D_v = 10^{-3}$
,
$D_v = 10^{-3}$
, $D_{g} = 2.0$
,
$D_{g} = 2.0$
, $D_{s} = 0.9$
,
$D_{s} = 0.9$
, $\Lambda _{S} = 3.89$
,
$\Lambda _{S} = 3.89$
, $\Lambda _{W} = 0.33$
,
$\Lambda _{W} = 0.33$
, $\Lambda _{g} = 0.041$
,
$\Lambda _{g} = 0.041$
, $K = 8\times 10^{-4}$
,
$K = 8\times 10^{-4}$
, $D_{w} = 15.0$
,
$D_{w} = 15.0$
, $\epsilon =0.2$
and
$\epsilon =0.2$
and $\rho _{veR} = 1.0$
(‘base’ parameters).
$\rho _{veR} = 1.0$
(‘base’ parameters).
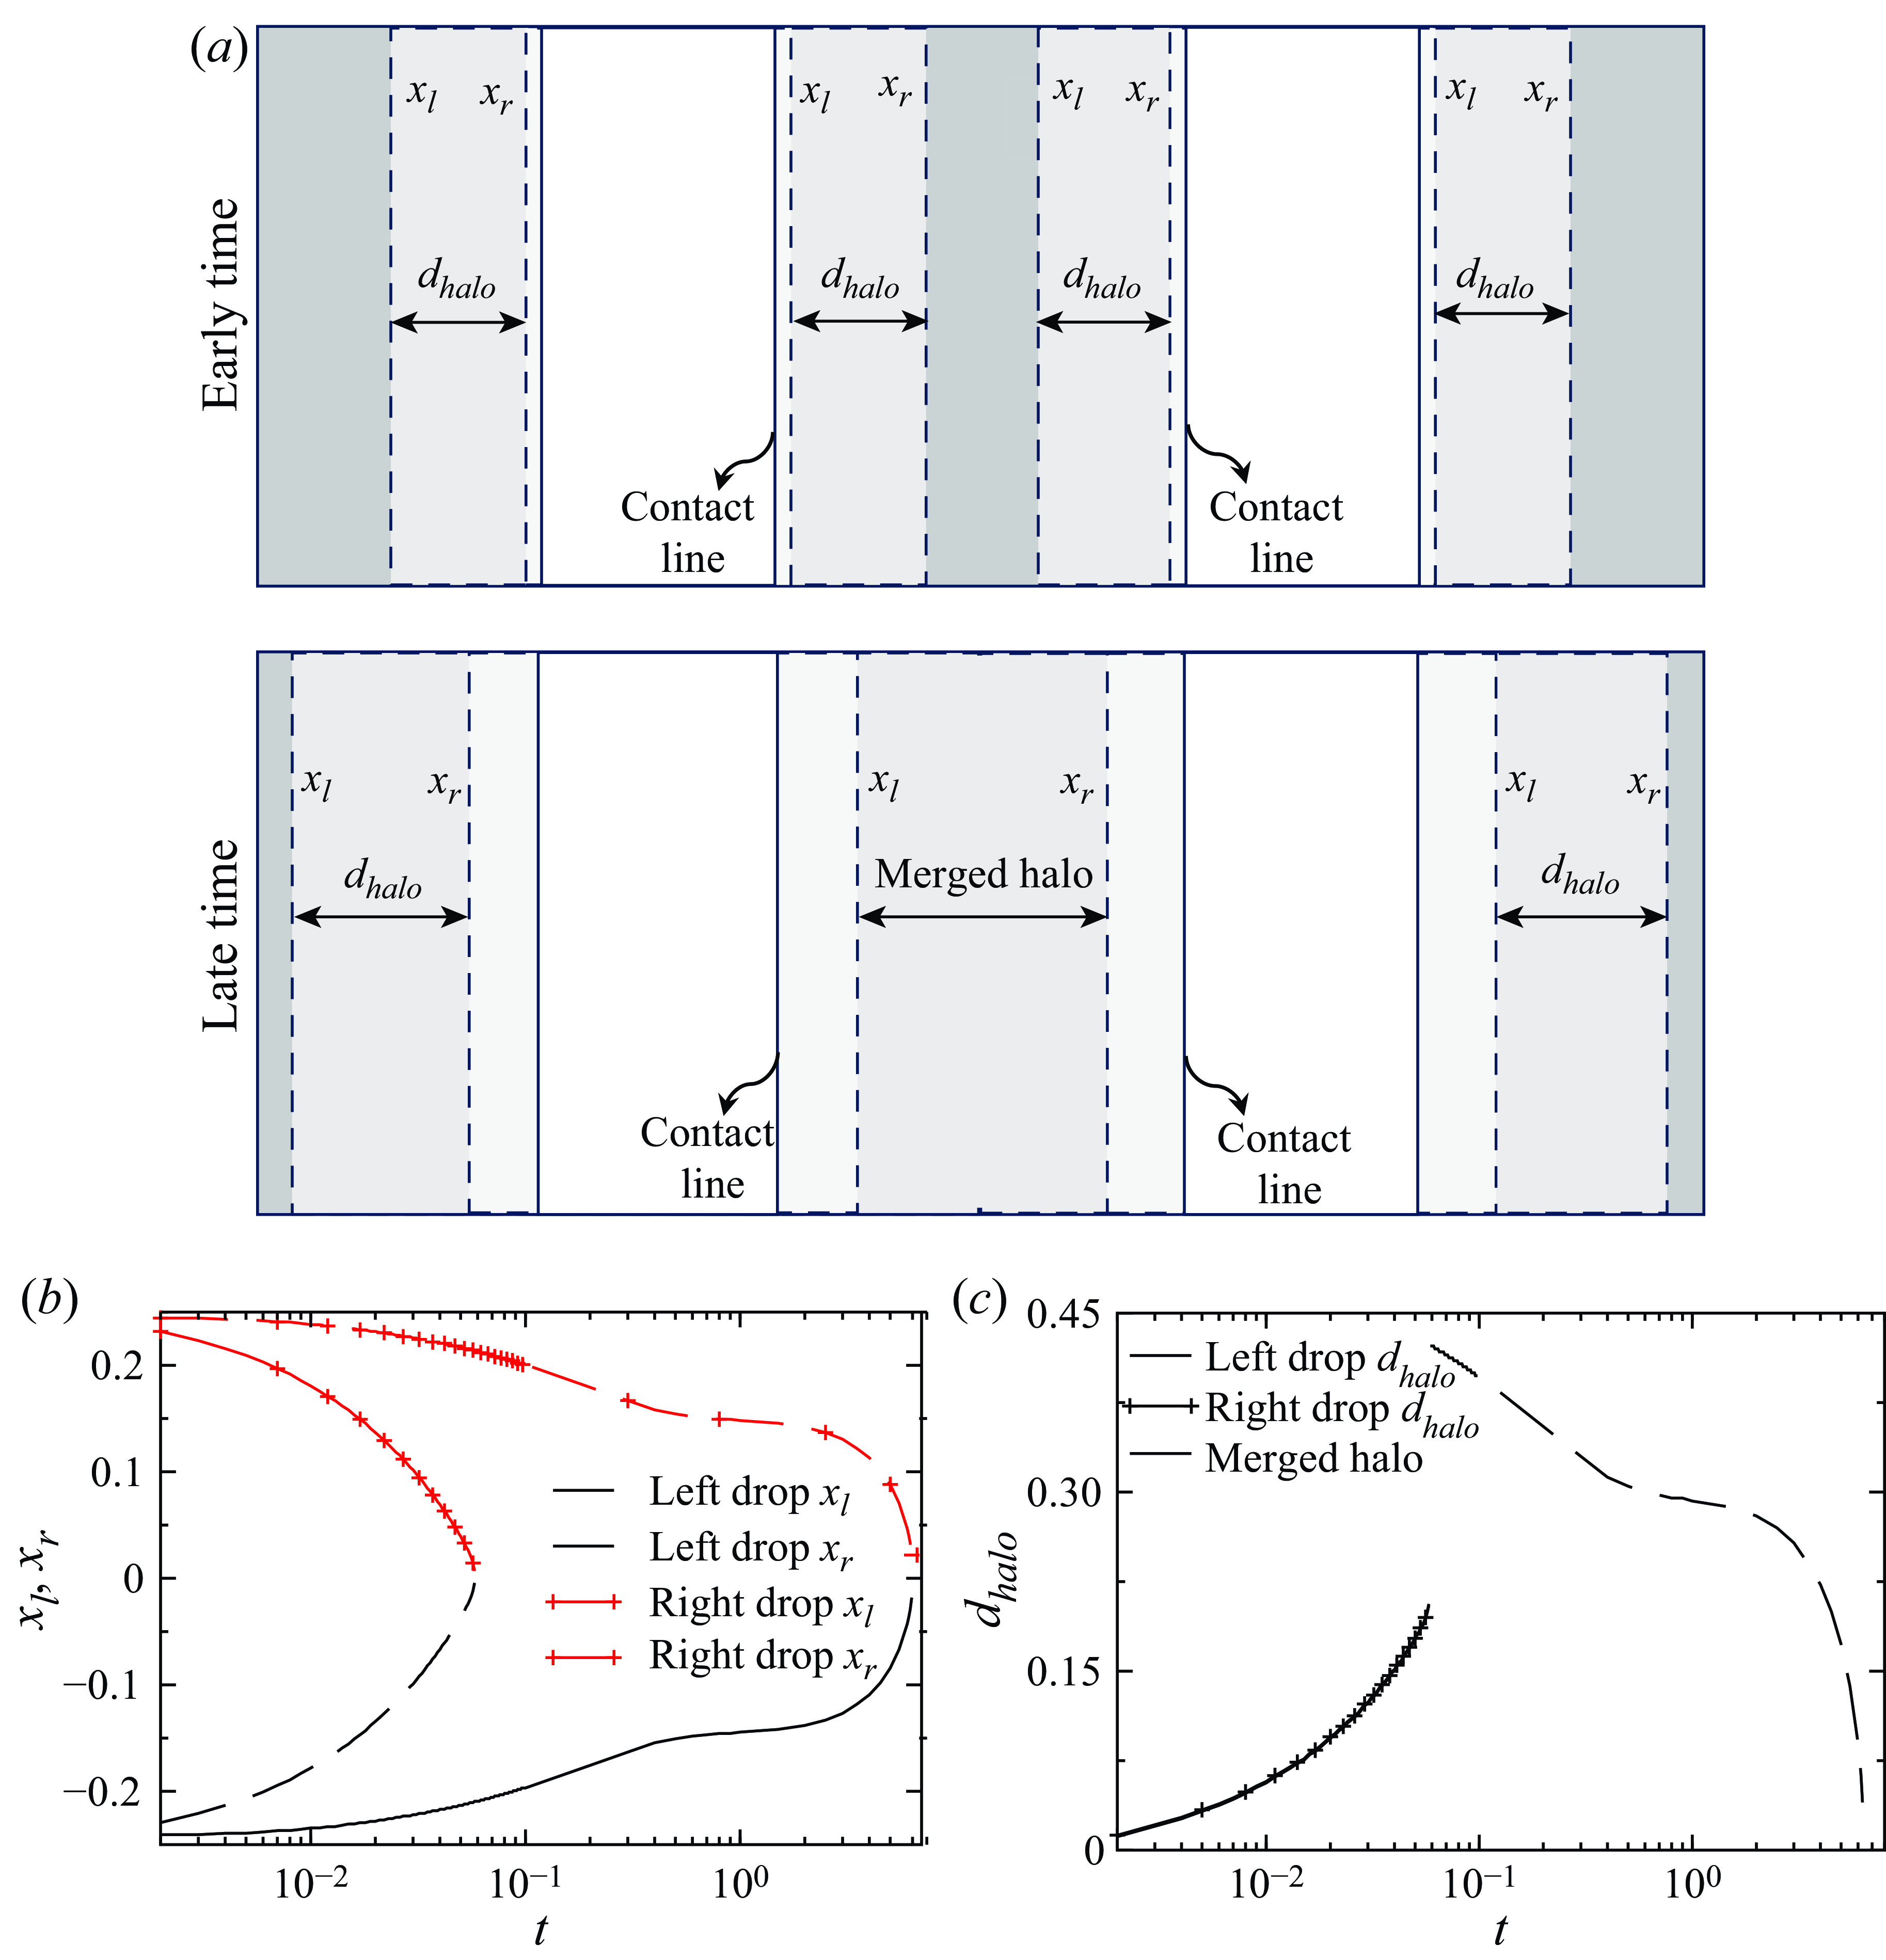
Next, we examine the interaction between the halos formed by the drops within the region separating them. We determine the net condensate mass ( $m_c$
) by numerically integrating the evaporation flux between the two drops. Initially, as depicted in figure 5(c), condensate predominantly accumulates at the contact lines (at approximately
$m_c$
) by numerically integrating the evaporation flux between the two drops. Initially, as depicted in figure 5(c), condensate predominantly accumulates at the contact lines (at approximately $x = -0.25$
and
$x = -0.25$
and $x = 0.25$
) of the respective droplets, approaching zero near the centre (
$x = 0.25$
) of the respective droplets, approaching zero near the centre ( $x = 0$
) between the droplets until
$x = 0$
) between the droplets until $t \lt 0.1$
. To comprehend these results further, figure 6(a) shows a top-view schematic illustrating the interaction between the drops through their respective halos. In this figure, solid black lines denote the contact lines of the drops, while the dashed region represents the substrate area occupied by the halos. The boundaries of this halo region, denoted by
$t \lt 0.1$
. To comprehend these results further, figure 6(a) shows a top-view schematic illustrating the interaction between the drops through their respective halos. In this figure, solid black lines denote the contact lines of the drops, while the dashed region represents the substrate area occupied by the halos. The boundaries of this halo region, denoted by $x_l$
and
$x_l$
and $x_r$
, encompass the width of the halo,
$x_r$
, encompass the width of the halo, $d_{halo}$
, defined as the separation between its left and right edges (
$d_{halo}$
, defined as the separation between its left and right edges ( $d_{halo} = x_r - x_l$
). Shifting our attention to the region between the two drops, at early times in figure 6(a), we observe that the halos of both drops remain distinct and close to their respective contact lines. Over time, the accumulated condensate re-evaporates, causing the area containing net condensate to move away from the contact lines. This phenomenon results in the formation of a merged halo in the central region between the drops at later times, as depicted in figure 6(a). The interaction of vapour between the two drops causes the merging of the right edge (
$d_{halo} = x_r - x_l$
). Shifting our attention to the region between the two drops, at early times in figure 6(a), we observe that the halos of both drops remain distinct and close to their respective contact lines. Over time, the accumulated condensate re-evaporates, causing the area containing net condensate to move away from the contact lines. This phenomenon results in the formation of a merged halo in the central region between the drops at later times, as depicted in figure 6(a). The interaction of vapour between the two drops causes the merging of the right edge ( $x_r$
) of the condensate originating from the left droplet with the left edge (
$x_r$
) of the condensate originating from the left droplet with the left edge ( $x_l$
) of the condensate originating from the right droplet, as illustrated in figure 6(b) at
$x_l$
) of the condensate originating from the right droplet, as illustrated in figure 6(b) at $t = 0.06$
. The extent of the condensate mass, indicated by negative
$t = 0.06$
. The extent of the condensate mass, indicated by negative $m_c$
values, defines the thickness of the halo (
$m_c$
values, defines the thickness of the halo ( $d_{halo}$
). Before
$d_{halo}$
). Before $t \approx 0.06$
, both drops exhibit halos of equal thickness, as depicted in figure 6(c). However, after
$t \approx 0.06$
, both drops exhibit halos of equal thickness, as depicted in figure 6(c). However, after $t \approx 0.06$
, the merging of the halos occurs, resulting in a combined halo with nearly double the maximum thickness of the individual halos, as the right edge (
$t \approx 0.06$
, the merging of the halos occurs, resulting in a combined halo with nearly double the maximum thickness of the individual halos, as the right edge ( $x_r$
) of the halo of the left droplet combines with the left edge (
$x_r$
) of the halo of the left droplet combines with the left edge ( $x_l$
) of the halo of the right droplet. As condensate accumulates, re-evaporation begins, leading to a shift in the region of condensate presence. This is also evident in the shrinking of the left droplet’s halo left edge (left drop
$x_l$
) of the halo of the right droplet. As condensate accumulates, re-evaporation begins, leading to a shift in the region of condensate presence. This is also evident in the shrinking of the left droplet’s halo left edge (left drop $x_l$
) and the right droplet’s halo right edge (right drop
$x_l$
) and the right droplet’s halo right edge (right drop $x_r$
) of the combined halo shown in figure 6(b). Additionally, the width of the merged halo decreases due to re-evaporation, as shown in figure 6(c). Ultimately, for
$x_r$
) of the combined halo shown in figure 6(b). Additionally, the width of the merged halo decreases due to re-evaporation, as shown in figure 6(c). Ultimately, for $t \gt 6$
, the condensate between the droplets evaporates in the central region.
$t \gt 6$
, the condensate between the droplets evaporates in the central region.
In the following section, we discuss the coalescence of the drops occurring at a later stage and examine the influence of the various parameters, such as relative humidity ( $RH$
), initial separation distance (
$RH$
), initial separation distance ( $d_0$
), and the temperature difference (
$d_0$
), and the temperature difference ( $\triangle T$
) between the melting temperature (
$\triangle T$
) between the melting temperature ( $T_{m} = 0\,^{\circ }$
C) and the temperature at the bottom of the substrate (
$T_{m} = 0\,^{\circ }$
C) and the temperature at the bottom of the substrate ( $T_{c}$
) on the coalescence behaviour.
$T_{c}$
) on the coalescence behaviour.
3.3. Late time dynamics – coalescence of drops
As discussed in § 3.1, the asymmetry in evaporation flux drives capillary flow, causing the two drops to migrate towards each other, and they coalesce rapidly due to their inertia. The coalescence between the drops occurs when they make contact before the evolution of the freezing front, as the capillary velocity of the drops diminishes with the advancement of the freezing front.
In the absence of evaporation and freezing, when two partially wetting drops are placed side by side with their contact lines touching $(d_0=0)$
, the liquid bridge height increases with an exponent of
$(d_0=0)$
, the liquid bridge height increases with an exponent of $2/3$
over time (Eddi et al. Reference Eddi, Winkels and Snoeijer2013; Sui et al. Reference Sui, Maglio, Spelt, Legendre and Ding2013; Varma et al. Reference Varma, Saha and Kumar2021). Using our current model for a two-dimensional (2-D) system of two partially wetting drops with a precursor layer thickness (
$2/3$
over time (Eddi et al. Reference Eddi, Winkels and Snoeijer2013; Sui et al. Reference Sui, Maglio, Spelt, Legendre and Ding2013; Varma et al. Reference Varma, Saha and Kumar2021). Using our current model for a two-dimensional (2-D) system of two partially wetting drops with a precursor layer thickness ( $\beta = 0.01$
), and neglecting evaporation and freezing, we observe that
$\beta = 0.01$
), and neglecting evaporation and freezing, we observe that $(h-s)_c$
at
$(h-s)_c$
at $x=0$
increases with time with an exponent of
$x=0$
increases with time with an exponent of $0.76$
. This growth rate decreases as the precursor layer thickness increases, as shown in figure 7(a). Additionally, in figure 7(b), we examine the influence of the initial bridge height on its growth rate while keeping the precursor layer thickness constant, revealing that the initial bridge height has a negligible effect on the coalescence process. We now shift our attention to the coalescence of two partially wetting sessile drops, taking into account both evaporation and freezing effects.
$0.76$
. This growth rate decreases as the precursor layer thickness increases, as shown in figure 7(a). Additionally, in figure 7(b), we examine the influence of the initial bridge height on its growth rate while keeping the precursor layer thickness constant, revealing that the initial bridge height has a negligible effect on the coalescence process. We now shift our attention to the coalescence of two partially wetting sessile drops, taking into account both evaporation and freezing effects.
Temporal variation of the height of the precursor layer at $x=0$
(denoted by
$x=0$
(denoted by $(h-s)_c$
) for a system of two partially wetting drops without evaporation and freezing. (a) Effect of
$(h-s)_c$
) for a system of two partially wetting drops without evaporation and freezing. (a) Effect of $\beta$
for
$\beta$
for $h_0=0$
. (b) Effect of the initial bridge height (
$h_0=0$
. (b) Effect of the initial bridge height ( $h_0$
) for
$h_0$
) for $\beta =0.01$
. The rest of the dimensionless parameters are
$\beta =0.01$
. The rest of the dimensionless parameters are $Ste = 0$
,
$Ste = 0$
, $d_0 = 0$
,
$d_0 = 0$
, $T_{v} = 1.0$
,
$T_{v} = 1.0$
, $A_{n} = 17.0$
,
$A_{n} = 17.0$
, $D_v = 10^{-3}$
,
$D_v = 10^{-3}$
, $D_{g} = 2.0$
,
$D_{g} = 2.0$
, $D_{s} = 0.9$
,
$D_{s} = 0.9$
, $\Lambda _{S} = 3.89$
,
$\Lambda _{S} = 3.89$
, $\Lambda _{W} = 0.33$
,
$\Lambda _{W} = 0.33$
, $\Lambda _{g} = 0.041$
,
$\Lambda _{g} = 0.041$
, $\chi = 0$
,
$\chi = 0$
, $RH = 1.0$
,
$RH = 1.0$
, $K = 8\times 10^{-4}$
,
$K = 8\times 10^{-4}$
, $D_{w} = 15.0$
,
$D_{w} = 15.0$
, $\epsilon =0.2$
,
$\epsilon =0.2$
, $\triangle = 0$
,
$\triangle = 0$
, $\Psi = 0$
,
$\Psi = 0$
, $\rho _{veR} = 1.0$
and
$\rho _{veR} = 1.0$
and $Pe_{v} = 0$
.
$Pe_{v} = 0$
.
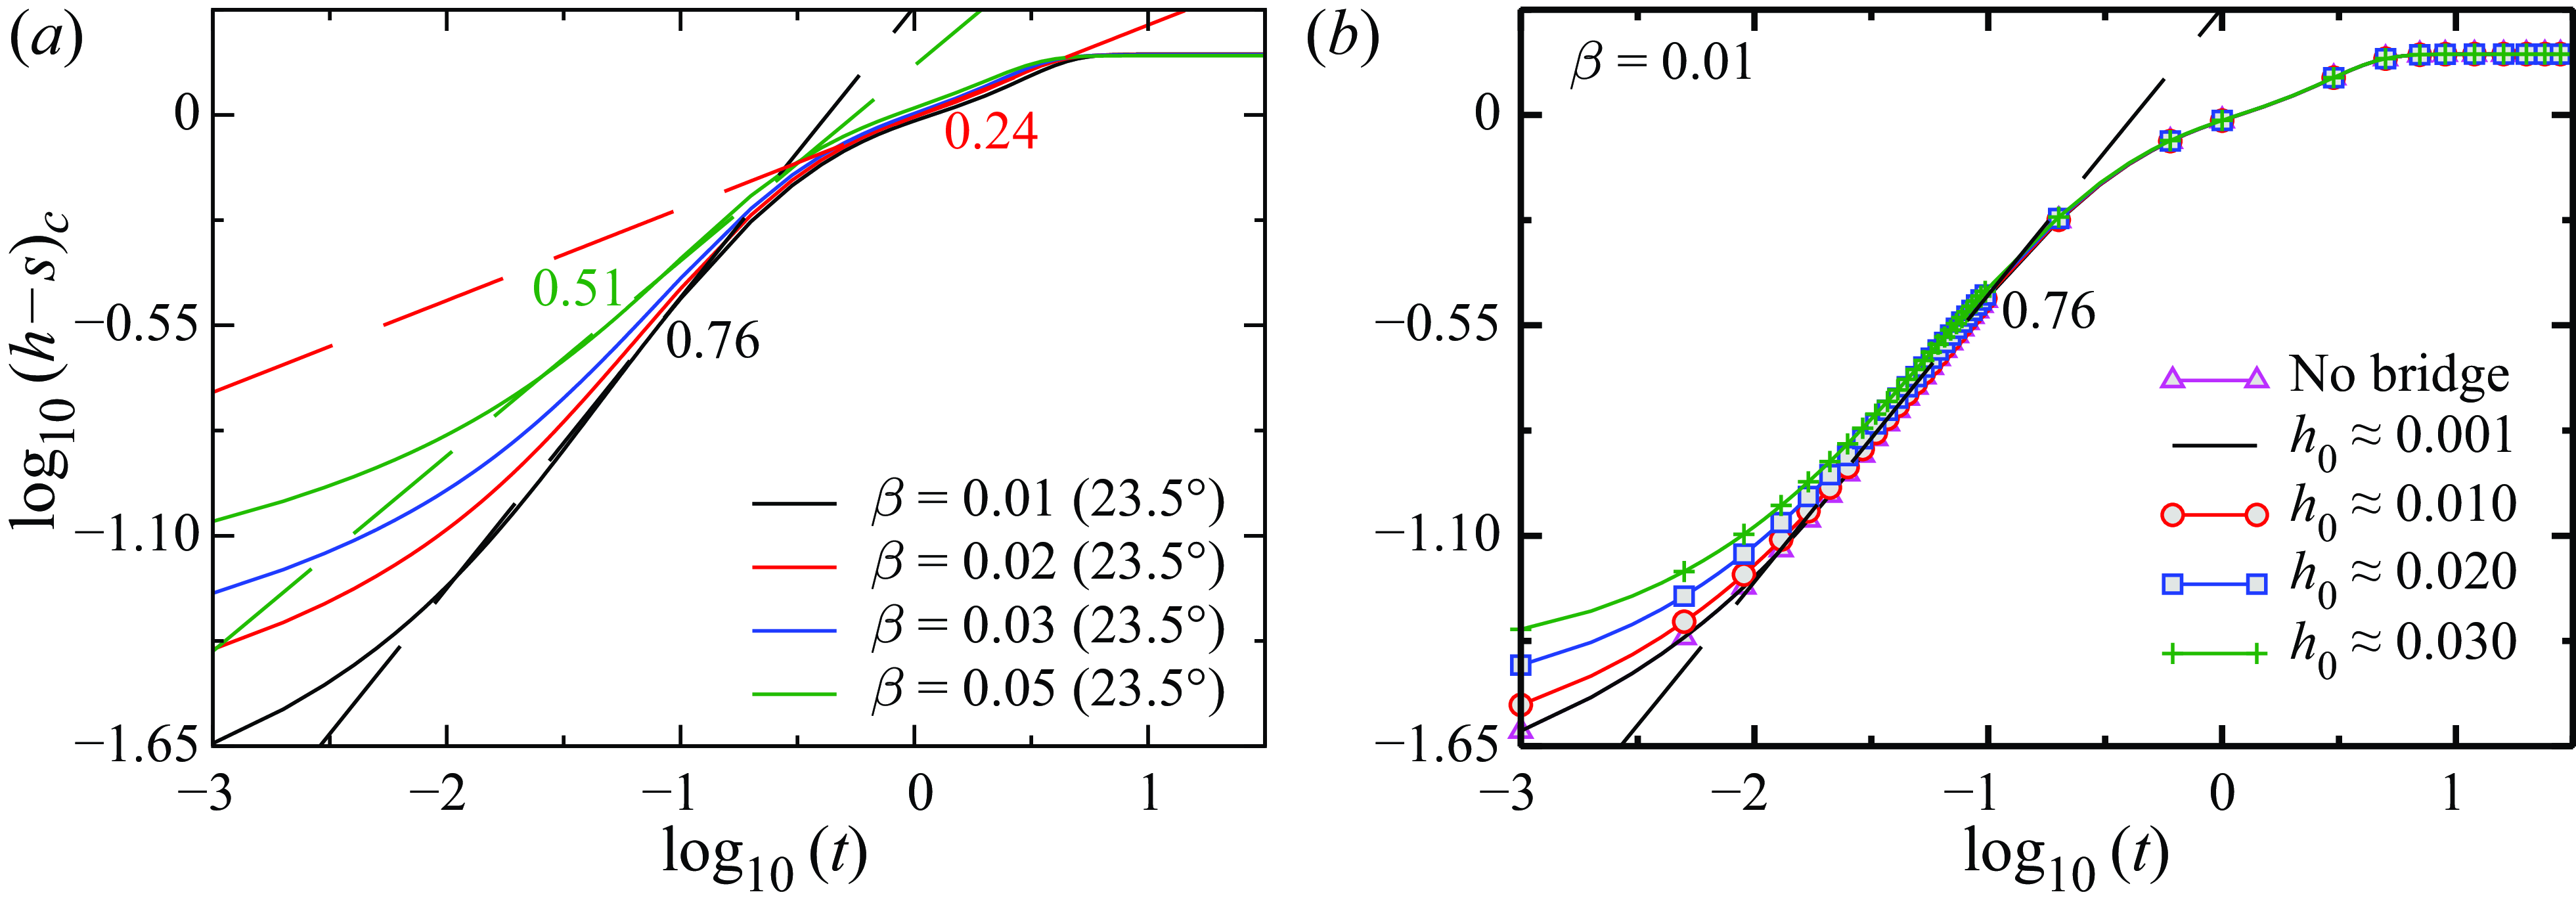
Temporal evolution of (a) the normalised separation distance $(d/d_0)$
and (b) the liquid layer height at
$(d/d_0)$
and (b) the liquid layer height at $x=0$
(denoted by
$x=0$
(denoted by $(h-s)_c$
) for different values of
$(h-s)_c$
) for different values of $RH$
. The remaining dimensionless parameters are
$RH$
. The remaining dimensionless parameters are $d_0 = 0.5$
,
$d_0 = 0.5$
, $\chi = 1.6$
,
$\chi = 1.6$
, $\triangle = 10^{-4}$
,
$\triangle = 10^{-4}$
, $\Psi = 0.02$
,
$\Psi = 0.02$
, $Pe_{v} = 1$
,
$Pe_{v} = 1$
, $Ste = 2.53\times 10^{-5}$
,
$Ste = 2.53\times 10^{-5}$
, $T_{v} = 1.0$
,
$T_{v} = 1.0$
, $A_{n} = 17.0$
,
$A_{n} = 17.0$
, $D_v = 10^{-3}$
,
$D_v = 10^{-3}$
, $D_{g} = 2.0$
,
$D_{g} = 2.0$
, $D_{s} = 0.9$
,
$D_{s} = 0.9$
, $\Lambda _{S} = 3.89$
,
$\Lambda _{S} = 3.89$
, $\Lambda _{W} = 0.33$
,
$\Lambda _{W} = 0.33$
, $\Lambda _{g} = 0.041$
,
$\Lambda _{g} = 0.041$
, $K = 8\times 10^{-4}$
,
$K = 8\times 10^{-4}$
, $D_{w} = 15.0$
,
$D_{w} = 15.0$
, $\epsilon =0.2$
and
$\epsilon =0.2$
and $\rho _{veR} = 1.0$
.
$\rho _{veR} = 1.0$
.
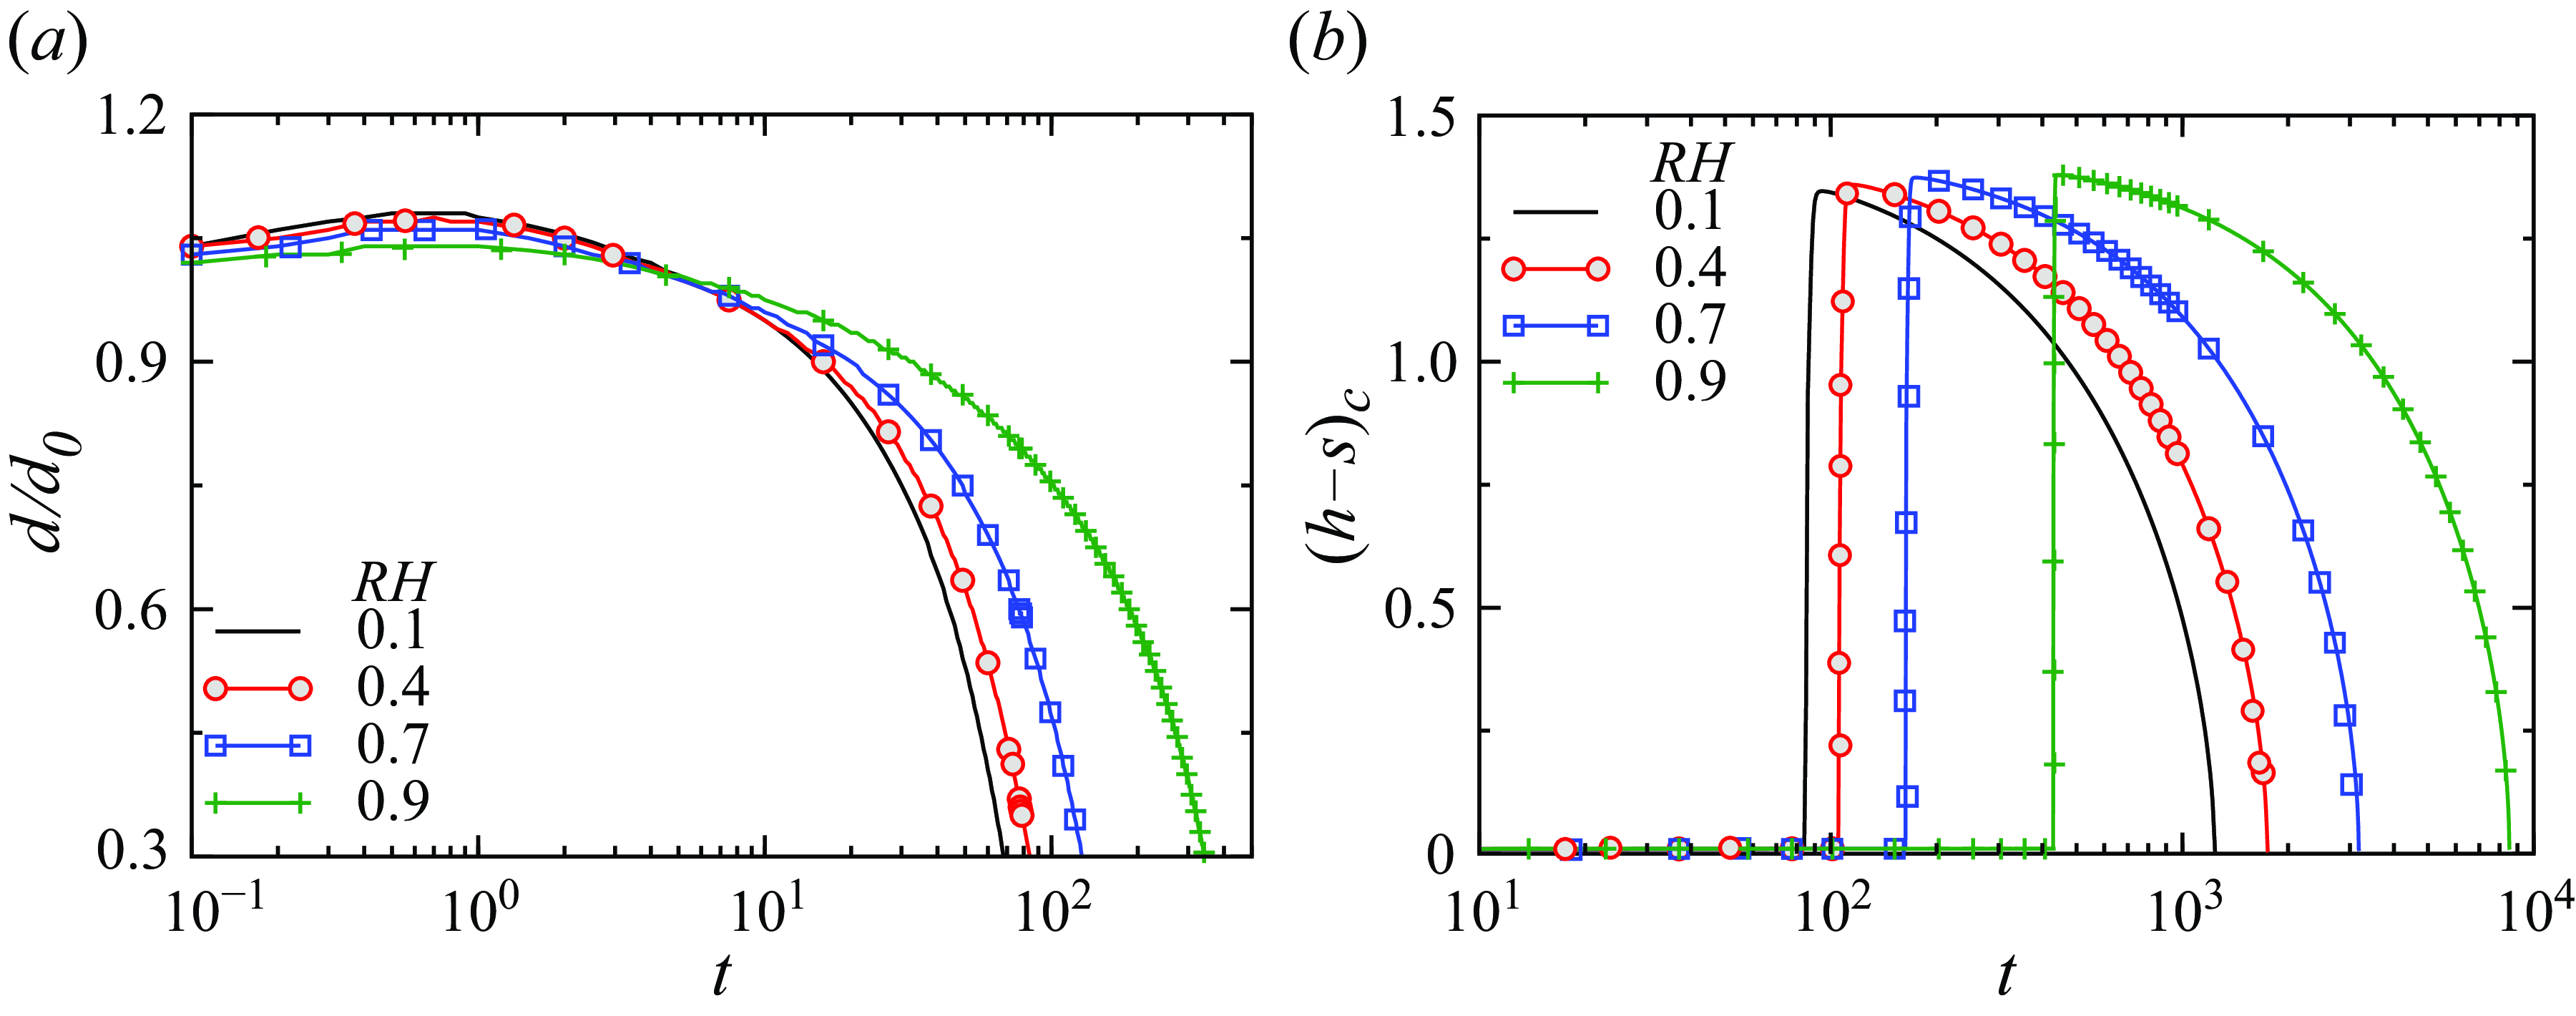
Figures 8(a) and 8(b) depict the temporal evolution of the normalised separation distance $(d/d_0)$
and height of the liquid layer (
$(d/d_0)$
and height of the liquid layer ( $(h-s)_c$
at
$(h-s)_c$
at $x=0$
) in the presence of evaporation and freezing for different values of
$x=0$
) in the presence of evaporation and freezing for different values of $RH$
. The remaining parameters are the same as the ‘base’ parameters. Figure 8(a) illustrates that an increase in relative humidity results in decreased evaporation, thereby reducing the capillary flow driven by the asymmetry in evaporation, which facilitates coalescence. Thus, it can be seen that higher relative humidity (
$RH$
. The remaining parameters are the same as the ‘base’ parameters. Figure 8(a) illustrates that an increase in relative humidity results in decreased evaporation, thereby reducing the capillary flow driven by the asymmetry in evaporation, which facilitates coalescence. Thus, it can be seen that higher relative humidity ( $RH$
) substantially extends the time for the droplets to approach each other. Conversely, the droplets migrate more rapidly at lower relative humidity, as observed in figure 8(a). Consequently, the bridge evolves more rapidly than the coalescence of two partially wetting drops when evaporation and freezing are neglected in the 2-D model, as shown in figure 8(b).
$RH$
) substantially extends the time for the droplets to approach each other. Conversely, the droplets migrate more rapidly at lower relative humidity, as observed in figure 8(a). Consequently, the bridge evolves more rapidly than the coalescence of two partially wetting drops when evaporation and freezing are neglected in the 2-D model, as shown in figure 8(b).
Temporal evolution of (a) the liquid–gas interface ( $h$
), (b) evaporation flux (
$h$
), (b) evaporation flux ( $J_v$
), (c) local relative humidity (
$J_v$
), (c) local relative humidity ( $RH_{l}$
) and (d) temperature at the liquid–gas interface (
$RH_{l}$
) and (d) temperature at the liquid–gas interface ( $T_{lh}$
) during coalescence for
$T_{lh}$
) during coalescence for $RH = 0.90$
. The remaining dimensionless parameters are
$RH = 0.90$
. The remaining dimensionless parameters are $d_0 = 0.5$
,
$d_0 = 0.5$
, $\chi = 1.6$
,
$\chi = 1.6$
, $\triangle = 10^{-4}$
,
$\triangle = 10^{-4}$
, $\Psi = 0.02$
,
$\Psi = 0.02$
, $Pe_{v} = 1$
,
$Pe_{v} = 1$
, $Ste = 2.53\times 10^{-5}$
,
$Ste = 2.53\times 10^{-5}$
, $T_{v} = 1.0$
,
$T_{v} = 1.0$
, $A_{n} = 17.0$
,
$A_{n} = 17.0$
, $D_v = 10^{-3}$
,
$D_v = 10^{-3}$
, $D_{g} = 2.0$
,
$D_{g} = 2.0$
, $D_{s} = 0.9$
,
$D_{s} = 0.9$
, $\Lambda _{S} = 3.89$
,
$\Lambda _{S} = 3.89$
, $\Lambda _{W} = 0.33$
,
$\Lambda _{W} = 0.33$
, $\Lambda _{g} = 0.041$
,
$\Lambda _{g} = 0.041$
, $K = 8\times 10^{-4}$
,
$K = 8\times 10^{-4}$
, $D_{w} = 15.0$
,
$D_{w} = 15.0$
, $\epsilon =0.2$
and
$\epsilon =0.2$
and $\rho _{veR} = 1.0$
.
$\rho _{veR} = 1.0$
.
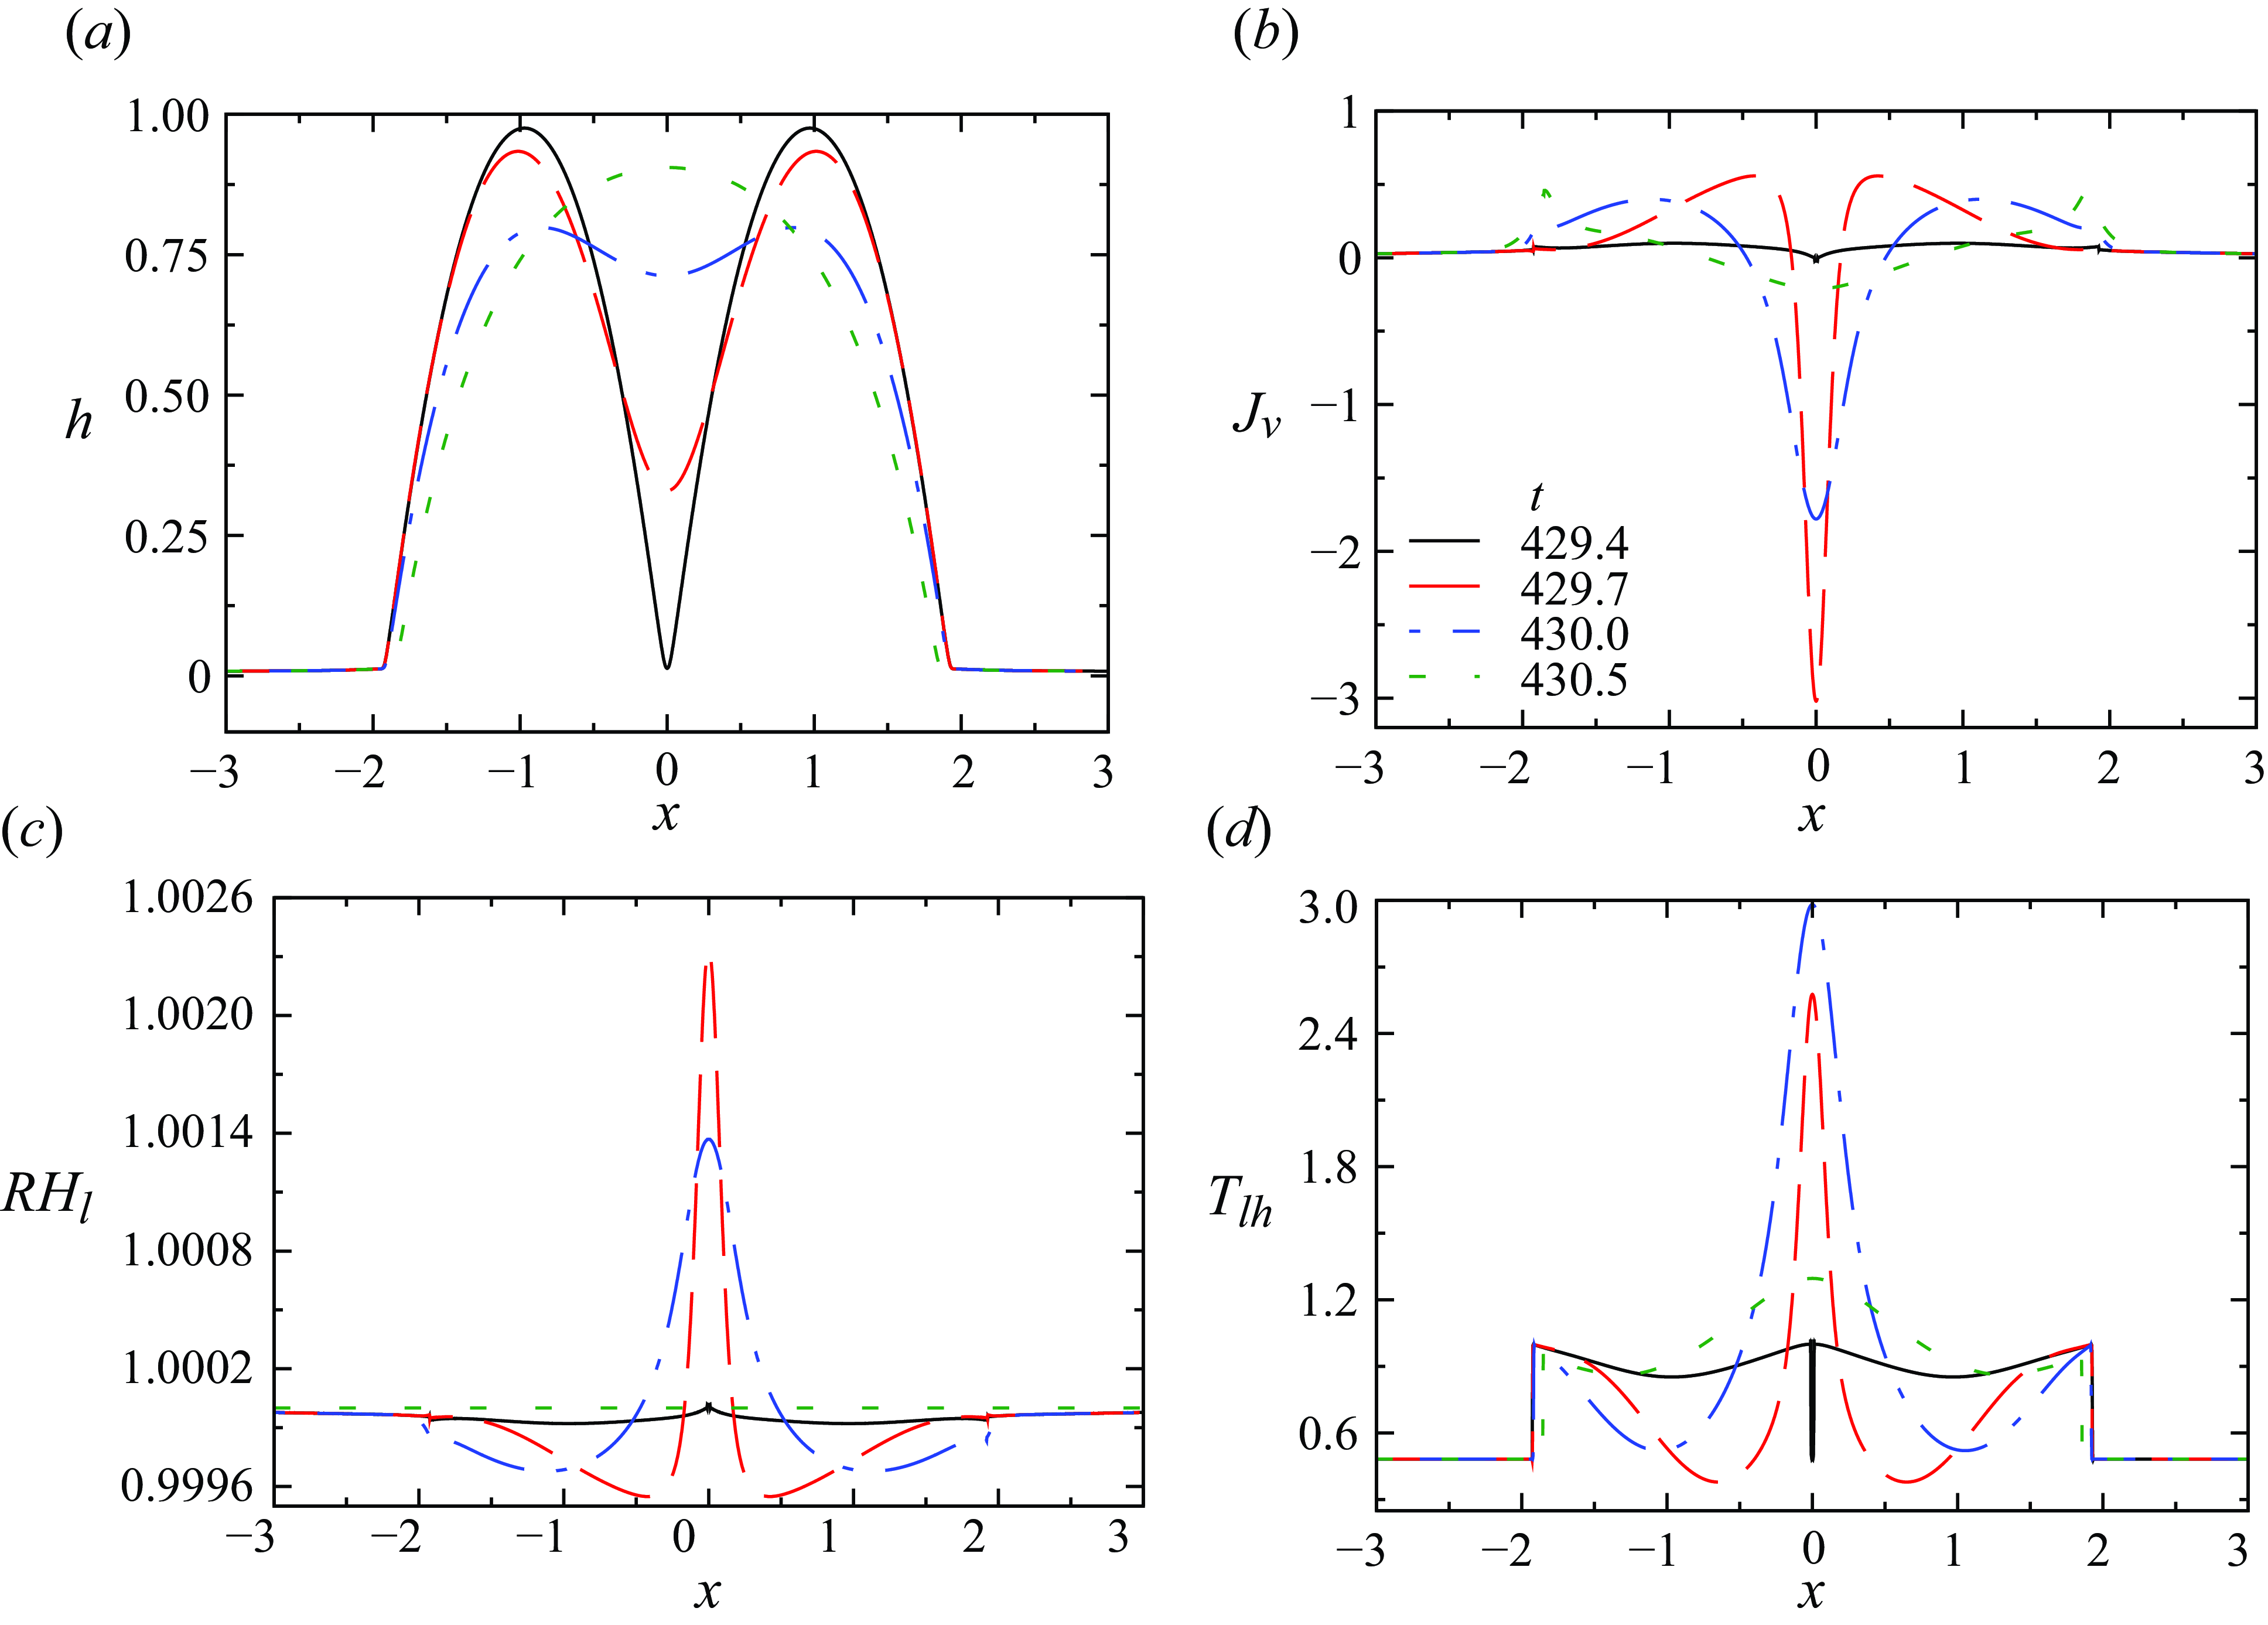
(a) Horizontal velocity field ( $u$
) along with streamlines and (b) temperature distribution (
$u$
) along with streamlines and (b) temperature distribution ( $T_l$
) at
$T_l$
) at $t = 300$
,
$t = 300$
, $400$
,
$400$
, $429.7$
,
$429.7$
, $430$
and
$430$
and $430.5$
for
$430.5$
for $RH = 0.90$
. The enlarged views of the velocity and streamline contours are presented for
$RH = 0.90$
. The enlarged views of the velocity and streamline contours are presented for $t = 300$
and
$t = 300$
and $t = 400$
to highlight the asymmetrical patterns near the inner and outer edges of the droplets. The remaining dimensionless parameters are
$t = 400$
to highlight the asymmetrical patterns near the inner and outer edges of the droplets. The remaining dimensionless parameters are $d_0 = 0.5$
,
$d_0 = 0.5$
, $\chi = 1.6$
,
$\chi = 1.6$
, $\triangle = 10^{-4}$
,
$\triangle = 10^{-4}$
, $\Psi = 0.02$
,
$\Psi = 0.02$
, $Pe_{v} = 1$
,
$Pe_{v} = 1$
, $Ste = 2.53\times 10^{-5}$
,
$Ste = 2.53\times 10^{-5}$
, $T_{v} = 1.0$
,
$T_{v} = 1.0$
, $A_{n} = 17.0$
,
$A_{n} = 17.0$
, $D_v = 10^{-3}$
,
$D_v = 10^{-3}$
, $D_{g} = 2.0$
,
$D_{g} = 2.0$
, $D_{s} = 0.9$
,
$D_{s} = 0.9$
, $\Lambda _{S} = 3.89$
,
$\Lambda _{S} = 3.89$
, $\Lambda _{W} = 0.33$
,
$\Lambda _{W} = 0.33$
, $\Lambda _{g} = 0.041$
,
$\Lambda _{g} = 0.041$
, $K = 8\times 10^{-4}$
,
$K = 8\times 10^{-4}$
, $D_{w} = 15.0$
,
$D_{w} = 15.0$
, $\epsilon =0.2$
and
$\epsilon =0.2$
and $\rho _{veR} = 1.0$
.
$\rho _{veR} = 1.0$
.
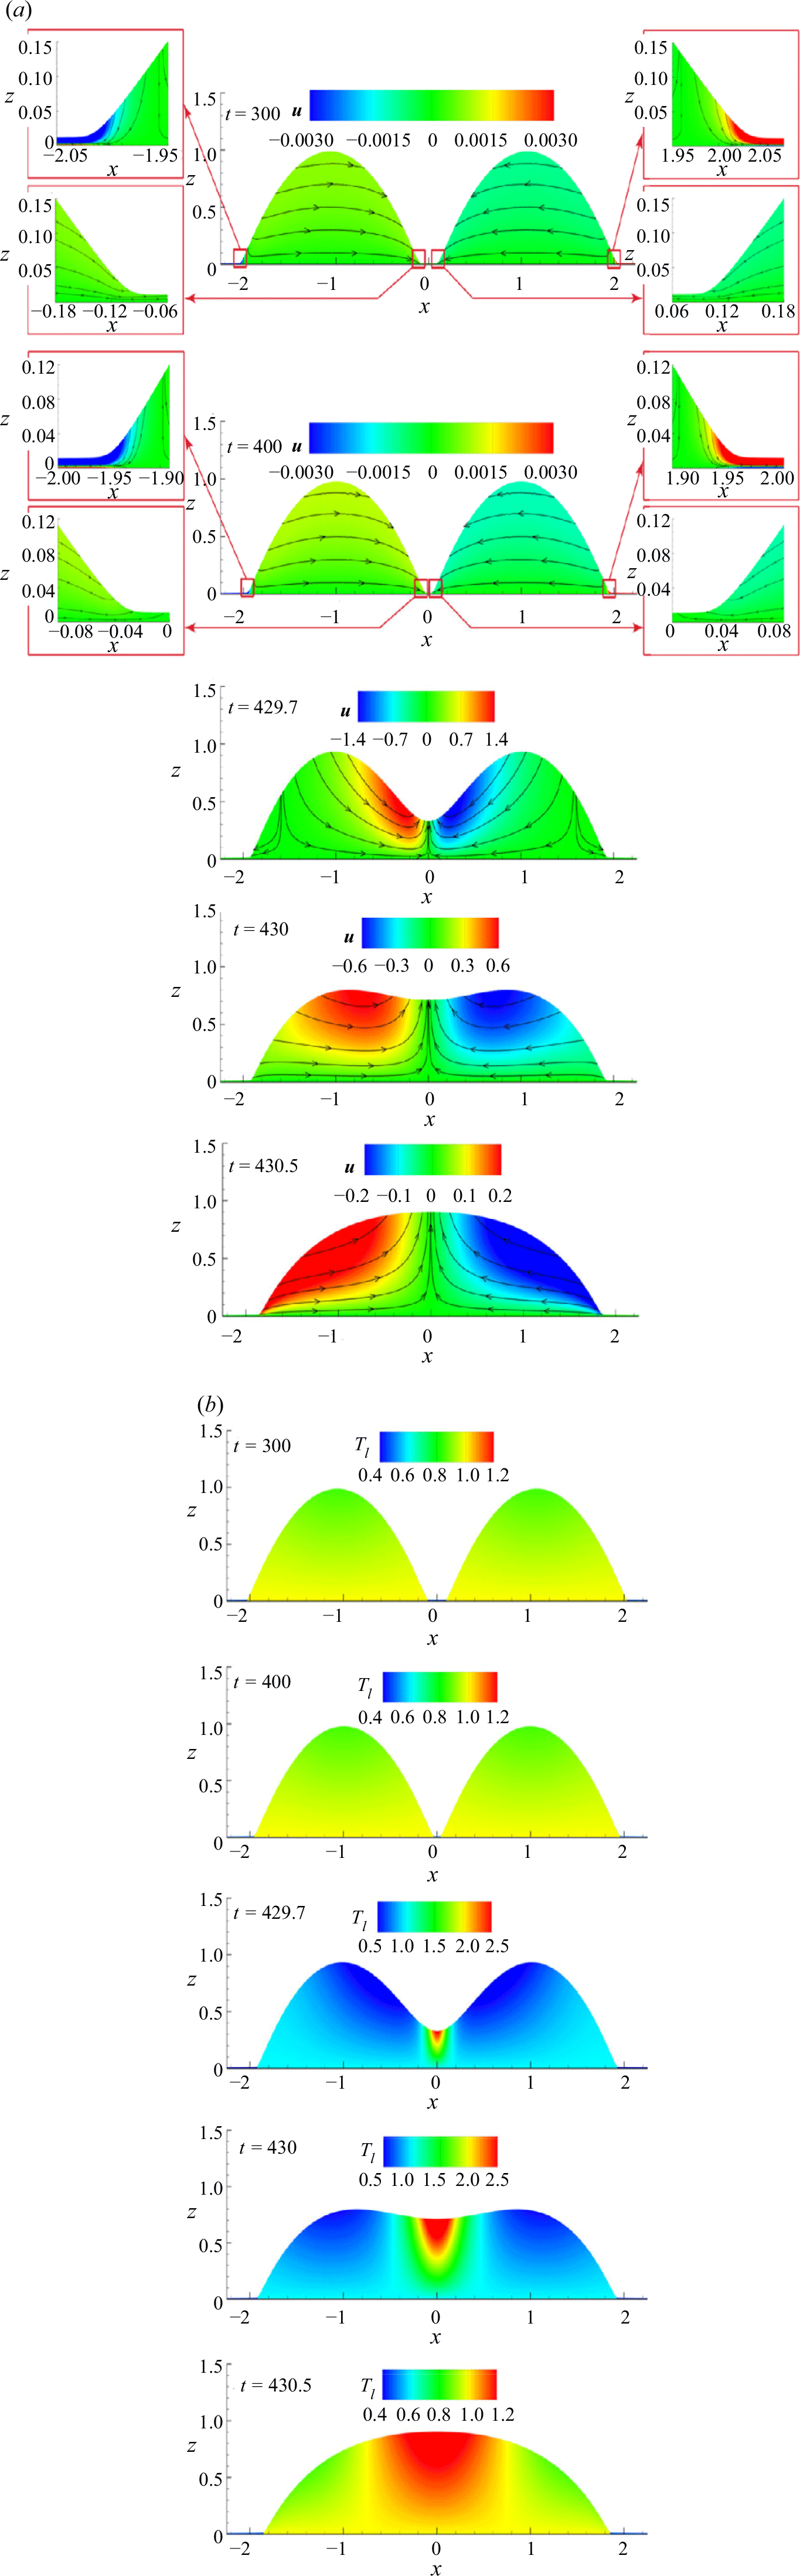
Figure 9(a) presents the shape of the drops ( $h$
) during the coalescence for relative humidity
$h$
) during the coalescence for relative humidity $RH = 0.9$
, where the initial separation between the two drops is
$RH = 0.9$
, where the initial separation between the two drops is $d_0 = 0.5$
, with all other parameters consistent with those considered in figure 8. As the droplets approach each other, coalescence begins, and the local relative humidity in the coalescence region increases significantly, leading to substantial condensation, as demonstrated in figure 9(b). The rise in local relative humidity (
$d_0 = 0.5$
, with all other parameters consistent with those considered in figure 8. As the droplets approach each other, coalescence begins, and the local relative humidity in the coalescence region increases significantly, leading to substantial condensation, as demonstrated in figure 9(b). The rise in local relative humidity ( $RH_l$
) during the coalescence process can be observed in figure 9(c). Note that although the increase in local relative humidity may seem minor, given the substantially small value of the dimensionless number
$RH_l$
) during the coalescence process can be observed in figure 9(c). Note that although the increase in local relative humidity may seem minor, given the substantially small value of the dimensionless number $K=8 \times 10^{-4}$
(2.51) associated with the equilibrium condition at the interface (2.49), even slight changes have a significant impact on the evaporation flux. As local relative humidity increases, vapour transitions from the gas phase to the liquid phase, releasing latent heat absorbed by the liquid–gas interface and the surroundings. This increase in temperature during coalescence due to condensation is depicted in figure 9(d). In figure 9(d), an increase in temperature at
$K=8 \times 10^{-4}$
(2.51) associated with the equilibrium condition at the interface (2.49), even slight changes have a significant impact on the evaporation flux. As local relative humidity increases, vapour transitions from the gas phase to the liquid phase, releasing latent heat absorbed by the liquid–gas interface and the surroundings. This increase in temperature during coalescence due to condensation is depicted in figure 9(d). In figure 9(d), an increase in temperature at $x = 0$
is observed due to condensation, followed by a decrease when condensation significantly diminishes. The rise in local relative humidity and subsequent condensation result in a very rapid coalescence of the drops.
$x = 0$
is observed due to condensation, followed by a decrease when condensation significantly diminishes. The rise in local relative humidity and subsequent condensation result in a very rapid coalescence of the drops.
The velocity and temperature fields before and during coalescence for the parameters considered in figure 9 are analysed in figures 10(a) and 10(b), respectively. It depicts the flow dynamics at four stages of coalescence: before coalescence ( $t = 300, 400$
), early coalescence (
$t = 300, 400$
), early coalescence ( $t = 429.7$
), intermediate stage (
$t = 429.7$
), intermediate stage ( $t = 430$
) and final stage of coalescence (
$t = 430$
) and final stage of coalescence ( $t = 430.5$
). In figure 10(a), it can be observed that before coalescence at
$t = 430.5$
). In figure 10(a), it can be observed that before coalescence at $t = 300$
and
$t = 300$
and $t = 400$
, there is more evaporation occurring at the outer edges of the droplets than at the inner edges, as highlighted in the enlarged panels in figure 10(a). This creates a replenishing flow towards the outer edge, while the overall capillary flow remains directed towards the inner edges, driving the drops closer together. Additionally, the temperature contours at
$t = 400$
, there is more evaporation occurring at the outer edges of the droplets than at the inner edges, as highlighted in the enlarged panels in figure 10(a). This creates a replenishing flow towards the outer edge, while the overall capillary flow remains directed towards the inner edges, driving the drops closer together. Additionally, the temperature contours at $t = 300$
and
$t = 300$
and $t = 400$
shown in figure 10(b) indicate that before the coalescence of the two drops, their temperatures are close to their melting point. At the early stage of coalescence (
$t = 400$
shown in figure 10(b) indicate that before the coalescence of the two drops, their temperatures are close to their melting point. At the early stage of coalescence ( $t = 429.7$
), the flow is directed towards the coalescence bridge formed between the drops, leading to its rapid growth. The approach velocity of the drops is highest near this central region of the coalescence bridge. By the intermediate stage (
$t = 429.7$
), the flow is directed towards the coalescence bridge formed between the drops, leading to its rapid growth. The approach velocity of the drops is highest near this central region of the coalescence bridge. By the intermediate stage ( $t = 430$
), the bridge height increases considerably, and the flow distribution becomes more spread near the centre, rather than being concentrated directly at the centre as initially observed. As the bridge continues to grow, the droplet minimises its surface energy by reducing its surface area, resulting in a higher
$t = 430$
), the bridge height increases considerably, and the flow distribution becomes more spread near the centre, rather than being concentrated directly at the centre as initially observed. As the bridge continues to grow, the droplet minimises its surface energy by reducing its surface area, resulting in a higher $u$
velocity near the contact line. As droplets merge, the accumulating vapour near the coalescence region increases the local relative humidity, leading to condensation and a rise in temperature at the coalescence region, as shown in figure 10(b). This increase in local relative humidity is also evident in figure 9(c). This rise in local relative humidity (
$u$
velocity near the contact line. As droplets merge, the accumulating vapour near the coalescence region increases the local relative humidity, leading to condensation and a rise in temperature at the coalescence region, as shown in figure 10(b). This increase in local relative humidity is also evident in figure 9(c). This rise in local relative humidity ( $RH_l$
) causes the vapour to condense from the gas phase to the liquid phase, releasing latent heat that is absorbed by the liquid–gas interface and the surrounding environment. This increase in temperature due to condensation is evident at the bridge between the droplets, as shown in figure 10(b). At
$RH_l$
) causes the vapour to condense from the gas phase to the liquid phase, releasing latent heat that is absorbed by the liquid–gas interface and the surrounding environment. This increase in temperature due to condensation is evident at the bridge between the droplets, as shown in figure 10(b). At $t = 429.7$
, the temperature rise is primarily observed at the bridge due to the relatively low ambient and substrate temperatures. As coalescence progresses (
$t = 429.7$
, the temperature rise is primarily observed at the bridge due to the relatively low ambient and substrate temperatures. As coalescence progresses ( $t = 430.5$
), the temperature increases slowly throughout the drop, with the maximum temperature occurring at the centre. The thermal conductivity of the substrate is similar to PMMA, and both the ambient and substrate temperatures are close to the freezing point of water, leading to a slower propagation of the freezing front compared with the evaporation rate. As detailed in § 3.3, a significant evolution of the freezing front can restrict the movement of the contact line, hindering coalescence. This is reflected in figure 11, where the dash-dotted line representing the freezing front did not advance significantly, allowing the coalescence of the drops. The temperature increase at the bridge during coalescence due to condensation resulted in a slightly less advanced freezing front at the centre.
$t = 430.5$
), the temperature increases slowly throughout the drop, with the maximum temperature occurring at the centre. The thermal conductivity of the substrate is similar to PMMA, and both the ambient and substrate temperatures are close to the freezing point of water, leading to a slower propagation of the freezing front compared with the evaporation rate. As detailed in § 3.3, a significant evolution of the freezing front can restrict the movement of the contact line, hindering coalescence. This is reflected in figure 11, where the dash-dotted line representing the freezing front did not advance significantly, allowing the coalescence of the drops. The temperature increase at the bridge during coalescence due to condensation resulted in a slightly less advanced freezing front at the centre.
Temporal evolution of the liquid–gas interface (solid line) and freezing front (dash-dotted line) at (a) $t = 429.7$
, (b)
$t = 429.7$
, (b) $430$
and (c)
$430$
and (c) $430.5$
during coalescence for
$430.5$
during coalescence for $RH = 0.90$
. The remaining dimensionless parameters are
$RH = 0.90$
. The remaining dimensionless parameters are $d_0 = 0.5$
,
$d_0 = 0.5$
, $\chi = 1.6$
,
$\chi = 1.6$
, $\triangle = 10^{-4}$
,
$\triangle = 10^{-4}$
, $\Psi = 0.02$
,
$\Psi = 0.02$
, $Pe_{v} = 1$
,
$Pe_{v} = 1$
, $Ste = 2.53\times 10^{-5}$
,
$Ste = 2.53\times 10^{-5}$
, $T_{v} = 1.0$
,
$T_{v} = 1.0$
, $A_{n} = 17.0$
,
$A_{n} = 17.0$
, $D_v = 10^{-3}$
,
$D_v = 10^{-3}$
, $D_{g} = 2.0$
,
$D_{g} = 2.0$
, $D_{s} = 0.9$
,
$D_{s} = 0.9$
, $\Lambda _{S} = 3.89$
,
$\Lambda _{S} = 3.89$
, $\Lambda _{W} = 0.33$
,
$\Lambda _{W} = 0.33$
, $\Lambda _{g} = 0.041$
,
$\Lambda _{g} = 0.041$
, $K = 8\times 10^{-4}$
,
$K = 8\times 10^{-4}$
, $D_{w} = 15.0$
,
$D_{w} = 15.0$
, $\epsilon =0.2$
and
$\epsilon =0.2$
and $\rho _{veR} = 1.0$
.
$\rho _{veR} = 1.0$
.
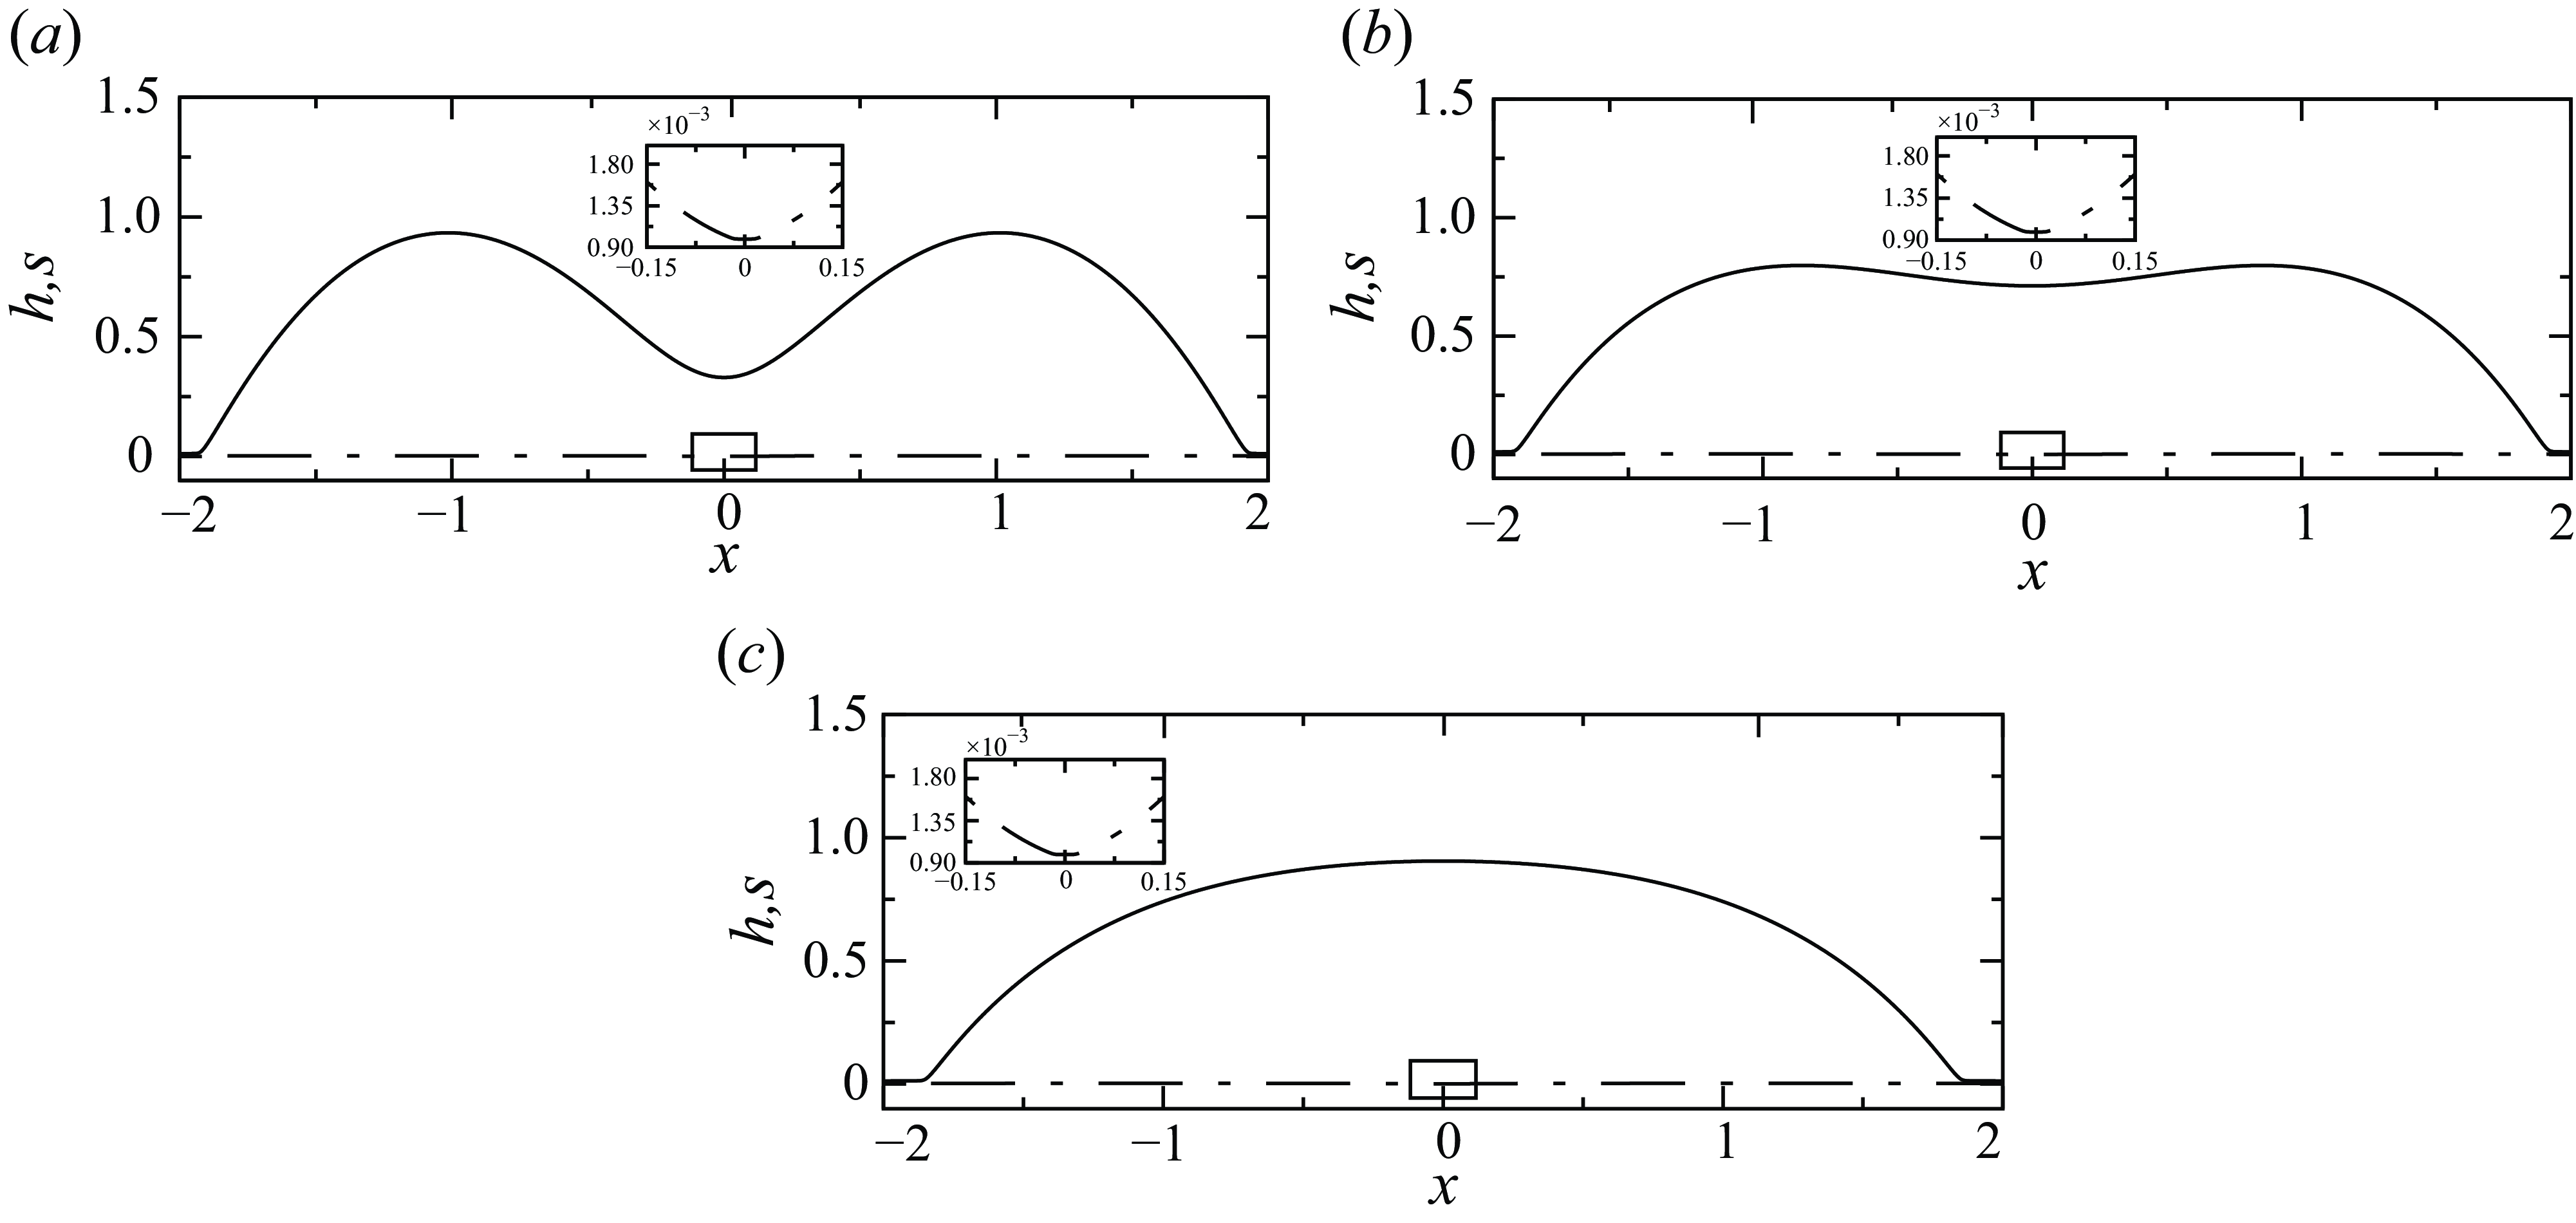
Phase diagram demarcating the coalescence and no coalescence regimes in $d_0 - RH$
space for (a)
$d_0 - RH$
space for (a) $\triangle {T} = 0.3\,^{\circ }$
C (
$\triangle {T} = 0.3\,^{\circ }$
C ( $Ste = 2.53\times 10^{-5}$
,
$Ste = 2.53\times 10^{-5}$
, $\chi = 1.6$
and
$\chi = 1.6$
and $\Psi = 0.02$
) and (b)
$\Psi = 0.02$
) and (b) $\triangle {T} = 1.2\,^{\circ }$
C (
$\triangle {T} = 1.2\,^{\circ }$
C ( $Ste = 10^{-4}$
,
$Ste = 10^{-4}$
, $\chi = 0.4$
and
$\chi = 0.4$
and $\Psi = 0.085$
). (c) Phase diagram in
$\Psi = 0.085$
). (c) Phase diagram in $d_0-\triangle {T}$
space for
$d_0-\triangle {T}$
space for $RH = 0.6$
. Here,
$RH = 0.6$
. Here, $\triangle {T}$
denotes the temperature difference between the bottom of the substrate and the melting point temperature. The rest of the dimensionless parameters are the same as the ‘base’ parameters.
$\triangle {T}$
denotes the temperature difference between the bottom of the substrate and the melting point temperature. The rest of the dimensionless parameters are the same as the ‘base’ parameters.
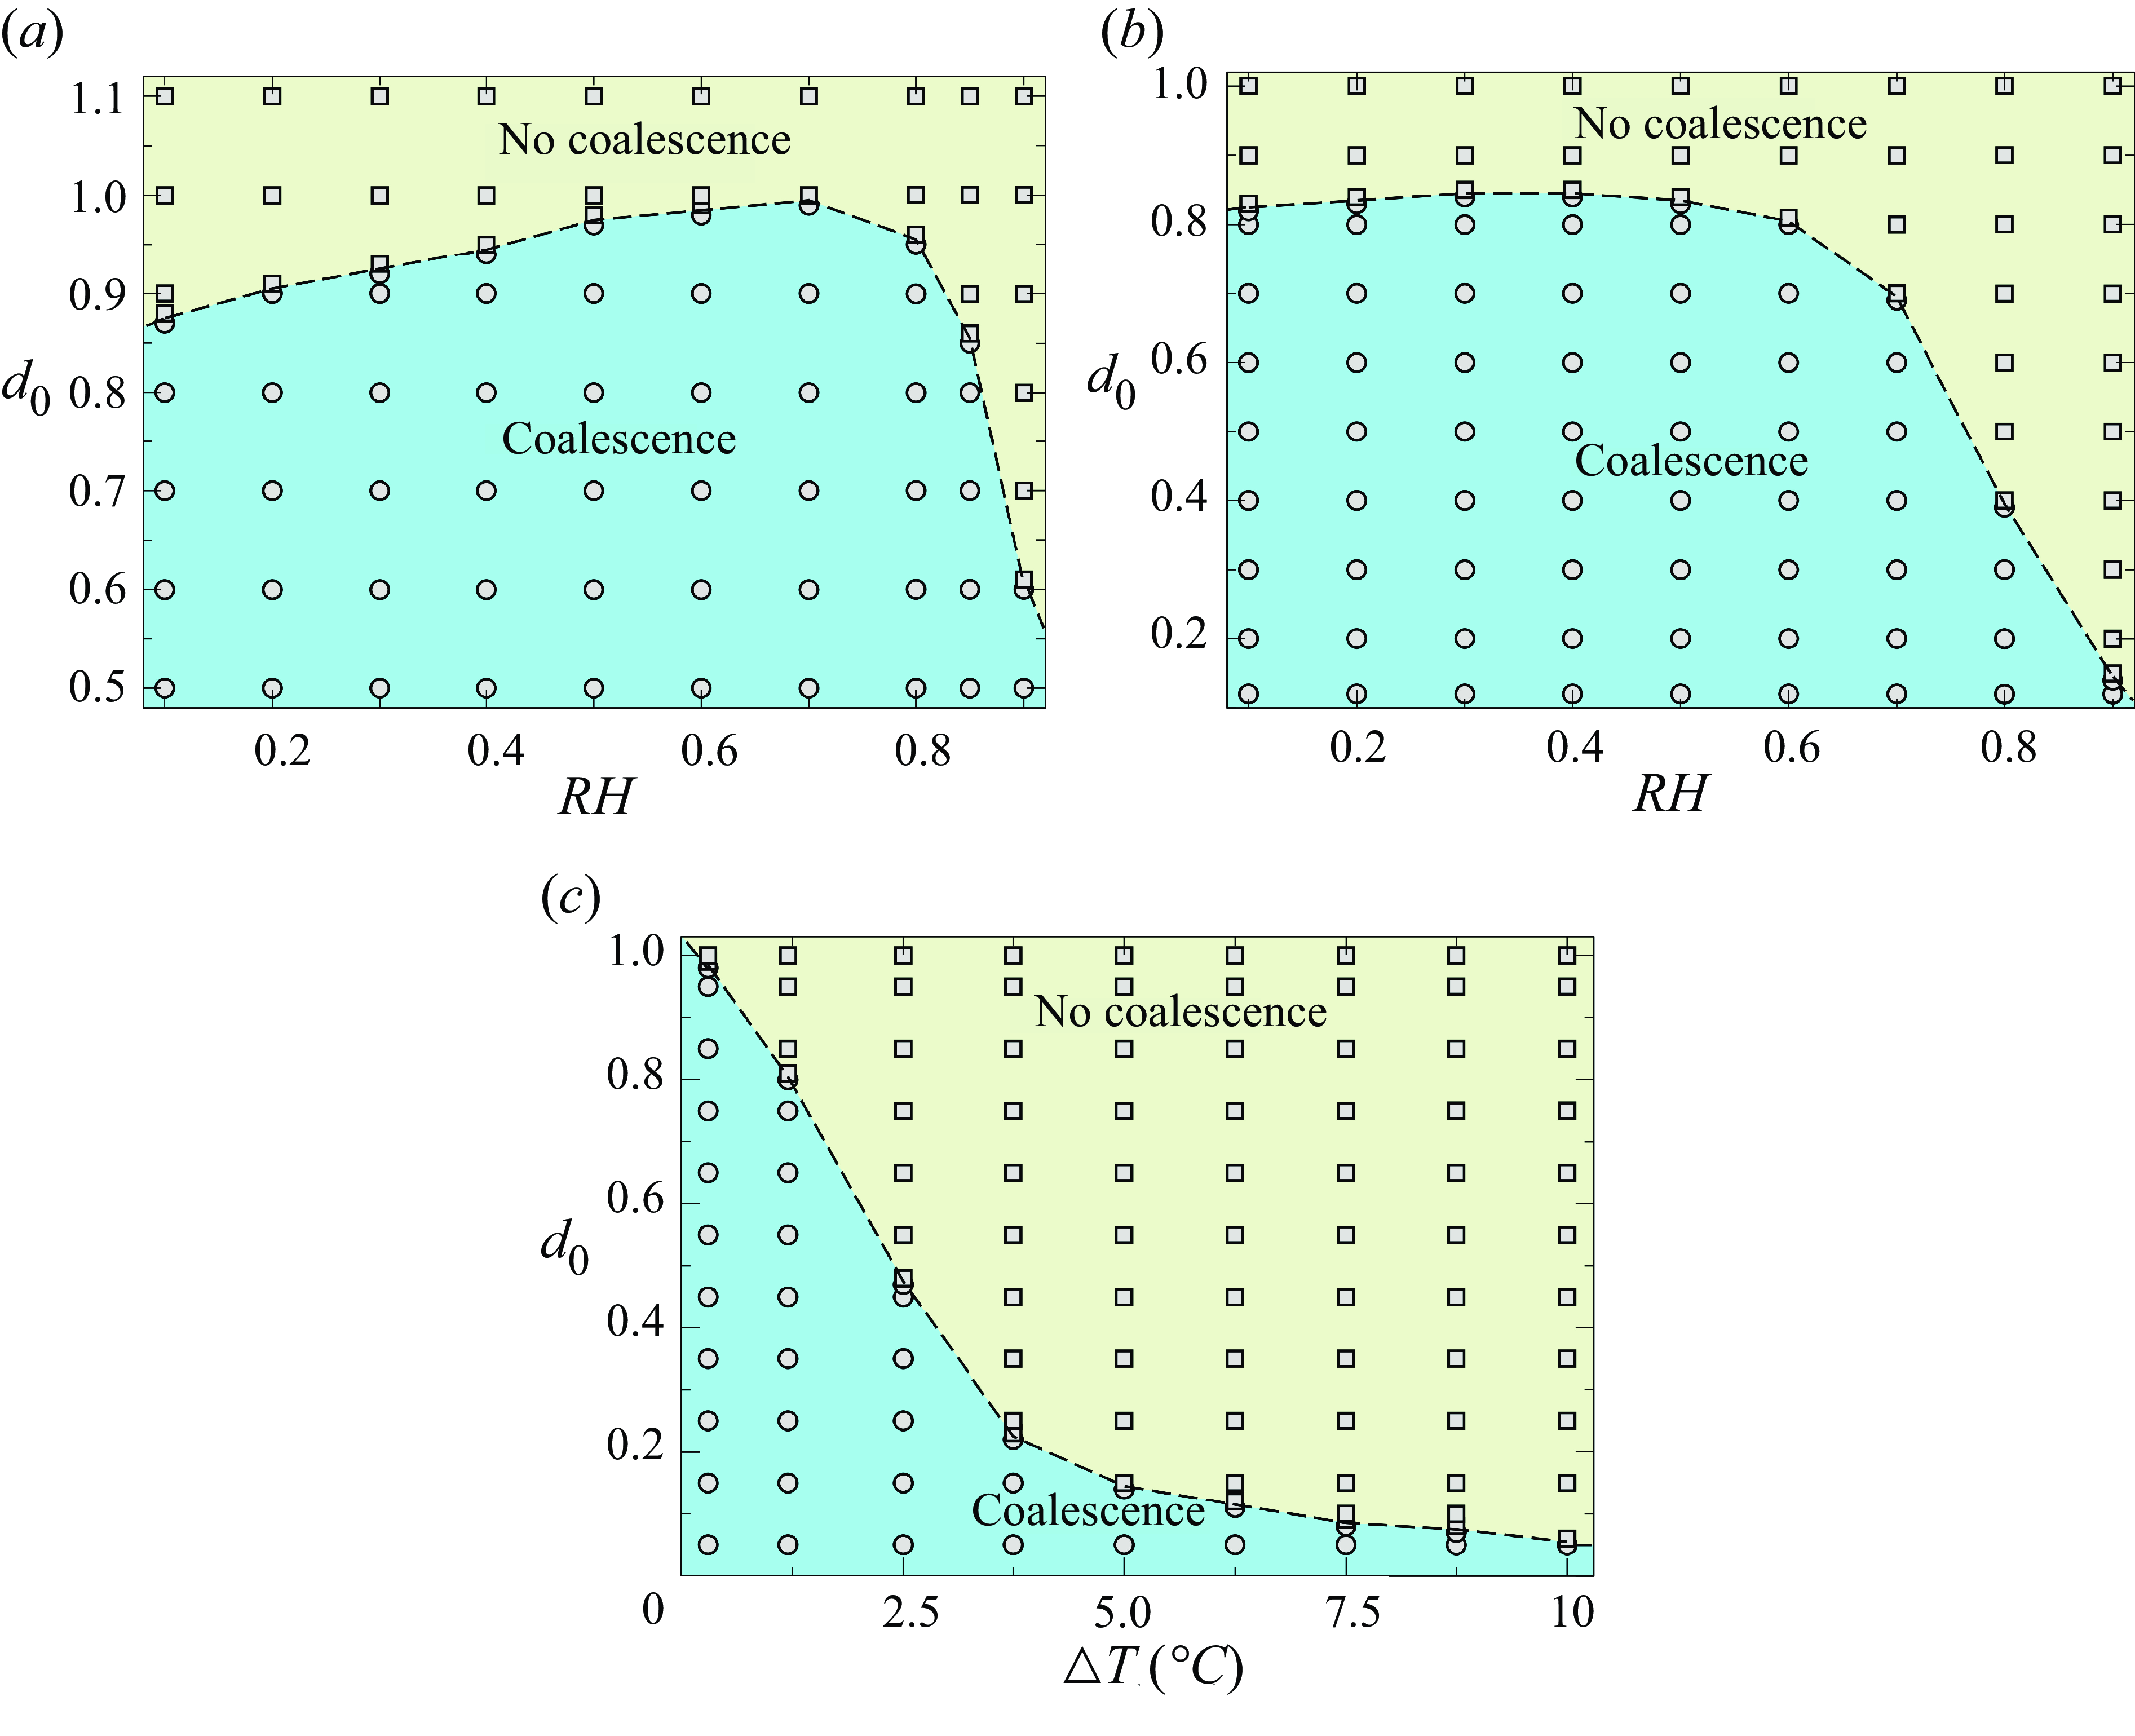
As discussed above, the coalescence of sessile drops on a cold substrate is influenced by several parameters. Thus, we finally examine the effect of the relative humidity ( $RH$
), initial separation between the two drops (
$RH$
), initial separation between the two drops ( $d_0$
), and the temperature difference between the bottom of the substrate and the melting temperature (
$d_0$
), and the temperature difference between the bottom of the substrate and the melting temperature ( $\triangle T$
) on the coalescence of the drops. We demarcate the regime of coalescence and non-coalescence by analysing the combinations of these parameters in figure 12(a–c).
$\triangle T$
) on the coalescence of the drops. We demarcate the regime of coalescence and non-coalescence by analysing the combinations of these parameters in figure 12(a–c).
In figures 12(a) and 12(b), we present regime maps in $d_0{-}RH$
space for
$d_0{-}RH$
space for $\triangle {T} = 0.3\,^{\circ }$
C and
$\triangle {T} = 0.3\,^{\circ }$
C and $\triangle {T} = 1.2\,^{\circ }$
C, respectively. In terms of dimensionless numbers,
$\triangle {T} = 1.2\,^{\circ }$
C, respectively. In terms of dimensionless numbers, $\triangle {T} = 0.3\,^{\circ }$
C and
$\triangle {T} = 0.3\,^{\circ }$
C and $\triangle {T} = 1.2\,^{\circ }$
C correspond to (
$\triangle {T} = 1.2\,^{\circ }$
C correspond to ( $Ste = 2.53\times 10^{-5}$
,
$Ste = 2.53\times 10^{-5}$
, $\chi = 1.6$
and
$\chi = 1.6$
and $\Psi = 0.02$
) and (
$\Psi = 0.02$
) and ( $Ste = 10^{-4}$
,
$Ste = 10^{-4}$
, $\chi = 0.4$
and
$\chi = 0.4$
and $\Psi = 0.085$
), respectively. The coalescence of two drops is influenced by the capillary flow within the drops and the height of the freezing front, as indicated by (3.2). The drops are anticipated to migrate more rapidly at lower
$\Psi = 0.085$
), respectively. The coalescence of two drops is influenced by the capillary flow within the drops and the height of the freezing front, as indicated by (3.2). The drops are anticipated to migrate more rapidly at lower $RH$
due to increased evaporation rates. However, the evaporative cooling becomes more pronounced at lower relative humidity levels, leading to a competition between these effects. In figure 12(a), when
$RH$
due to increased evaporation rates. However, the evaporative cooling becomes more pronounced at lower relative humidity levels, leading to a competition between these effects. In figure 12(a), when $RH = 0.1$
, it is evident that when the initial distance is
$RH = 0.1$
, it is evident that when the initial distance is $d_0 = 0.9$
, coalescence does not occur. A substantial initial separation distance (
$d_0 = 0.9$
, coalescence does not occur. A substantial initial separation distance ( $d_0$
) can inhibit coalescence as the freezing front may progress significantly, halting the motion of the contact line before the drops can merge. At lower relative humidity levels, the time required for the droplets to approach each other increases with the initial separation distance
$d_0$
) can inhibit coalescence as the freezing front may progress significantly, halting the motion of the contact line before the drops can merge. At lower relative humidity levels, the time required for the droplets to approach each other increases with the initial separation distance $d_0$
, and the freezing front undergoes considerable evolution due to evaporative cooling, impeding contact line motion and resulting in non-coalescence. Moreover, as relative humidity rises, evaporative cooling diminishes, but the time for droplets to converge increases, potentially providing ample opportunity for the freezing front to develop and impede contact line motion.
$d_0$
, and the freezing front undergoes considerable evolution due to evaporative cooling, impeding contact line motion and resulting in non-coalescence. Moreover, as relative humidity rises, evaporative cooling diminishes, but the time for droplets to converge increases, potentially providing ample opportunity for the freezing front to develop and impede contact line motion.
Temporal variation of (a) the right contact line ( $x_{cr}$
) of the left drop and the left contact line (
$x_{cr}$
) of the left drop and the left contact line ( $x_{cl}$
) of the right drop, (b) the freezing front height (
$x_{cl}$
) of the right drop, (b) the freezing front height ( $s_{cr}$
) near the right contact line (
$s_{cr}$
) near the right contact line ( $x_{cr}$
), and (c) the average capillary velocity (
$x_{cr}$
), and (c) the average capillary velocity ( $\bar {u}_{ca}$
) for
$\bar {u}_{ca}$
) for $RH = 0.1$
and
$RH = 0.1$
and $RH = 0.9$
. The rest of the dimensionless parameters are the same as the ‘base’ parameters.
$RH = 0.9$
. The rest of the dimensionless parameters are the same as the ‘base’ parameters.
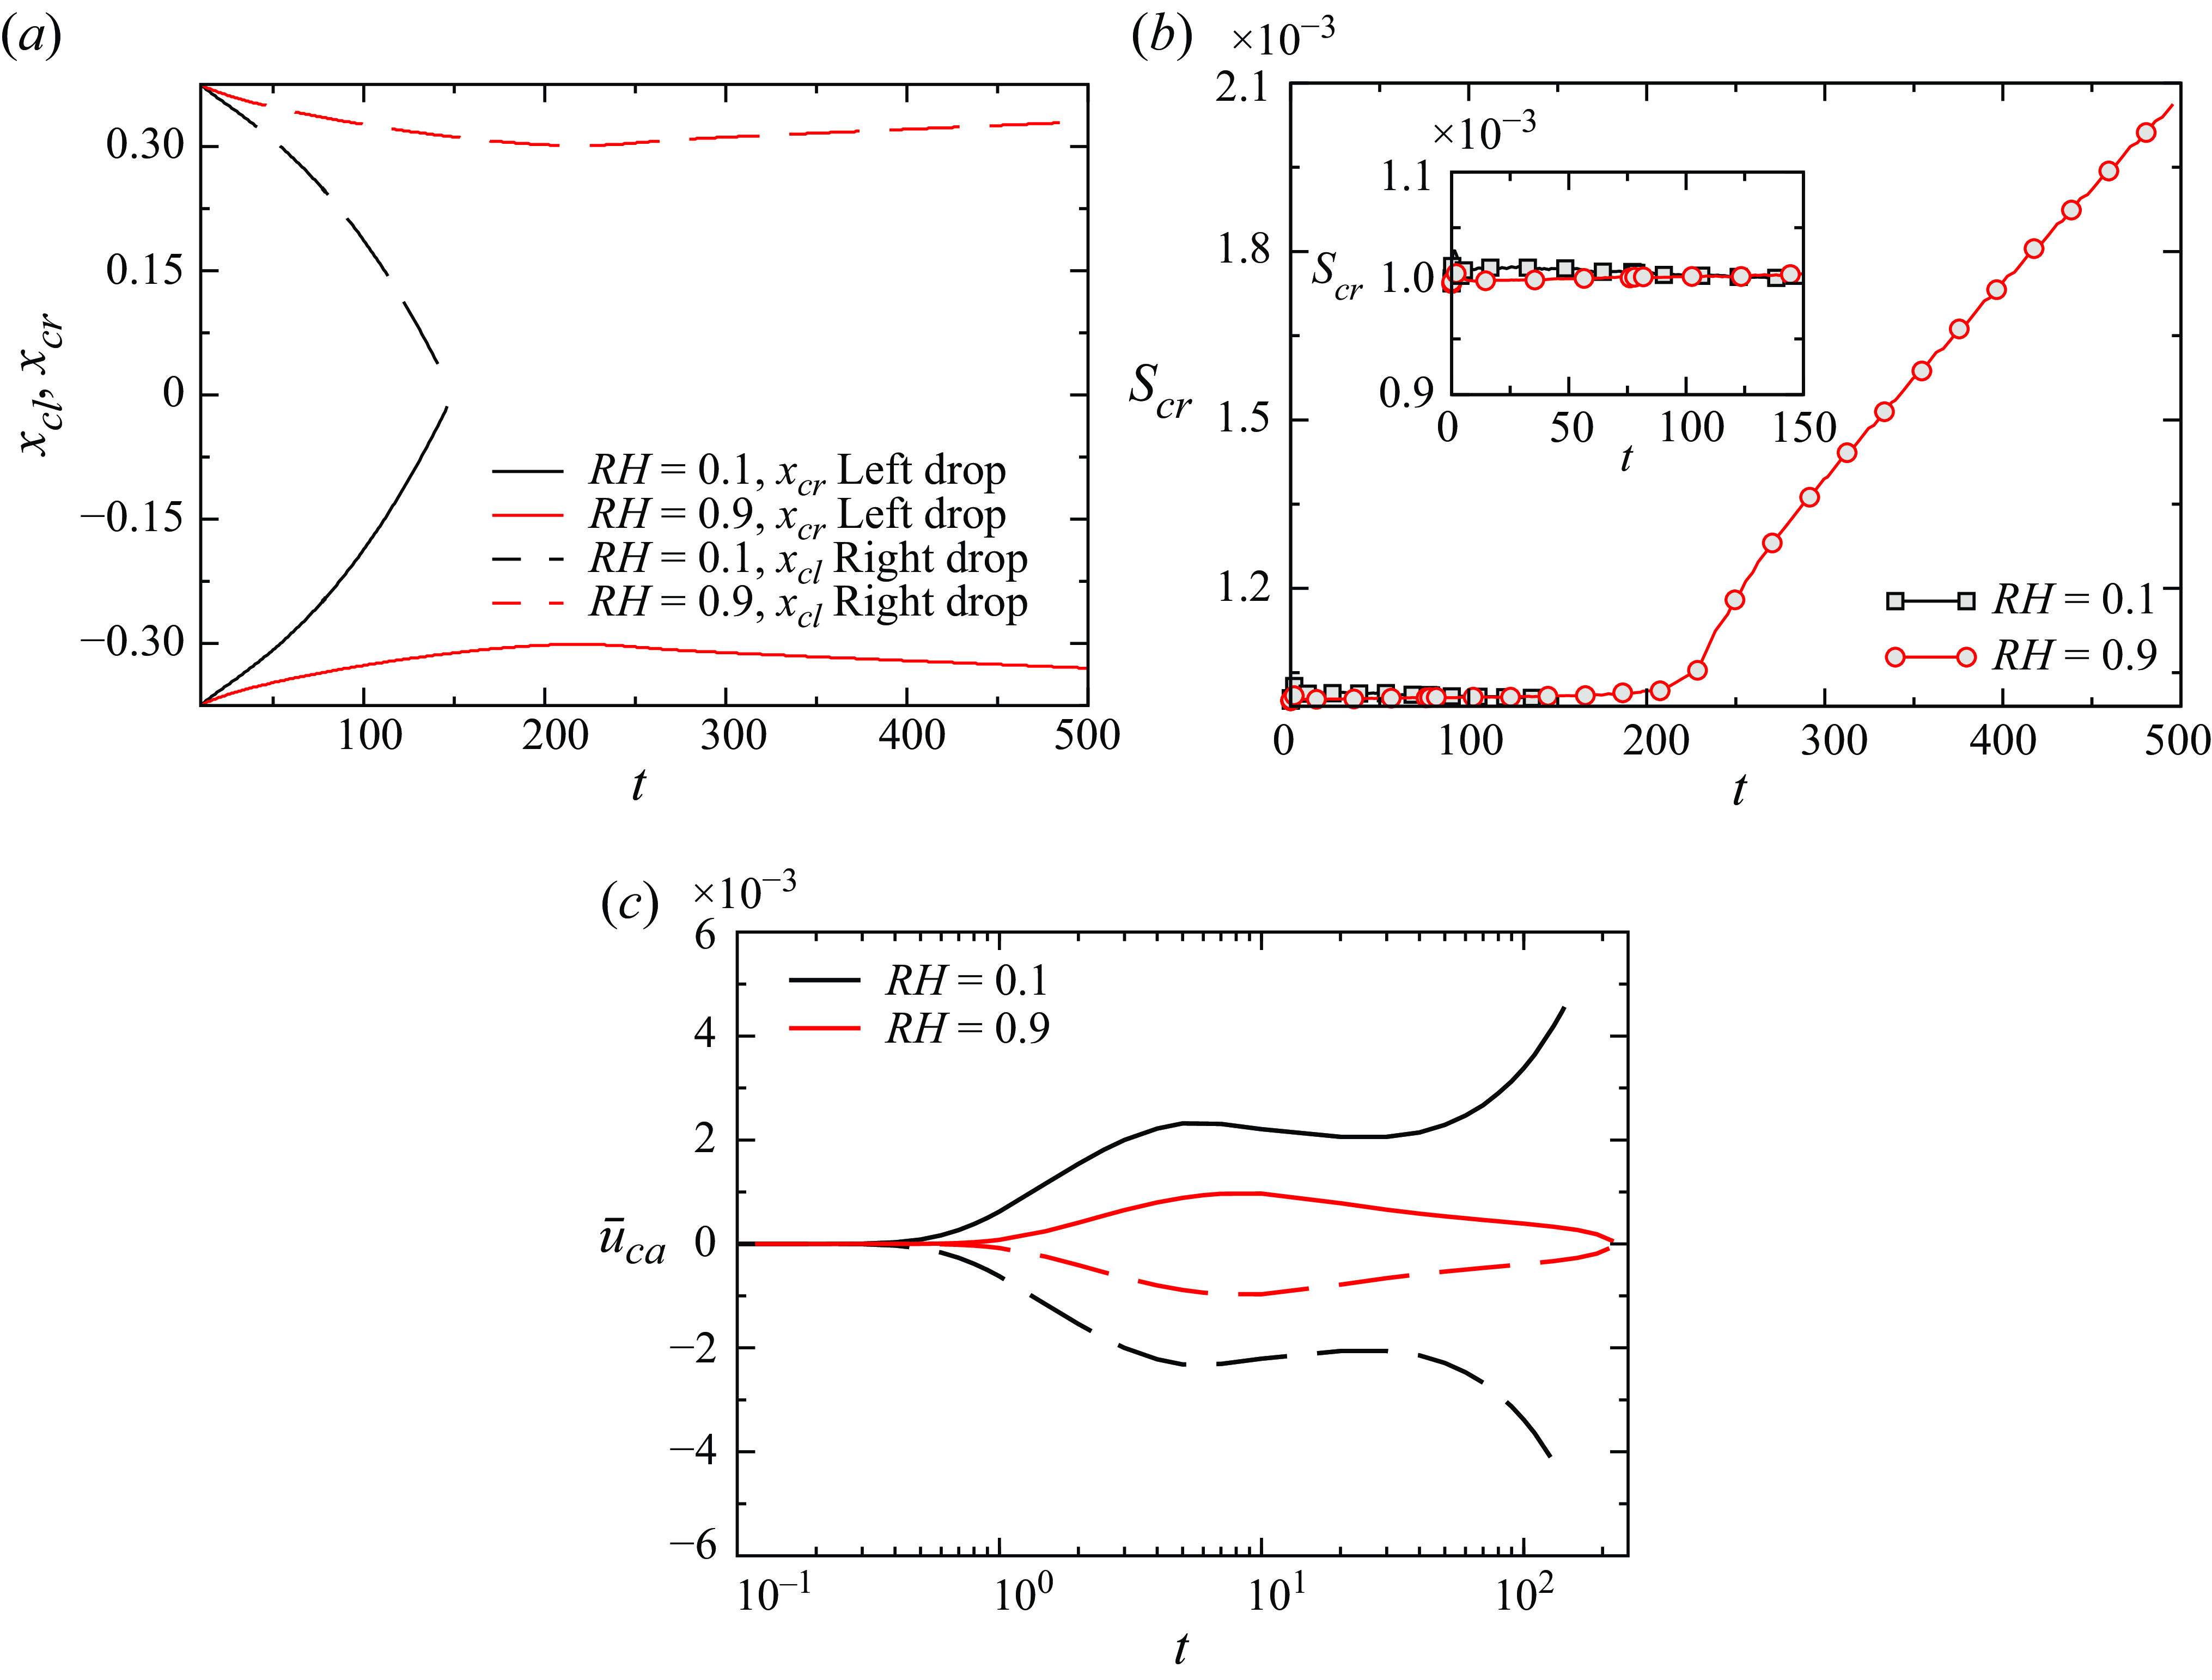
To gain more insights, in figure 13(a), we examine a system of two drops with an initial distance of $d_0 = 0.75$
for two levels of relative humidity (
$d_0 = 0.75$
for two levels of relative humidity ( $RH=0.1$
and
$RH=0.1$
and $RH=0.9$
) while keeping other parameters constant. Tracking the transition of the contact lines allows us to understand coalescence dynamics. It is evident that for
$RH=0.9$
) while keeping other parameters constant. Tracking the transition of the contact lines allows us to understand coalescence dynamics. It is evident that for $RH = 0.9$
, the contact lines of adjacent drops approach each other until
$RH = 0.9$
, the contact lines of adjacent drops approach each other until $t = 200$
and then move apart. This behaviour can be explained by the evolution of the freezing front at the contact line of a drop (
$t = 200$
and then move apart. This behaviour can be explained by the evolution of the freezing front at the contact line of a drop ( $s_{cr}$
) over time (
$s_{cr}$
) over time ( $t$
). Figure 13(b) illustrates that for
$t$
). Figure 13(b) illustrates that for $RH = 0.1$
, the freezing front thickness at the contact line does not evolve significantly before coalescence occurs at approximately
$RH = 0.1$
, the freezing front thickness at the contact line does not evolve significantly before coalescence occurs at approximately $t = 144$
, indicated by the convergence of the contact lines. Conversely, for
$t = 144$
, indicated by the convergence of the contact lines. Conversely, for $RH = 0.9$
, the freezing front evolves significantly before the contact lines approach each other. This can also be corroborated by plotting the average capillary velocity inside the drop, as shown in figure 13(c). For
$RH = 0.9$
, the freezing front evolves significantly before the contact lines approach each other. This can also be corroborated by plotting the average capillary velocity inside the drop, as shown in figure 13(c). For $RH = 0.1$
, the average capillary velocity initially increases, decreases slightly due to freezing front evolution and peaks when the drops are close to each other, indicating coalescence. In contrast, for
$RH = 0.1$
, the average capillary velocity initially increases, decreases slightly due to freezing front evolution and peaks when the drops are close to each other, indicating coalescence. In contrast, for $RH = 0.9$
, the average capillary velocity becomes very low at
$RH = 0.9$
, the average capillary velocity becomes very low at $t = 200$
, corresponding to evolving freezing front thickness, leading to the slight separation of adjacent contact lines after
$t = 200$
, corresponding to evolving freezing front thickness, leading to the slight separation of adjacent contact lines after $t = 200$
.
$t = 200$
.
In figure 12(a), as relative humidity increases to $RH = 0.7$
, the initial separation distance (
$RH = 0.7$
, the initial separation distance ( $d_0$
) for coalescence slightly increases due to decreased evaporative cooling. However, a further increase in relative humidity reduces the average capillary velocity, leading to coalescence only at lower separation distances (
$d_0$
) for coalescence slightly increases due to decreased evaporative cooling. However, a further increase in relative humidity reduces the average capillary velocity, leading to coalescence only at lower separation distances ( $d_0$
), attributed to significant freezing front evolution. Increasing the temperature difference between the substrate bottom and the melting temperature accelerates freezing front growth, reducing the initial distance (
$d_0$
), attributed to significant freezing front evolution. Increasing the temperature difference between the substrate bottom and the melting temperature accelerates freezing front growth, reducing the initial distance ( $d_0$
) for coalescence. Lowering the substrate bottom temperature to
$d_0$
) for coalescence. Lowering the substrate bottom temperature to $T_c = -1.2\,^{\circ }$
C, corresponding to an increased temperature difference of (
$T_c = -1.2\,^{\circ }$
C, corresponding to an increased temperature difference of ( $\triangle T = 1.2\,^{\circ }$
C), promotes freezing front growth due to a higher Stefan number (
$\triangle T = 1.2\,^{\circ }$
C), promotes freezing front growth due to a higher Stefan number ( $Ste$
) and reduced evaporative cooling as the scaled latent heat of vaporisation (
$Ste$
) and reduced evaporative cooling as the scaled latent heat of vaporisation ( $\chi$
) decreases. In figure 12(b), as relative humidity increases from
$\chi$
) decreases. In figure 12(b), as relative humidity increases from $RH = 0.1$
to
$RH = 0.1$
to $RH = 0.4$
, there is no significant increase in initial separation distance
$RH = 0.4$
, there is no significant increase in initial separation distance $d_0$
for coalescence due to decreased evaporative cooling. Subsequently, as relative humidity increases from
$d_0$
for coalescence due to decreased evaporative cooling. Subsequently, as relative humidity increases from $0.4$
to
$0.4$
to $0.9$
, the average capillary velocity decreases significantly due to low evaporation at high humidity and freezing front evolution, leading to coalescence only at lower initial separation distances (
$0.9$
, the average capillary velocity decreases significantly due to low evaporation at high humidity and freezing front evolution, leading to coalescence only at lower initial separation distances ( $d_0$
). In figure 12(c), fixing relative humidity to
$d_0$
). In figure 12(c), fixing relative humidity to $RH = 0.6$
and varying the temperature difference between the substrate bottom and the melting temperature demonstrates that increasing the temperature difference decreases the initial distance (
$RH = 0.6$
and varying the temperature difference between the substrate bottom and the melting temperature demonstrates that increasing the temperature difference decreases the initial distance ( $d_0$
) for coalescence. It is observed that cooler temperatures facilitate faster freezing front propagation, completely restricting contact line movement.
$d_0$
) for coalescence. It is observed that cooler temperatures facilitate faster freezing front propagation, completely restricting contact line movement.
4. Conclusions
We numerically investigate the evaporation-induced coalescence of two volatile sessile drops on a cold substrate undergoing freezing by employing the lubrication approximation in the finite element method framework. Our two-dimensional model incorporates mass conservation across the liquid, solid and gas phases, and momentum conservation within the liquid phase. Additionally, our model accounts for energy balance in the liquid, solid and gas phases, and considers heat flux across interfaces and substrate boundaries.
We focus on the interactions between halos and the coalescence of two volatile sessile drops undergoing freezing, primarily driven by asymmetrical evaporation. For volatile drops, evaporation significantly dominates the halo formation. We observe that under freezing conditions on a cold substrate, two volatile drops can coalesce before the freezing front eventually confines their contact lines. Further, we find that this phenomenon cannot be accurately modelled without considering evaporation. In our simulations, neglecting evaporation results in stagnant sessile drops, while considering it leads to coalescence due to asymmetrical evaporation rates. We establish a mechanism that drives this coalescence based on the average capillary velocity of the individual drop. It is also observed that when the two drops are in close vicinity, the halos of the individual droplets interact to form a merged halo. Furthermore, our observations indicate that drops approach each other more rapidly under lower relative humidity conditions, resulting in rapid coalescence, compared with partially wetting drops placed side by side without undergoing evaporation. While condensation and halo formation may not significantly contribute to bringing the droplets closer to each other, upon contact and merging, we observe a substantial increase in local relative humidity near the liquid–gas interface at the coalescence site. This surge triggers significant condensation, further expediting the process of coalescence. This condensation also raises the temperature of the liquid–gas interface as the surroundings absorb the latent heat released during gas-to-liquid transformation.
To gain further insights into the coalescence and non-coalescence behaviour of volatile sessile drops, we examine the influence of relative humidity, the initial separation distance between the drops, and the temperature difference between the bottom of the substrate and the melting temperature (with water as reference). Our findings reveal that the time required for the drops to approach each other at high relative humidity levels is significantly prolonged. This extended duration allows for greater propagation of the freezing front and reduces the average capillary velocity of the drops, leading to coalescence only at low initial separation distances. Moreover, when the bottom of the substrate is much colder, the freezing front propagates more rapidly, requiring minimal time to restrict the contact line. Consequently, to achieve coalescence, the droplets must be placed in close proximity to each other.
Acknowledgements.
K.C.S. thanks the Science & Engineering Research Board and IIT Hyderabad, India for their financial supports through grants CRG/2020/000507 and IITH/CHE/F011/SOCH1, respectively. C.S.S. acknowledges IIT Ropar for financial support through ISIRD (grant no. 9-388/2018/IITRPR/3335).
Declaration of interests.
The authors report no conflict of interest.
Appendix A. Validation of the numerical model
A.1 Comparison with Marin et al. (Reference Marin, Enriquez, Brunet, Colinet and Snoeijer2014)
We validated our model by comparing the tip angle at the end of freezing with the angle observed in the experimental study by Marin et al. (Reference Marin, Enriquez, Brunet, Colinet and Snoeijer2014) for a typical set of parameters (figure 14). To incorporate evaporation and condensation in our freezing model, we incorporated a precursor layer model to prevent shear stress singularities at the water–ice interface (see (2.76)). To maintain a consistent precursor layer thickness and ensure accurate predictions for condensation and evaporation, we applied a penalty function as described by Zadražil et al. (Reference Zadražil, Stepanek and Matar2006) (see (2.77)). However, this approach imposes a constraint on the freezing rate as the liquid layer thickness approaches that of the precursor layer. Consequently, our model may not fully capture the final tip formation at the end of freezing. Despite this limitation, by estimating the angle between the tangents near the cusp, we found that the tip angle is approximately $146^{\circ }$
for a typical set of parameters. This result closely matches the experimentally observed tip angle of
$146^{\circ }$
for a typical set of parameters. This result closely matches the experimentally observed tip angle of ${\sim} 139^{\circ }$
reported by Marin et al. (Reference Marin, Enriquez, Brunet, Colinet and Snoeijer2014), who also noted that the tip angle is independent of substrate temperature, wettability and solidification rate.
${\sim} 139^{\circ }$
reported by Marin et al. (Reference Marin, Enriquez, Brunet, Colinet and Snoeijer2014), who also noted that the tip angle is independent of substrate temperature, wettability and solidification rate.
Tip angle near the cusp obtained from our model considering both evaporation and freezing for $Ste = 1.22 \times 10^{-3}$
,
$Ste = 1.22 \times 10^{-3}$
, $T_{v} = 1$
,
$T_{v} = 1$
, $A_{n} = 17$
,
$A_{n} = 17$
, $D_{g} = 2$
,
$D_{g} = 2$
, $D_{s} = 0.9$
,
$D_{s} = 0.9$
, $\Lambda _{S} = 3.89$
,
$\Lambda _{S} = 3.89$
, $\Lambda _{W} = 698$
,
$\Lambda _{W} = 698$
, $\chi = 0.01$
,
$\chi = 0.01$
, $K = 8\times 10^{-4}$
,
$K = 8\times 10^{-4}$
, $\rho _{veR} = 1$
,
$\rho _{veR} = 1$
, $\Lambda _{g} = 0.041$
,
$\Lambda _{g} = 0.041$
, $D_{w} = 15$
,
$D_{w} = 15$
, $RH = 0.70$
,
$RH = 0.70$
, $\epsilon =0.2$
,
$\epsilon =0.2$
, $D_{v} = 1.65 \times 10^{-6}$
,
$D_{v} = 1.65 \times 10^{-6}$
, $\triangle = 10^{-4}$
,
$\triangle = 10^{-4}$
, $\Psi = 0.30$
and
$\Psi = 0.30$
and $Pe_{v} = 1$
. Note that Marin et al. (Reference Marin, Enriquez, Brunet, Colinet and Snoeijer2014) experimentally observed a tip angle of
$Pe_{v} = 1$
. Note that Marin et al. (Reference Marin, Enriquez, Brunet, Colinet and Snoeijer2014) experimentally observed a tip angle of ${\sim} 139^{\circ }$
.
${\sim} 139^{\circ }$
.
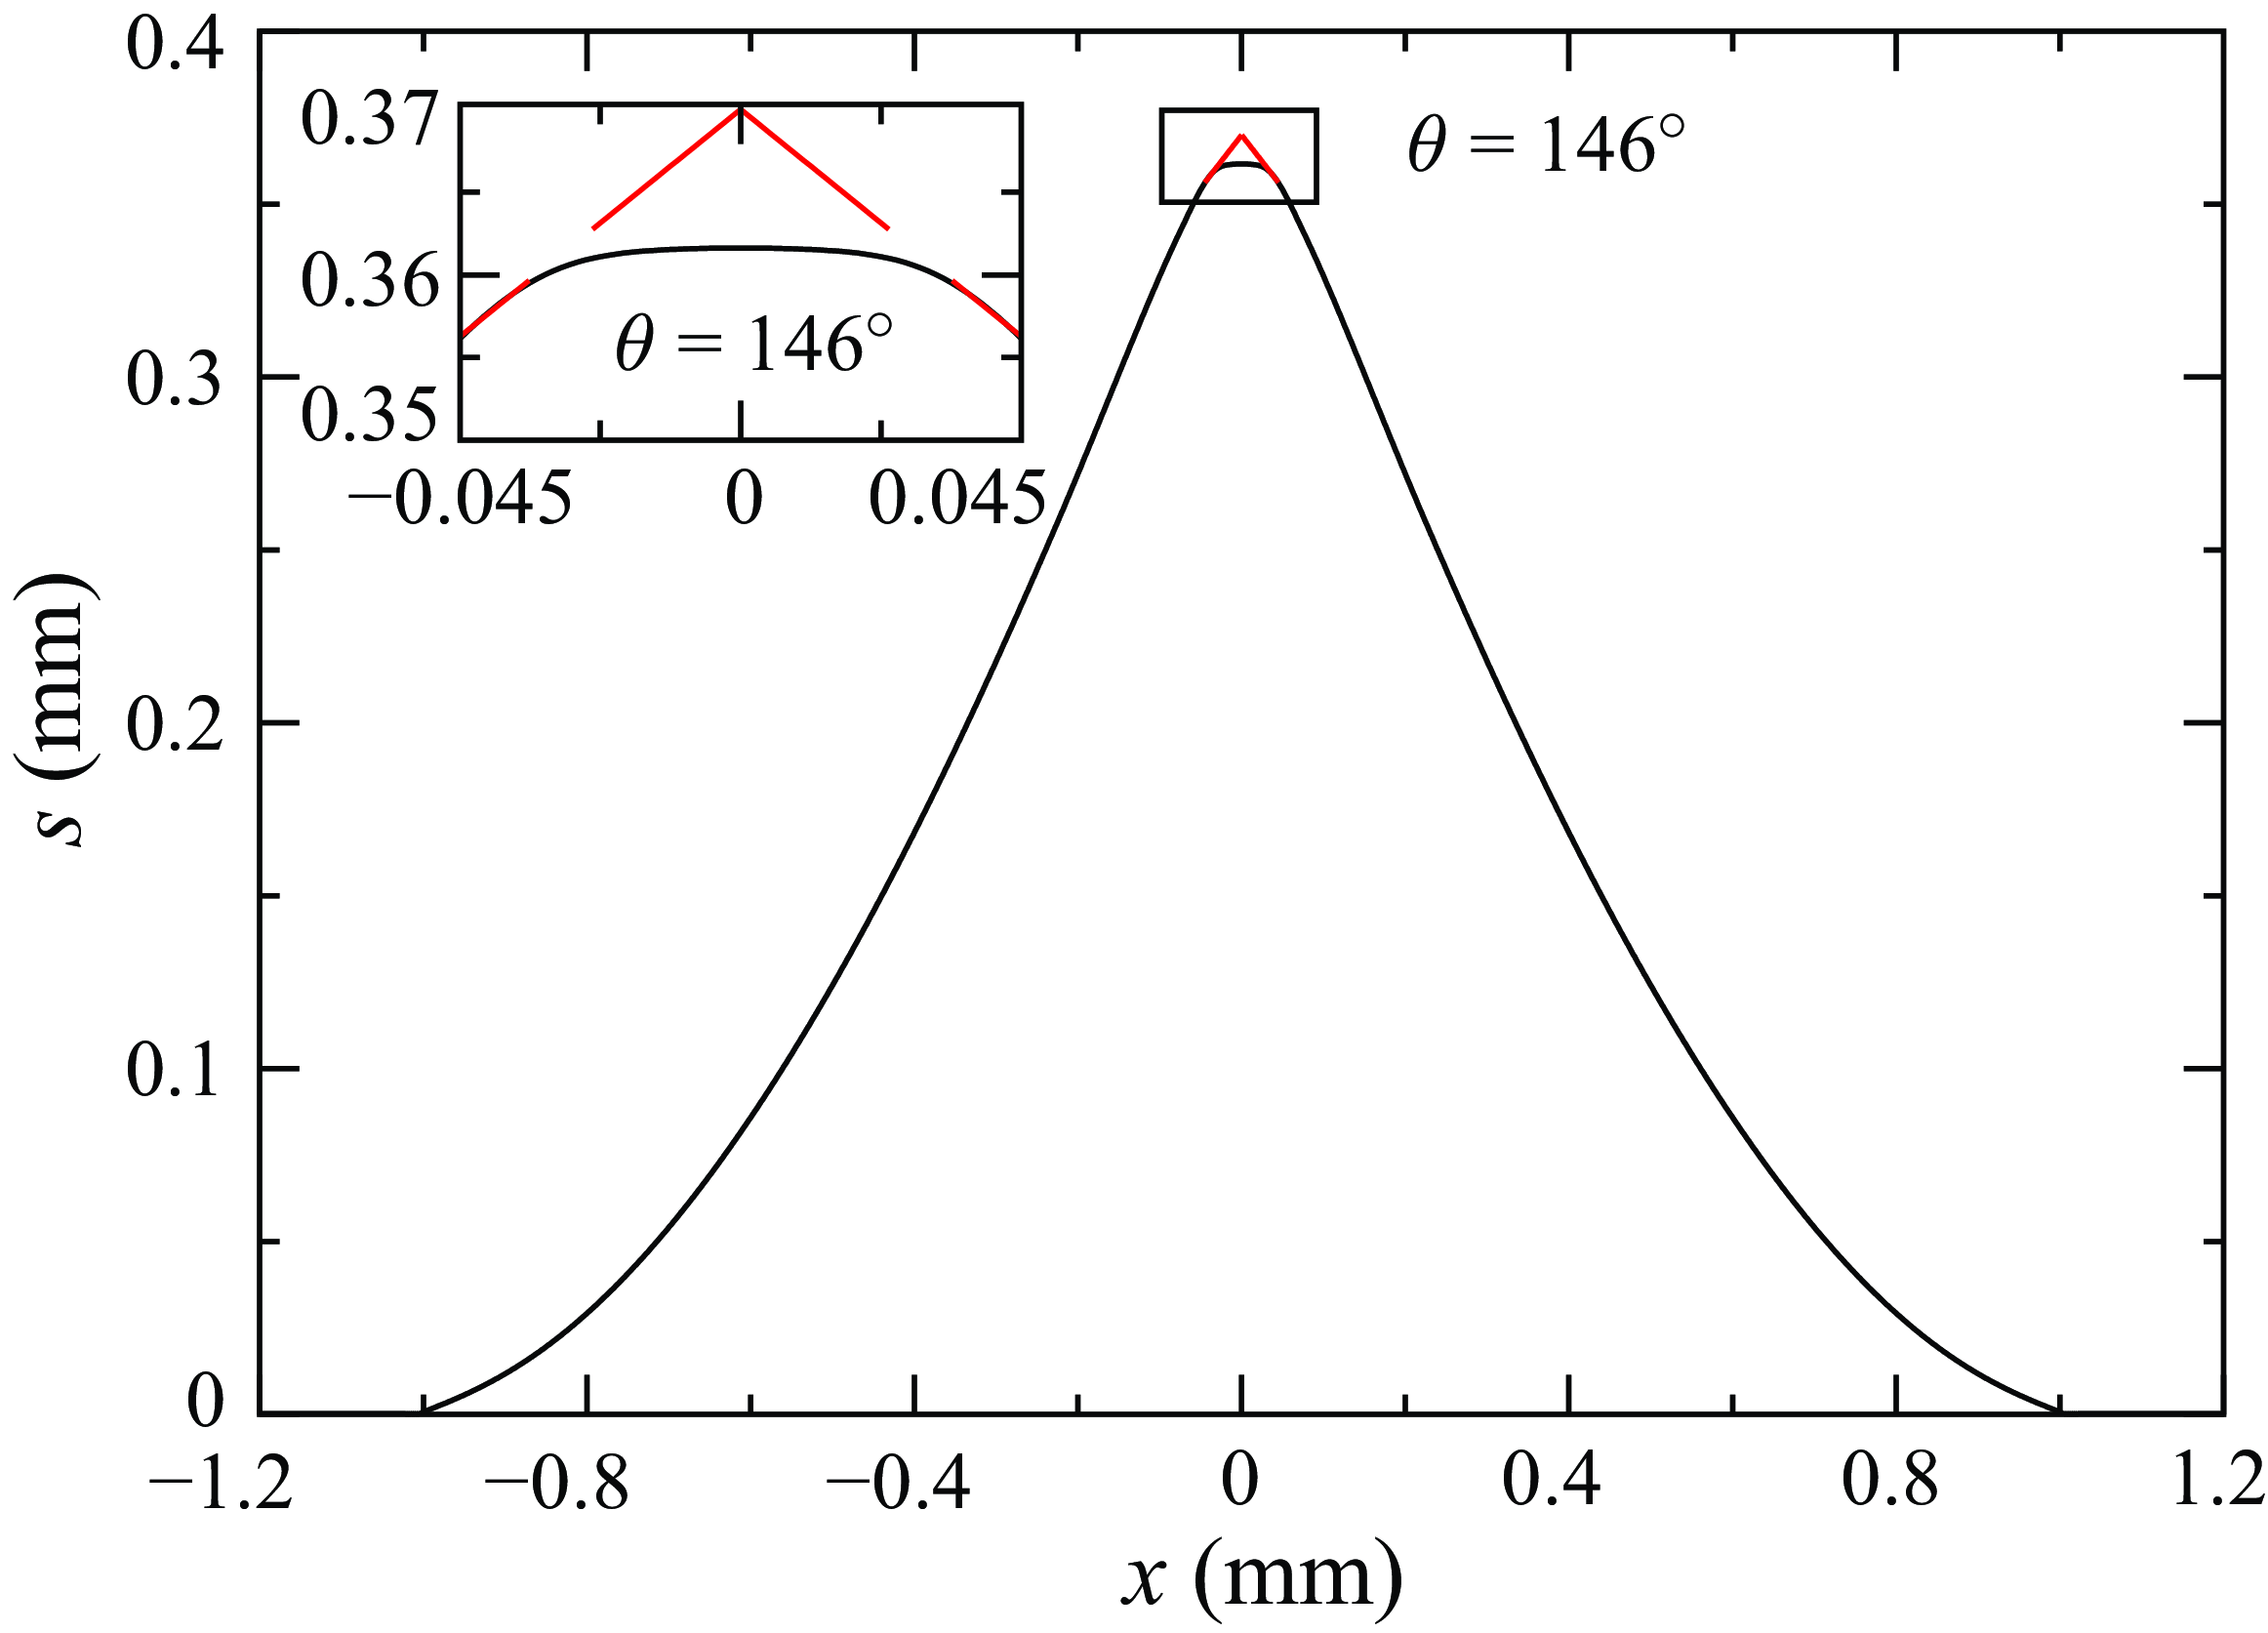
A.2 Comparison with Zadražil et al. (Reference Zadražil, Stepanek and Matar2006); Kavuri et al. (Reference Kavuri, Karapetsas, Sharma and Sahu2023)
Temporal evolution of the droplet shape, $h$
(solid line) and the freezing front,
$h$
(solid line) and the freezing front, $s$
(dash-dotted line) for a drop placed on a cold substrate. Panel (a) corresponds to data extracted from a scenario where only freezing is considered, without evaporation, as illustrated in Fig. 3 of Kavuri et al. (Reference Kavuri, Karapetsas, Sharma and Sahu2023), which mimics Fig. 15 of Zadražil et al. (Reference Zadražil, Stepanek and Matar2006). Panel (b) represents the same scenario but analysed using our present formulation. The rest of the dimensionless parameters are
$s$
(dash-dotted line) for a drop placed on a cold substrate. Panel (a) corresponds to data extracted from a scenario where only freezing is considered, without evaporation, as illustrated in Fig. 3 of Kavuri et al. (Reference Kavuri, Karapetsas, Sharma and Sahu2023), which mimics Fig. 15 of Zadražil et al. (Reference Zadražil, Stepanek and Matar2006). Panel (b) represents the same scenario but analysed using our present formulation. The rest of the dimensionless parameters are $\epsilon =0.2$
,
$\epsilon =0.2$
, $Ste = 0.04$
,
$Ste = 0.04$
, $T_{v} = 0.5$
,
$T_{v} = 0.5$
, $A_{n} = 6.25$
,
$A_{n} = 6.25$
, $D_{s} = \Lambda _{S} = \Lambda _{W} = RH = K = \rho _{veR} = 1$
,
$D_{s} = \Lambda _{S} = \Lambda _{W} = RH = K = \rho _{veR} = 1$
, $\Lambda _{g} = 0.6$
and
$\Lambda _{g} = 0.6$
and $D_{w} = D_{v} = \triangle = \Psi = \chi = Pe_{v} = 0$
. The value of dimensionless total freezing time
$D_{w} = D_{v} = \triangle = \Psi = \chi = Pe_{v} = 0$
. The value of dimensionless total freezing time $t_f$
inpanels (a) and (b) are 15 and 16, respectively.
$t_f$
inpanels (a) and (b) are 15 and 16, respectively.
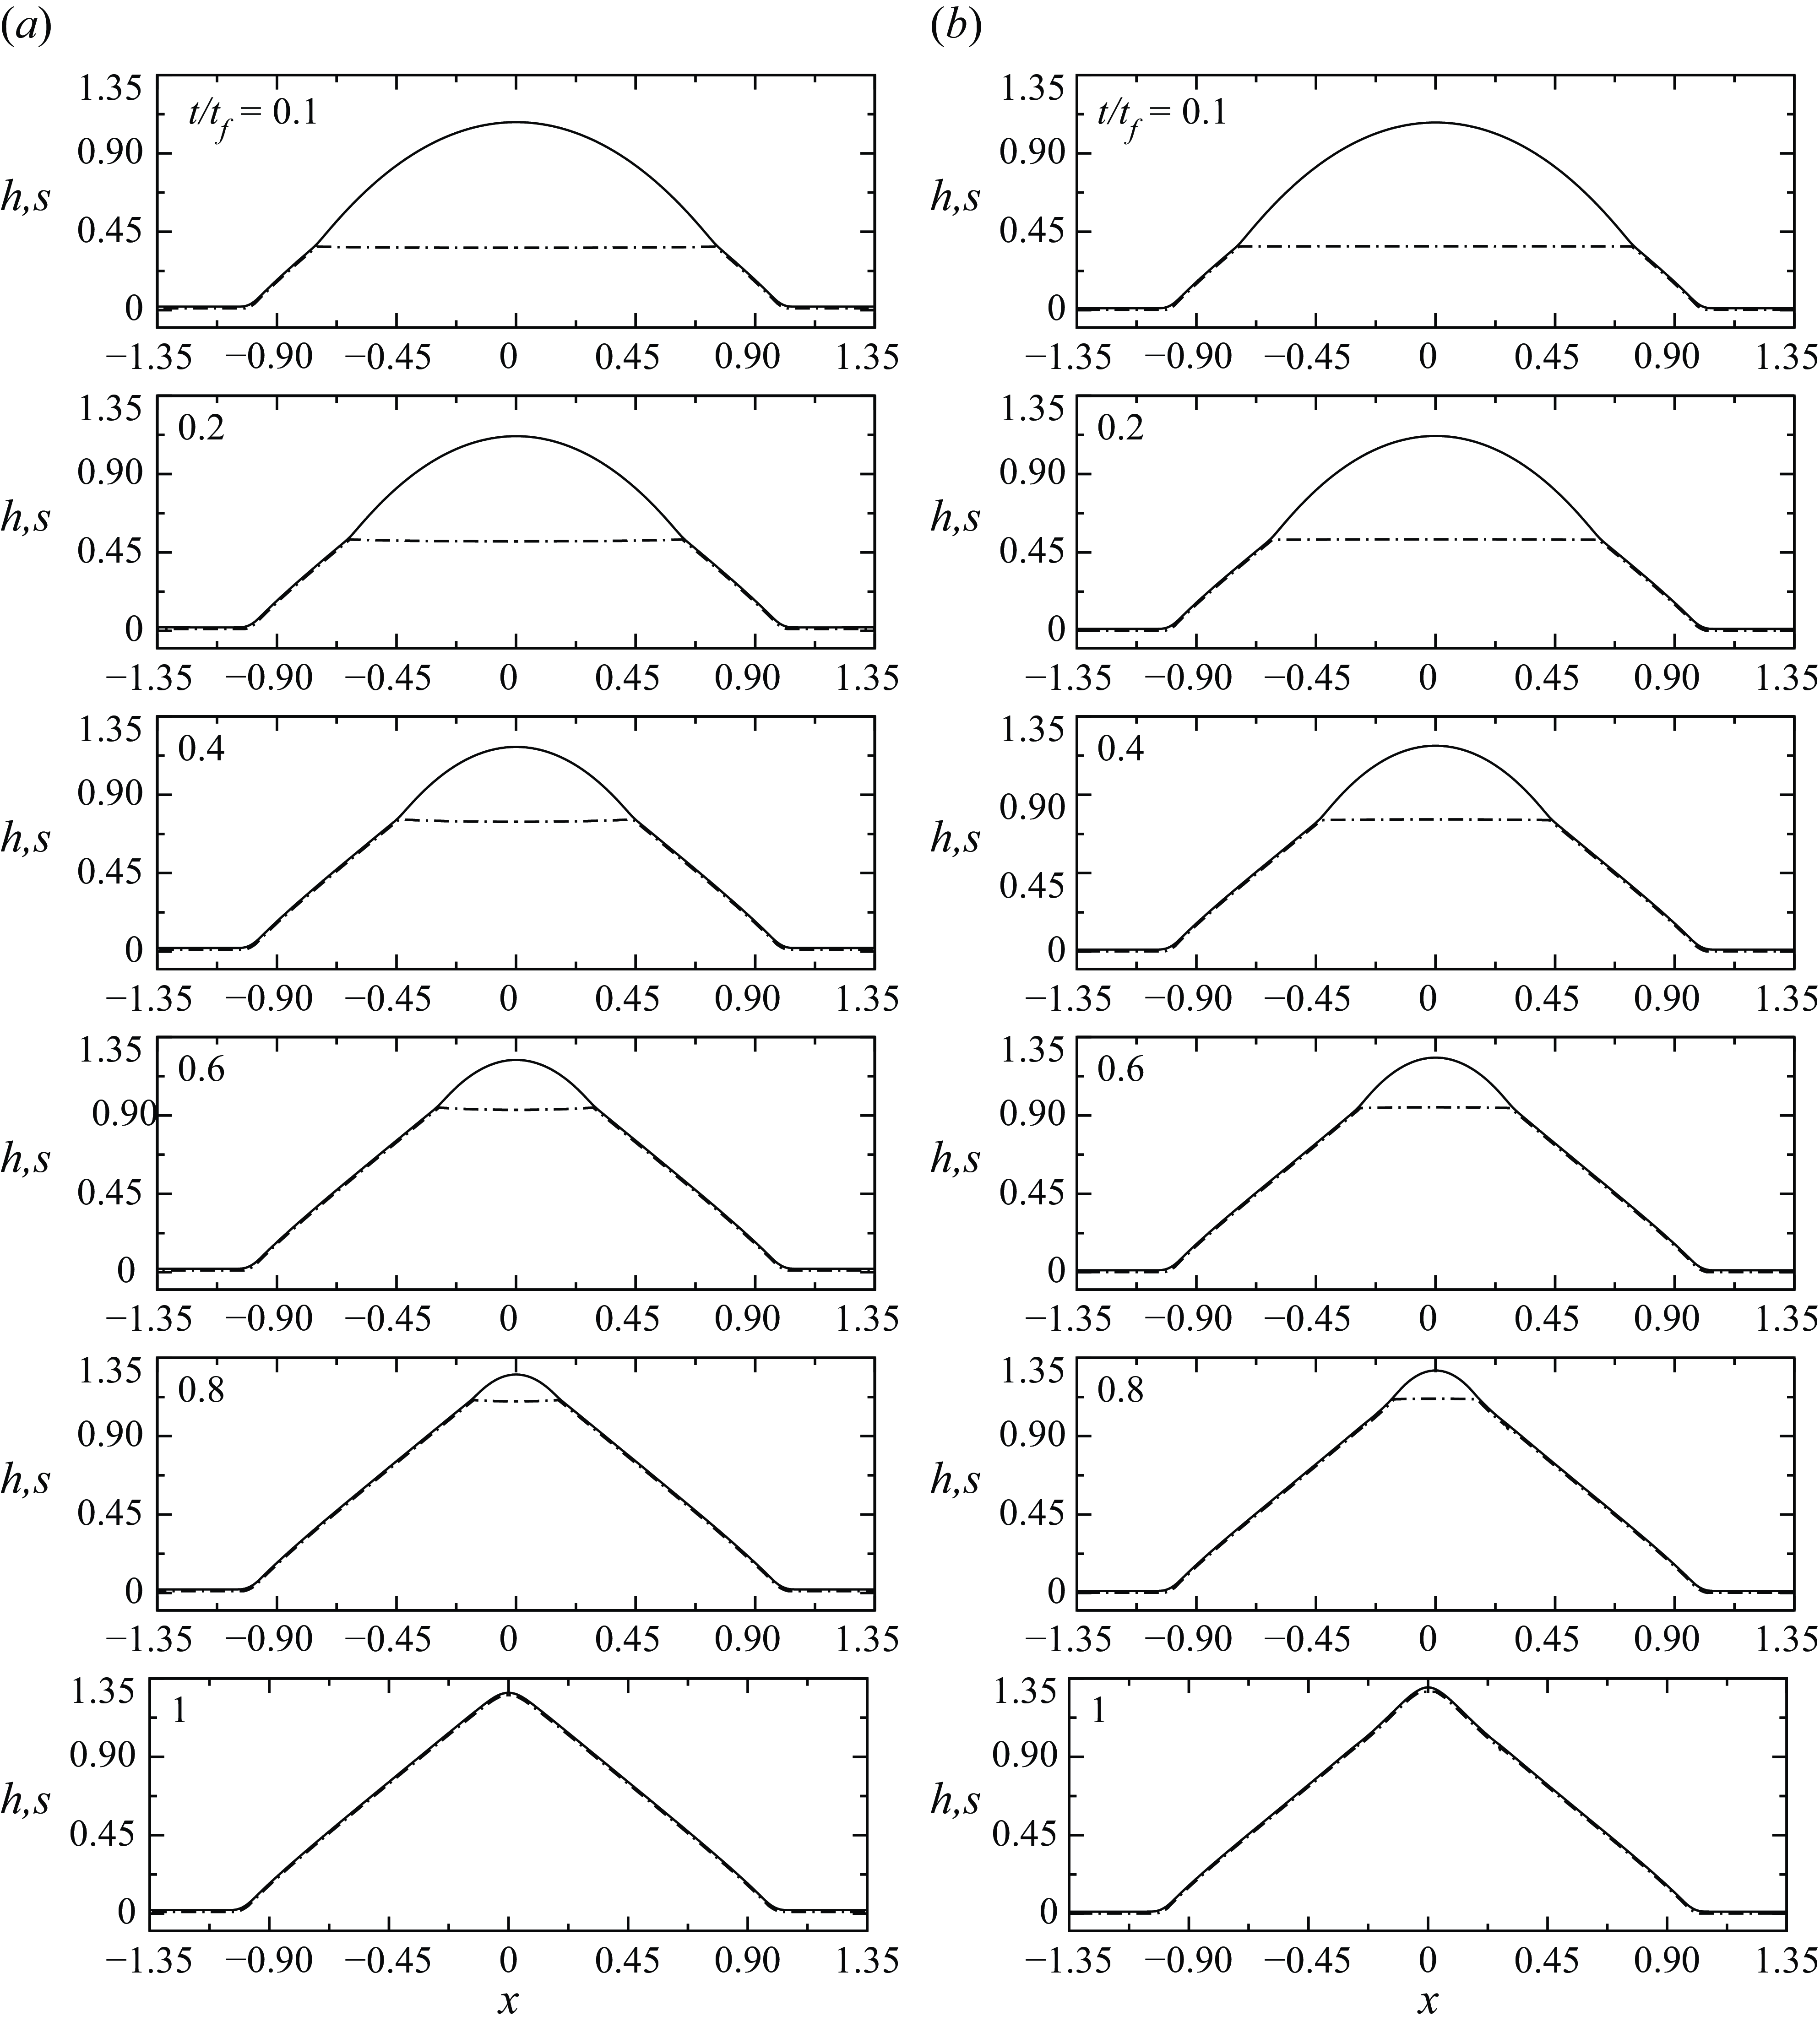
Comparison with the experimental and theoretical results of Wen et al. (Reference Wen, Kim, Shi, Wang, Man, Doi and Russell2019) to validate our evaporation model. The shaded region between the two dashed black lines represents experimental data obtained from various trials for the evaporation of single-component n-hexane droplets at room temperature, while the solid black line shows the theoretical prediction, as reported in figure 2(a) of Wen et al. (Reference Wen, Kim, Shi, Wang, Man, Doi and Russell2019). The red solid line with circle symbols presents our simulation results, albeit without freezing. The dimensionless parameters used in our simulations are $d_0 = 0.9$
,
$d_0 = 0.9$
, $\chi = 0.21$
,
$\chi = 0.21$
, $\triangle = 10^{-6}$
,
$\triangle = 10^{-6}$
, $\Psi = 0.03$
,
$\Psi = 0.03$
, $Pe_{v} = 0.048$
,
$Pe_{v} = 0.048$
, $Ste = 0$
,
$Ste = 0$
, $T_{v} = 0$
,
$T_{v} = 0$
, $A_{n} = 1.28$
,
$A_{n} = 1.28$
, $D_v = 10^{-3}$
,
$D_v = 10^{-3}$
, $D_{g} = 5.0$
,
$D_{g} = 5.0$
, $D_{s} = 0.9$
,
$D_{s} = 0.9$
, $\Lambda _{S} = 3.89$
,
$\Lambda _{S} = 3.89$
, $\Lambda _{W} = 11.5$
,
$\Lambda _{W} = 11.5$
, $\Lambda _{g} = 0.12$
,
$\Lambda _{g} = 0.12$
, $RH = 0$
,
$RH = 0$
, $K = 1.1\times 10^{-5}$
,
$K = 1.1\times 10^{-5}$
, $D_{w} = 15.0$
,
$D_{w} = 15.0$
, $\epsilon = 0.06$
and
$\epsilon = 0.06$
and $\rho _{veR} = 1.0$
.
$\rho _{veR} = 1.0$
.
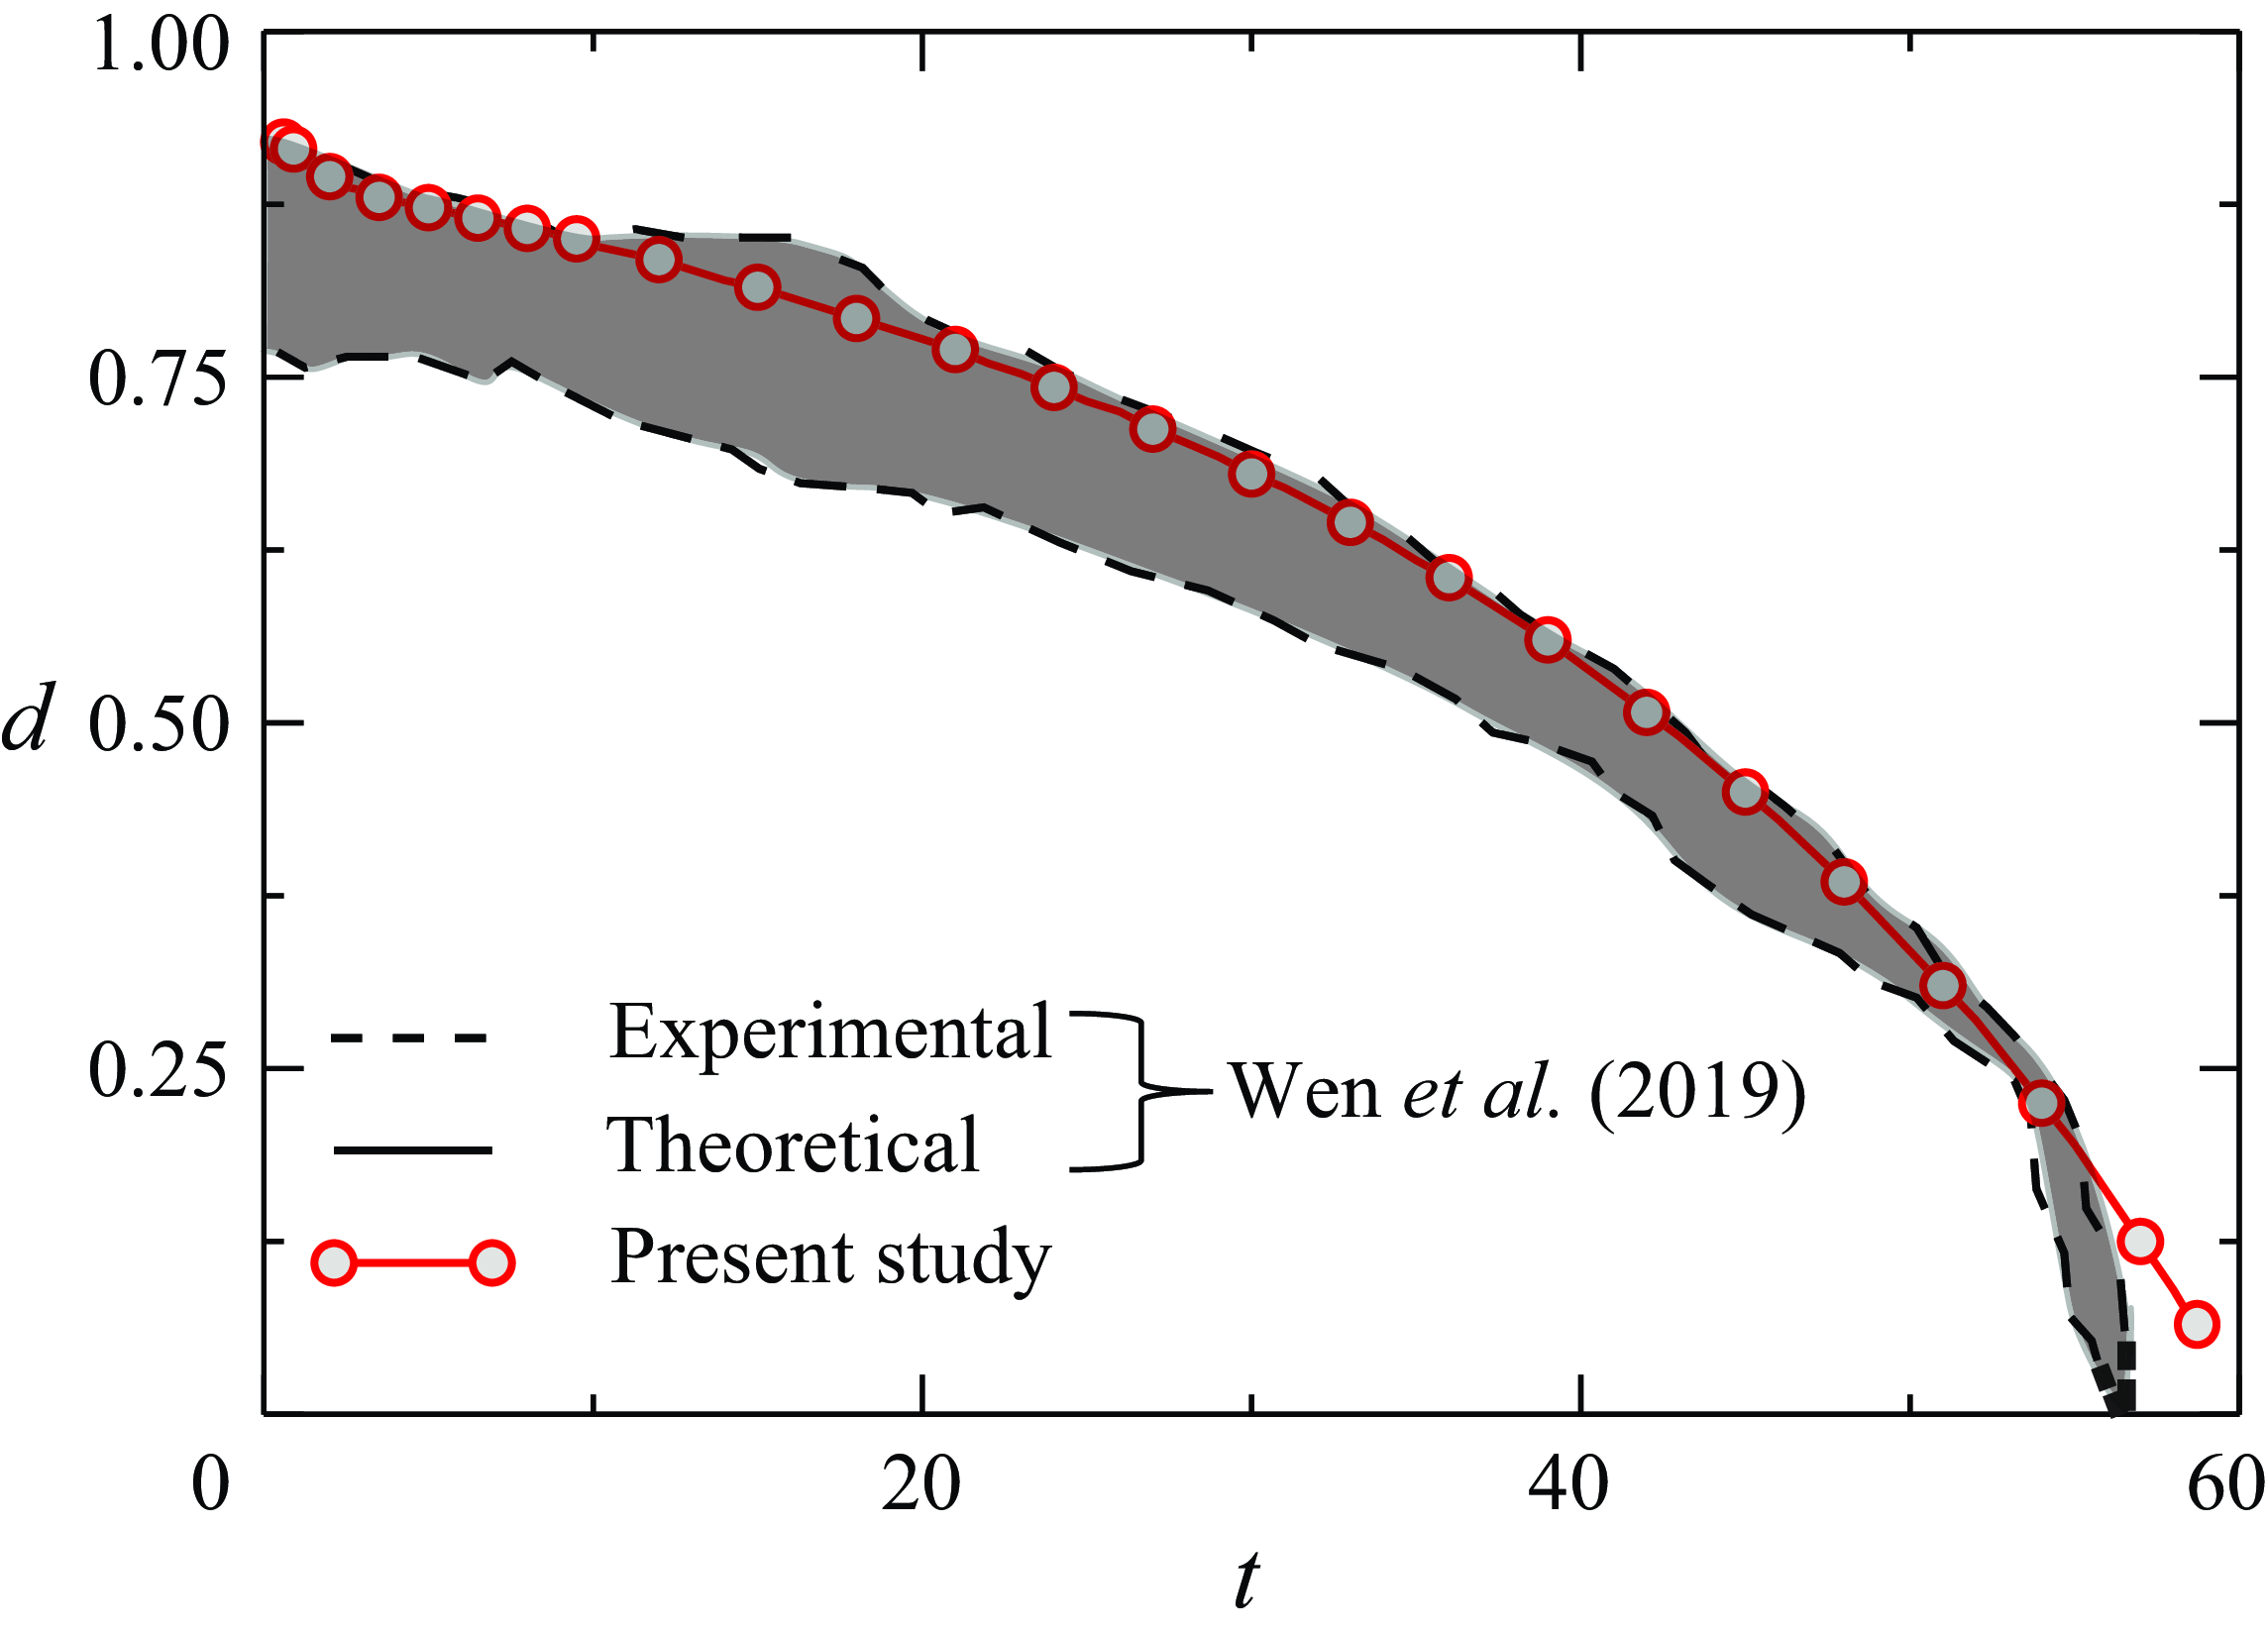
Further validation of our freezing model was conducted by simulating a scenario previously examined by Kavuri et al. (Reference Kavuri, Karapetsas, Sharma and Sahu2023) and Zadražil et al. (Reference Zadražil, Stepanek and Matar2006). Figure 15 shows the temporal evolution of the droplet shape, $h$
(solid line), and the freezing front,
$h$
(solid line), and the freezing front, $s$
(dash-dotted line), for a drop placed on a cold substrate. Figure 15(a) corresponds to data extracted from a scenario where only freezing is considered, without evaporation, as depicted in figure 3 of Kavuri et al. (Reference Kavuri, Karapetsas, Sharma and Sahu2023), which mimics figure 15 of Zadražil et al. (Reference Zadražil, Stepanek and Matar2006). Figure 15(b) represents the same scenario, but is analysed using our present formulation. The rest of the dimensionless parameters are
$s$
(dash-dotted line), for a drop placed on a cold substrate. Figure 15(a) corresponds to data extracted from a scenario where only freezing is considered, without evaporation, as depicted in figure 3 of Kavuri et al. (Reference Kavuri, Karapetsas, Sharma and Sahu2023), which mimics figure 15 of Zadražil et al. (Reference Zadražil, Stepanek and Matar2006). Figure 15(b) represents the same scenario, but is analysed using our present formulation. The rest of the dimensionless parameters are $\epsilon =0.2$
,
$\epsilon =0.2$
, $Ste = 0.04$
,
$Ste = 0.04$
, $T_{v} = 0.5$
,
$T_{v} = 0.5$
, $A_{n} = 6.25$
,
$A_{n} = 6.25$
, $D_{s} = \Lambda _{S} = \Lambda _{W} = RH = K = \rho _{veR} = 1$
,
$D_{s} = \Lambda _{S} = \Lambda _{W} = RH = K = \rho _{veR} = 1$
, $\Lambda _{g} = 0.6$
and
$\Lambda _{g} = 0.6$
and $D_{w} = D_{v} = \triangle = \Psi = \chi = Pe_{v} = 0$
. The dimensionless total freezing time in figures 15(a) and 15(b) are
$D_{w} = D_{v} = \triangle = \Psi = \chi = Pe_{v} = 0$
. The dimensionless total freezing time in figures 15(a) and 15(b) are $t_f=15$
and
$t_f=15$
and $t_f=16$
, respectively, which are reasonably in good agreement. It is noted that the set of parameters used in the present simulations corresponds to the typical set of parameters considered in figure 3 of Kavuri et al. (Reference Kavuri, Karapetsas, Sharma and Sahu2023), except the Biot number (
$t_f=16$
, respectively, which are reasonably in good agreement. It is noted that the set of parameters used in the present simulations corresponds to the typical set of parameters considered in figure 3 of Kavuri et al. (Reference Kavuri, Karapetsas, Sharma and Sahu2023), except the Biot number ( $Bi$
). In our model,
$Bi$
). In our model, $Bi$
is zero as we do not consider heat transfer due to convection. To account for the higher heat transfer in our model, we exaggerated the thermal conductivity ratio of the gas phase to the liquid phase
$Bi$
is zero as we do not consider heat transfer due to convection. To account for the higher heat transfer in our model, we exaggerated the thermal conductivity ratio of the gas phase to the liquid phase $\Lambda _g = \lambda _g/\lambda _l$
by comparing (2.62) and (2.64) of the present model with (A29) and (A31) from Kavuri et al. (Reference Kavuri, Karapetsas, Sharma and Sahu2023). Additionally, we found that the evolution of the freezing front,
$\Lambda _g = \lambda _g/\lambda _l$
by comparing (2.62) and (2.64) of the present model with (A29) and (A31) from Kavuri et al. (Reference Kavuri, Karapetsas, Sharma and Sahu2023). Additionally, we found that the evolution of the freezing front, $s$
(dash-dotted lines) and shape of the drop
$s$
(dash-dotted lines) and shape of the drop $h$
(solid line) placed on a cold substrate obtained using 4001, 9601 and 12 001 grid points are indistinguishable (figure 17).
$h$
(solid line) placed on a cold substrate obtained using 4001, 9601 and 12 001 grid points are indistinguishable (figure 17).
A.3 Comparison with Wen et al. (Reference Wen, Kim, Shi, Wang, Man, Doi and Russell2019)
Here, we validate our evaporation model by simulating a scenario examined by Wen et al. (Reference Wen, Kim, Shi, Wang, Man, Doi and Russell2019), who experimentally and theoretically investigated vapour-induced migration of two pure liquid droplets, without accounting for freezing. Figure 16 presents a comparison of the temporal evolution of the distance $d$
between two droplets prior to coalescence, as obtained from our simulations (neglecting freezing effects), with the results from Wen et al. (Reference Wen, Kim, Shi, Wang, Man, Doi and Russell2019). The shaded region between the two dashed black lines represents experimental data obtained from various trials for the evaporation of single-component n-hexane droplets at room temperature, while the solid black line shows the theoretical prediction, as reported in figure 2(a) of Wen et al. (Reference Wen, Kim, Shi, Wang, Man, Doi and Russell2019). The red solid line with circle symbols in figure 16 corresponds to our simulation results using the current formulation, which also neglects freezing. The dimensionless parameters used in our simulations are
$d$
between two droplets prior to coalescence, as obtained from our simulations (neglecting freezing effects), with the results from Wen et al. (Reference Wen, Kim, Shi, Wang, Man, Doi and Russell2019). The shaded region between the two dashed black lines represents experimental data obtained from various trials for the evaporation of single-component n-hexane droplets at room temperature, while the solid black line shows the theoretical prediction, as reported in figure 2(a) of Wen et al. (Reference Wen, Kim, Shi, Wang, Man, Doi and Russell2019). The red solid line with circle symbols in figure 16 corresponds to our simulation results using the current formulation, which also neglects freezing. The dimensionless parameters used in our simulations are $d_0 = 0.9$
,
$d_0 = 0.9$
, $\chi = 0.21$
,
$\chi = 0.21$
, $\triangle = 10^{-6}$
,
$\triangle = 10^{-6}$
, $\Psi = 0.03$
,
$\Psi = 0.03$
, $Pe_{v} = 0.048$
,
$Pe_{v} = 0.048$
, $Ste = 0$
,
$Ste = 0$
, $T_{v} = 0$
,
$T_{v} = 0$
, $A_{n} = 1.28$
,
$A_{n} = 1.28$
, $D_v = 10^{-3}$
,
$D_v = 10^{-3}$
, $D_{g} = 5.0$
,
$D_{g} = 5.0$
, $D_{s} = 0.9$
,
$D_{s} = 0.9$
, $\Lambda _{S} = 3.89$
,
$\Lambda _{S} = 3.89$
, $\Lambda _{W} = 11.5$
,
$\Lambda _{W} = 11.5$
, $\Lambda _{g} = 0.12$
,
$\Lambda _{g} = 0.12$
, $RH = 0$
,
$RH = 0$
, $K = 1.1\times 10^{-5}$
,
$K = 1.1\times 10^{-5}$
, $D_{w} = 15.0$
,
$D_{w} = 15.0$
, $\epsilon = 0.06$
and
$\epsilon = 0.06$
and $\rho _{veR} = 1.0$
. These parameters are consistent with those used in figure 2(a) of Wen et al. (Reference Wen, Kim, Shi, Wang, Man, Doi and Russell2019). Since evaporation experiments of Wen et al. (Reference Wen, Kim, Shi, Wang, Man, Doi and Russell2019) were conducted at room temperature without freezing, we have adjusted the non-dimensionalisation of the temperature to match their scenario within our freezing-inclusive formulation. Specifically, we modify
$\rho _{veR} = 1.0$
. These parameters are consistent with those used in figure 2(a) of Wen et al. (Reference Wen, Kim, Shi, Wang, Man, Doi and Russell2019). Since evaporation experiments of Wen et al. (Reference Wen, Kim, Shi, Wang, Man, Doi and Russell2019) were conducted at room temperature without freezing, we have adjusted the non-dimensionalisation of the temperature to match their scenario within our freezing-inclusive formulation. Specifically, we modify $\triangle T = T_{m} - T_{c}$
to
$\triangle T = T_{m} - T_{c}$
to $\triangle T = \epsilon ^2 T_c$
in (2.30) of our formulation. Additionally, we have considered a slightly greater gas layer thickness (
$\triangle T = \epsilon ^2 T_c$
in (2.30) of our formulation. Additionally, we have considered a slightly greater gas layer thickness ( $D_g$
) than in our previous simulations due to the absence of specific information from Wen et al. (Reference Wen, Kim, Shi, Wang, Man, Doi and Russell2019), and we reasonably assumed that the chamber height significantly exceeds the droplet height. Figure 16 demonstrates that our numerical simulation closely matches the experimental data of Wen et al. (Reference Wen, Kim, Shi, Wang, Man, Doi and Russell2019), validating our evaporation model.
$D_g$
) than in our previous simulations due to the absence of specific information from Wen et al. (Reference Wen, Kim, Shi, Wang, Man, Doi and Russell2019), and we reasonably assumed that the chamber height significantly exceeds the droplet height. Figure 16 demonstrates that our numerical simulation closely matches the experimental data of Wen et al. (Reference Wen, Kim, Shi, Wang, Man, Doi and Russell2019), validating our evaporation model.
A.4 Grid convergence test
Evolution of the freezing front, $s$
(dash-dotted lines) and shape of the drop
$s$
(dash-dotted lines) and shape of the drop $h$
(solid line) placed on a cold substrate. The results obtained using 4001, 9601 and 12 001 grid points are found to be indistinguishable. The rest of the dimensionless parameters are
$h$
(solid line) placed on a cold substrate. The results obtained using 4001, 9601 and 12 001 grid points are found to be indistinguishable. The rest of the dimensionless parameters are $Ste = 1.7 \times 10^{-4}$
,
$Ste = 1.7 \times 10^{-4}$
, $T_{v} = 0.2$
,
$T_{v} = 0.2$
, $A_{n} = 6.25$
,
$A_{n} = 6.25$
, $D_{g} = 2$
,
$D_{g} = 2$
, $D_{s} = 0.9$
,
$D_{s} = 0.9$
, $\Lambda _{S} = 3.82$
,
$\Lambda _{S} = 3.82$
, $\Lambda _{W} = 191$
,
$\Lambda _{W} = 191$
, $\chi = 0.23$
,
$\chi = 0.23$
, $K = 8\times 10^{-4}$
,
$K = 8\times 10^{-4}$
, $\rho _{veR} = 1.09$
,
$\rho _{veR} = 1.09$
, $\Lambda _{g} = 3.5$
,
$\Lambda _{g} = 3.5$
, $D_{w} = 7.5$
,
$D_{w} = 7.5$
, $RH = 0.90$
,
$RH = 0.90$
, $\epsilon =0.2$
,
$\epsilon =0.2$
, $D_{v} = 4.45 \times 10^{-6}$
,
$D_{v} = 4.45 \times 10^{-6}$
, $\triangle = 10^{-4}$
,
$\triangle = 10^{-4}$
, $\Psi = 0.14$
and
$\Psi = 0.14$
and $Pe_{v} = 1$
. The value of the dimensionless total freezing time (
$Pe_{v} = 1$
. The value of the dimensionless total freezing time ( $t_f$
) of the droplet is 1210.
$t_f$
) of the droplet is 1210.
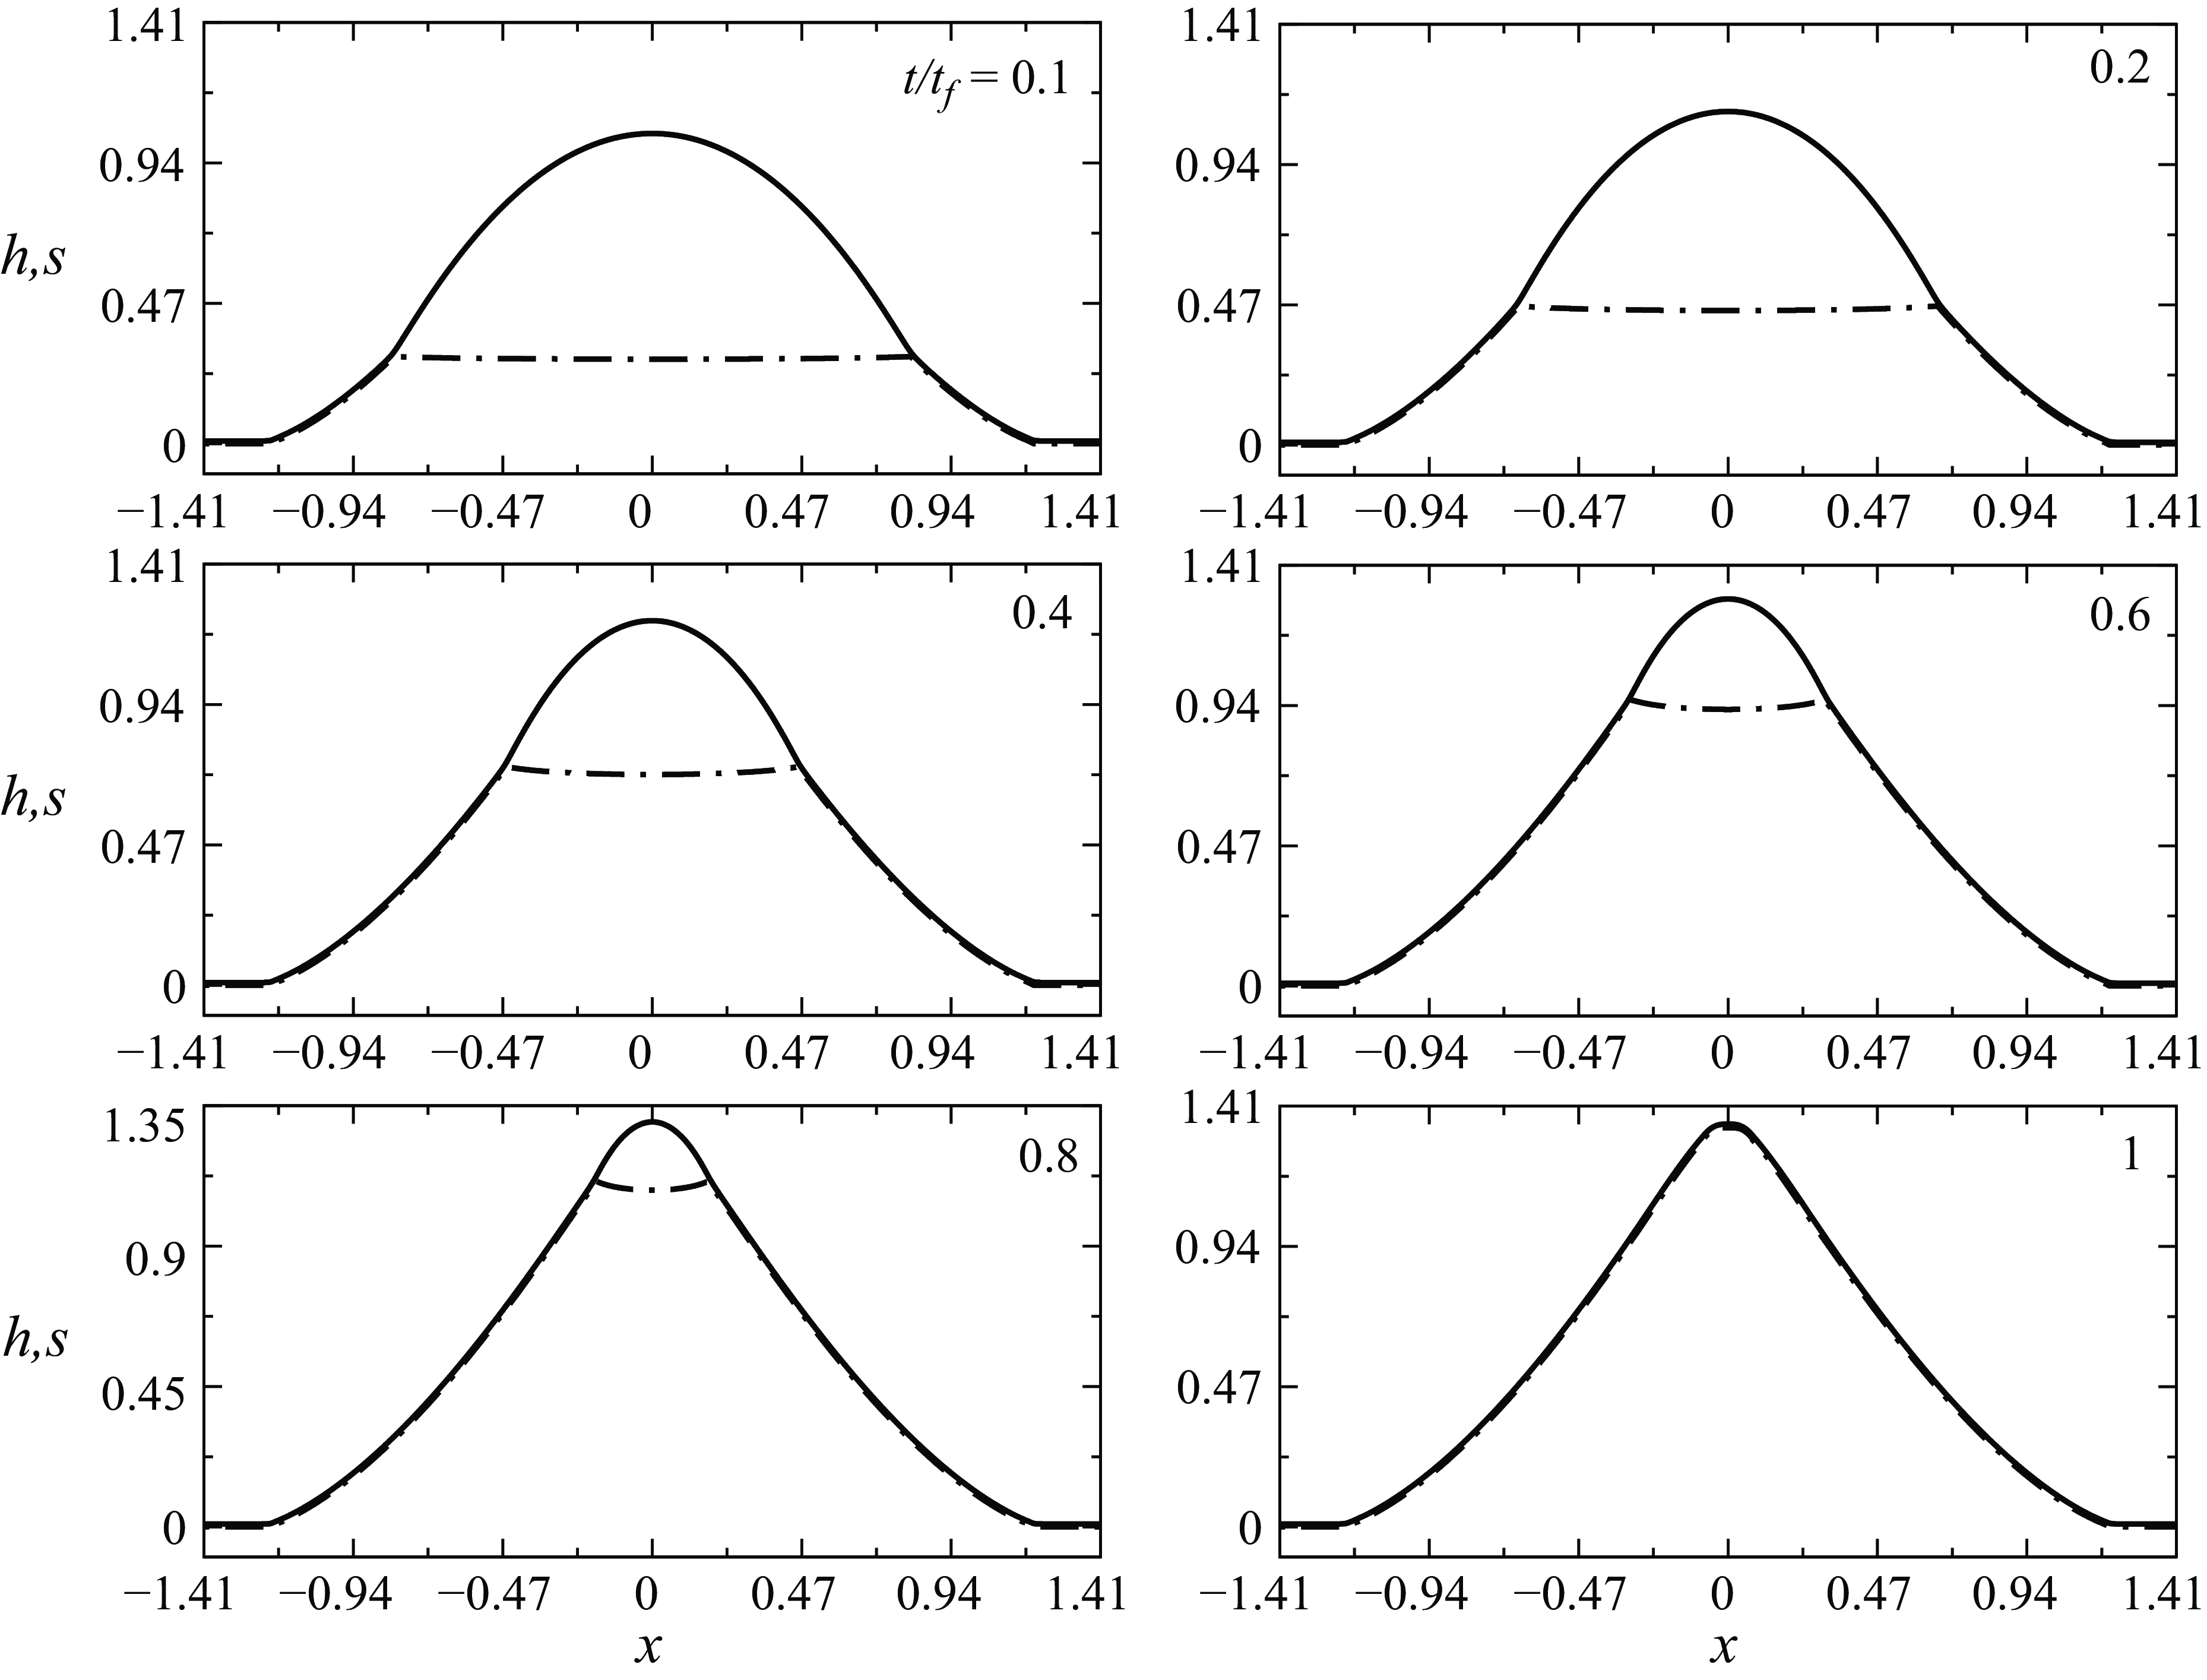


 Open access