


INTRODUCTION
Political scientists increasingly leverage randomized experiments to estimate causal effects in human subjects research, particularly through surveys. A common experimental design, the between-groups “post-only” design, randomly assigns participants to treatment conditions and measures the outcome variable(s) only posttreatment. The average treatment effect (ATE) is estimated by comparing the outcome means across groups. However, this predominant design suffers from low precision when estimating treatment effects and may miss small or heterogeneous treatment effects (Mutz Reference Mutz2011) while also risking substantial overestimates of effects (Gelman and Carlin Reference Gelman and Carlin2014; Loken and Gelman Reference Loken and Gelman2017). Given the increasing evidence that low precision reduces replicability rates in social science research (Arel-Bundock et al. Reference Arel-Bundock, Briggs, Doucouliagos, Aviña and Stanley2026; Gelman and Carlin Reference Gelman and Carlin2014), improving experimental design is essential for advancing research in political science and related disciplines.
An alternative experimental design is the “repeated measure” design, which measures outcomes both pre- and post-treatment. By measuring respondents’ pretreatment outcome levels, repeated measure designs can substantially increase precision in ATE estimates. Yet, researchers have often been reluctant to implement repeated measure designs, especially within the same survey, due to concerns that pretreatment measurement of outcomes may inadvertently bias ATE estimates by priming respondents to the treatment, inducing pressure to provide consistent responses, or creating demand incentives. Lacking clear evidence about the degree of bias introduced versus precision gained, researchers have historically opted against repeated measure designs.
However, a recent influential study by Clifford, Sheagley, and Piston (Reference Clifford, Sheagley and Piston2021, referred to as CSP hereafter) in this journal experimentally manipulates design type, providing evidence that repeated measure designs enhance precision without biasing ATE estimates. CSP concludes that traditional concerns about repeated measure designs can be largely dismissed, recommending “that researchers use pre–post and within-subject designs whenever possible” (Clifford, Sheagley, and Piston Reference Clifford, Sheagley and Piston2021, 1062). These recommendations have gained traction in the social sciences: in the first 4 years since publication, CSP was cited by 118 peer-reviewed studies, of which 83 cite CSP specifically to justify using repeated measure designs.
The rapid adoption of repeated measure designs speaks to the importance of CSP’s findings. Yet, CSP’s conclusions rest on just six experiments—a valuable but ultimately limited basis for such a broad shift in survey experimental practice, and thus one that merits large-scale replication. Researchers also lack information on key design considerations that could impact the utility of repeated measure designs in some settings. For example, it remains unclear whether these designs are suitable for short surveys. CSP placed their pre- and post-treatment measures far apart, reflecting the intuition that placing them close together might increase bias by making the repetition more apparent. In this and other respects, best practices for implementing repeated measure designs remain underdeveloped.
In a large-scale replication and extension, we substantially expand the available evidence on repeated measure designs and address three key knowledge gaps. First, we assess the suitability of repeated measure designs for between-groups versus within-subject experiments. Second, we analyze how the proximity between repeated measures alters design effects, offering insights on the suitability of repeated measure designs when pre- and post-treatment measures are placed close together. Third, we conduct experiments on both probability- and nonprobability-based samples with diverse respondent pools to assess how respondent characteristics like professionalization and attentiveness affect the bias-precision trade-off.
We experimentally manipulate the design of six published political science experiments, including three within-subject experiments and three between-groups experiments to allow for comparison across experiment types. We randomly vary the proximity of repeated measures in these experiments to evaluate how this design consideration affects bias and precision. We field all six experiments in omnibus surveys on three distinct online samples of U.S. adults ( $ {N}_j=18 $
studies,
$ {N}_j=18 $
studies, $ {N}_i=\mathrm{13,163} $
respondents,
$ {N}_i=\mathrm{13,163} $
respondents, $ {N}_{ij}=\mathrm{78,978} $
total observations). These include a sample from the probability-based AmeriSpeak panel maintained by NORC (
$ {N}_{ij}=\mathrm{78,978} $
total observations). These include a sample from the probability-based AmeriSpeak panel maintained by NORC ( $ {n}_i=\mathrm{4,033} $
) and two nonprobability samples (Lucid
$ {n}_i=\mathrm{4,033} $
) and two nonprobability samples (Lucid $ {n}_i=\mathrm{4,869} $
, Prolific
$ {n}_i=\mathrm{4,869} $
, Prolific $ {n}_i=\mathrm{4,261} $
). These large samples provide excellent statistical power to detect small design effects and assess moderators.
$ {n}_i=\mathrm{4,261} $
). These large samples provide excellent statistical power to detect small design effects and assess moderators.
Contrary to CSP’s original findings, we observe a small but consistent attenuation of treatment effects in repeated measure designs relative to post-only designs. Despite this design effect, our findings largely affirm CSP’s case for repeated measure designs, as the substantial precision gains often outweigh the weak attenuation in treatment effects to produce (in expectation) more accurate ATE estimates in many (though not all) practical applications. Further, we provide robust evidence that repeated measure designs are suitable for both within-subject and between-groups experiments, across probability and nonprobability samples with varying levels of respondent professionalization and attention, and in surveys where repeated measures must necessarily appear in close proximity. That said, we also find some evidence that asking attitude-recall questions or fielding multiple repeated measure experiments in one survey may exacerbate later design effects. In sum, while we identify some circumstances where well-powered post-only designs may be preferable, our findings reinforce the field’s nascent shift toward repeated measure designs and the enhanced precision they offer.
REPEATED MEASURE DESIGNS IN THE SOCIAL SCIENCES
Survey experiments are widely used for social inquiry, with the “post-only,” between-groups design being the most common in political science (Clifford, Sheagley, and Piston Reference Clifford, Sheagley and Piston2021). In this design, participants are randomly assigned and exposed to treatment or control stimuli, then outcomes are measured posttreatment and compared across conditions, with differences between the treatment groups’ outcomes interpreted as the average treatment effect (ATE). Under a set of relatively weak assumptions—successful randomization, the stable unit treatment value assumption (SUTVA), no differential attrition—the post-only design provides unbiased estimates of the ATE.
A major downside of post-only designs is that the treatment effect is often imprecisely estimated. Treatment interventions in the social sciences typically explain only a small fraction of the variation in the outcome variable. Post-only designs therefore often have large residual errors, reducing statistical power—a critical consideration for experimental design (Rainey Reference Rainey2025). Statistical power ( $ \beta $
) is the probability that a test rejects its null hypothesis in favor of a specified alternative hypothesis if it is true, a common goal of experiments. Power for a two-tailed test of a treatment effect (
$ \beta $
) is the probability that a test rejects its null hypothesis in favor of a specified alternative hypothesis if it is true, a common goal of experiments. Power for a two-tailed test of a treatment effect ( $ \tau $
) can be expressed as follows:
$ \tau $
) can be expressed as follows:
 $$ \beta =1-{\Phi}_{cdf}\left[{\Phi}_{std}^{-1}\left(1-\frac{\alpha }{2}\right)\cdot {SE}_{\tau };\mu =\tau, \sigma ={SE}_{\tau}\right], $$
where $ {\Phi}_{cdf} $
is the cumulative density function of a normal distribution,
$ {\Phi}_{cdf} $
is the cumulative density function of a normal distribution, $ {\Phi}_{std}^{-1} $
is the inverse of the standard normal distribution,
$ {\Phi}_{std}^{-1} $
is the inverse of the standard normal distribution, $ \alpha $
is the chosen significance threshold of the test (for example,
$ \alpha $
is the chosen significance threshold of the test (for example, $ 0.05 $
), and
$ 0.05 $
), and $ {SE}_{\tau } $
is the standard error of the treatment effect
$ {SE}_{\tau } $
is the standard error of the treatment effect $ \tau $
, whose sampling distribution is assumed to be a normally distributed variable with a mean of
$ \tau $
, whose sampling distribution is assumed to be a normally distributed variable with a mean of $ \mu =\tau $
and standard deviation of
$ \mu =\tau $
and standard deviation of $ \sigma ={SE}_{\tau } $
. With an ordinary least squares (OLS) estimator, a standard approach for hypothesis testing in survey experiments, the standard error of the ATE (
$ \sigma ={SE}_{\tau } $
. With an ordinary least squares (OLS) estimator, a standard approach for hypothesis testing in survey experiments, the standard error of the ATE ( $ {SE}_{\hat{\tau}} $
) is estimated as follows:
$ {SE}_{\hat{\tau}} $
) is estimated as follows:
 $$ {\hat{SE}}_{\hat{\tau}}=\frac{\hat{\sigma}}{\sqrt{\sum_{i=1}^N{\left({D}_i-\overline{D}\right)}^2}}, $$
where $ {D}_i $
, an indicator for assignment to treatment, and the root mean squared error
$ {D}_i $
, an indicator for assignment to treatment, and the root mean squared error $ \hat{\sigma} $
is an asymptotic function of the residual errors
$ \hat{\sigma} $
is an asymptotic function of the residual errors $ {\hat{u}}_i $
and the sample size
$ {\hat{u}}_i $
and the sample size $ N $
:
$ N $
:
 $$ \hat{\sigma}\approx \sqrt{\frac{\sum_{i=1}^N{{\hat{u}}_i}^2}{N}}. $$
The large residuals common to post-only designs thus reduce statistical power by increasing the standard error of the treatment effect estimate, expanding the confidence interval around $ \hat{\tau} $
, and reducing the probability that this interval excludes the null value of the parameter of interest (e.g.,
$ \hat{\tau} $
, and reducing the probability that this interval excludes the null value of the parameter of interest (e.g., $ \tau =0 $
), thus reducing the likelihood the null hypothesis can be rejected. Post-only designs therefore require large samples to reliably detect and precisely estimate treatment effects (Peters Reference Peters2017).
$ \tau =0 $
), thus reducing the likelihood the null hypothesis can be rejected. Post-only designs therefore require large samples to reliably detect and precisely estimate treatment effects (Peters Reference Peters2017).
Imprecision has myriad negative effects on scientific knowledge production. Imprecise studies risk failing to detect small treatment effects and variations in effects (Mutz Reference Mutz2011) and may overestimate effect sizes (Gelman and Carlin Reference Gelman and Carlin2014; Loken and Gelman Reference Loken and Gelman2017). Structural incentives to publish “positive” findings meeting conventional significance thresholds can lead to published experiments with noisy data and brittle evidence propping up weak theories (Gerber, Green, and Nickerson Reference Gerber, Green and Nickerson2001; Kühberger, Fritz, and Scherndl Reference Kühberger, Fritz and Scherndl2014). Statistical imprecision and underpowered experiments are increasingly recognized as major contributors to low replicability rates in social science research (Arel-Bundock et al. Reference Arel-Bundock, Briggs, Doucouliagos, Aviña and Stanley2026; Gelman and Carlin Reference Gelman and Carlin2014). Increasing precision in survey experiments is thus vital to enhancing the credibility of empirical social science.
Repeated measure designs offer improvements over post-only designs in terms of precision and power. Researchers have long recognized that the standard errors of estimated treatment effects can be reduced by adjusting for pretreatment covariates, as this reduces the residual errors $ {\hat{u}}_i $
by accounting for some additional variation in the outcome variable. This accordingly reduces
$ {\hat{u}}_i $
by accounting for some additional variation in the outcome variable. This accordingly reduces $ {SE}_{\hat{\tau}} $
by approximately
$ {SE}_{\hat{\tau}} $
by approximately $ \sqrt{\left(1-{\rho}^2\right)} $
(Bloom Reference Bloom1995; Cox and McCullagh Reference Cox and McCullagh1982), where
$ \sqrt{\left(1-{\rho}^2\right)} $
(Bloom Reference Bloom1995; Cox and McCullagh Reference Cox and McCullagh1982), where $ \rho $
is the correlation between the outcome variable
$ \rho $
is the correlation between the outcome variable $ {\hat{Y}}_i $
and the pretreatment covariate
$ {\hat{Y}}_i $
and the pretreatment covariate $ {\hat{X}}_i $
—meaning that the stronger the correlation, the greater the reduction in
$ {\hat{X}}_i $
—meaning that the stronger the correlation, the greater the reduction in $ {SE}_{\hat{\tau}} $
. Statistical power thus improves to
$ {SE}_{\hat{\tau}} $
. Statistical power thus improves to
 $$ \beta \approx 1-{\Phi}_{cdf}\left[\right({\Phi}_{std}^{-1}\left(1-\frac{\alpha }{2}\right)\cdot \sqrt{\left(1-{\rho}^2\right)}\cdot {SE}_{\tau };\mu =\tau, \sigma ={SE}_{\tau}\Big]. $$
The logic of repeated measure designs is that the pretreatment covariate likely to correlate best with the posttreatment outcome is an identical pretreatment outcome measure. This design therefore measures outcomes both before and after exposure to treatment. By adjusting for respondents’ pretreatment outcome levels, this approach greatly enhances the precision of treatment effect estimates, substantially reducing the sample size required to achieve conventional levels of statistical power.
Despite these advantages, researchers often worry that repeated measure designs may bias the ATE estimate. Repeated measure designs require an additional assumption beyond those in post-only designs: that pretreatment measurement does not itself influence posttreatment outcomes differentially across treatment arms. Three concerns cast doubt on that assumption: priming, where pretreatment measurement may lead respondents to focus on specific considerations (e.g., Klar, Leeper, and Robison Reference Klar, Leeper and Robison2020); consistency pressures, where respondents may feel pressure to provide posttreatment responses that align with their pretreatment responses (e.g., Cialdini, Trost, and Newsom Reference Cialdini, Trost and Newsom1995; Tourangeau and Rasinski Reference Tourangeau and Rasinski1988); and demand effects, where respondents may adjust their posttreatment responses based on their perception of the study’s purpose (e.g., Charness, Gneezy, and Kuhn Reference Charness, Gneezy and Kuhn2012; Zizzo Reference Zizzo2010; but see Mummolo and Peterson Reference Mummolo and Peterson2019).Footnote 1
Conventional wisdom thus suggests a trade-off between bias and precision when considering post-only or repeated measure designs. In practice, political science survey experiments have typically prioritized minimizing bias over addressing imprecision, defaulting to post-only designs (Clifford, Sheagley, and Piston Reference Clifford, Sheagley and Piston2021). To the best of our knowledge, CSP is the only study to date that empirically tests the bias-precision trade-off for repeated measure designs. Their internal meta-analysis of six experiments found no significant differences in estimated ATEs between the two designs, but found that repeated measure designs substantially improve precision, allowing researchers to achieve more power with fewer participants. For instance, a 1,000 respondent two-arm post-only experiment has roughly 80% power to detect a treatment effect of 0.20 standard deviations, but a repeated measure design can achieve the same power with about 200–600 respondents, depending on the strength of the correlation between pre- and posttreatment measures. Given these large precision gains and minimal evidence of bias, CSP argues that there is no meaningful bias-precision trade-off and recommends that researchers employ repeated measure designs as the default.
CONTRIBUTION AND HYPOTHESES
CSP provides a valuable, overdue examination of the bias-precision trade-off in repeated measure designs. As of April 2025, CSP has been cited in 118 peer-reviewed studies, of which 83 are original studies citing CSP to justify a repeated measure design (see Supplementary Table A.5.1 for the full list of studies). While most citations are from political science journals, the citations span 83 journals in a range of fields, including communication, criminology, economics, education, and environmental studies. The article’s broad influence on experimental practice is already clear and likely to grow as disciplines become more critical of underpowered experiments (Arel-Bundock et al. Reference Arel-Bundock, Briggs, Doucouliagos, Aviña and Stanley2026; Ioannidis, Stanley, and Doucouliagos Reference Ioannidis, Stanley and Doucouliagos2017; Open Science Collaboration 2015).
However, the empirical literature on this design remains limited. CSP’s analysis is only well-powered to rule out large design effects—on the order of altering the ATE by 40% or more (Huber and Graham Reference Huber, Graham, Snowberg and Yariv2025). Moderate design effects, which could be substantively meaningful in many contexts, require larger samples to detect. Additionally, key questions about best practices for repeated measure designs remain unanswered. First, repeated measure designs come in two main types: between-groups, where respondents are randomized to either treatment or control stimuli after pretreatment measurement, and within-subject, where all respondents receive both treatment and control stimuli (Clifford, Sheagley, and Piston Reference Clifford, Sheagley and Piston2021; List Reference List2025). 41% of studies citing CSP employed within-subject repeated measure designs rather than between-groups designs (see Supplementary Table A.5.1), yet just one of CSP’s experiments employed a within-subject design—a rather limited basis for a large shift in research practice. Because within-subject designs assign all participants to treatment (either before or after the control), they may alter the scope of consistency, demand, or priming effects relative to between-groups designs—meaning that design effects may differ in magnitude across the two approaches.
Our study substantially expands the evidence on design effects under within-subject designs by replicating three within-subject experiments in each of three samples, totaling nine studies with a meta-analytic sample over 43 times larger than the single study analyzed by CSP. Simultaneously, we replicate three of CSP’s between-groups experiments on the same samples to further expand the evidence base for between-groups repeated measure designs. This allows us to rigorously test the preregisteredFootnote 2 hypothesis that:
H1: Repeated-measure experimental designs do not bias estimated ATEs in either (a) between-group experiments or (b) within-subject experiments.
Second, we are not aware of any study to date that assesses how the proximity between repeated measures affects bias and precision. An intuitive hypothesis is that increasing the distance between repeated measures through the addition of unrelated survey content could reduce bias by mitigating priming, obscuring researcher intent, and enabling respondents to “forget” their pretreatment responses, reducing pressure (or ability) to respond consistently. Indeed, given this intuition, many repeated measure experiments employ multi-wave panel surveys, allowing days or weeks of separation between measures. In single surveys, researchers (including CSP) commonly place their pre- and post-treatment questions at opposite ends of the survey to maximize separation. However, experimenters frequently work with very short surveys (or short modules in omnibus surveys), facing resource or logistical constraints that may require placing repeated measures close together. Further, close proximity may even be advantageous if it reduces random noise, strengthening the correlation between the repeated measures and increasing precision. We manipulate proximity between repeated measures in our surveys to test the following preregistered hypothesis:
H2: Repeated-measure experimental designs increase bias in estimated ATEs when repeated measures are presented close together.
Third, CSP’s six experiments used two student and four online nonprobability samples. While their findings are important given the reliance on such convenience samples in experimental research (Jerit and Barabas Reference Jerit and Barabas2023; Krupnikov and Levine Reference Krupnikov and Levine2014; but see Westwood Reference Westwood2025), it is unclear if the null design effect CSP observe is due to sampling design. Student samples differ from older adults on a variety of attitudinal and behavioral dimensions (Sears Reference Sears1986). Probability-based sampling designs recruit respondents that are not only more representative of the target population but also less professionalized and more attentive than opt-in nonprobability panelists (Kennedy et al. Reference Kennedy, Mercer, Keeter, Hatley, McGeeney and Gimenez2016; MacInnis et al. Reference MacInnis, Krosnick, Ho and Cho2018).
Differences in respondent characteristics may affect the relative strength of priming, consistency, or demand effects in repeated measure designs. For example, one of CSP’s experiments ( $ N=965 $
students) revealed that many respondents whose responses changed pre-post also self-reported that their attitudes stayed the same. This may result from the unobtrusiveness of repeated measures—affirming their utility—but respondent inattentiveness may also play a role. Attentive respondents may be more likely to recognize repeated questions and alter their posttreatment responses accordingly. Similarly, professionalized respondents may be accustomed to experiments and react differently to repeated measures than less professionalized respondents. We explore these possibilities by fielding identical experiments on both probability and nonprobability samples.
$ N=965 $
students) revealed that many respondents whose responses changed pre-post also self-reported that their attitudes stayed the same. This may result from the unobtrusiveness of repeated measures—affirming their utility—but respondent inattentiveness may also play a role. Attentive respondents may be more likely to recognize repeated questions and alter their posttreatment responses accordingly. Similarly, professionalized respondents may be accustomed to experiments and react differently to repeated measures than less professionalized respondents. We explore these possibilities by fielding identical experiments on both probability and nonprobability samples.
DATA AND METHODS
We replicate six previously published survey experiments, summarized in Table 1, randomly manipulating each experimental design (post-only versus repeated measure).Footnote 3 We briefly describe each experiment, with additional information provided in Section B of the Supplementary Material.
Summary of Replicated Survey Experiments

In Study 1, we replicate a classic information treatment experiment on support for foreign aid spending (from Gilens Reference Gilens2001), in which treated respondents are informed that foreign aid spending represents about 1% of the U.S. federal budget. We expect this treatment to increase support. In Study 2, we replicate a party cues experiment from CSP on policy support for prescription drug imports from Canada, in which treated respondents are told that Democrats support and Republicans oppose this policy. Here, we analyze the second difference in support between Democrats and Republicans among those treated versus not treated. We expect the treatment to increase support among Democrats and decrease support among Republicans, widening the gap between the parties. In Study 3, we replicate a framing experiment from CSP on support for genetically modified organisms (GMOs), in which respondents are either treated with positively framed information about GMOs (treatment) or negatively framed information about GMOs (control). We expect the positively framed treatment to increase support relative to the negatively framed control. In Study 4, we replicate a classic question wording experiment on support for antipoverty spending (from Smith Reference Smith1987) that asks about support for spending on “welfare” or “assistance to the poor.” We expect support to be higher when spending is described as assistance to the poor relative to welfare. In Study 5, we replicate a classic study on affirmative action (from Wilson et al. Reference Wilson, Moore, McKay and Avery2008), which asks about support for affirmative action for women or for racial minorities. We expect support to be higher when the policy is aimed at women relative to racial minorities. In Study 6, we replicate a study (from de Benedictis-Kessner and Hankinson Reference de Benedictis-Kessner and Hankinson2019) on support for opening a new methadone clinic to address opioid addiction, in which the proposed clinic would be nearby (a quarter mile away) or further away (two miles away) from where the respondent lives. We expect that support will be higher in the latter condition. We thus define treatment and control (somewhat arbitrarily) such that the relevant ATE in each study is expected to be positive, to facilitate comparison across all six experiments.
These six studies were selected for their brevity (no more than three questions each), allowing us to field more studies in a single survey, and because each found moderate to large treatment effects in the original studies, improving our ability to estimate design effects.Footnote 4 We purposively selected replication studies to cover diverse topics and treatments (e.g., informational, party cues, framing effects) to provide breadth across areas of substantive inquiry (Clifford, Leeper, and Rainey Reference Clifford, Leeper and Rainey2024; Clifford and Rainey Reference Clifford and Rainey2025). Four of our studies also appear in CSP,Footnote 5 and we supplement these with experiments from Wilson et al. (Reference Wilson, Moore, McKay and Avery2008, denoted Study 5) and de Benedictis-Kessner and Hankinson (Reference de Benedictis-Kessner and Hankinson2019, denoted Study 6) to increase the number of within-subject studies. We thus have three between-groups and three within-subject repeated measure designs for comparison against post-only designs.
Experimental Design
We fielded all six studies on three omnibus surveys and manipulated the experimental designs in a preregistered multi-stage randomization procedure (detailed in Section B.3 of the Supplementary Material). All respondents in each sample (combined $ {N}_i=\mathrm{13,163} $
respondents) completed all six experiments (combined
$ {N}_i=\mathrm{13,163} $
respondents) completed all six experiments (combined $ {N}_{ij}=\mathrm{78,978} $
observations). Our randomization procedure independently assigned design conditions (post-only or repeated measures), treatment conditions (treatment or control stimuli), and the order of the experimental content. In the between-groups repeated measure designs, respondents first answered the outcome question, were then exposed to the assigned stimulus, and answered the same outcome question again. In the within-subject designs, respondents were first randomly exposed to one stimulus and completed the outcome measurement and then were later exposed to the other stimulus and again completed the outcome measurement. For replication data, see Jordan, Ollerenshaw, and Trexler (Reference Jordan, Ollerenshaw and Trexler2026).
$ {N}_{ij}=\mathrm{78,978} $
observations). Our randomization procedure independently assigned design conditions (post-only or repeated measures), treatment conditions (treatment or control stimuli), and the order of the experimental content. In the between-groups repeated measure designs, respondents first answered the outcome question, were then exposed to the assigned stimulus, and answered the same outcome question again. In the within-subject designs, respondents were first randomly exposed to one stimulus and completed the outcome measurement and then were later exposed to the other stimulus and again completed the outcome measurement. For replication data, see Jordan, Ollerenshaw, and Trexler (Reference Jordan, Ollerenshaw and Trexler2026).
Of note, we hypothesized that design effects might be more pronounced when repeated measures are close together because respondents may be more likely to remember answering the same or similar questions, strengthening any priming, consistency, or demand effects. To test for this potential heterogeneity, our procedure has three noteworthy design features.
First, respondents were randomly assigned to four repeated measure designs and two post-only designs. The relatively larger share of repeated measure designs increases power for testing differences in design effects at various “distances” between repeated measures (defined as the numberFootnote 6 of survey items separating the repeated measures). Second, we randomly assigned approximately half of respondents to complete two repeated measure experiments in very close succession, with just 0–3 units of separation between measures. This increases statistical power where we suspected we might find nonlinear changes in design effects—that is, when repeated measures are very close together—while still allowing for comparisons across distances by independently randomizing the content that could appear in between any given pair of repeated measures. Third, we included six wholly unrelated questions about the National Football League (NFL), randomized alongside the main content, to extend the right tail of the distance distribution and provide additional distractor items that could appear between repeated measures.Footnote 7 The realized distribution of distances is shown in Figure 1 (see Section B.3 of the Supplementary Material for details and illustrative examples).Footnote 8
Histogram of Distances between Repeated Measures
Note: The figure shows the observed distances (counts of survey items) separating the pre- and post-treatment measures for observations in the repeated measure design setting. Data include pooled observations from all experiments in all samples.

Our randomization procedure thus provides us with unbiased estimates of design effects while maximizing statistical power where we expected (a priori) that it would matter most—that is, where repeated measures appear very close together in the survey. By comparing point estimates for the ATE under the post-only versus repeated measure design, we can identify design effects introduced from repeated measure designs (addressing H1). We can also identify precision gained from repeated measure designs by comparing standard errors for the post-only and repeated measure designs (using bootstrapped regressions with equivalent sample sizes to account for the 2:1 oversampling of repeated measure designs). And by oversampling scenarios in which repeated measures appear in close proximity, we can carefully test whether this proximity moderates design effects (addressing H2).
Sampling Approach
We fielded our experiments on three samples with concurrent omnibus surveys from June 27 through July 15, 2024. Building on CSP’s original studies, which drew samples from undergraduate pools or opt-in online panels, we obtained one sample from a probability-based online panel (NORC’s AmeriSpeak panel) in addition to two nonprobability samples recruited via quota sampling on Prolific and Lucid. These vendors are often used for political science research and offer substantial diversity in terms of respondent professionalization, respondent attentiveness, and sample representativeness on observables (Stagnaro et al. Reference Stagnaro, Druckman, Berinsky, Arechar, Willer and Rand2024). Table 2 summarizes key information for each sample; for further information, see Section B of the Supplementary Material.
Sample and Median Respondent Characteristics

Two key respondent characteristics vary across our three samples. The first is respondent professionalization, which refers to survey respondents’ familiarity with and frequency of survey taking. Most Americans take few surveys regularly; however, a small minority of Americans take many surveys frequently for income or entertainment (Hillygus, Jackson, and Young Reference Hillygus, Jackson, Young, Callegaro, Baker, Bethlehem, Göritz, Krosnick and Lavrakas2014). These professionalized respondents constitute an out-sized share of nonprobability panels like Prolific and Lucid because high-propensity respondents can voluntarily opt into such panels and take surveys on demand. In contrast, members of probability-based panels like AmeriSpeak can only join if randomly sampled, and organizations that manage such panels invite panelists to take surveys relatively infrequently. Indeed, our AmeriSpeak respondents are much less professionalized than our Prolific and Lucid respondents in terms of the number of recent surveys taken and unique survey panel memberships (see Table 2).
Professionalization may cause respondents to react differently to repeated measures, though in what direction remains uncertain. On the one hand, professionalized respondents may be inured to peculiarities of survey experiments like repeated measures, dampening design effects. Alternatively, professionalized respondents may be more likely to recognize that questions before and after experimental stimuli are testing for opinion change, heightening demand effects or consistency pressures. How respondent professionalization influences design effects is theoretically unclear and empirically untested.
The second relevant dimension is response quality, defined here as respondent attention and effort. A perennial issue in survey research is that respondents do not always pay close attention or put much effort into their responses, introducing statistical noise and possibly bias (Berinsky et al. Reference Berinsky, Margolis, Sances and Warshaw2021). Response quality issues are acute in self-administered surveys where there is no interviewer to induce attention and effort (e.g., Cannell, Miller, and Oksenberg Reference Cannell, Miller and Oksenberg1981; Chang and Krosnick Reference Chang and Krosnick2009; Lerner and Tetlock Reference Lerner and Tetlock1999). Because online surveys typically provide monetary incentives, some participants engage in extreme satisficing or speeding to maximize hourly earnings (Hillygus and LaChapelle Reference Hillygus, LaChapelle and Rudolph2022) and may use generative AI or other automated tools to do so (Veselovsky, Ribeiro, and West Reference Veselovsky, Ribeiro and West2023; Veselovsky et al. Reference Veselovsky, Ribeiro, Cozzolino, Gordon, Rothschild and West2025; Westwood Reference Westwood2025). In repeated measure designs, less attentive and effortful respondents may still be subject to issues like priming, consistency, and demand effects, but their disengagement might reduce the likelihood or strength of these biases.
To address response quality, some vendors engage in extensive panel management, such as requiring panelists to pass quality filters (e.g., consistency checks, attention checks), while other vendors leave quality control to researchers. Consequently, nonprobability samples can vary considerably in respondent attention and effort; some recent evidence suggests that Lucid performs relatively poorly and Prolific performs relatively well on these metrics (Stagnaro et al. Reference Stagnaro, Druckman, Berinsky, Arechar, Willer and Rand2024). On our Prolific and Lucid surveys, we included six preregistered quality checks (see Section B.1 of the Supplementary Material) and drop respondents that failed at least two from our main analyses.Footnote 9 Prolific respondents failed 0.115 checks on average; this falls to 0.081 in the analysis sample after we exclude 38 respondents who failed at least two (as preregistered). Lucid respondents failed an average of 0.684 checks, which falls to 0.279 after we exclude 681 who failed at least two. Lucid respondents are thus less attentive and effortful than Prolific respondents on average, variation that we exploit to test whether these characteristics affect the performance of repeated measure designs.
In summary, our study expands and advances the evidentiary basis for repeated measure designs. We replicate four studies from CSP and two additional within-subject experiments from the political science literature in each of three large samples to test whether repeated measure designs introduce design effects (i.e., attenuation or exaggeration of the ATE), totaling 18 studies with a combined $ {N}_{ij}=\mathrm{78,978} $
. This represents a nearly tenfold increase over CSP’s pooled samples. Our large samples not only provide power to detect small design effects but also enable us to test for potential heterogeneity in design effects across several critical design considerations: experiment type (between-groups or within-subject), proximity of repeated measures, and vendor sampling designs and consequent respondent characteristics. Our study thus provides both well-powered tests and novel insights into how various design considerations affect the utility of repeated measure experiments.
$ {N}_{ij}=\mathrm{78,978} $
. This represents a nearly tenfold increase over CSP’s pooled samples. Our large samples not only provide power to detect small design effects but also enable us to test for potential heterogeneity in design effects across several critical design considerations: experiment type (between-groups or within-subject), proximity of repeated measures, and vendor sampling designs and consequent respondent characteristics. Our study thus provides both well-powered tests and novel insights into how various design considerations affect the utility of repeated measure experiments.
RESULTS
We first summarize the results of each experiment under each design and report the estimated design effect. Next, we report our overall findings on the design effect of repeated measures through a series of internal meta-analyses of the 18 experiments. We then test for potential heterogeneity in design effects along several key dimensions.
Summary of Experimental Results
For each experiment, we report the observed ATE for both post-only and repeated measure designs. To facilitate comparison across experiments, we rescale all outcome variables to range from 0 (most opposed) to 1 (most supportive). For the between-groups experiments (Studies 1–3), we compare the difference in ATEs by estimating separate ordinary least squares (OLS) regressions for each design. These regressions model the posttreatment outcome as a function of a binary treatment indicator,Footnote 10 with the pretreatment outcome included as a covariate in the repeated measures design.Footnote 11 We then combine these regressions via seemingly unrelated regression estimation, which allows us to conduct a linear combination test for equivalence of ATEs across the two designs.
For the within-subject experiments (Studies 4–6), we compare the difference in ATEs using random effects models. These models regress the dependent variable on an indicator for treatment interacted with an indicator for repeated measure assignment. This approach explicitly acknowledges the nested nature of the data by clustering standard errors at the respondent level (as some respondents contribute two observations), capturing individual-level variation in the outcome (the “random” effects) that is unrelated to the explanatory variables. The coefficient on the interaction term estimates the difference in ATEs between the designs.
As preregistered, we follow prior authors’ inclusion of specific pretreatment covariates (e.g., partisanship, ideology) in the model for each experiment, as noted below. We report the results of each experiment separately for each of the three samples (AmeriSpeak, Prolific, and Lucid). A summary of the results is provided in Table 3, which we briefly detail below.Footnote 12
Summary of Experimental Results
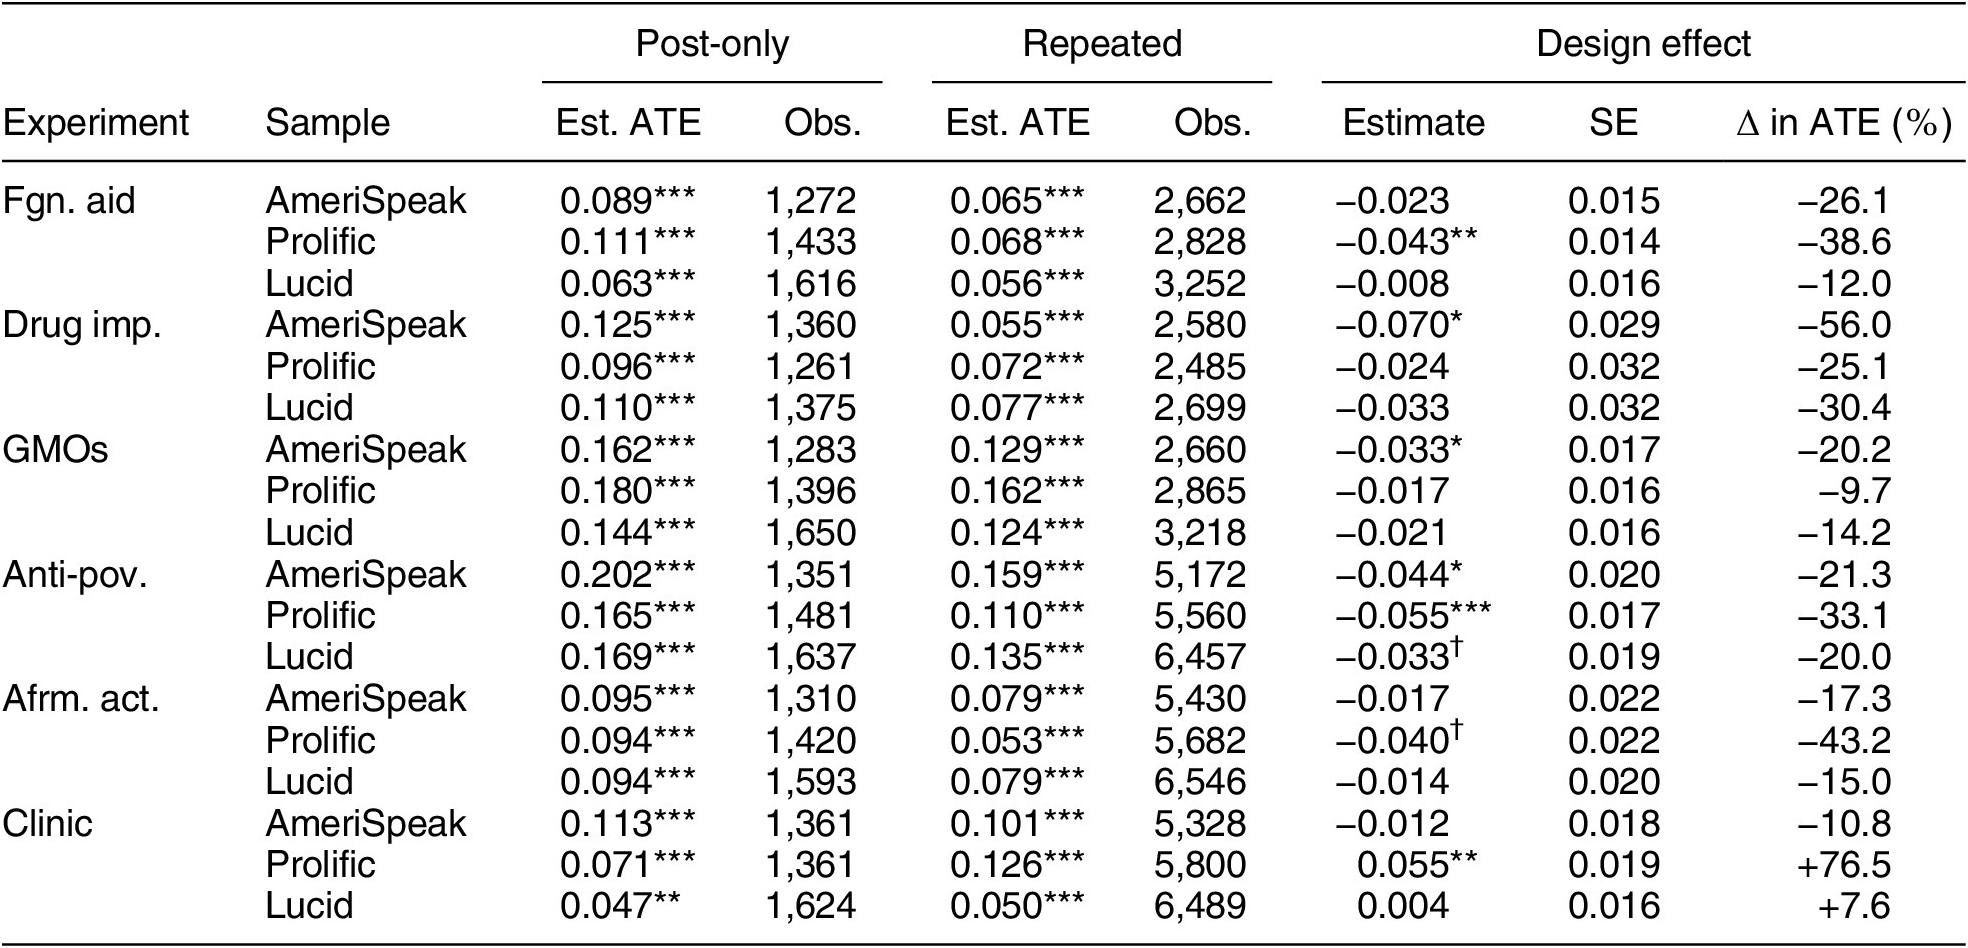
Note: Table displays the estimated ATE under each design in each experiment in each sample, followed by the repeated measure design’s estimated design effect and percentage change from the ATE of the post-only design. †p < 0.10; *p < 0.05; **p < 0.01; ***p < 0.001.
Study 1: Foreign Aid
In this between-groups experiment, we regress support for foreign aid spending on a treatment indicator for receiving information that foreign aid spending is about 1% of the federal budget. Following CSP, we include partisanship and ideology as covariates. All three samples replicate CSP’s finding (and that of Gilens Reference Gilens2001) that the informational treatment increases support for foreign aid in both the post-only and repeated measure designs. As with CSP’s study, we find that the repeated measure design attenuates this treatment effect in the Prolific sample ( $ p=0.002 $
). The design effects are negative but not significant in the AmeriSpeak (
$ p=0.002 $
). The design effects are negative but not significant in the AmeriSpeak ( $ p=0.127 $
) and Lucid (
$ p=0.127 $
) and Lucid ( $ p=0.630 $
) samples.
$ p=0.630 $
) samples.
Study 2: Prescription Drug Imports
In this between-groups experiment, we regress support for prescription drug imports on a treatment indicator for receiving a signal about typical party positions, interacted with an indicator for Democratic versus Republican partisanship (excluding nonleaning independents). The interaction coefficient provides a measure of polarization in attitudes between parties. All three samples replicate CSP’s finding that party cues increase attitudinal polarization in both the post-only and repeated measure designs. We find an attenuation of this treatment effect in the repeated measure design in the AmeriSpeak sample ( $ p=0.017 $
); the estimated design effects are negative but not significant in the Prolific (
$ p=0.017 $
); the estimated design effects are negative but not significant in the Prolific ( $ p=0.450 $
) and Lucid (
$ p=0.450 $
) and Lucid ( $ p=0.301 $
) samples.
$ p=0.301 $
) samples.
Study 3: GMOs
In this between-groups experiment, we regress support for GMOs on an indicator for receiving a pro-GMO frame (versus an anti-GMO frame). Following CSP, we include partisanship and ideology as covariates. All three samples replicate CSP’s finding that the positive frame increases support for GMOs in both the post-only and repeated measure designs. We find an attenuation of this treatment effect in the repeated measure design in the AmeriSpeak sample ( $ p=0.049 $
). The design effects are negative but not significant in the Prolific (
$ p=0.049 $
). The design effects are negative but not significant in the Prolific ( $ p=0.273 $
) and Lucid (
$ p=0.273 $
) and Lucid ( $ p=0.210 $
) samples.
$ p=0.210 $
) samples.
Study 4: Antipoverty
In this within-subject experiment, we regress support for antipoverty spending on an indicator for whether these efforts are described as “assistance to the poor” (1) versus “welfare” (0), interacted with an indicator for the two-question repeated measures condition (1) versus the single-question post-only condition (0). Following CSP, we include partisanship and ideology as covariates. All three samples replicate CSP’s finding (and that of Smith Reference Smith1987) that support for antipoverty spending is greater when characterized as “assistance to the poor,” in both the post-only and repeated measure designs. We find attenuated treatment effects in the repeated measure designs in the AmeriSpeak ( $ p=0.025 $
), the Prolific sample (
$ p=0.025 $
), the Prolific sample ( $ p=0.001 $
), and (at the
$ p=0.001 $
), and (at the $ 0.10 $
level) the Lucid sample (
$ 0.10 $
level) the Lucid sample ( $ p=0.071 $
).
$ p=0.071 $
).
Study 5: Affirmative Action
In this within-subject experiment, we regress support for affirmative action on an indicator for whether the policies apply to women (1) or racial minorities (0), interacted with an indicator for assignment to the repeated measures (1) versus post-only condition (0). All three samples replicate the finding of Wilson et al. (Reference Wilson, Moore, McKay and Avery2008) that support is greater for affirmative action for women relative to racial minorities, in both the post-only and repeated measure designs. We find an attenuated treatment effect at the $ 0.10 $
level (consistent with the original study’s claim that asking both items induces consistency; see Wilson et al. Reference Wilson, Moore, McKay and Avery2008) in the Prolific sample (
$ 0.10 $
level (consistent with the original study’s claim that asking both items induces consistency; see Wilson et al. Reference Wilson, Moore, McKay and Avery2008) in the Prolific sample ( $ p=0.071 $
). The estimated design effects are negative but not significant in the AmeriSpeak (
$ p=0.071 $
). The estimated design effects are negative but not significant in the AmeriSpeak ( $ p=0.453 $
) and Lucid (
$ p=0.453 $
) and Lucid ( $ p=0.483 $
) samples.
$ p=0.483 $
) samples.
Study 6: Opioid Clinic
In this within-subject experiment, we regress support for opening a new methadone clinic on an indicator for whether the proposed clinic is located a quarter mile away (1) versus two miles away (0), interacted with an indicator for assignment to the repeated measures (1) versus post-only condition (0). All three samples replicate the finding of de Benedictis-Kessner and Hankinson (Reference de Benedictis-Kessner and Hankinson2019) that support is greater when the proposed clinic is located further away, in both the post-only and repeated measure designs. In contrast to the other five studies, we find a significant positive design effect (exaggerating the treatment effect) from the repeated measure design in the Prolific sample ( $ p=0.004 $
), but no significant design effects in the AmeriSpeak (negative estimate,
$ p=0.004 $
), but no significant design effects in the AmeriSpeak (negative estimate, $ p=0.481 $
) and Lucid (positive estimate,
$ p=0.481 $
) and Lucid (positive estimate, $ p=0.821 $
) samples.
$ p=0.821 $
) samples.
Repeated Measure Designs Cause (Slight) Attenuation of Treatment Effect Estimates
Across six experiments replicated thrice each in large samples, nearly every estimated design effect is negative. These design effects are often substantial, as shown in the final column of Table 3. We observe a median 20.1% reduction in the ATE from repeated measure designs relative to post-only designs across the 18 experiments. This consistent pattern suggests repeated measure designs attenuate treatment effects, but that the design effects are too small to reliably detect in individual experiments. We therefore conduct preregistered internal meta-analyses, rescaling the design effect and standard error in each experiment as a proportional change from the post-only design’s ATE (i.e., a 20.1% attenuation is a design effect of $ -0.201 $
).Footnote
13 We then meta-analyze all six experiments, the three between-groups experiments, and the three within-subject experiments, each set both within and across samples. The results are shown in Figure 2 and provided in tabular form in Section A.1 of the Supplementary Material.
$ -0.201 $
).Footnote
13 We then meta-analyze all six experiments, the three between-groups experiments, and the three within-subject experiments, each set both within and across samples. The results are shown in Figure 2 and provided in tabular form in Section A.1 of the Supplementary Material.
Internal Meta-Analyses
Note: The figure displays estimated design effects from internal meta-analyses of experiments within each sample and across all three samples. Error bars indicate 95% confidence intervals.
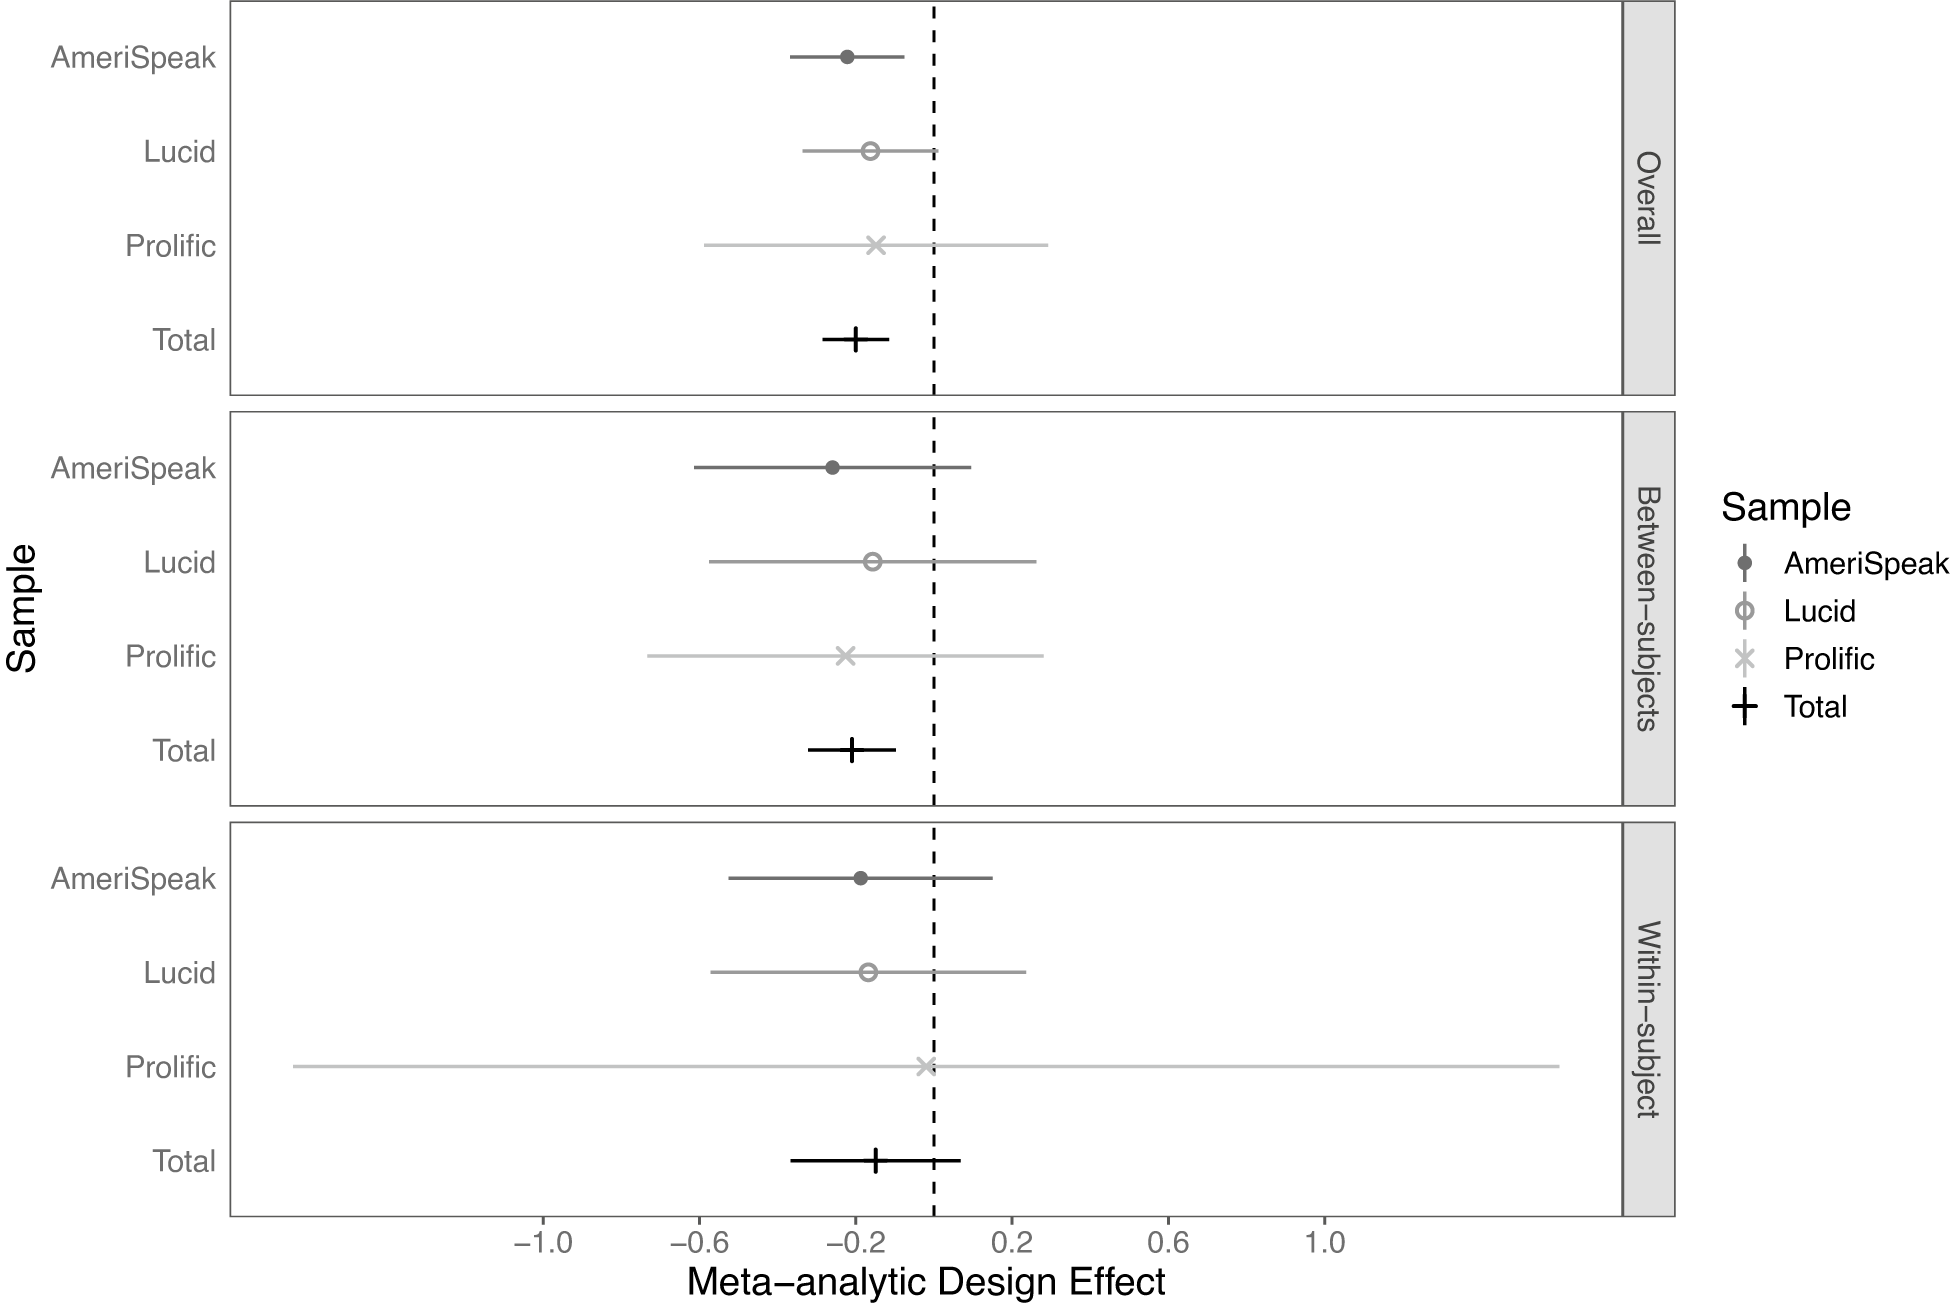
When analyzing all six experiments together, as shown in the top panel of Figure 2, we find a meta-analytic design effect of $ -0.222 $
in the AmeriSpeak sample (
$ -0.222 $
in the AmeriSpeak sample ( $ p=0.011 $
),
$ p=0.011 $
), $ -0.162 $
in the Lucid sample (
$ -0.162 $
in the Lucid sample ( $ p=0.061 $
), and
$ p=0.061 $
), and $ -0.148 $
in the Prolific sample (
$ -0.148 $
in the Prolific sample ( $ p=0.426 $
). Meta-analyzing all 18 experiments, we find a precisely estimated meta-analytic design effect of
$ p=0.426 $
). Meta-analyzing all 18 experiments, we find a precisely estimated meta-analytic design effect of $ -0.200 $
(
$ -0.200 $
( $ p<0.001 $
, 95% CI = [
$ p<0.001 $
, 95% CI = [ $ -0.285 $
,
$ -0.285 $
, $ -0.115 $
]). That is, the estimated attenuation of the ATE when using repeated measure designs is 20.0% on average.
$ -0.115 $
]). That is, the estimated attenuation of the ATE when using repeated measure designs is 20.0% on average.
This typical attenuation effect is most consistent for between-groups experiments in our data. While we do not find a statistically significant design effect for either type of experiment in any one sample,Footnote
14 the between-groups estimate across samples is statistically significant (estimate $ -0.210 $
,
$ -0.210 $
, $ p=0.003 $
). The within-subject estimate across samples is smaller and not statistically significant (estimate
$ p=0.003 $
). The within-subject estimate across samples is smaller and not statistically significant (estimate $ -0.149 $
,
$ -0.149 $
, $ p=0.153 $
). This is due to a clear outlier in the Prolific sample, in which we observe a large positive design effect in the opioid clinic experiment. A meta-analysis of the within-subject experiments across samples excluding this outlier is quite similar to the between-groups experiments (design effect estimate
$ p=0.153 $
). This is due to a clear outlier in the Prolific sample, in which we observe a large positive design effect in the opioid clinic experiment. A meta-analysis of the within-subject experiments across samples excluding this outlier is quite similar to the between-groups experiments (design effect estimate $ -0.227 $
,
$ -0.227 $
, $ p=0.003 $
).
$ p=0.003 $
).
Repeated Measure Designs Increase Statistical Power
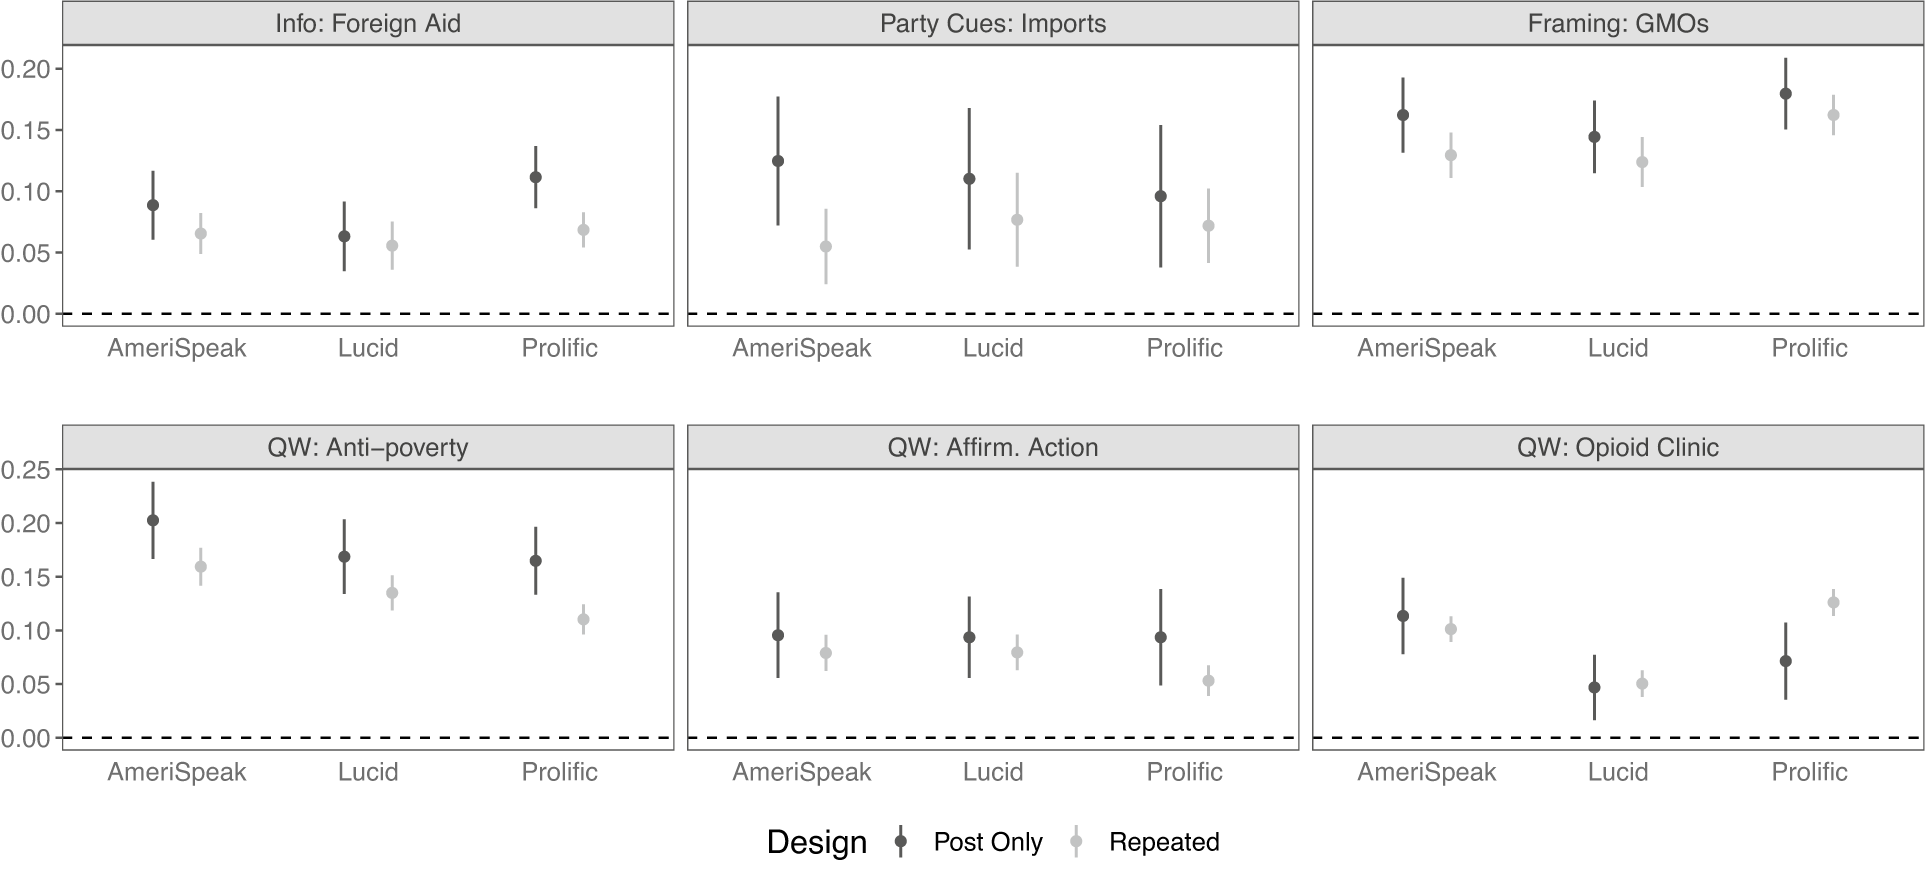
Although we find evidence of treatment effect attenuation in repeated measure designs, these designs may still be preferable due to large precision gains. Since our experimental design assigns respondents to complete twice as many repeated measure experiments as post-only experiments, directly comparing standard errors would artificially privilege the precision of the repeated measure design due simply to differential assignment. To address this, we re-estimate each ATE via a bootstrapping procedure that uses samples of identical size for both designs. Specifically, for each experiment in each sample, we estimate the respective models for the post-only and repeated measure designs 1,000 times, each time substituting a randomly drawn sample (with replacement) equal to the maximum number of unique observations in the post-only setting for that experiment in that sample. From these 1,000 estimated models, we then calculate pooled standard errors using Rubin’s rule. In effect, this procedure estimates the relative precision across experimental designs for samples of equal size. Figure 3 shows the bootstrapped ATE and 95% confidence intervals for each experiment under each design; Table 4 additionally presents the percentage change in standard error and root mean squared error (RMSE) that the repeated measure design provides.
Bootstrapped ATE Estimates
Note: The figure displays estimated ATE for each experiment under a post-only design (black) or repeated measures design (gray), estimated with bootstrapped standard errors for comparison at equivalent per experiment sample size. The error bars indicate 95% confidence intervals.
Bootstrapped Experimental Results
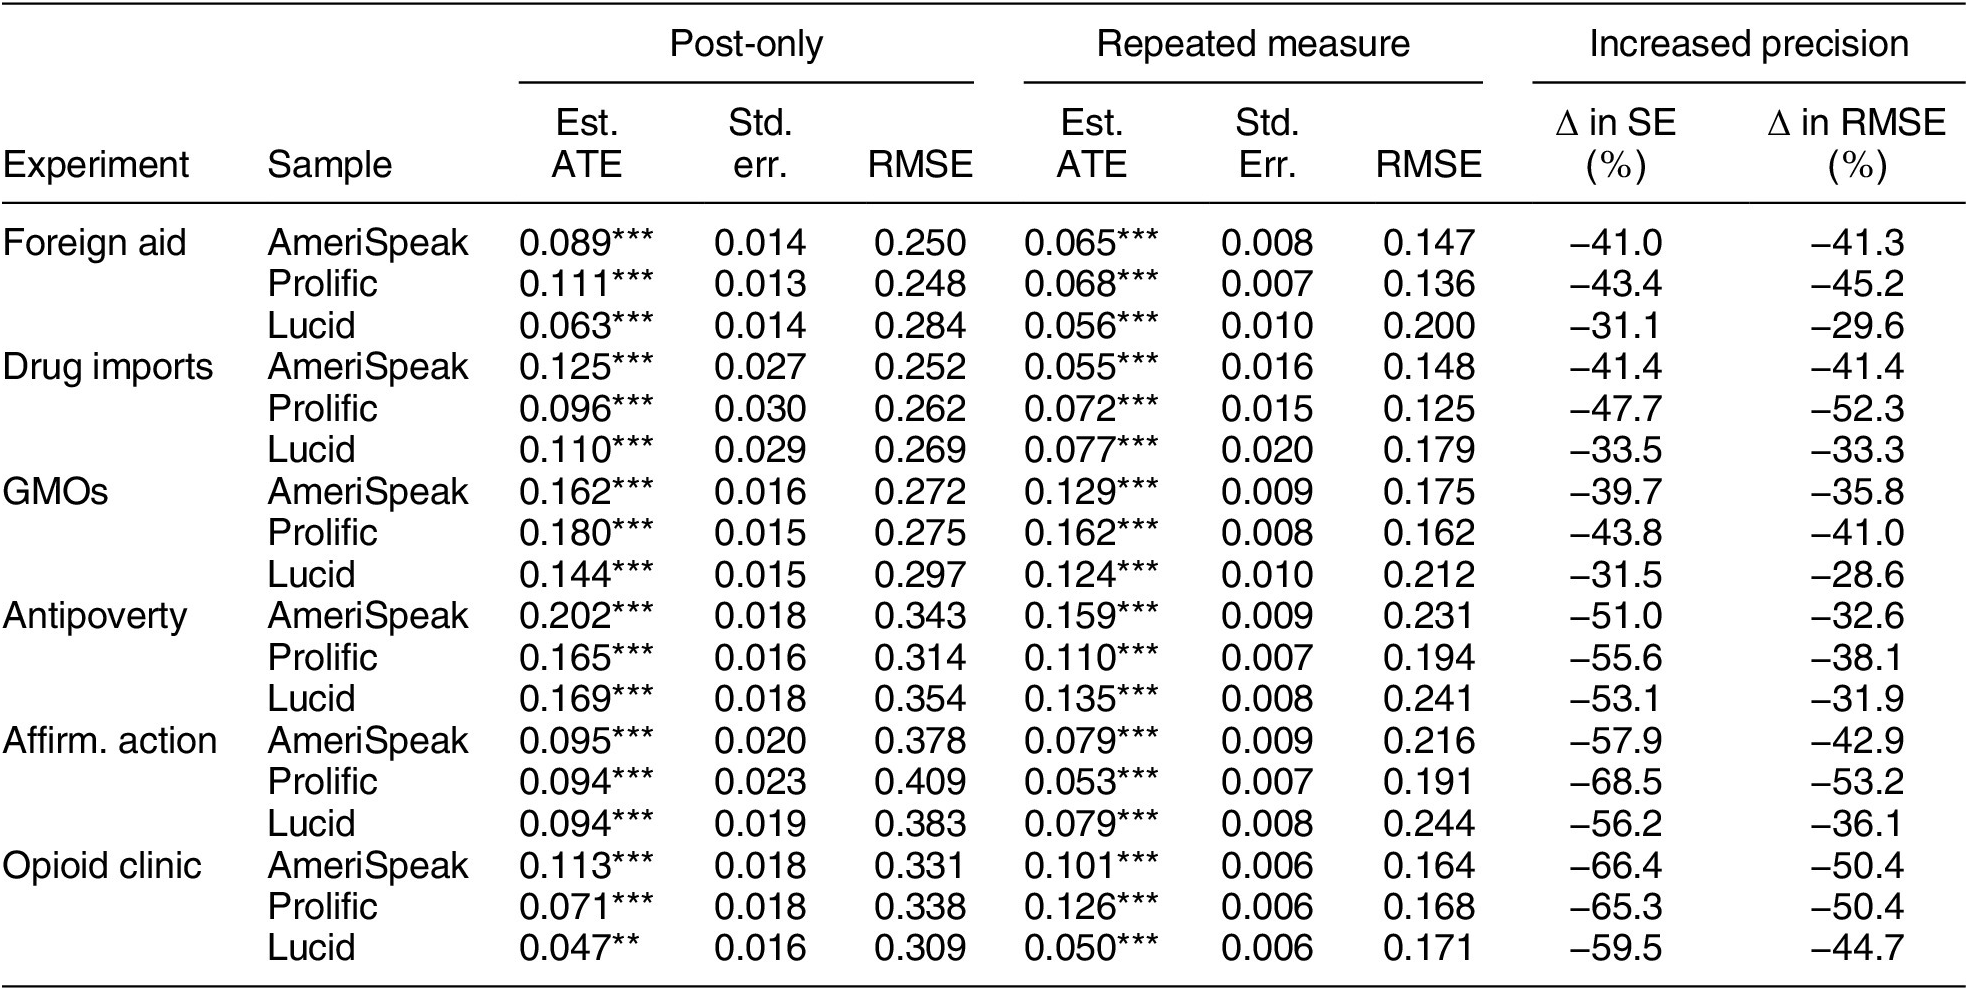
Note: Table displays the estimated ATE and bootstrapped standard error under each design in each experiment in each sample, each estimated 1,000 times with a number of sampled respondents equal to the number of observations in the respective post-only design (see column 4 in Table 3). †p < 0.10, *p< 0.05, **p < 0.01, ***p < 0.001.
As Figure 3 shows, we find that repeated measure designs provide large gains to precision, reflected in the much smaller gray (repeated measure) confidence intervals. In Table 4, we observe a median 49.4% reduction in standard error across all 18 experiments, with a minimum reduction of 31.1%. Similarly, we observe a median 41.0% reduction in the RMSE, with a minimum reduction of 28.6%. The consistently large reductions in standard errors confirm that repeated measure designs offer significant improvement in statistical precision. As we document in the “Discussion” section, these precision gains often outweigh the disadvantage of slight attenuation to provide improved accuracy in expectation.
Minimal Moderation by Distance between Repeated Measures
Researchers regularly place pre- and post-treatment measures at opposite ends of a survey—or even on separate waves in panel surveys—to minimize the probability that respondents will recall being previously asked the same question and alter their posttreatment response. Given our finding that repeated measure designs slightly attenuate treatment effects, a reasonable concern is that a short survey or module might induce greater attenuation due to the proximity of the repeated measures. Our experimental design randomly varies the distance between pre- and post-treatment measures, allowing us to test how distance impacts design effects. We estimate a series of ATEs at each discrete distance between pre- and post-treatment measures (in counts of survey items, ranging from 0 to 19)Footnote 15 for each experiment in each sample and standardize these ATEs relative to the post-only ATE observed for each study (see the third column of Table 3). We then regress the standardized ATEs on the distance variable. Figure 4 shows the standardized ATEs and associated 95% confidence intervals for each experiment at each degree of separation. The thick solid line indicates the predicted values from this linear regression, and the shaded areas show the corresponding 95% confidence interval.Footnote 16
Estimated Design Effect by Distance between Repeated Measures
Note: The figure displays the estimated ATE at each distance between pre- and post-treatment measures (in counts of survey items, x-jittered for visual clarity) in each experiment in each sample, standardized to the respective observed post-only ATE. The thick solid line indicates the fitted values from a linear regression on these ATE point estimates on distance; the shaded areas indicate 95% confidence intervals.

We find that the effect of distance between repeated measures is detectable but substantively small, as the regression line in Figure 4 suggests. Each additional item separating the pre- and post-treatment measures is estimated to attenuate the repeated measure ATE by $ -0.002 $
(
$ -0.002 $
( $ p=0.010 $
) on average or by about 1.4% of the mean ATE in our data. Including fixed effects for the sample and experiment gives a similar but more precise result: the estimated attenuation in the expected ATE is
$ p=0.010 $
) on average or by about 1.4% of the mean ATE in our data. Including fixed effects for the sample and experiment gives a similar but more precise result: the estimated attenuation in the expected ATE is $ -0.001 $
(
$ -0.001 $
( $ p=0.009 $
) on average or about 1.2% of the mean ATE in our data.Footnote
17 The slight influence of distance on the overall design effect suggests that repeated measure designs are about as well suited to close placement as to separating the measures by several minutes.
$ p=0.009 $
) on average or about 1.2% of the mean ATE in our data.Footnote
17 The slight influence of distance on the overall design effect suggests that repeated measure designs are about as well suited to close placement as to separating the measures by several minutes.
Some Moderation by Repeated Exposures to Repeated Measure Designs
An important feature of our design that distinguishes our approach from that of CSP is the inclusion of four repeated measure experiments in a single survey administered to each respondent. We also include several questions that ask respondents to recall their previous attitude on a pretreatment measure and assess how much their opinion had changed—an unusual question that may in itself exacerbate consistency or demand pressures on subsequent repeated measure experiments. These features of our implementation may alter the design effect as respondents progress through the survey, in a way that unrelated distractor content would not.
We conduct an exploratory analysis to test whether design effects differ between respondents’ first to fourth exposures to repeated measure designs. We estimate a meta-analytic design effect for (only) the first repeated measure experiment each participant encounters in their individual survey experience (pooling across experiments and samples, $ k=18 $
). We then estimate separate meta-analytic design effects for the second, third, and fourth repeated measure experiment encountered. These results are shown in Table 5. We find that treatment effect attenuation increases as the respondent encounters more repeated measure experiments in the survey, from a meta-analytic mean of
$ k=18 $
). We then estimate separate meta-analytic design effects for the second, third, and fourth repeated measure experiment encountered. These results are shown in Table 5. We find that treatment effect attenuation increases as the respondent encounters more repeated measure experiments in the survey, from a meta-analytic mean of $ -0.131 $
(
$ -0.131 $
( $ p=0.018 $
) in the first exposure to
$ p=0.018 $
) in the first exposure to $ -0.266 $
(
$ -0.266 $
( $ p<0.001 $
) in the fourth exposure. The difference between these two design effect estimates is statistically significant, as shown in a fixed-effect model specification reported in Supplementary Table A.1.2 (
$ p<0.001 $
) in the fourth exposure. The difference between these two design effect estimates is statistically significant, as shown in a fixed-effect model specification reported in Supplementary Table A.1.2 ( $ p=0.049 $
), suggesting that fielding multiple repeated measure experiments in a single survey may exacerbate the design effect for experiments later in the survey. However, focusing strictly on design effects in the first repeated measures experiment respondents encountered—equivalent to CSP’s approach of separate surveys—we still find significant attenuation.
$ p=0.049 $
), suggesting that fielding multiple repeated measure experiments in a single survey may exacerbate the design effect for experiments later in the survey. However, focusing strictly on design effects in the first repeated measures experiment respondents encountered—equivalent to CSP’s approach of separate surveys—we still find significant attenuation.
Repeated Measure Results by Order of Repeated Measure Design Encountered

Note: Table displays the results of internal meta-analyses ( $ k=18 $
for each) of the repeated measure design effect, subset by the order of repeated measure experiments in the survey for each individual respondent. †p < 0.10; *p < 0.05; **p < 0.01; ***p< 0.001.
$ k=18 $
for each) of the repeated measure design effect, subset by the order of repeated measure experiments in the survey for each individual respondent. †p < 0.10; *p < 0.05; **p < 0.01; ***p< 0.001.
Notably, much of this increase appears to be a consequence of the attitude-recall questions in our surveys. In Supplementary Table A.1.3, we estimate separate meta-analytic design effects for repeated measure experiments later in the survey flow (i.e., the second, third, or fourth repeated measure experiment) but prior to any attitude-recall questions, versus those that appeared following an attitude-recall question. Later repeated measure experiments that appeared before any attitude-recall questions exhibit a similar design effect size (estimate $ -0.145 $
,
$ -0.145 $
, $ p=0.017 $
) to the earliest repeated measure experiment for each respondent (estimate
$ p=0.017 $
) to the earliest repeated measure experiment for each respondent (estimate $ -0.131 $
,
$ -0.131 $
, $ p=0.018 $
). In contrast, repeated measure experiments with posttreatment measurement after at least one attitude-recall question (i.e., on an earlier experiment) show a larger design effect (estimate
$ p=0.018 $
). In contrast, repeated measure experiments with posttreatment measurement after at least one attitude-recall question (i.e., on an earlier experiment) show a larger design effect (estimate $ -0.249 $
,
$ -0.249 $
, $ p<0.001 $
). We thus identify a small but meaningful design effect of singular repeated measure experiments, but fielding multiple repeated measure experiments in a single survey or (especially) using attitude-recall questions may exacerbate the design effect on later repeated measure experiments.
$ p<0.001 $
). We thus identify a small but meaningful design effect of singular repeated measure experiments, but fielding multiple repeated measure experiments in a single survey or (especially) using attitude-recall questions may exacerbate the design effect on later repeated measure experiments.
No Moderation by Respondent Professionalization
While we find no significant differences in design effects across samples (Figure 2), we further assess whether within-sample variation in respondent professionalization moderates the performance of repeated-measure designs. To do so, we leverage preregistered measures of respondents’ recent survey-taking activity, including the number of surveys completed and the number of active panel memberships in the past 30 days. As expected, levels of professionalization differ substantially across samples, with the probability-based AmeriSpeak respondents reporting fewer panel memberships and far lower rates of survey-taking than the respondents recruited with nonprobability sampling from Prolific or Lucid (see Table 2).Footnote 18
Within each sample, we split respondents at the median on each dimension of professionalization, re-analyze each experiment using the subsample for each group, and then meta-analyze the estimated design effects. As shown in Supplementary Figure A.2.1, the design effects are similar above and below the medians of each professionalization measure. That is, our data suggest that professionalization does not substantially exacerbate or mitigate the design effect of repeated measures. This result, using individual-level professionalization measures, helps explain why the design effects are similar across our three samples despite large differences in respondent professionalization and comports with recent scholarship suggesting that nonprobability samples are suitable for experimental research (Coppock, Leeper, and Mullinix Reference Coppock, Leeper and Mullinix2018; Jerit and Barabas Reference Jerit and Barabas2023).
Respondent Attention and Perceived Attitude Change
Another way to assess the impact of respondent attention in repeated measure designs is to analyze how well respondents can recall their previous (pretreatment) attitude after exposure to treatment. In their pre-post study on GMOs, CSP asked whether respondents’ support for GMOs had changed since earlier in the survey—that is, since the pretreatment measurement. CSP found that 40.5% of respondents provided different answers on the two measures and that, of these, 58.8% (mis)-reported that their attitudes had remained stable. CSP concluded that respondents may struggle to provide consistent responses in repeated measures experiments, even when they feel pressure to do so, simply because many cannot recall their earlier responses. This, CSP argue, reduces the risk of design effects in repeated measure experiments.Footnote 19
For our three between-groups experiments, we followed the posttreatment measure with a recall question for respondents assigned to the repeated measure condition (total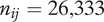 $ {n}_{ij}=\mathrm{26,333} $
across all samples, offering an analysis sample 27 times larger than CSP’s previous single study).Footnote
20 Specifically, we asked whether the respondent’s preferences about the relevant issue had changed since being asked about it earlier in the survey; respondents could indicate whether their support had decreased, increased, or stayed about the same.Footnote
21 We distinguish respondents into three groups based on observed pre-post change (less supportive, no change, or more supportive) and likewise group them by self-reported perceived change (less supportive, about the same, or more supportive).
$ {n}_{ij}=\mathrm{26,333} $
across all samples, offering an analysis sample 27 times larger than CSP’s previous single study).Footnote
20 Specifically, we asked whether the respondent’s preferences about the relevant issue had changed since being asked about it earlier in the survey; respondents could indicate whether their support had decreased, increased, or stayed about the same.Footnote
21 We distinguish respondents into three groups based on observed pre-post change (less supportive, no change, or more supportive) and likewise group them by self-reported perceived change (less supportive, about the same, or more supportive).
We report the rates of perceived versus observed change in Section A.3 of the Supplementary Material. Like CSP, we find that few respondents who provided different responses between pre- and post-treatment measures were able to correctly identify that change (39.1% of observations). However, in an exploratory analysis described in Section A.3 of the Supplementary Material, we find no evidence that respondents’ ability to accurately perceive (or accurately self-report) their direction of change has any impact on the magnitude of the design effect. This analysis suggests that prior attitude recall may not be the most critical factor in producing the slight average attenuation bias we find in repeated measure designs.
DISCUSSION
Our study provides critical new evidence on the merits of repeated measure designs for experimental research. Like CSP’s landmark experiments, we find that repeated measure designs consistently offer enormous improvements in statistical precision over traditional post-only designs, observing a 49.4% median reduction in the ATE’s standard errors across 18 studies. Unlike CSP, however, we find a small but consistent design effect in the repeated measure setting, observing a median 20.1% attenuation of the ATE relative to the post-only design. Figure 5 summarizes the balance of our evidence on this fundamental trade-off. Based on these findings, we provide practical recommendations for researchers as they consider whether and how to implement repeated measure designs.
Histogram of Design Effects
Note: The figure displays a histogram of observed design effects in terms of percentage change in estimated ATE (left panel) and standard error (right panel) in bootstrapped models with equal sample size across designs. The thick solid vertical line in each panel indicates the median percentage change in each statistic across all 18 experiments.

Repeated Measure Designs versus Post-only Designs
Our experiments provide evidence that repeated measure designs consistently attenuate treatment effects, which may lead some readers to conclude that post-only designs should be preferred to repeated measure designs. However, many survey experiments primarily aim to identify whether a given treatment shifts the outcome in a hypothesized direction (versus a null effect). For this purpose, statistical power is an essential consideration—and repeated measure designs clearly dominate in this regard, as Figure 5 shows. Power is determined by the ratio of the treatment effect to its standard error (Rainey Reference Rainey2025); although repeated measure designs slightly attenuate the treatment effect (the numerator), the resulting slight loss of power is often outweighed by power gained from shrinking the standard error (the denominator). In many applied settings, this power trade-off favors repeated measure designs, which are better suited to reliably detect real (albeit attenuated) treatment effects.
Should researchers who seek to estimate a treatment effect’s precise magnitude (not simply its presence or direction) prefer post-only designs, given our findings of attenuated ATEs? Even here, we contend that repeated measure designs are often superior. Although post-only designs are unbiased in expectation, their imprecision in finite samples will cause estimates to vary widely around the true ATE. Our results suggest that repeated measure designs are so much more precise that even their slightly attenuated ATE estimates will fall closer to the true ATE in many circumstances.
To illustrate these tradeoffs, we simulate 1,000 two-arm (treatment and control) experiments per design at each of several sample sizes, true ATEs (expressed as Cohen’s d), and true attenuations in the estimated ATE from the repeated measure design effect.Footnote 22 From these simulated experiments, we estimate the statistical power of the test (defined as one minus the observed proportion of false negatives, shown in Figure 6) and the mean absolute error in the estimated ATE (versus the true ATE) under each design (Figure 7). Each figure shows how the respective statistic changes as the sample size increases (within-panel), the true effect size increases (across columns), and the design effect attenuation of the estimated ATE increases (across rows). The means for each statistic is shown by the solid gray line for post-only experiments and by the dashed black line for repeated measure experiments.
Statistical Power in Simulated Experiments
Note: The figure displays mean statistical power in simulated experiments at varying sample sizes, true effect sizes (Cohen’s d), and true design effect (attenuation) of a repeated measure experiment.

Absolute Error in Simulated Experiments
Note: The figure displays mean absolute error between the estimated and true ATE in simulated experiments at varying sample sizes, true effect sizes (Cohen’s d), and true design effect (attenuation) of a repeated measure experiment.

Figure 6 shows that repeated measure designs always offer superior power for hypothesis testing, with the largest gains when the true ATE or the sample size is smaller; the magnitude of the design effect has a comparatively small impact on power. For smaller samples and smaller true effect sizes, Figure 7 also shows that the repeated measure design provides a more accurate estimate of the true ATE than a post-only design, despite attenuation of the ATE from the design effect. Only when the sample size, true effect size, and true attenuation are large does the post-only design outperform repeated measures in terms of fidelity (in expectation) to the true ATE.Footnote 23
Post-only designs may therefore still be preferable for researchers with access to a large sample and reason to expect (a priori) strong treatment effects or strong design effects. Although a repeated measure design will usually offer an improvement in statistical power, this benefit declines as sample and true effect size increase (see Figure 6). In these circumstances, the expected attenuation of the ATE can be large enough relative to the precision gains to make a repeated measure design less accurate in expectation than a post-only design (see Figure 7).
A related concern pertains to experiments on socially sensitive topics.Footnote 24 Here, pretreatment outcome measurement may substantially heighten social desirability biases that could induce respondents to falsify posttreatment responses (either toward consistency or toward responsiveness to the treatment, depending on the experiment), potentially putting the estimated ATE in greater jeopardy.Footnote 25 Repeatedly probing respondents about a very sensitive topic may also cause them emotional distress and increase attrition, raising ethical and practical concerns with repeated measure designs. While some of our experiments could be considered sensitive (e.g., on affirmative action and opioid clinics), none are on topics as sensitive as (say) illegal drug use or participation in violence, which are often examined in list experiments (e.g., Aronow et al. Reference Aronow, Coppock, Crawford and Green2015; García-Sánchez and Queirolo Reference García-Sánchez and Queirolo2021; Redlawsk, Tolbert, and Franko Reference Redlawsk, Tolbert and Franko2010; Walsh and Braithwaite Reference Walsh and Braithwaite2008). Thus, we lack robust evidence on the risks of repeated measures for experiments on very sensitive topics, and researchers should proceed cautiously when considering them in such contexts.
As social science moves toward larger samples to address concerns about under-powered research (Arel-Bundock et al. Reference Arel-Bundock, Briggs, Doucouliagos, Aviña and Stanley2026), a post-only design is also a reasonable choice for high-powered experiments when the aim is to minimize absolute error, rather than to minimize the detectable effect. Researchers might particularly prefer large-N post-only designs to accurately estimate the magnitude of treatment effects as quantities of interest for downstream analyses. A meaningfully attenuated estimate of an online learning intervention could, for example, risk introducing substantial bias in downstream cost–benefit analyses for evaluating widespread policy implementation.
That said, post-only designs present considerable opportunity costs. Given arbitrarily large but nevertheless finite resources, experimenters could use repeated measure designs to increase the number of treatment arms or field multiple distinct experiments with smaller samples for roughly the same costs (and statistical power) as a single, larger post-only experiment.Footnote 26 This approach enables researchers to extend the range of interventions tested and improve cost effectiveness, expanding the scope of empirical inquiry.
In sum, though we note some general circumstances in which experimenters should still consider a post-only design, we largely concur with CSP that repeated measure designs are a better default than post-only designs. Applied social science often prioritizes identifying directional effects over estimating precise magnitudes, and like other disciplines, political science continues to struggle with under-powered research (Arel-Bundock et al. Reference Arel-Bundock, Briggs, Doucouliagos, Aviña and Stanley2026). We encourage the use of power calculations at the design stage to compare post-only and repeated measure designs under different assumptions about treatment and design effect sizes (for helpful guidance on these comparisons, see Rainey Reference Rainey2025). Nonetheless, because treatment effects in the behavioral sciences tend to be small (Amsalem and Zoizner Reference Amsalem and Zoizner2020; Funder and Ozer Reference Funder and Ozer2019; Gignac and Szodorai Reference Gignac and Szodorai2016; Hummel and Maedche Reference Hummel and Maedche2019; Walter et al. Reference Walter, Cohen, Lance Holbert and Morag2020) and are rarely known to the experimenter a priori, repeated measure designs are generally the conservative choice. Absent a strong, justified expectation of a large treatment or design effect and access to a large sample, researchers are likely better served by repeated measure designs.
Between-Groups versus Within-Subject Experiments
One of this study’s aims was to expand the evidence base on within-subject repeated measure designs. CSP’s useful initial evidence comes from one experiment on antipoverty spending ( $ N=900 $
students). We analyze three within-subject experiments (on antipoverty, affirmative action, and opioid policy) across three samples for a total
$ N=900 $
students). We analyze three within-subject experiments (on antipoverty, affirmative action, and opioid policy) across three samples for a total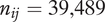 $ {n}_{ij}=\mathrm{39,489} $
, providing robust evidence on the utility of this type of repeated measure design. While we find that within-subject experiments are susceptible to some slight attenuation bias, we find that this bias is (if anything) smaller than for between-groups repeated measure experiments, and the precision gains are perhaps greater. In our bootstrapped analyses of equivalent sample sizes between designs (see Table 4), we observe a median 17.3% attenuation of the ATE for the within-subject experiments versus 25.1% for the between-groups experiments; we also observe a 57.9% median reduction in the standard error versus a 41.0% reduction. We recommend repeated measure designs for both types of experiments.
$ {n}_{ij}=\mathrm{39,489} $
, providing robust evidence on the utility of this type of repeated measure design. While we find that within-subject experiments are susceptible to some slight attenuation bias, we find that this bias is (if anything) smaller than for between-groups repeated measure experiments, and the precision gains are perhaps greater. In our bootstrapped analyses of equivalent sample sizes between designs (see Table 4), we observe a median 17.3% attenuation of the ATE for the within-subject experiments versus 25.1% for the between-groups experiments; we also observe a 57.9% median reduction in the standard error versus a 41.0% reduction. We recommend repeated measure designs for both types of experiments.
Probability versus Nonprobability Samples
Fielding all of our experiments on three samples simultaneously allows us to assess the suitability of repeated measure designs for diverse sampling designs and respondent characteristics. We observe large differences in respondent characteristics between the three samples, such as higher professionalization in the nonprobability samples and cross-sample variation in respondents’ ability to recall their pretreatment responses (see Section A.3 of the Supplementary Material). Nevertheless, we find no consistent differences in design effects across samples (see Figure 2). We further find no evidence that respondent professionalization alters design effects within each sample (see Section A.2 of the Supplementary Material). These results thus support repeated measure designs for both probability and nonprobability general population samples.
Brief Survey Modules
In experimental survey research, repeated measures are commonly placed as far apart as possible to enable respondents to “forget” their pretreatment responses, thus minimizing the risk of bias to the ATE. In our experiments, we randomly varied the proximity of pre- and post-treatment measures and find that distance between repeated measures alters the design effect only slightly, such that the attenuation bias increases marginally when the measures are placed further apart, as shown in Figure 4. Substantively, placing pre- and post-treatment measurements very close together appears to have similar results as placing them several minutes apart.Footnote 27 While our evidence offers no compelling reason to avoid distractor content between repeated measures, our findings offer reassurance that researchers can use repeated measure designs even when constrained to very limited survey space that precludes providing much separation.Footnote 28
That said, our exploratory analyses regarding differences in the design effect from iterative exposure to multiple repeated measure designs in a single survey (see Table 5 and Section A.1 of the Supplementary Material) offer an important caution about repeated measure designs in omnibus surveys. We find that the attenuation in treatment effects from a repeated measure design increases slightly as respondents encounter more repeated measure experiments in our surveys, and that this increase is particularly pronounced for experiments fielded after an attitude-recall question. When combining multiple studies in a single survey—as is common practice today through collaborative data collection efforts like TESS or the Cooperative Election Studies—repeated measure experiments placed in later modules may risk more severe attenuation of treatment effects, especially if attitude-recall questions are used in earlier modules.
CONCLUDING REMARKS
Considering the sum of our evidence, we offer three final remarks. First, we note that our study says little about the relative prevalence of priming, consistency, or demand effects. While one or more of these conventional concerns may contribute to the slight attenuation we observe in repeated measure designs, there is likely heterogeneity in the relative strength of each across individuals, and some may even be operating in opposing directions to produce net attenuation on average. We encourage future research to better disentangle this knot.
Second, our 18 studies cover much ground but necessarily leave much unexplored. For example, experiments on highly sensitive topics subject to strong social desirability bias may suffer from larger design effects than we identify here. Our omnibus surveys are relatively short and exclusively use the self-administered web survey mode. Repeated measure designs in other survey experimental contexts such as face-to-face or phone interviews, where the interviewers’ presence may alter respondent reactions to repeated measurements (Lavrakas, Kelly, and McClain Reference Lavrakas, Kelly, McClain, Lavrakas, Traugott, Kennedy, Holbrook, Leeuw and West2019), may face additional challenges that we cannot examine here—particularly for sensitive topics. Nevertheless, because experimental interventions and self-administered web surveys like ours are quite common in contemporary experimental research (Clifford, Sheagley, and Piston Reference Clifford, Sheagley and Piston2021; Jerit and Barabas Reference Jerit and Barabas2023), we believe that our evidence provides useful insights for many experimental research contexts.
Finally, we return to the broad shift in design practice that has followed CSP’s evidence-backed suggestion that “the default should shift away from the post-only design and toward repeated measure designs” (Reference Clifford, Sheagley and Piston2021, 1063). Through our large-scale replications and extensions, our contribution should be viewed as a qualified endorsement of this new standard for experimental design. There remain some circumstances in which research aims can reasonably justify a traditional post-only design, but in our view, these cases are not the modal enterprise in the discipline today. Our accumulated evidence suggests that the burden of justifying an experimental design should weigh more heavily on the use of post-only over repeated measure designs, rather than the historical reverse.
SUPPLEMENTARY MATERIAL
To view supplementary material for this article, please visit http://doi.org/10.1017/S0003055426101671.
DATA AVAILABILITY STATEMENT
Research documentation and data that support the findings of this study are openly available at the American Political Science Review Dataverse: https://doi.org/10.7910/DVN/SH0F25.
ACKNOWLEDGMENTS
The authors thank Yuki Atsusaka, Scott Clifford, Gustavo Diaz, Don Green, Jon Green, Sunshine Hillygus, Christopher Johnston, Molly Offer-Westort, Carlisle Rainey, Geoff Sheagley, Mallory SoRelle, Anton Strezhnev, Matthew Tyler, and the anonymous reviewers for helpful comments that improved the research, as well as participants at PolMeth 2024, TexMeth 2025, MPSA 2025, APSA 2025, the UT Austin Junior Methodologist Workshop, and workshops at Duke University and the University of Wisconsin–Madison. AmeriSpeak data collected by Time-sharing Experiments for the Social Sciences, NSF Grant # 2017464, Maureen Craig, James Druckman, and Jeremy Freese, Principal Investigators. The authors also thank NORC staff for their assistance with data collection, particularly Dan Costanzo and Alyssa Kahle. Authorship for this work is in an alphabetical order.
FUNDING STATEMENT
This work was generously supported by grants awarded by the National Science Foundation via the Time-sharing Experiments in the Social Sciences managed at the University of Rochester (awarded to all authors), the Rapoport Family Foundation (awarded to T.O.), and Bass Connections at Duke University (awarded to D.J. and A.T.). The statements made and views expressed are solely the responsibility of the authors.
CONFLICT OF INTEREST
The authors declare no ethical issues or conflicts of interest in this research.
ETHICAL STANDARDS
The authors declare that the human subjects research in this article was reviewed and approved by the Institutional Review Board of Duke University under protocol #2024-0246. The authors affirm that this article adheres to the principles concerning research with human participants laid out in APSA’s Principles and Guidance on Human Subjects Research (2020).



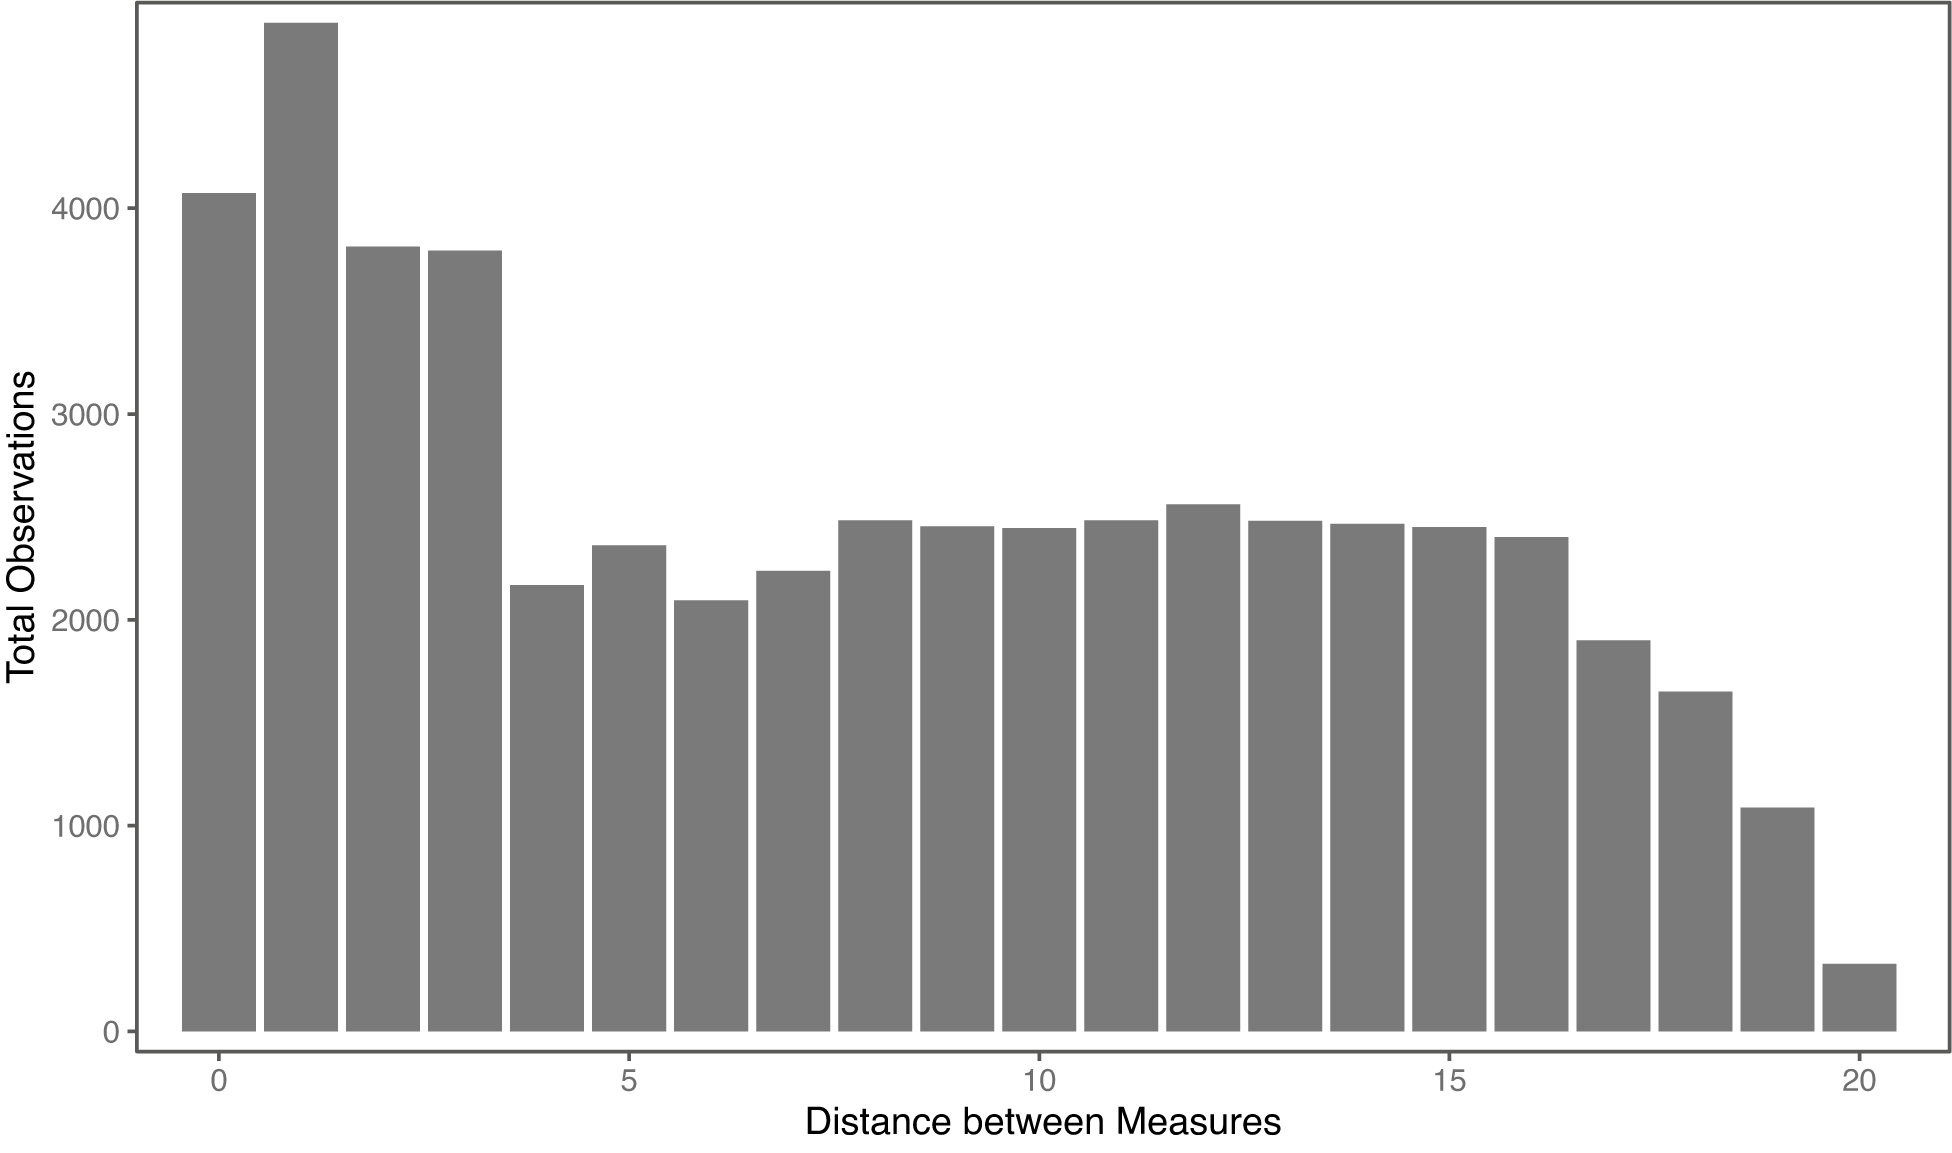

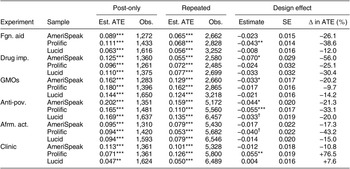
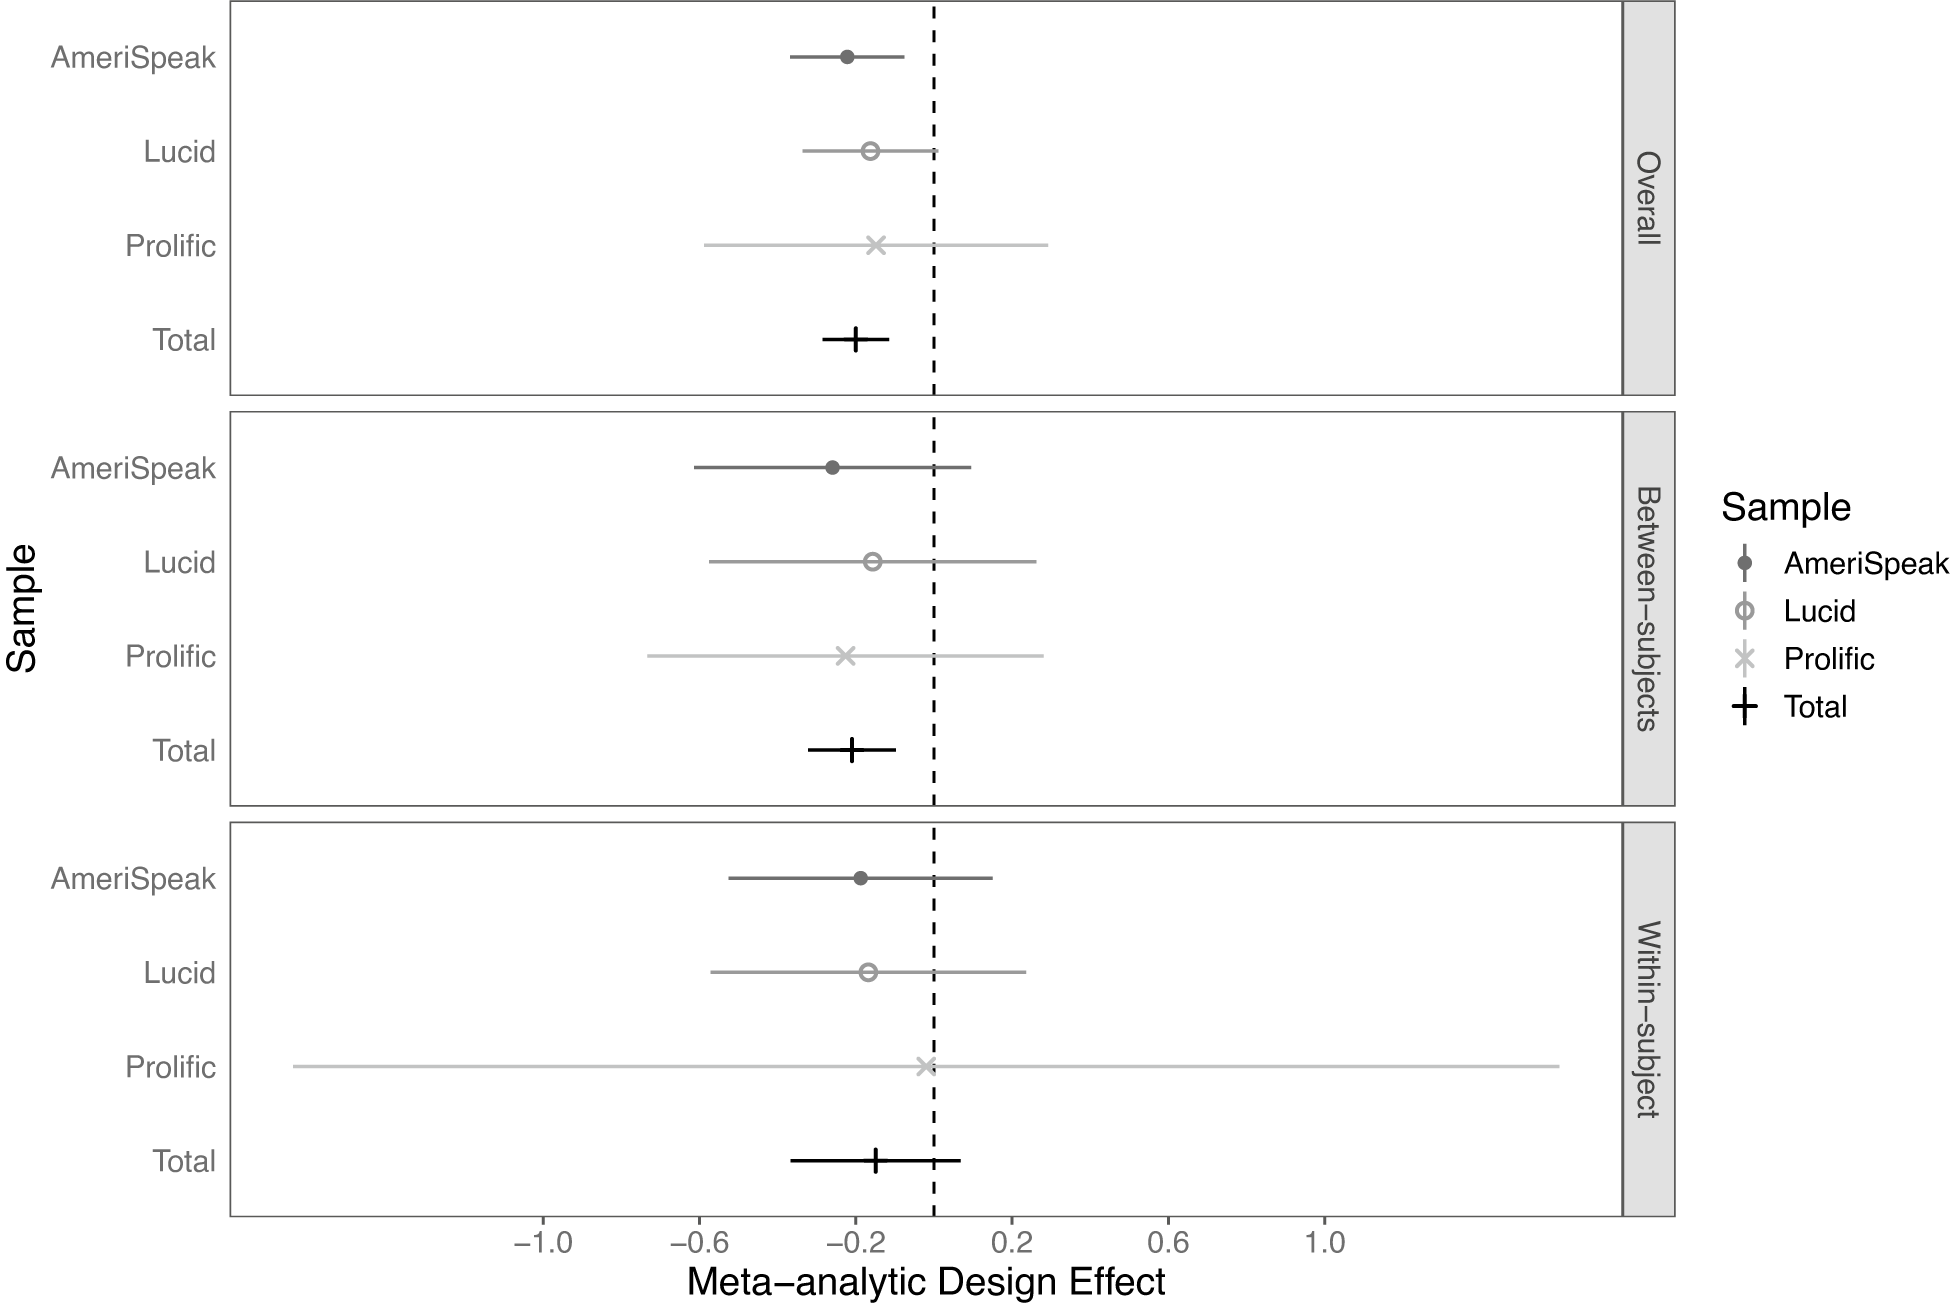
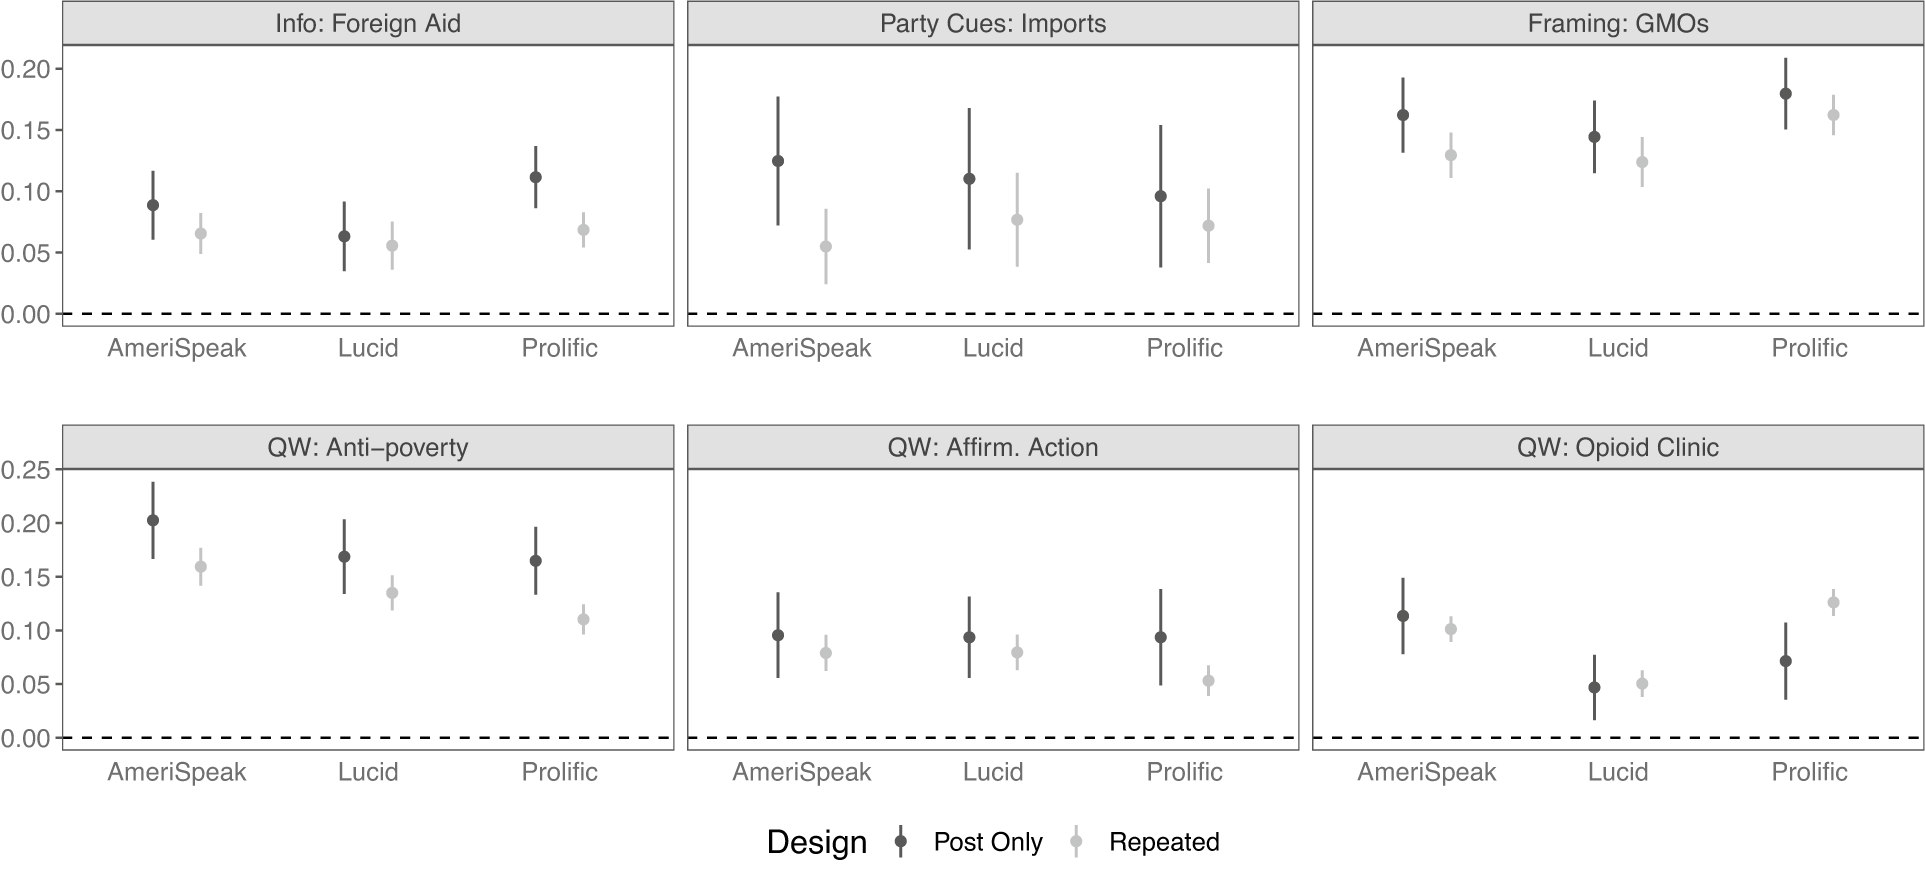
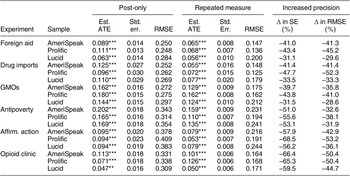
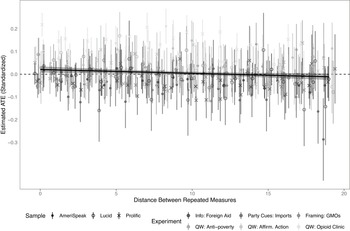

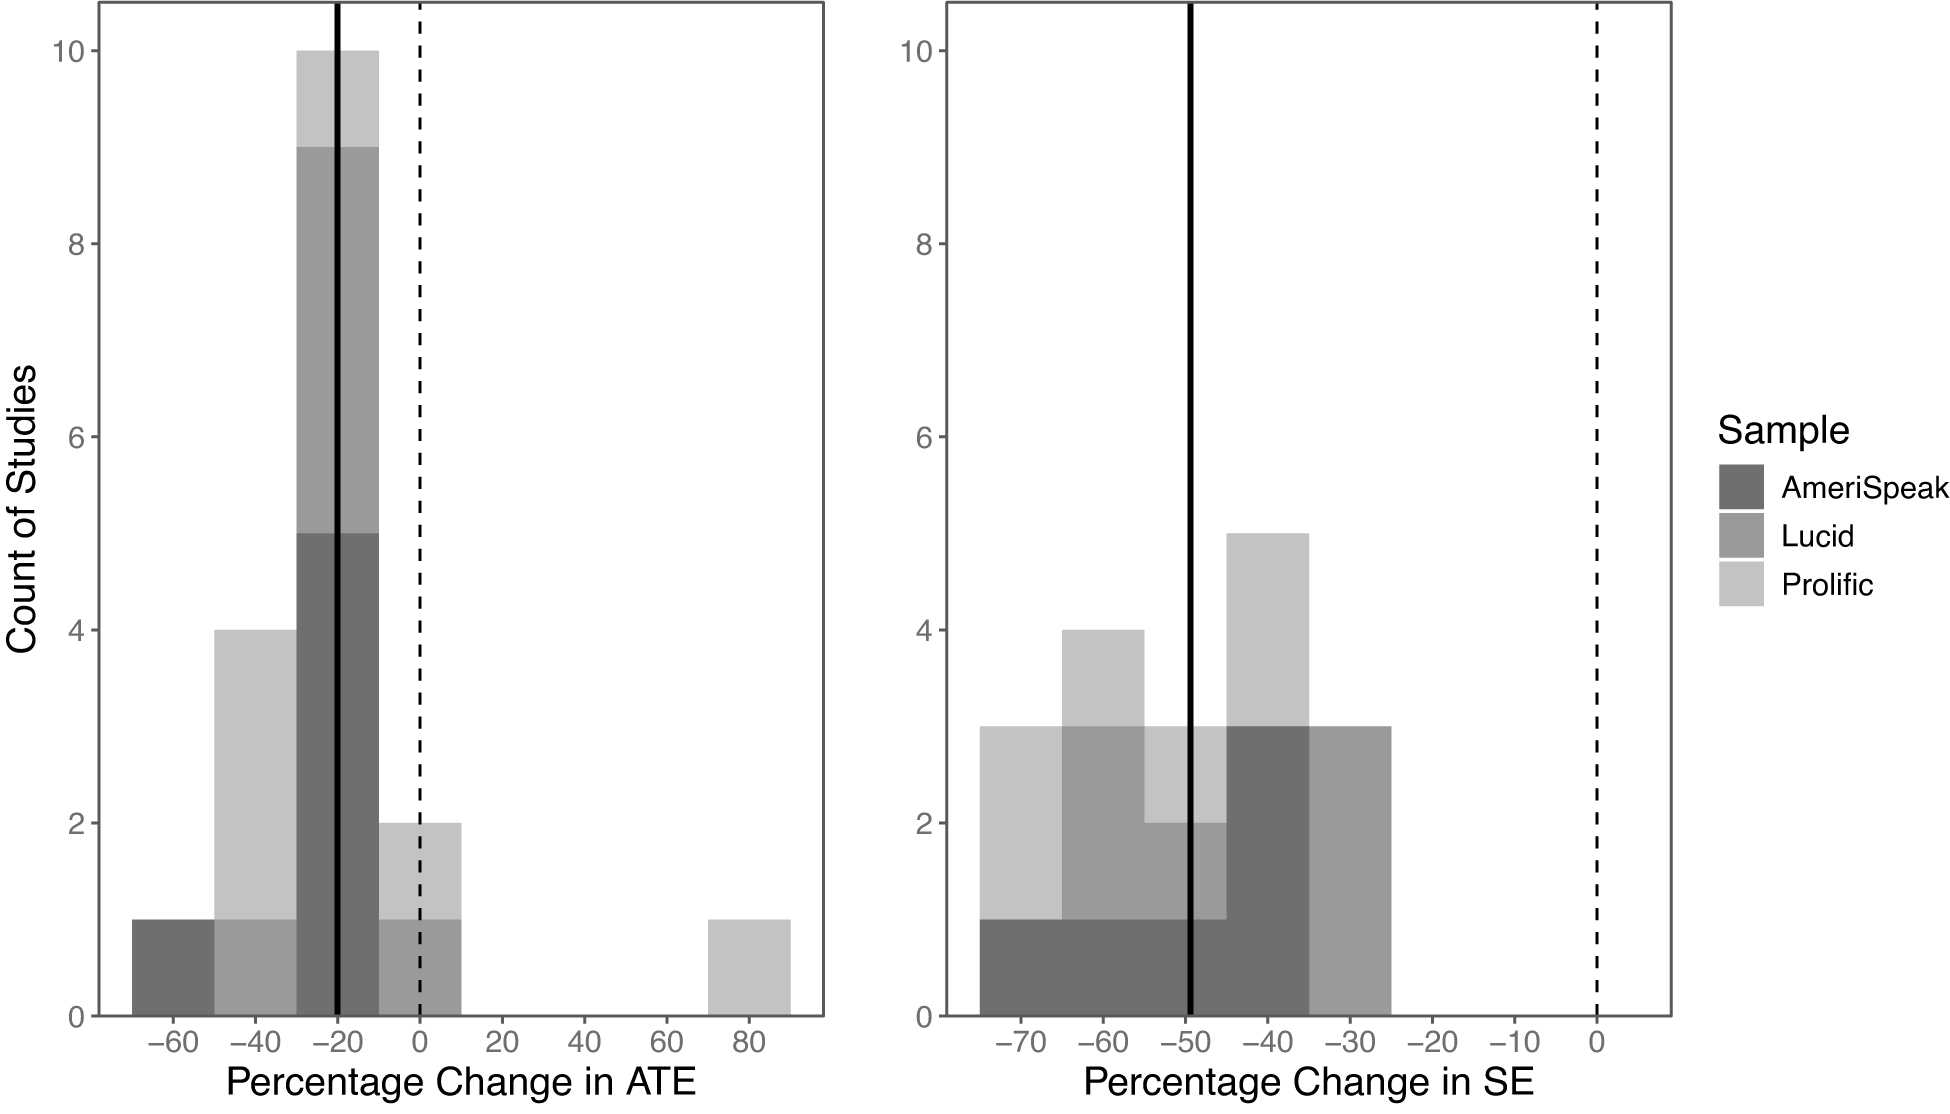
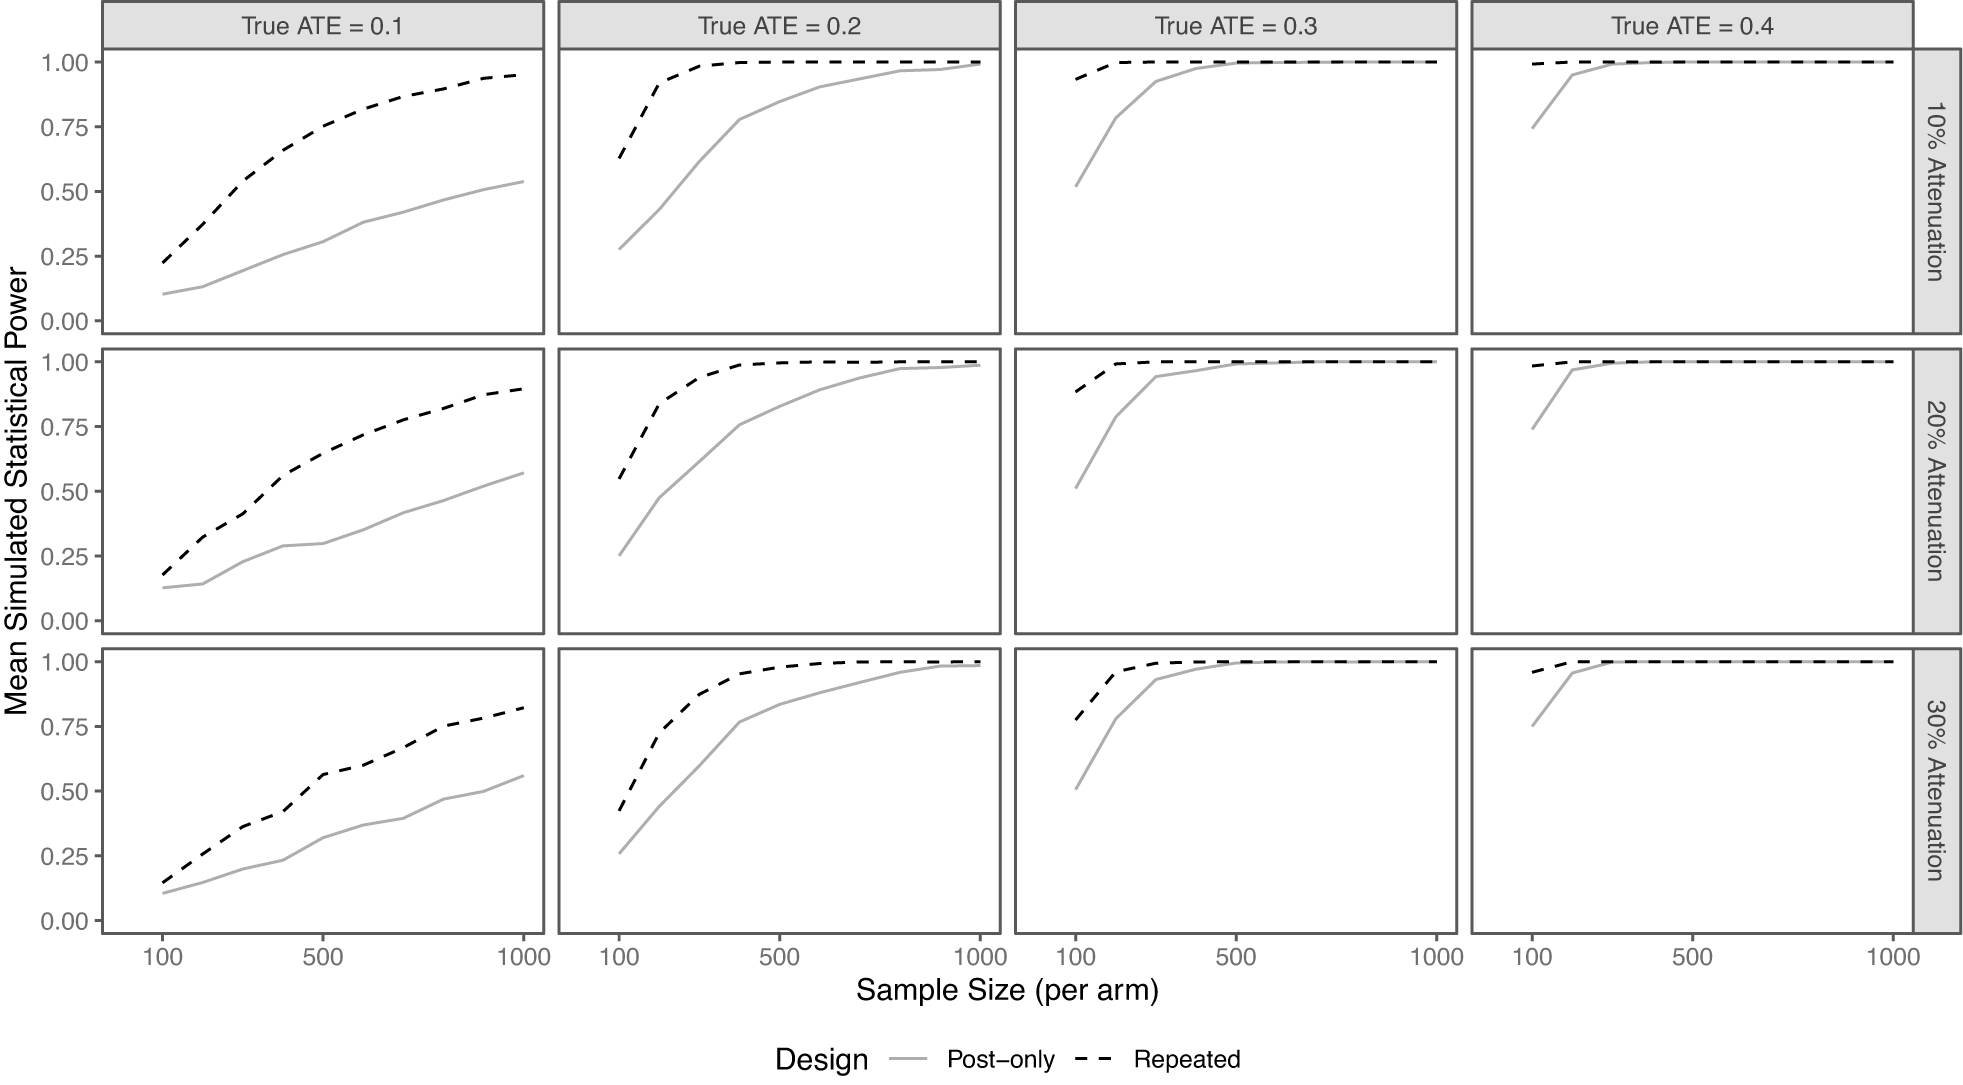
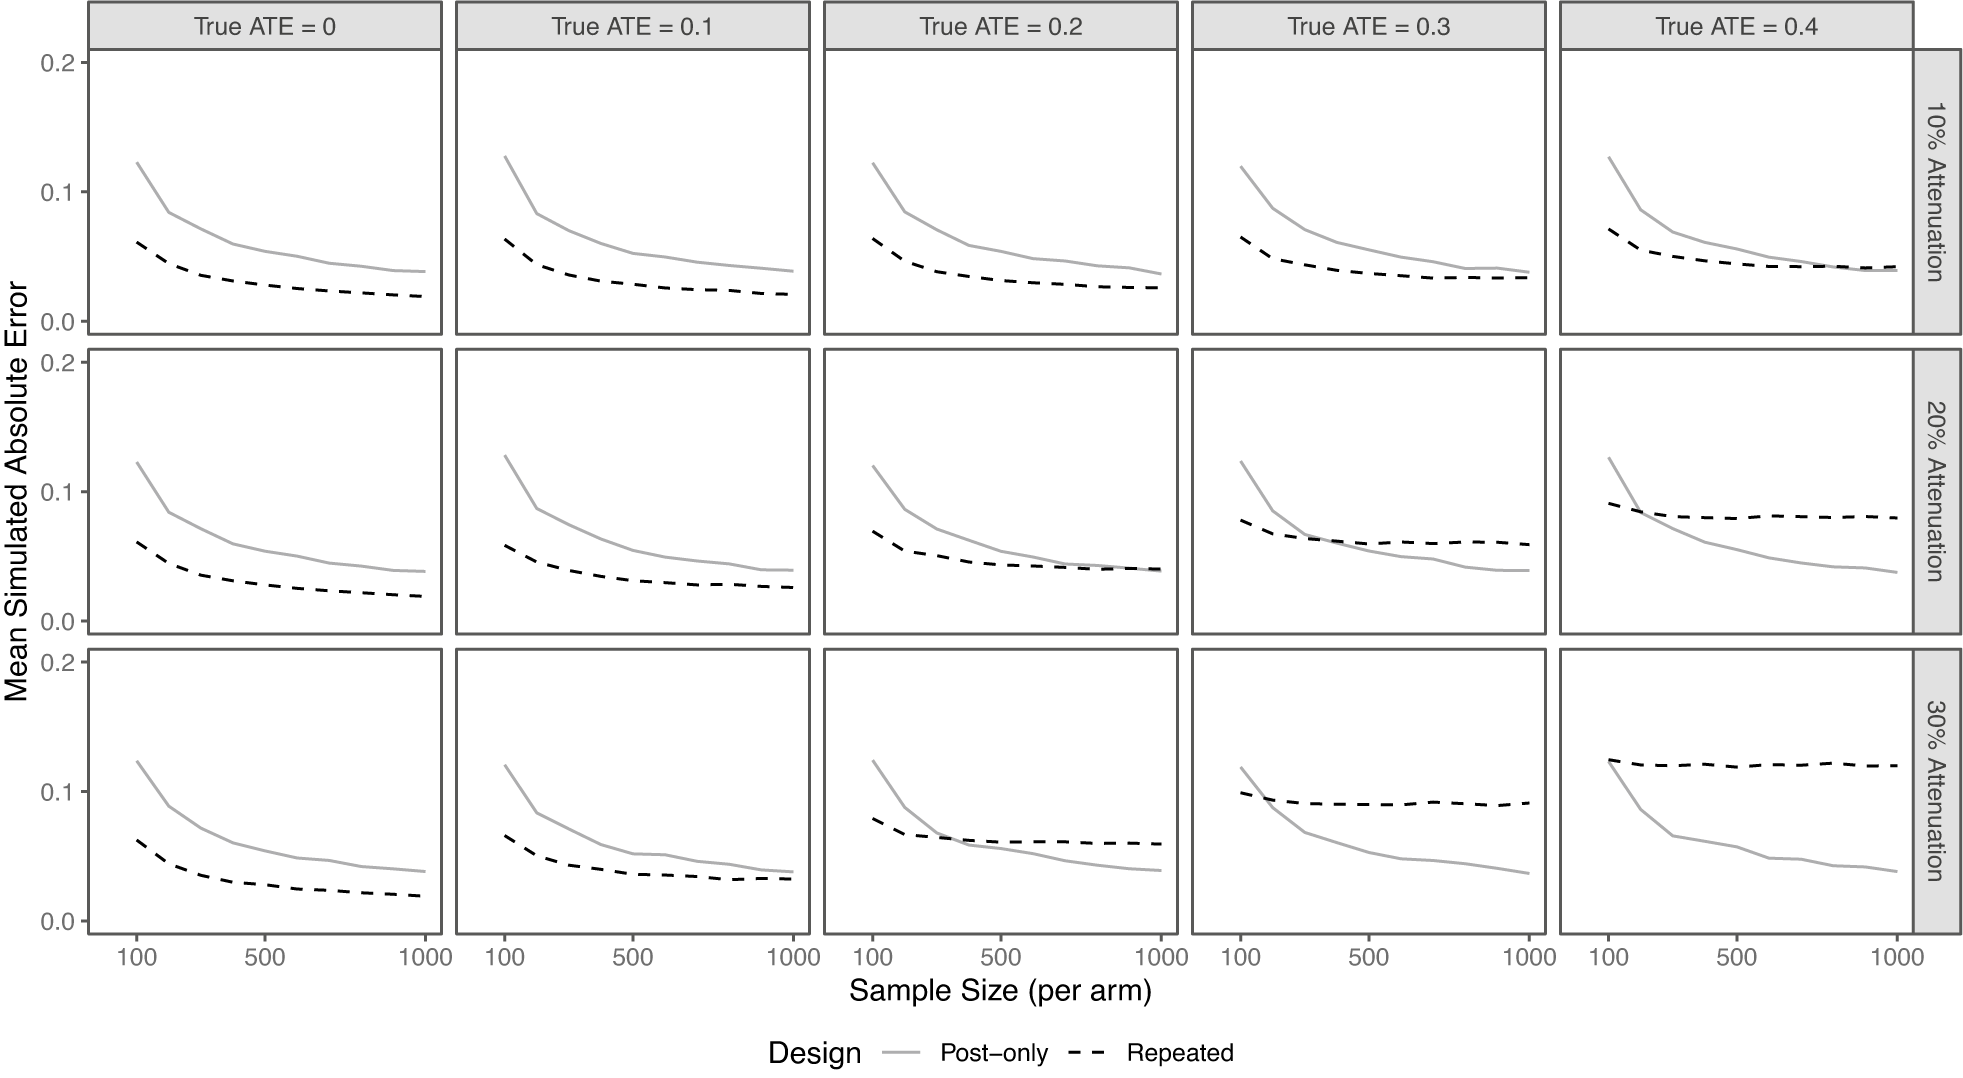


 Open access


Comments
No Comments have been published for this article.