

Postprandial hyperlipidaemia and hyperglycaemia are strongly associated with CVD(Reference Coutinho, Gerstein and Wang1, Reference Karpe2). In fact, postprandial changes in plasma TAG and glucose concentrations might be more strongly associated with CVD risk than their fasting concentrations(Reference Bansal, Buring and Rifai3,Reference Temelkova-Kurktschiev, Koehler and Henkel4). Further, high fasting glucose concentrations are predictive for post-meal glucose excursions(Reference Carroll, Izard and Riboni5) and those of fasting TAG for postprandial hyperlipidaemia(Reference Van Wijk, Halkes and Erkelens6), which may explain why patients with the metabolic syndrome often have a disturbed postprandial metabolism(Reference Van Oostrom, Alipour and Plokker7). As people in the Western world are in a non-fasting state for most of the day, these are important findings.
The macronutrient composition of a meal is an important determinant of the postprandial response. High-fat meals have been found to increase plasma TAG concentrations(Reference Dubois, Beaumier and Juhel8), to impair endothelial activity and function(Reference Vogel, Corretti and Plotnick9) and to increase markers of inflammation(Reference Aljada, Mohanty and Ghanim10). However, Westphal et al. (Reference Westphal, Kästner and Taneva11) have shown that adding glucose to a high-fat meal resulted in a delay and reduction of postprandial lipaemia. Casein had an even stronger effect: chylomicron responses were further reduced and delayed, which could not be explained by gastric emptying time. Further, concentrations of C-peptide and insulin were elevated during the post-absorptive phase (4–8 h) after the casein-containing meals. Whether milk and other dairy products have comparable effects on postprandial metabolism, as has milk protein alone, is not known. Furthermore, it has been reported that increased Ca intakes from dairy products reduced chylomicron TAG concentrations after a meal(Reference Lorenzen, Nielsen and Holst12). However, effects of Ca on other postprandial responses have not been studied before. In the present study, we therefore investigated the effects of adding low-fat milk to a high-fat breakfast on postprandial lipid and glucose metabolism in overweight and obese subjects. To evaluate which of the dairy components may be responsible for possible effects, we also studied the postprandial effects of milk protein and Ca, two major milk constituents.
Methods
Study population
Subjects were recruited in Maastricht and surroundings by advertisements in local newspapers and posters in the hospital and university buildings. People who were interested to participate were informed about the purposes and requirements of the study, and all gave their written informed consent before they entered the screening procedure. The study was approved by the Medical Ethical Committee of the Maastricht University Medical Centre and was registered on 8 June 2009 at ClinicalTrials.gov as NCT00917878.
Subjects were invited for the screening procedure when they met the following inclusion criteria: male; aged 18–70 years; non-smoking; BMI >27 kg/m2; no active CVD, familial hyperlipidaemia, inflammatory diseases or other medical conditions that might interfere with the study outcomes; no abuse of alcohol or drugs; and stable body weight during the past 3 months. During two screening visits, body weight, height and blood pressure were measured and a fasting blood sample was taken to determine serum lipid and lipoprotein concentrations. A total of sixteen men were enrolled in the study (Table 1). They were asked not to change their dietary habits, use of alcohol and level of physical exercise during the study. They were also requested to record any signs of illness, use of medication or other important details during the study period in a diary. All men completed the study.
Baseline characteristics of the sixteen men (Mean values and standard deviations)

Study design and intervention
The study consisted of four test days, which were separated by a washout period of at least 3 d. On each test day, subjects received a different test meal in randomised order, and participated in a postprandial test. Subjects were asked not to perform any strenuous physical exercise and not to consume alcohol on the day before testing. They were also asked to refrain from high-fat foods on the day prior to the test days. After an overnight fast, subjects arrived at the university by public transport or car. An intravenous cannula (Venfon®; Becton Dickinson) was inserted into an antecubital vein and blood samples were collected for analysis of fasting concentrations of metabolic risk markers. Subjects were then requested to consume one of the test meals within 10 min. Subsequent blood samples were drawn 15, 30, 45, 60, 90, 120, 180, 240, 300 and 360 min after meal consumption. Subjects were allowed to drink water (250 ml) directly after the T= 120 and T= 240 blood sample collections.
The test meals consisted of 168 g butter cake and 500 ml of one of the four drinks (Table 2). In the milk intervention, subjects consumed skimmed milk (0 % fat; Campina). All drinks contained an equal amount of lactose (DMV International). The protein drink contained the same amount of protein (REFIT Total Milk Protein; DMV International) as the milk, while the Ca content (Lactoval; DMV International) of the Ca and protein drinks was equal to that of the milk. The amino acid compositions of all meals are provided as supplementary Table S1 (available online).
Composition of the test meals

Blood sampling and analyses
Venous blood was sampled using a Vacutainer system (Becton Dickinson). Blood was drawn into serum separator tubes for the analysis of lipids and lipoproteins. After clotting at room temperature for at least 30 min, serum was obtained by centrifugation at 1300 g for 15 min at room temperature and stored at − 80 °C. Further, blood was sampled into EDTA tubes for the analysis of insulin and NEFA concentrations and sodium fluoride (NaF) tubes were used for analysis of plasma glucose and amino acid concentrations. EDTA and NaF tubes were kept on ice until centrifugation at 1300 g for 15 min at 4 °C. Plasma samples were snap-frozen in liquid N2 and stored at − 80 °C.
Fasting serum samples were analysed for concentrations of total cholesterol (CHOD-PAP method; Roche) and HDL-cholesterol (precipitation method; Roche). LDL-cholesterol concentrations were calculated using the Friedewald equation(Reference Friedewald, Levy and Fredrickson13). Concentrations of TAG, with correction for free glycerol, were determined in serum samples from T= 0, 60, 120, 180, 240, 300 and 360 min (GPO Trinder; Sigma Diagnostics). apoB-48 concentrations were determined in plasma samples from T= 0, 120, 240 and 360 min by ELISA (Human Apo B-48 kit; Shibayagi). NEFA concentrations were analysed in plasma samples from T= 0, 60, 120, 240 and 360 min (NEFA kit; WAKO).
Glucose concentrations (Horiba ABX) and insulin concentrations (RIA; Millipore) were measured in plasma samples from T= 0, 15, 30, 45, 60, 90, 120, 240 and 360 min. Plasma amino acid concentrations were determined from blood samples obtained at T= 0, 60 and 120 min, as described elsewhere(Reference Van Eijk, Rooyakkers and Deutz14).
Statistics
Data are presented as mean values and standard deviations unless otherwise indicated. Fasting concentrations (T= 0) of the various parameters, as measured on the day of each test meal, were not statistically significant, as examined using univariate ANOVA. To evaluate the overall response of total TAG, apoB48, glucose, insulin and NEFA during the 6 h postprandial period, the incremental areas under the postprandial curve (iAUC) or decremental AUC were calculated using the trapezoidal rule. Maximal changes were calculated by subtracting fasting concentrations from the maximal or minimal value. Differences in iAUC and maximal changes between the test meals were tested for significance by univariate ANOVA followed by Bonferroni's correction for multiple comparisons. Changes in concentrations over time were analysed using linear mixed models, with diet and time as fixed factors and with diet × time as the interaction term. If the interaction term was not statistically significant, it was omitted from the model, and the factors diet and time were tested for statistical significance. If significant, post hoc tests with Bonferroni's correction were carried out. For time, only comparisons were made relative to those of fasting concentrations. All statistical analyses were performed using SPSS 16.0 for Macintosh OS X package (SPSS). A P value < 0·05 was considered as statistically significant.
Results
TAG and apoB-48
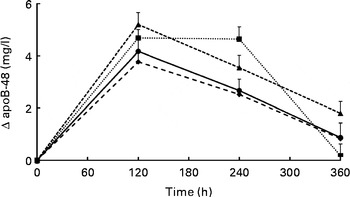
Changes in serum TAG concentrations during the postprandial phase did not differ significantly between the meals (P= 0·186 for meal effects; Fig. 1). Compared with fasting concentrations, all test meals increased serum TAG concentrations (P< 0·001 for time effect), which reached peak concentrations after 180 min and had not returned to fasting concentrations after 360 min. iAUC and maximal increases are shown in Table 3. Compared with the control meal, addition of protein to the meal significantly increased the iAUC by 44 % (P= 0·015). The difference between the protein and Ca meals was nearly significant (P= 0·062). The maximal increases in serum TAG concentrations were not different between the four meals (P= 0·498). Fig. 2 shows apoB-48 concentrations after the test meals. Compared with fasting values, all test meals increased apoB-48 concentrations (P< 0·001 for time effect). Also, a statistically significant meal effect was found (P= 0·016), related to differences between the milk and Ca meals (P= 0·030) and the protein and Ca meals (P= 0·042). Compared with the milk meal, the Ca meal decreased the iAUC by 48 % (P= 0·012; Table 3). The maximal increases from fasting values were not statistically different between the test meals (P= 0·076).
Mean changes in serum TAG concentrations after consumption of the control, milk, protein, and calcium meals in a randomised crossover study with overweight and obese men (n 16). Values are means with their standard errors and were analysed using linear mixed models. There were no significant meal × time interactions. Time effects were P< 0·001 and meal effects P= 0·186. After Bonferroni's correction for multiple comparisons, all time points significantly differed from zero: P< 0·001. ![]() , Control;
, Control; ![]() , milk;
, milk; ![]() , protein;
, protein; ![]() , calcium.
, calcium.

Incremental AUC (iAUC) and maximal changes from fasting concentrations (Mean values and standard deviations)

dAUC, decremental AUC.
a,bMean values within a row with unlike superscript letters were significantly different (P< 0·05).
Mean changes in apoB-48 concentrations after the control, milk, protein, and calcium meals in a randomised crossover study with overweight and obese men (n 16). Values are means with their standard errors and were analysed using linear mixed models. There were no significant meal × time interactions. Time effects were P< 0·001 and meal effects P= 0·016. After Bonferroni's correction for multiple comparisons, all time points significantly differed from zero: P< 0·001. In addition, differences between the milk and calcium meals (P= 0·030) and between the protein and calcium meals (P= 0·042) reached statistical significance. ![]() , Control;
, Control;![]() , milk;
, milk; ![]() , protein;
, protein; ![]() , calcium.
, calcium.
Glucose and insulin
Plasma concentrations of glucose and insulin are provided as supplementary Figs. S1 and S2 (available online). Compared with fasting values, all test meals increased serum glucose concentrations (P< 0·001 for time effect), which decreased below fasting concentrations after about 180 min. Changes between the meals, however, were not significantly different (P= 0·947 for meal effect). Glucose concentrations were maximally increased at 15 min after the consumption of the Ca and protein meals, and at 30 min after consumption of the control and milk meals. The meals did not change the iAUC significantly (P= 0·051), but did change the maximal increase in glucose concentrations (P= 0·004). The difference between the protein and control meals of − 24 % reached statistical significance (P= 0·021). The decrease of 18 % after milk intake did not reach statistical significance (P= 0·111).
Insulin concentrations were maximal at 45 min after consumption of the test meals and had returned to fasting concentrations after 240 min (P< 0·001 for time effect). No meal effects were found (P= 0·585). Meal effects for the iAUC were significantly different (P< 0·001). Compared with the control meal, the iAUC was 52 % higher after the milk meal (P= 0·035). Also, the difference of 51 % between the milk and protein meals reached statistical significance (P= 0·005). The maximal increases were not statistically different between the four test meals (P= 0·227).
NEFA
Plasma NEFA concentrations significantly changed over time (P< 0·001), but these changes were not affected by the meals (P= 0·355 for meal effect; see supplementary Fig. S3, available online). Minimal values were reached after 120 min. Since NEFA concentrations dropped below the fasting values after meal consumption, decremental AUC instead of iAUC were calculated. The decremental AUC (P= 0·281) and the maximal decrease in NEFA (P= 0·114) were not different between the interventions.
Amino acids
Plasma concentrations of total, essential and non-essential amino acids after the four meals are given in Table 4). After 60 and 120 min, amino acid concentrations were increased on the milk and protein meals, compared with the control and Ca meals. Concentrations of the individual amino acids are provided as supplemental data (Supplementary Table S2, available online).
Fasting plasma amino acid concentrations and their changes after the test meals (Mean values and standard deviations)

AA, amino acids; EAA, essential amino acids (methionine, threonine, valine, isoleucine, leucine, phenylalanine, lysine, tryptophan); NEAA, non-essential amino acids.
a,b,cMean values within a row with unlike superscript letters were significantly different (P< 0·05).
Discussion
The aim of the present study was to compare the effects of milk and of milk protein and Ca, two major milk constituents, on postprandial lipid and glucose metabolism. Compared with control, milk increased the iAUC for apoB-48 and insulin. Further, the iAUC for TAG was increased and the maximal change in glucose was decreased when protein was added to the meal. The addition of Ca to the fat-containing meal had no effects on these parameters.
Results from other studies on postprandial effects of protein on TAG responses are not conclusive. Our finding that the addition of milk protein increased the iAUC of TAG contrasts observations of Westphal et al. (Reference Westphal, Kästner and Taneva11), who found in normal-weight men and women no change in this parameter when casein was added to a high-fat, carbohydrate-containing meal. In fact, they even reported that the iAUC for the chylomicron fraction was decreased. In a second study, casein and soya reduced serum TAG concentrations at the early time points, when added to a high-fat meal containing virtually no carbohydrates(Reference Westphal, Taneva and Kästner15). In that study, iAUC values were not reported, while TAG concentrations were not analysed in the chylomicron and VLDL fractions. The amounts of protein (about 50 g) and fat (about 70 g) given to the subjects were higher than in the present study. The authors suggested that the decreased chylomicron TAG response(Reference Westphal, Kästner and Taneva11) resulted from a delayed gastric emptying and from increased insulin concentrations. Insulin activates lipoprotein lipase, which might increase chylomicron degradation(Reference Eckel16). The responsiveness of lipoprotein lipase, in adipose tissue, to insulin and meals may be diminished in obesity(Reference Wang and Eckel17). As the subjects in the present study were all overweight or obese, in contrast to those in the trials of Westphal et al. (Reference Westphal, Kästner and Taneva11, Reference Westphal, Taneva and Kästner15), it can be speculated that this might at least partly explain the different findings. However, in a trial with overweight, type 2 diabetic subjects, Brader et al. (Reference Brader, Holm and Mortensen18) did find a decrease in TAG after casein consumption, but only in combination with carbohydrate consumption. Cohen(Reference Cohen19) observed no effects of casein addition (23 g) on postprandial lipaemia after a high-fat (40 g) meal in normal-weight men and women. One study has reported increased TAG concentrations after fat and casein consumption in healthy male subjects(Reference Sullivan20). However, since only four out of six subjects showed increased postprandial lipaemia after protein ingestion and results were not statistically analysed, the findings of that study are difficult to interpret. The protein we used was a total milk protein, containing the total fraction of cows' milk (mainly casein and whey), and thus somewhat different from the protein used by Westphal et al. (Reference Westphal, Kästner and Taneva11). Animal studies suggest that casein may have an unfavourable impact on lipid metabolism, as compared with soya protein(Reference Oliva, Selenscig and D'Alessandro21), but human studies suggest that the nature of protein does not affect postprandial lipaemia(Reference Westphal, Taneva and Kästner15). We further provided the protein in addition to that in the meals, resulting in a higher energy intake in the protein and milk meals. However, it is not likely that a higher energy intake per se will increase postprandial TAG concentrations. For example, when extra energy is added to a fat-rich meal in the form of glucose, the TAG response may even be reduced(Reference Cohen and Berger22, Reference Westphal, Leodolter and Kahl23).
We further observed that apoB-48 responses increased by the addition of milk or protein to the meal, which is in line with our observations on TAG responses. ApoB-48 is the apo present on chylomicrons of intestinal origin. The present results therefore imply that after the protein and milk meal, the number of chylomicron particles in the circulation is higher compared with the control meal. Whether this is due to an increased production or to a decreased clearance remains unknown.
The Ca supplement used in the present trial, which was derived from a dairy source, did not affect the serum TAG response. Lorenzen et al. (Reference Lorenzen, Nielsen and Holst12) found that Ca from dairy products (350 or 800 mg), but not a calcium carbonate supplement (850 mg), reduced the iAUC for chylomicron TAG after a fat load. The authors suggested that this decrease may be due to a reduction in fat absorption, as a number of studies have shown that Ca intake increases faecal fat excretion, probably through the binding in the intestine of Ca to fatty acids, mainly SFA(Reference Denke, Fox and Schulte24). However, no differences in total plasma TAG were observed, which is in line with our findings. Effects on fat absorption, however, cannot be fully excluded, as the effect on chylomicron TAG may have been too small to be detected in the total TAG fraction or may have been counteracted by an increase in VLDL.
We observed a 35 % increase in the insulin response after the milk meal, but no increase after the protein meal. Protein, especially in combination with carbohydrates, is already known for decades to induce insulin secretion(Reference Rabinowitz, Merimee and Maffezzoli25). Van Loon et al. (Reference Van Loon, Kruijshoop and Verhagen26–Reference Van Loon, Saris and Verhagen28) confirmed the insulinotropic potential of various proteins, hydrolysates and free amino acids in combination with carbohydrates in a series of studies in healthy young subjects. One of the most insulinotropic amino acids was leucine, which is highly present in milk protein. In addition, protein may decrease hepatic insulin extraction from the circulation. Addition of whey protein to a meal resulted in elevated postprandial insulin concentrations, while C-peptide levels were unaffected(Reference Lan-Pidhainy and Wolever29). However, Westphal et al. (Reference Westphal, Kästner and Taneva11) did find increased C-peptide concentrations after casein consumption, indicating an increased insulin production. Our observation that the insulin response was elevated by the milk meal, but not by the protein meal, is unexpected, as the protein content, the source of protein, the amino acid composition and the Ca and lactose content were exactly the same in both drinks. Further, changes in plasma concentrations of amino acids were comparable after the milk and protein meal. So, there may be an additional factor in milk that influences either the secretion or the clearance of insulin.
The iAUC for glucose were not different between the meals, but the peak change was decreased by the protein meal. Milk also decreased the peak change in glucose, though this change did not reach statistical significance. Ca had no effect. Thus, we observed a reduction in the maximal glucose concentration, while the insulin response was not changed after the protein meal. A number of amino acids, including lysine(Reference Kalogeropoulou, LaFave and Schweim30), proline(Reference Nuttall, Gannon and Jordan31), glycine(Reference Gannon, Nuttall and Nuttall32) and arginine(Reference Gannon, Nuttall and Nuttall33), have been found to attenuate plasma glucose levels when ingested with carbohydrates, without elevating insulin concentrations. However, other amino acids, such as leucine(Reference Kalogeropoulou, Lafave and Schweim34) and phenylalanine(Reference Nuttall, Schweim and Gannon35), have been shown to cause a reduction in plasma glucose and a concurrent increase in insulin secretion. The increased insulin levels after the milk diet did not affect NEFA concentrations. This is in contrast to the reduced NEFA concentrations observed by Westphal et al. (Reference Westphal, Kästner and Taneva11, Reference Westphal, Taneva and Kästner15), who contributed this effect to the increased insulin response. However, Brader et al. (Reference Brader, Holm and Mortensen18) did not find significant differences in NEFA AUC, despite an increase in insulin after casein consumption.
In conclusion, the present results indicate that the intake of milk with a fat-containing meal enhances postprandial TAG and insulin responses and may blunt glucose increases. The protein fraction of milk seems to be the main determinant for the effects on TAG and glucose. Ca did not change any of the postprandial responses.
Supplementary material
To view supplementary material for this article, please visit http://dx.doi.org/10.1017/S0007114512005314
Acknowledgements
The present study was financially supported by the Dutch Dairy Association (Nederlandse Zuivel Organisatie). We would like to thank Martine Hulsbosch and Denis van Beurden for their technical support and Yvonne Verhulst for her dietary assistance. L. E. C. v. M. conducted the study. R. P. M. designed the study and had overall responsibility. L. E. C. v. M. and R. P. M. analysed the data and wrote the manuscript. All authors read and approved the final manuscript. The authors report no conflict of interest.


