


1. Introduction
There are many examples of collapsible tubes in the human body, including the blood vessels, airways and intestines. These vessels are typically sensitive to changes in internal pressure, so a variety of interesting physiological phenomena can arise when a flow is driven through them. For example, in veins above the heart the transmural (internal–external) pressure is often negative due to the hydrostatic pressure decrease with height, and so these vessels can spontaneously collapse (Moreno et al. Reference Moreno, Katz, Gold and Reddy1970; Wild, Pedley & Riley Reference Wild, Pedley and Riley1977). Furthermore, forced expiration of air from the lungs can induce airway collapse, significantly reducing the flow rate that can be expelled, a phenomenon known as ‘flow limitation’ (Grotberg & Gavriely Reference Grotberg and Gavriely1989). This study is motivated by another physiological example, where the onset of self-excited oscillations in rapid flow along the brachial artery manifest as Korotkoff sounds during blood pressure measurement (Ur & Gordon Reference Ur and Gordon1970; Bertram, Raymond & Butcher Reference Bertram, Raymond and Butcher1989). More expansive reviews of the interesting phenomena that can arise from flow through collapsible vessels are provided elsewhere (Grotberg & Jensen Reference Grotberg and Jensen2004; Heil & Hazel Reference Heil and Hazel2011).
Flow in collapsible tubes can be investigated experimentally using a Starling resistor, where liquid is driven through a segment of externally pressurised flexible tubing mounted between two rigid tubes (e.g. Bertram & Pedley Reference Bertram and Pedley1982; Bertram Reference Bertram1986; Bertram, Raymond & Pedley Reference Bertram, Raymond and Pedley1990, Reference Bertram, Raymond and Pedley1991; Bertram & Tscherry Reference Bertram and Tscherry2006). A typical experiment drives flow along the tube with either a fixed upstream flow rate or a fixed upstream pressure. The experiments demonstrate that the system can adopt a steady configuration with a non-uniform wall profile, while for some operating conditions the system can even exhibit multiple (stable) steady states in a so-called ‘open-to-closed’ transition (Bertram et al. Reference Bertram, Raymond and Pedley1991). On top of this static behaviour, a wide variety of different classes of self-excited oscillation have been observed. These oscillations fall into distinct frequency bands (Bertram et al. Reference Bertram, Raymond and Pedley1990) and exhibit complex nonlinear limit cycles, characterised by phase portraits of quantities such as pressure or flow rate at different points along the tube (Bertram et al. Reference Bertram, Raymond and Pedley1990, Reference Bertram, Raymond and Pedley1991). However, the mechanisms which generate these oscillations are still not well understood.
Theoretical study of the Starling resistor experiment began with lumped parameter models (e.g. Katz, Chen & Moreno Reference Katz, Chen and Moreno1969; Bertram & Pedley Reference Bertram and Pedley1982), formed from a small number of ordinary differential equations. Such models qualitatively capture the static deformation of the tube observed in experiments, predicting that over a narrow window of the parameter space the system can exhibit three co-existing steady states: an upper branch (where the wall is inflated), a lower branch (where the wall is collapsed) connected by an (unstable) intermediate branch by a pair of limit point bifurcations (Armitstead, Bertram & Jensen Reference Armitstead, Bertram and Jensen1996). These lumped models further predict the onset of self-excited oscillations from the collapsed (lower) static branch (Bertram & Pedley Reference Bertram and Pedley1982) and elucidate possible global interactions between the oscillatory limit cycles and the additional static solutions (Armitstead et al. Reference Armitstead, Bertram and Jensen1996).
In more recent years these theoretical studies have gradually increased in complexity, beginning with cross-sectionally averaged one-dimensional models (e.g. Cancelli & Pedley Reference Cancelli and Pedley1985; Jensen Reference Jensen1990) all the way to full three-dimensional models of the static (Hazel & Heil Reference Hazel and Heil2003; Marzo, Luo & Bertram Reference Marzo, Luo and Bertram2005; Zhang, Luo & Cai Reference Zhang, Luo and Cai2018) and oscillatory behaviour (Heil Reference Heil1997; Heil & Boyle Reference Heil and Boyle2010; Whittaker et al. Reference Whittaker, Heil, Jensen and Waters2010) of the tube. However, numerical solution of the latter requires immense computational resources and so it has not yet been possible to fully map out the different classes of oscillatory behaviour across the parameter space.
For simplicity in probing the underlying mechanisms of instability, theoretical attention has also focused on a planar analogue of the Starling resistor set-up, formed by removing a segment of one wall of a rigid channel and replacing it by an externally pressurised flexible membrane (Pedley Reference Pedley1992). This channel system has subsequently been studied using fully nonlinear simulations (Luo & Pedley Reference Luo and Pedley1995, Reference Luo and Pedley1996; Jensen & Heil Reference Jensen and Heil2003; Xu, Billingham & Jensen Reference Xu, Billingham and Jensen2014), where many of the predictions are analogous to those from the lumped parameter models. For example, for the flexible wall modelled as either a thin membrane or a nonlinearly elastic shell, the system can exhibit multiple co-existing steady states provided the Reynolds number is large enough to collapse the channel through the Bernoulli effect (Luo & Pedley Reference Luo and Pedley2000; Heil Reference Heil2004). Furthermore, the lower branch of static solutions is unstable to oscillations when the channel becomes sufficiently collapsed (Heil Reference Heil2004). In addition, recent work by Herrada et al. (Reference Herrada, Blanco-Trejo, Eggers and Stewart2021) has shown that the upper branch of static solutions can also become unstable to oscillations provided the external pressure is sufficiently low (so the flexible wall bulges outwards).
Further insight into the mechanisms of instability has been provided by spatially one-dimensional models of the collapsible channel system, derived using a flow profile assumption (Stewart, Waters & Jensen Reference Stewart, Waters and Jensen2009; Xu, Billingham & Jensen Reference Xu, Billingham and Jensen2013). Using the approach, Stewart (Reference Stewart2017) described two families of self-excited oscillations arising from the lower branch of static solutions in the limit of large external pressure, where the primary global instability is to a low-frequency mode from a static state which is inflated along most of the compliant segment, but collapsed along a narrow layer adjacent to the downstream rigid segment. Similarly, Xu et al. (Reference Xu, Billingham and Jensen2013) considered a similar system with an imposed gradient in external pressure on the flexible segment (which ensures that the flat wall is always a steady state of the system); this results in a rather different static structure to those reported with constant external pressure, where non-trivial static modes emerge via a transcritical bifurcation in the inviscid limit at particular values of the pre-stress parameter. Self-excited oscillations then arise as a resonance between two modes, which can be explored in the limit of large downstream channel length (Xu et al. Reference Xu, Billingham and Jensen2014), where the oscillations eventually grow to exhibit vigorous ‘slamming’ oscillations (Xu & Jensen Reference Xu and Jensen2015).
This study focuses on the planar channel analogue of the Starling resistor, but instead models the elastic wall as a plane-strained nonlinear beam that is materially linear but geometrically nonlinear (Gere Reference Gere2003); this beam has resistance to both bending and stretching. This model was first introduced by Cai & Luo (Reference Cai and Luo2003) and has subsequently been explored in depth by Luo and coworkers, examining flow driven by either prescribed upstream flux (Luo et al. Reference Luo, Cai, Li and Pedley2008; Hao et al. Reference Hao, Cai, Roper and Luo2016) or prescribed upstream pressure (Liu, Luo & Cai Reference Liu, Luo and Cai2012; Hao et al. Reference Hao, Cai, Roper and Luo2016). In this study we focus on the flow driven system, where it has been shown that the system admits multiple families of self-excited oscillations in a novel cascade structure: the system has isolated regions of stability between unstable regions which each correspond to a different number of extrema in the wall profile (Luo et al. Reference Luo, Cai, Li and Pedley2008). Their neutral stability curve, plotted in the parameter space spanned by the Reynolds number and the dimensionless resistance to beam stretching ( $c_\lambda$), is plotted in figure 5 below. In this paper we revisit the model of Luo et al. (Reference Luo, Cai, Li and Pedley2008), making a small correction to the constitutive law for the beam to ensure that it is energetically conservative. We explore the structure of the underling static solutions and show that this is analogous to those described above, with regions of parameter space which exhibit three co-existing steady states. We examine the stability of these static states using fully nonlinear simulations, predicting an additional mode of oscillation not noted by Luo et al. (Reference Luo, Cai, Li and Pedley2008), arising as an instability of the upper branch of static solutions (analogous to upper branch instability recently reported by Herrada et al. Reference Herrada, Blanco-Trejo, Eggers and Stewart2021). We investigate the saturated limit cycles of this oscillatory mode and its subsequent interaction with the other static solutions.
Analysing the energy budget of the flow has proved to be a useful tool for probing the mechanism of self-excited oscillations, particularly for oscillations driven by a prescribed upstream pressure (Jensen & Heil Reference Jensen and Heil2003; Stewart et al. Reference Stewart, Waters and Jensen2009, Reference Stewart, Heil, Waters and Jensen2010). The approach is similar to the classical derivation of the Reynolds–Orr equation (Schmid & Henningson Reference Schmid and Henningson2001), where we take the scalar product between the fluid momentum equations and the corresponding fluid velocity and integrate over the channel area to construct a rate of energy balance; for incompressible flow the terms appearing in this energy rate equation can be written in the form
 \begin{equation} {\mathcal{K}} + {\mathcal{E}} = {\mathcal{F}} + {\mathcal{P}} - {\mathcal{D}}, \end{equation}
where  ${\mathcal {K}}$ is the rate of change of kinetic energy, ${\mathcal {E}}$ is the rate at which fluid does work on the flexible wall, ${\mathcal {F}}$ is the net rate of energy extraction from the mean flow, ${\mathcal {P}}$ is the rate of working of the upstream driving pressure and ${\mathcal {D}}$ is the rate of working of viscous dissipation. The overall energy change arising from each term can be obtained by taking the time average over a period of fully developed oscillation; throughout this paper we denote this integral with the superscript $^{(avg)}$. For a conservative wall model (where no work is done on the wall, so ${\mathcal {E}}^{(avg)}=0$), the time-averaged energy budget can be expressed as the sum of two sources, the time-averaged work done by the upstream driving pressure ( ${\mathcal {P}}^{(avg)}$) and the time-averaged energy flux extracted from the mean flow ( ${\mathcal {F}}^{(avg)}$), balanced by the energy consumed by the time-averaged working of viscous dissipation ( ${\mathcal {D}}^{(avg)}$), so that
 \begin{equation} {\mathcal{F}}^{(avg)}+{\mathcal{P}}^{(avg)} = {\mathcal{D}}^{(avg)}. \end{equation}
The net energy flux  ${\mathcal {F}}^{(avg)}$ is extremely important for some flows driven by upstream pressure. For example, for ‘sloshing’ oscillations, found in both flexible-walled channels (Jensen & Heil Reference Jensen and Heil2003; Stewart et al. Reference Stewart, Waters and Jensen2009, Reference Stewart, Heil, Waters and Jensen2010) and collapsible tubes (Whittaker et al. Reference Whittaker, Heil, Jensen and Waters2010), it has been shown that, in in the limit of large wall pre-stress, the time-averaged dissipation can be decomposed into the sum of two components, the energy lost due to dissipation in the mean flow (denoted ${\mathcal {D}}^{(avg)}_P$) and the energy lost due to dissipation in the oscillation (denoted ${\mathcal {D}}^{(avg)}_S$). It emerges that exactly two thirds of the energy flux is consumed by dissipative effects in the oscillation ( ${\mathcal {D}}_S^{(avg)}= \tfrac {2}{3}{\mathcal {F}}^{(avg)}$), while the remaining one third increases the mean flow. However, there is evidence to suggest that ${\mathcal {F}}^{(avg)}$ may become negative for lower pre-stress (Stewart et al. Reference Stewart, Heil, Waters and Jensen2010), indicating a different mechanism entirely. In this study we explore the mechanism of energy transfer in flux-driven oscillations and show that ${\mathcal {F}}^{(avg)}$ plays no role in the mechanism of instability.
In this paper we revisit the nonlinear fluid-beam model presented by Luo et al. (Reference Luo, Cai, Li and Pedley2008), reformulating the nonlinear governing equations to derive the full nonlinear energy budget for oscillatory limit cycles (§ 2), adjusting the Kirchhoff constitutive law for the beam to ensure the elastic wall is energetically conservative. In § 3 we examine the behaviour of our new fluid-beam model along two slices of the parameter space (shown in figure 5), characterising both the steady (§ 3.1) and unsteady (§ 3.2) behaviour of the system and provide an overview of the parameter space for fixed external pressure (§ 3.3). In particular, we elucidate an instability of the upper branch of static solutions (§ 3.4) which is similar to that found by Herrada et al. (Reference Herrada, Blanco-Trejo, Eggers and Stewart2021), explore the nonlinear bifurcation structure of the system (§ 3.5), the resulting interaction between the oscillatory limit cycles and the folding point associated with the upper branch of static solutions (§ 3.6) and the energy budget of self-excited oscillations (§ 3.7). Finally, in § 4 we compare the predictions of our new Kirchhoff law with the previous law used by Luo et al. (Reference Luo, Cai, Li and Pedley2008), showing that the change makes very little difference to the predictions.
2. The model
We consider a planar rigid channel of finite length  $L_0$ and uniform width $D$ containing a viscous fluid. An internal segment of length $L$ of one wall is replaced by a planar elastic beam in a state of plane strain. The corresponding lengths of the upstream and downstream rigid segments are denoted $L_u$ and $L_d$, respectively, so $L_0=L_u+L+L_d$. This elastic beam is initially of uniform thickness $h$, which we assume to be much less than the channel width ( $h \ll D$). We denote the two-dimensional fluid domain by $\varOmega$ and use $\partial \varOmega _u$, $\partial \varOmega _d$, $\partial \varOmega _b$ to denote the upstream fluid inlet, the downstream fluid outlet and the elastic beam, respectively. This set-up is similar to the system introduced by Pedley (Reference Pedley1992) and has been analysed extensively by Cai & Luo (Reference Cai and Luo2003) and Luo et al. (Reference Luo, Cai, Li and Pedley2008).
We consider a parabolic inlet flow to the channel with flux  $Q$ (per unit width in the out-of-plane direction) with average velocity $Q/D$. We choose the outlet pressure along $\partial \varOmega _d$ to be zero, our pressure to which all other pressures and stresses are compared. The fluid is assumed to be Newtonian and incompressible with constant density $\rho$ and viscosity $\mu$. The elastic beam is subject to a uniform external pressure, denoted $p_e$.
We establish two coordinate systems to describe the motion, as shown in figure 1. Firstly,  ${\boldsymbol{g}}_1, {\boldsymbol{g}}_2, {\boldsymbol{g}}_3$ are the unit vectors of the Cartesian coordinate system in the (undeformed) reference configuration, such that ${\boldsymbol{g}}_1$ is oriented along the entirely rigid wall, ${\boldsymbol{g}}_2$ is normal to ${\boldsymbol{g}}_1$ in the plane of the channel (pointing into the channel) and ${\boldsymbol{g}}_3$ is in the out-of-plane direction. Conversely, ${\boldsymbol{e}}_1, {\boldsymbol{e}}_2, {\boldsymbol{e}}_3$ are unit vectors of the material coordinates in the (deformed) current configuration of the beam, where ${\boldsymbol{e}}_1$ is the local tangent to the beam, ${\boldsymbol{e}}_2$ is the local normal to the beam (pointing out of the channel) and ${\boldsymbol{e}}_3$ is normal to the plane of the channel ( ${\boldsymbol{g}}_3={\boldsymbol{e}}_3$). In what follows, we ignore deflections in the out-of-plane direction and so consider all vectors as two-dimensional.
Schematic of the fluid-beam model.

In the absence of fluid loading we assume the elastic beam is flat and parallel to the entirely rigid wall. Following Liu et al. (Reference Liu, Luo and Cai2012), we consider a massless elastic beam and denote the axial pre-stress along the beam as  $T$. Further, we denote $EA$ and $EJ$ as the extensional stiffness and bending stiffness of the beam, respectively, where $E$ is the Young's modulus of the material while $A$ and $J$ are the cross-sectional area and the second moment of inertia of the cross-sectional area of the beam with respect to the ${\boldsymbol{g}}_1$ axis, respectively.
We denote an arbitrary point on the (flat) beam in the reference configuration as
 \begin{equation} {\boldsymbol{X}}_b(l)=l{\boldsymbol{g}}_1+D{\boldsymbol{g}}_2, \quad (0 \le l \le L). \end{equation}
After deformation this point moves to,
 \begin{equation} {\boldsymbol{x}}_b(l,t)=x_b(l,t){\boldsymbol{g}}_1+y_b(l,t){\boldsymbol{g}}_2, \quad (0\le l \le L), \end{equation}
where we use the subscript  $b$ to denote points on the beam. The principal stretch of the beam is then
 \begin{equation} \lambda=\left[{\left(\frac{\partial x_b}{\partial l}\right)^{2} +\left(\frac{\partial y_b}{\partial l}\right)^{2}}\right]^{1/2}, \quad (0\le l\le L). \end{equation}
We denote  $\theta$ as the angle between the tangent to the deformed beam ${\boldsymbol{e}}_1$ and the unit vector ${\boldsymbol{g}_1}$ (see figure 1), hence we have
 \begin{equation} \frac{\partial x_b}{\partial l}=\lambda\cos\theta,\quad\frac{\partial y_b}{\partial l}=\lambda\sin\theta. \end{equation}
The arc-length coordinate, denoted  $s$, is measured along the beam from the upstream intersection with the rigid wall, computed as
 \begin{equation} s(l,t)=\int_0^{l}\lambda(l',t)\,\textrm{d}l', \quad (0\le l\le L). \end{equation}
The total length of the deformed beam is therefore  $S=s(L,t)$.
2.1. Governing equations
We introduce dimensionless variables by scaling all lengths on the channel width  $D$, velocities on the mean inlet flow $Q/D$, time on $D^{2}/Q$ and pressures on the inertial pressure scale $\rho Q^{2}/D^{2}$ (where the fluid outlet pressure is set to zero without loss of generality). Under the scaling we obtain four dimensionless parameters associated with the geometry of the channel in the form
 \begin{equation} \tilde L_u=\frac{L_u}{D}, \quad \tilde L_d=\frac{L_d}{D}, \quad \tilde L=\frac{L}{D}, \quad \tilde h=\frac{h}{D}, \end{equation}
the dimensionless lengths of the upstream, downstream and collapsible segments of the channel and the dimensionless beam thickness, respectively. We also obtain three dimensionless parameters associated with the elasticity of the beam, in the form
 \begin{equation} \tilde c_\lambda=\frac{(EA)D}{\rho Q^{2} }, \quad \tilde c_\kappa=\frac{EJ}{\rho Q^{2} D}, \quad \tilde T=\frac{TD}{\rho Q^{2}}, \end{equation}
the dimensionless extensional and bending stiffnesses and the dimensionless beam pre-tension, respectively. Finally, the flow is also governed by the Reynolds number and the dimensionless external pressure, which take the form
 \begin{equation} \widetilde{Re}=\frac{Q\rho}{\mu}, \quad \tilde{p}_e=\frac{p_e D^{2}}{\rho Q^{2}}. \end{equation}
We henceforth focus on the dimensionless quantities and drop the tildes for simplicity.
The governing equations for the (two-dimensional) fluid velocity  ${\boldsymbol{u}}({\boldsymbol{x}},t)$ and pressure $p({\boldsymbol{x}},t)$ follow from the incompressible Navier–Stokes equations in the form,
 \begin{equation} \boldsymbol{\nabla} \boldsymbol{\cdot} {\boldsymbol{u}}=0,\quad\frac{\partial{\boldsymbol{u}}}{\partial t} +({\boldsymbol{u}}\boldsymbol{\cdot} \boldsymbol{\nabla} ){\boldsymbol{u}}= \boldsymbol{\nabla} \boldsymbol{\cdot} {\boldsymbol{\sigma}}, \quad ({\boldsymbol{x}}\in\varOmega).\end{equation}
For the Newtonian fluid we have
 \begin{equation} {\boldsymbol{\sigma}}={-}p{\boldsymbol{I}}+Re^{{-}1} \left(\boldsymbol{\nabla} {\boldsymbol{u}}+{\boldsymbol{\nabla} {\boldsymbol{u}}}^\textrm{{T}}\right), \quad ({\boldsymbol{x}}\in\varOmega),\end{equation}
where  ${\boldsymbol{I}}$ is the identity matrix and the superscript $^\textrm {{T}}$ represents the matrix transpose.
To establish governing equations for the massless beam we consider a virtual displacement of a differential element and impose conservation of linear and angular momentum, following the derivation of Cai & Luo (Reference Cai and Luo2003). We denote the internal force acting on a cross-section of the beam as  ${\boldsymbol{F}}=F_1{\boldsymbol{e}_1}+F_2{\boldsymbol{e}_2}$ and the external force acting on the beam as ${\boldsymbol{q}} ={\sigma }_1{\boldsymbol{e}}_1+({\sigma }_2-p_e){\boldsymbol{e}}_2$, where ${\sigma _1}$ and ${\sigma _2}$ are the tangent and normal components of the fluid traction on the beam,
 \begin{equation} \sigma_1=(-{\boldsymbol\sigma}{\boldsymbol{e}_2})\boldsymbol{\cdot} {\boldsymbol{e}_1},\quad\sigma_2=(-{\boldsymbol\sigma}{\boldsymbol{e}_2})\boldsymbol{\cdot} {\boldsymbol{e}_2}. \end{equation}
Denoting  $\partial f$ as a virtual displacement of the variable $f$, conservation of linear momentum takes the form
 \begin{equation} {\partial }{\boldsymbol{F}}+{\boldsymbol{q}}{\partial }s={\boldsymbol{0}}, \quad ({\boldsymbol{x}}\in\partial\varOmega_b).\end{equation}
Similarly, denoting  ${\boldsymbol{M}}=M{\boldsymbol{e}_3}$ as the moment acting on the beam, conservation of angular momentum for the beam element takes the form
 \begin{equation} {\partial }{\boldsymbol{M}}+{\boldsymbol{x}}_b\times{\boldsymbol{q}} \partial s+({\boldsymbol{x}}_b+\partial {\boldsymbol{x}}_b) \times({\boldsymbol{F}}+\partial {\boldsymbol{F}})-{\boldsymbol{x}}_b\times{\boldsymbol{F}}={\boldsymbol{0}}, \quad ({\boldsymbol{x}}\in\partial\varOmega_b).\end{equation}
The commonly used linear constitutive laws for elastic beams (Gere Reference Gere2003), which were adopted in the previous fluid-beam model (Cai & Luo Reference Cai and Luo2003), take the form
 \begin{equation} F_1=T+c_{\lambda}(\lambda-1),\quad M=c_{\kappa}\kappa,\end{equation}
where  $\kappa$ is the dimensionless curvature of the beam defined as
 \begin{equation} \kappa=\frac{\partial\theta}{\partial s}.\end{equation}
However, to ensure that our approach is suitable to describe large deformations we instead formulate these constitutive laws with respect to the reference configuration of the beam (parameterised by  $l$) and we replace (2.14a,b) with a modified form
 \begin{equation} F_1=T+c_{\lambda}(\lambda-1),\quad M=c_{\kappa} \frac{\partial\theta}{\partial l}, \end{equation}
where we can also prove the identity (Wang Reference Wang2019)
 \begin{equation} \frac{\partial\theta}{\partial l}=\lambda\kappa.\end{equation}
These new expressions (2.16a,b) reduce to (2.14a,b) in the limit of small displacements. The advantages of introducing these constitutive laws will become clearer below. Using either of these two constitutive laws, we can eliminate the unknown  $F_2$ between the (2.12) and (2.13) and end up with a closed system.
The dimensionless governing equations for the beam can be written as
 \begin{gather} c_{\kappa}\kappa\frac{\partial (\lambda\kappa)}{\partial l}+ c_{\lambda}\frac{\partial \lambda}{\partial l}+\lambda{\sigma_1}=0, \end{gather}
 \begin{gather}-c_{\kappa}\frac{\partial }{\partial l}\left(\frac{1}{\lambda} \frac{\partial(\lambda\kappa)}{\partial l}\right) +c_{\lambda}\lambda\kappa(\lambda-1)+\lambda\kappa T +\lambda{\sigma_2}-\lambda p_e=0. \end{gather}
 For flow boundary conditions along the channel inlet ( $\partial \varOmega _u$) we prescribe a parabolic inlet flow with unit flux in the form ${\boldsymbol{u}}=6y(1-y){\boldsymbol{g}}_1$. Along the channel outlet we impose a stress free condition in the form ${\boldsymbol {\sigma }}{\boldsymbol{g}}_2={\boldsymbol{0}}$. Note that this is not formally identical to imposing zero pressure along the outlet, but we assume that the downstream rigid segment is sufficiently long so that the outflow is approximately parallel and the normal viscous stress terms are negligible (a similar approach was used by Jensen & Heil Reference Jensen and Heil2003). We assume the no-slip condition along the rigid walls as well as continuity of velocity between the elastic beam and the fluid in the form
 \begin{gather} {\boldsymbol{u}}={\boldsymbol{0}}, \quad (y=0;\ y=1, -L_u\leq x\leq 0, L\leq x\leq L+L_d), \end{gather}
 \begin{gather}{\boldsymbol{u}}={\boldsymbol{u}_{b}},\quad ({\boldsymbol{x}}\in\partial\varOmega_b). \end{gather}
The two ends of the elastic beam are attached to the rigid wall at a fixed angle, in the form
 \begin{equation} x_b(0,t)=0,\quad y_b(0,t)=1, \quad x_b(L,t)=L,\quad y_b(L,t)=1,\quad \theta(0,t)=\theta(L,t)=0.\end{equation}
2.2. Fully nonlinear energy budget
A useful tool for analysing the mechanism of instability in collapsible channel flows is to formulate the energy budget of the system (e.g. Jensen & Heil Reference Jensen and Heil2003; Stewart et al. Reference Stewart, Waters and Jensen2009, Reference Stewart, Heil, Waters and Jensen2010). Here, we perform the energy budget analysis for our updated fluid-beam model. To formulate the energy equation we begin with the fluid and consider the dot product of the fluid velocity with the fluid momentum equations (2.9a,b). As the fluid is incompressible, we manipulate and integrate this energy equation over the fluid domain  $\varOmega$ to obtain the total energy budget of the system in the form
 \begin{align} &\int_{\varOmega}\frac{1}{2}\frac{\partial({\boldsymbol{u}}\boldsymbol{\cdot} {\boldsymbol{u}})}{\partial t}\,{ \rm d}A+\int_{\varOmega}\frac{1}{2} \boldsymbol{\nabla} \boldsymbol{\cdot} (({\boldsymbol{u}}\boldsymbol{\cdot} {\boldsymbol{u}}) {\boldsymbol{u}})\,\textrm{d}A \nonumber\\ &\quad =\int_{\varOmega}\boldsymbol{\nabla} \boldsymbol{\cdot} ({-}p{\boldsymbol{u}})\,\textrm{d}A+\int_{\varOmega}\frac{1}{Re}[\boldsymbol{\nabla} \boldsymbol{\cdot} ((\boldsymbol{\nabla} {\boldsymbol{u}}+\boldsymbol{\nabla} {\boldsymbol{u}}^{\text{T}}){\boldsymbol{u}})-Tr ((\boldsymbol{\nabla} {\boldsymbol{u}}+\boldsymbol{\nabla} {\boldsymbol{u}}^{\text{T}})\boldsymbol{\nabla} {\boldsymbol{u}})]\,\textrm{d}A. \end{align}
By the Reynolds transport theorem and the divergence theorem, this energy budget can be rearranged as (see Wang (Reference Wang2019) for details)
 \begin{align} &\frac{\partial}{\partial t}\int_{\varOmega}\frac{1}{2} {\boldsymbol{u}}\boldsymbol{\cdot} {\boldsymbol{u}}\,\textrm{d}A+ \left[\int_0^{1}\frac{1}{2}({\boldsymbol{u}}\boldsymbol{\cdot} {\boldsymbol{u}}) ({\boldsymbol{u}}\boldsymbol{\cdot} {\boldsymbol{g}_1})\,\textrm{d} y\right]_{x={-}L_u}^{x=L+L_d} \nonumber\\ &\quad =\left[\int_0^{1}-p{\boldsymbol{u}}\boldsymbol{\cdot} {\boldsymbol{g}_1}\,\textrm{d} y\right]^{x=L+L_d}_{x={-}L_u} -\frac{1}{Re}\int_{\varOmega}Tr ((\boldsymbol{\nabla} {\boldsymbol{u}}+ \boldsymbol{\nabla} {\boldsymbol{u}}^{\text{T}})\boldsymbol{\nabla} {\boldsymbol{u}})\,\textrm{d}A \nonumber\\ &\qquad +\int_{\partial\varOmega_b} \left\{{-}p+\frac{1}{Re} \left(\boldsymbol{\nabla} {\boldsymbol{u}}+\boldsymbol{\nabla} {\boldsymbol{u}}^{\text{T}}\right)\right\}{\boldsymbol{u}}\boldsymbol{\cdot} {\boldsymbol{e}}_{2}\, \textrm{d}s, \end{align}
where the final term involves the surface integral of the fluid stress along the deformed beam, parametrised by  $s$. Applying the definition of the fluid stress tensor (2.10) to the integral evaluated on the elastic beam, we write the total energy budget of the system as
 \begin{equation} {\mathcal{P}}+{\mathcal{F}}-{\mathcal{D}}={\mathcal{K}}+{\mathcal{E}},\end{equation}
where
 \begin{gather} {\mathcal{P}}={-}\left[\int_0^{1}p{\boldsymbol{u}}\boldsymbol{\cdot} {\boldsymbol{g}_1}\,\textrm{d} y\right]^{x=L+L_d}_{x={-}L_u}, \end{gather}
 \begin{gather}{\mathcal{F}}={-}\left[\int_0^{1}\frac{1}{2}({\boldsymbol{u}}\boldsymbol{\cdot} {\boldsymbol{u}}) ({\boldsymbol{u}}\boldsymbol{\cdot} {\boldsymbol{g}_1})\,\textrm{d} y\right]_{x={-}L_u}^{x=L+L_d}, \end{gather}
 \begin{gather}{\mathcal{K}}=\frac{\partial}{\partial t}\int_{\varOmega} \frac{1}{2}{\boldsymbol{u}}\boldsymbol{\cdot} {\boldsymbol{u}}\,\textrm{d}A, \end{gather}
 \begin{gather}{\mathcal{E}}={-}\int_{\partial\varOmega_b}({\boldsymbol\sigma}{\boldsymbol{e}_2})\boldsymbol{\cdot} {\boldsymbol{u}}\,\textrm{d}s, \end{gather}
 \begin{gather}{\mathcal{D}}=\frac{1}{Re}\int_{\varOmega}Tr ((\boldsymbol{\nabla} {\boldsymbol{u}}+ \boldsymbol{\nabla} {\boldsymbol{u}}^{\text{T}})\boldsymbol{\nabla} {\boldsymbol{u}})\,\textrm{d}A. \end{gather}
Here,  ${\mathcal {P}}$ is the rate of working of pressure at the channel inlet (since $p$ is set to zero along the channel outlet), ${\mathcal {F}}$ is the net kinetic energy flux extracted from the mean flow between the channel ends, ${\mathcal {K}}$ is the rate of working of kinetic energy, ${\mathcal {E}}$ is the rate of working of fluid stress on the beam and ${\mathcal {D}}$ is the rate of dissipative energy loss due to fluid viscosity. This dissipation of energy is non-negative, since ${\mathcal {D}}$ can be alternatively expressed in terms of the velocity components ${\boldsymbol{u}}=u_1{\boldsymbol{g}_1}+u_2{\boldsymbol{g}_2}$ as
 \begin{equation} {\mathcal{D}}=\frac{1}{Re}\int_{\varOmega}\left[2\left(\frac{\partial u_1}{\partial x} \right)^{2}+2\left(\frac{\partial u_2}{\partial y}\right)^{2}+ \left(\frac{\partial u_1}{\partial y}+\frac{\partial u_2}{\partial x} \right)^{2}\right]\,\textrm{d}A.\end{equation}
Note that this formulation represents an improvement on the energy budget presented by Stewart et al. (Reference Stewart, Heil, Waters and Jensen2010), since the dissipation term they derived included part of the work done by viscous stresses on the wall and so could take either sign depending on the parameters.
To fully evaluate the work done by the fluid on the wall ( ${\mathcal {E}}$) we substitute the beam equations (2.18), (2.19), the identity (2.17) and boundary conditions (2.20)–(2.22a–e) into (2.29) to obtain
 \begin{equation} {\mathcal{E}}={\mathcal{U}}_{\kappa}+{\mathcal{U}}_{\lambda}-{\mathcal{P}}_e,\end{equation}
where,
 \begin{gather} {\mathcal{U}}_\kappa=\frac{\partial}{\partial t}\int_0^{L}\frac{1}{2}c_\kappa(\lambda\kappa)^{2}\,\textrm{d}l, \end{gather}
 \begin{gather}{\mathcal{U}}_\lambda=\frac{\partial}{\partial t}\int_0^{L}\left[T(\lambda-1)+\frac{1}{2}c_\lambda(\lambda-1)^{2}\right]\,\textrm{d}l, \end{gather}
 \begin{gather}{\mathcal{P}}_e=\int_0^{L}-p_e({\boldsymbol{u}_b}\boldsymbol{\cdot} {\boldsymbol{e}_2})\lambda\,\textrm{d}l=\frac{\partial}{\partial t} \int_0^{L}-p_e\frac{\partial x_b}{\partial l}y_b\,\textrm{d}l. \end{gather}
Here,  ${\mathcal {U}}_{\kappa }$ is the rate of working of bending stresses, ${\mathcal {U}}_{\lambda }$ is the rate of working of extensional stresses and ${\mathcal {P}}_e$ is the rate of working of external pressure. Note that the rate of working of external pressure ${\mathcal {P}}_e$ has been manipulated using the boundary condition (2.22a–e); for details see Appendix A.
Using the fluid-beam model proposed by Cai & Luo (Reference Cai and Luo2003) with constitutive law (2.14a,b), Liu et al. (Reference Liu, Luo and Cai2012) established a similar energy budget, but in this case the rate of working of bending stresses ( ${\mathcal {U}}_{\kappa }$) could not be written as a complete time derivative and so their system is not energetically conservative when averaged over a period of self-excited oscillation. On the other hand, applying the nonlinear constitutive law (2.16a,b) for the beam makes the system energetically conservative. This difference will also result in minor changes to the other energy terms in (2.32).
We now summarise the fully nonlinear energy budget for the coupled fluid-beam system in the form
 \begin{equation} {\mathcal{P}}+{\mathcal{F}}+{\mathcal{P}}_e={\mathcal{K}}+{\mathcal{D}}+{\mathcal{U}}_{\kappa}+{\mathcal{U}}_{\lambda}, \end{equation}
where the left-hand side represents the sources of energy into the system and the right-hand side represents the losses of energy.
2.3. Energetics of steady flow
In the steady state, in which all variables are independent of time, we denote the flow velocity and pressure as  ${\boldsymbol{u}}^{(0)}$ and $p^{(0)}$, respectively. In this case the terms ${\mathcal {P}}_e$, ${\mathcal {K}}$, ${\mathcal {U}}_{\kappa }$ and ${\mathcal {U}}_{\lambda }$ all vanish. Therefore, the energy budget for the steady system can be expressed simply as,
 \begin{equation} {\mathcal{P}}^{(0)}+{\mathcal{F}}^{(0)}={\mathcal{D}}^{(0)},\end{equation}
with
 \begin{gather} {\mathcal{F}}^{(0)}={-}\left[\int_0^{1}\left(\tfrac{1}{2}({\boldsymbol{u}}^{(0)}\boldsymbol{\cdot} {\boldsymbol{u}}^{(0)})({\boldsymbol{u}}^{(0)}\boldsymbol{\cdot} {\boldsymbol{g}}_1)\right)\,\textrm{d} y\right]_{x={-}L_u}^{x=L+L_d}, \end{gather}
 \begin{gather}{\mathcal{P}}^{(0)}={-}\left[\int_0^{1}(p^{(0)}{\boldsymbol{u}}^{(0)}\boldsymbol{\cdot} {\boldsymbol{g}}_1) \,\textrm{d} y\right]^{x=L+L_d}_{x={-}L_u}, \end{gather}
 \begin{gather}{\mathcal{D}}^{(0)}=\frac{1}{Re}\int_{\varOmega^{(0)}}Tr ((\boldsymbol{\nabla} {\boldsymbol{u}}^{(0)}+(\boldsymbol{\nabla} {\boldsymbol{u}}^{(0)})^{\text{T}})\boldsymbol{\nabla} {\boldsymbol{u}}^{(0)})\,\textrm{d}A, \end{gather}
where  $\varOmega ^{(0)}$ denotes the fluid domain in the steady state.
2.4. Energetics of fully developed oscillations
For an unsteady oscillation which has saturated into a nonlinear (finite-amplitude) limit cycle (see § 3.2) we average over a period of oscillation. For example for quantity  $f(t)$, we compute the time average as
 \begin{equation} f^{(avg)}=\frac{1}{\tau}\int_t^{t+\tau}f(t')\,\textrm{d}t', \end{equation}
where  $\tau$ is the period of oscillation. In this case, the rate of working of external pressure, ${\mathcal {P}}_e^{(avg)}$, the average rate of working of fluid kinetic energy, ${\mathcal {K}}^{(avg)}$, and the average of the rate of working of bending and extensional stiffness, ${\mathcal {U}}_{\kappa }^{(avg)}$ and ${\mathcal {U}}_{\lambda }^{(avg)}$, all vanish. Therefore, the energy budget of the unsteady system (2.36) averaged over one period of oscillation becomes simply
 \begin{equation} {\mathcal{P}}^{(avg)}+{\mathcal{F}}^{(avg)}={\mathcal{D}}^{(avg)}, \end{equation}
where  ${\mathcal {P}}^{(avg)}$ denotes the average rate of working of the upstream pressure over a period, ${\mathcal {F}}^{(avg)}$ is the average of the kinetic energy flux extracted from the mean flow over a period and ${\mathcal {D}}^{(avg)}$ denotes the average rate of energy loss due to viscosity over a period.
In analysing self-excited oscillations, it is useful to consider the excess energy due to oscillation by subtracting the corresponding steady components in the form
 \begin{equation} {\mathcal{P}}^{(e)}={\mathcal{P}}^{(avg)}-{\mathcal{P}}^{(0)},\quad {\mathcal{F}}^{(e)}={\mathcal{F}}^{(avg)}-{\mathcal{F}}^{(0)},\quad {\mathcal{D}}^{(e)}={\mathcal{D}}^{(avg)}-{\mathcal{D}}^{(0)}. \end{equation}
These energy terms are all computed in § 3.7 below.
2.5. The finite element method
A finite element method is used to solve the coupled beam-fluid system and construct the corresponding energy budget. We divide the fluid domain into three sections, denoted as A, B and C for the upstream, compliant and downstream compartments, respectively, as described in Luo & Pedley (Reference Luo and Pedley1996) (see also Luo et al. Reference Luo, Cai, Li and Pedley2008). We use an adaptive mesh in section B (where the beam is deformable), while we use a fixed mesh for sections A and C. The flow is described using an Eulerian description for sections A and C, whereas the flow is described using an arbitrary Lagrangian–Eulerian method for section B (Donea, Giuliani & Halleux Reference Donea, Giuliani and Halleux1982).
Across the elastic segment (section B) we employ rotating spines following Cai & Luo (Reference Cai and Luo2003), where we seed nodes along the rigid wall and connect these to nodes on the beam by spines; nodes are then seeded along these spines covering the entirety of region B. Each spine can rotate around its fixed node on the rigid wall, while all the nodes along each spine can move with this spine as the elastic beam is deformed. This allows the mesh to adapt during deformation of the beam.
The Pertrov–Galerkin weighted residual method is used to discretise the system governing equations (2.9a,b), (2.18), (2.19), (2.4a,b) and (2.17). We use 6-node triangular elements with second-order shape functions for the fluid velocity components  $u_1$ and $u_2$, and linear shape functions for the fluid pressure $p$. The beam variables $x_b,y_b,\theta ,\lambda$ and $\kappa$ are all discretised using second-order shape functions evaluated on 3-node beam elements (Huyakorn et al. Reference Huyakorn, Taylor, Lee and Gresho1978). The weighted residuals method is used to discretise the system to determine the nodal values of all variables, where we obtain the discretised matrix equation in the form
 \begin{equation} {\boldsymbol{M}}\frac{\textrm{d}{\boldsymbol{\varTheta}}}{\textrm{d}t} +{\boldsymbol{K}}({\boldsymbol{\varTheta}})-{\boldsymbol{F}}= {\boldsymbol{R}}\approx{\boldsymbol{0}},\end{equation}
where  ${\boldsymbol{\varTheta} }=(u_{xi},p_{i},u_{yi},x_{bi},y_{bi},\theta _{i},\lambda _i,\kappa _{i})^\textrm {{T}}$ is the global vector of unknowns with dimension $N=n_{total} \times 8$, $i=1,\ldots n_{total}$ is the $i$th nodal number of the total $n_{total}$ nodes and the number of degrees of freedom per node is 8; ${\boldsymbol{M}}$ and ${\boldsymbol{K}}$ are the $N \times N$ mass and stiffness matrices, ${\boldsymbol{F}}$ is the external force vector and ${\boldsymbol{R}}$ is the residual vector.
An implicit finite difference scheme is used for time integration of the discrete nonlinear matrix equation. At each timestep, a frontal method is used to assemble the global matrix equation and a Newton–Raphson iteration scheme is applied to solve the global matrix equation for  ${\boldsymbol{\varTheta} }$ (Luo & Pedley Reference Luo and Pedley1996; Hao et al. Reference Hao, Cai, Roper and Luo2016). The numerical method enables us to evaluate the terms in the fully nonlinear energy budget in (2.36) by post-processing. As in Luo et al. (Reference Luo, Cai, Li and Pedley2008), we use 36 657 second-order 6-node triangle elements for the fluid domain and 140 second-order 3-node elements for the beam. The convergence of the numerical method is demonstrated in Appendix B.
3. Results
Following Luo et al. (Reference Luo, Cai, Li and Pedley2008), throughout this study we fix the dimensionless parameters to be  $L_u=L=5$, $L_d=30$, $h=0.01$, $T=0$, $c_{\kappa }=(h^{2}/12)c_\lambda$ and $p_e=1.95$. In what follows, we focus mainly on a small parameter region with either $c_\lambda =500$ or $c_\lambda =1600$ and $190 < Re \leq 400$ (although we also briefly summarise the parameter space spanned by $c_\lambda$ and $Re$ for fixed $p_e$). For $c_\lambda =1600$, Luo et al. (Reference Luo, Cai, Li and Pedley2008) identified an unsteady mode-2 oscillation in this region using the linear constitutive fluid-beam model of the same geometrical configuration with critical Reynolds number $Re_l\approx 212.0$. We first focus on a slice through this parameter space for fixed $c_\lambda$, considering the steady (§ 3.1) and unsteady behaviour of the system (§ 3.2). We then provide an overview of the regions of instability in the parameter space spanned by the extensional stiffness and Reynolds number (§ 3.3), summarise the dynamics of oscillations which grow from the upper branch of static solutions (§ 3.4), elucidate the nonlinear bifurcation structure of the system (§ 3.5) and examine the possibility of homoclinic orbits (§ 3.6). Finally, we summarise the associated energy budget of fully developed oscillations (§ 3.7).
3.1. Steady solutions for  $c_{\lambda }=1600$

In order to assess the static behaviour of the system for fixed elastic properties of the beam, figure 2 summarises steady solutions of beam deflection with  $c_{\lambda }=1600$. In particular, we consider the maximal ( $y_{max}$) and minimal ( $y_{min}$) steady beam positions as a function of Reynolds number in figure 2(a), with a zoom in around the region with multiple steady solutions shown in figure 2(b). For low Reynolds numbers the steady beam is entirely inflated (hence $y_{min}=1$). As the Reynolds number increases the channel becomes increasingly constricted as the beam is drawn toward the rigid wall by the Bernoulli effect. For $Re\approx 201.5$ the steady beam shape becomes so-called mode-2, with two extrema, which are inflated at the upstream end and collapsed at the downstream end, i.e. $y_{min} < 1$. As the Reynolds number increases further the steady solution abruptly changes at $Re\approx 202.316$, transitioning to a much more collapsed configuration. This collapsed configuration persists as the Reynolds number decreases until a second transition at $Re\approx 201.834$, resulting in a narrow region of parameter space with more than one steady solution. In line with Stewart (Reference Stewart2017), we term the steady solution which persists to low Reynolds numbers as the upper branch solution (where the channel wall is inflated), and the solution which persists to large Reynolds numbers as the lower branch solution (where the channel wall is collapsed). These two transition points take the form of limit point bifurcations and are termed the upper and lower limit points, respectively. The upper and lower branches are connected by an intermediate branch. A three branch static structure has previously been reported for the collapsible channel system, both using a full two-dimensional model for the flow with a simplified wall model (Luo & Pedley Reference Luo and Pedley2000; Heil Reference Heil2004), as well as using a reduced one-dimensional model for the flow (Stewart Reference Stewart2010, Reference Stewart2017). Such three branch behaviour was also recently demonstrated by Herrada et al. (Reference Herrada, Blanco-Trejo, Eggers and Stewart2021) using a hyperelastic (neo-Hookean) wall of finite thickness. In summary, this figure demonstrates that the steady system exhibits at least one static solution across the parameter space, with a narrow region where it can exhibit three static configurations.
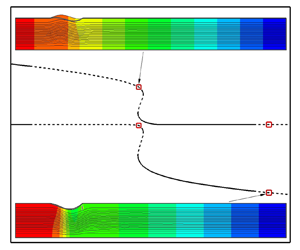
Static solutions of the model for  $c_{\lambda }=1600$ plotting: (a) the minimal ( $y_{min}$) and maximal ( $y_{max}$) channel widths as a function of Reynolds number, plotted with dot-dashed and solid lines, respectively, where the upper and lower static branches are labelled; (b) zoom-in of the region with multiple static solutions marked by a red square in panel (a); (c) the steady beam shape for operating points U7, I2 and L2.

To illustrate the behaviour of the system for  $c_\lambda =1600$ we select eight points on the upper branch of static solutions, which we term U1–U8, two points on the intermediate branch, which we term I1 and I2, and eight points on the lower branch of static solutions, which we term L1–L8. These points are labelled in figure 2 and their corresponding values of Reynolds number are listed in table 1 below.
Computed terms in the static, time-averaged and excess energy budgets, considering 8 operating points on the upper static branch (U1–U8), 2 points on the intermediate static branch (I1–I2) and 8 points on the lower static branch (L1–L8). Points with a dash do not exhibit an oscillatory limit cycle.

To assess these static configurations in detail, figure 2(c) illustrates the three possible steady beam shapes for  $Re=202.1$, $c_\lambda =1600$ (operating points U7, I2 and L2). On each branch of steady solutions the wall shape is so-called mode-2, bulged out near the upstream and collapsed at the downstream end of the channel. The upper branch is more inflated than the intermediate branch, which is itself more inflated than the lower branch. Similarly, the lower branch is more collapsed than the intermediate branch, which is in turn more collapsed than the upper branch.
We will analyse the stability and the energy budget of these branches in later sections. The region of parameter space with more than one static solution is shown in figure 5 below.
3.2. Unsteady solutions for $c_{\lambda }=1600$

In order to test the stability of the system to time-dependent perturbations, we apply a small increment to the steady solution to generate an initial condition for the computations (here, we use the steady solution along the same branch with a  $1\,\%$ increase in $c_{\lambda }$). As is conventional in hydrodynamic stability theory, the system is deemed stable if the unsteady solution converges to the corresponding steady solution following the perturbation, and unstable if the perturbation grows with time (Drazin Reference Drazin2002). The boundary between these two behaviours is termed neutrally stable. In plotting the unsteady behaviour of the system we generally illustrate only the fully developed limit cycle of the oscillations, truncating the period of transient growth from the initial condition. Exceptions to this are given in figures 4 and 10(b) below, where we show the full dynamics from the imposed initial condition.
In order to assess the stability of the upper and lower branches of the static solution (identified in figure 2), in figure 3 we plot time traces of the fluid pressure on the elastic wall at the mid-point of the beam ( $x=L/2$) for various values of the Reynolds number with $c_\lambda =1600$. We further illustrate various unsteady perturbation wall profiles over the period of fully developed oscillation by subtracting the corresponding steady wall profile, i.e. ${\textrm {d} y}=y_b-y_b^{(0)}$. For sufficiently low Reynolds numbers, the upper branch static solutions are stable (not shown). The steady configuration on the upper branch becomes unstable at $Re\approx 192.2$ (figure 3a), just outside the region with multiple static states. This oscillation grows in amplitude as the Reynolds number increases (figure 3b), becoming increasingly non-sinusoidal/irregular (figure 3c). Above the critical value of Reynolds number the oscillatory wall profile is mode-2 (two extrema across the compliant segment, shown below the corresponding time traces in figure 3a–c), although the beam profile is mode-3 as it moves through the static configuration (eg profile labelled 1 in figure 3a). Proceeding along the upper branch, the amplitude of oscillation reaches a maximum at $Re \approx 199.0$ (see profiles below) and then decreases again (figure 3d–f). The unstable branch eventually enters the region with multiple static solutions and approaches zero amplitude and re-stabilises as the steady branch becomes close to the upper branch limit point ( $Re\approx 202.316$). The wall profiles in this region are again mostly mode-2 (although some of the profiles are mode-3), shown below the corresponding time traces (figure 3d–f). We explore the interaction between the upper branch limit cycles and the upper branch limit point in § 3.6 below. Conversely, the lower branch of static solutions is stable to oscillations as it emerges from the lower limit point ( $Re\approx 201.834$). As the Reynolds number increases, the lower branch steady solution eventually becomes unstable at $Re\approx 212.65$, outside the region with multiple steady states; the oscillation profile increases in amplitude as the Reynolds number increases (figure 3h,i) and is again mostly mode-2 (see profiles below the corresponding time traces in figure 3g–i, although the wall profile can be mode-3 as it moves through the static configuration). In summary, this figure demonstrates that both the upper and lower static branches can become unstable to oscillations in the neighbourhood of (but just outside) the region of parameter space with multiple static solutions.
Dynamics of self-excited oscillations arising from the upper and lower static branches for  $c_{\lambda }=1600$, showing time traces of the wall mid-point pressure (upper plot for each panel) and the corresponding perturbation wall shape ${\textrm {d} y} = y_b-y_b^{(0)}$ at five selected time instances labelled 1–5 (lower plot in each panel) for operating points: (a) U1, $Re=192.21$; (b) U2, $Re=193$; (c) U3, $Re=195$; (d) U5, $Re=201.5$; (e) U7, $Re=202.1$; (f) U8, $Re=202.3$; (g) L5, $Re=212.71$; (h) L6, $Re=213$; (i) L8, $Re=216$.

In order to test the stability of the intermediate static branch (identified in figure 2), in figure 4(a) we plot time traces of the fluid pressure on the elastic wall at the mid-point of the beam ( $x=L/2$) initiated at operating point I2. Initially the mid-point pressure increases toward the upper static branch, where the corresponding beam profile gradually expands toward the upper branch static state (figure 4b). Since the upper branch of static solutions is unstable for these parameters (see figure 3), the system evolves toward the upper branch oscillatory limit cycle; five snapshots of the beam over an oscillation are shown in figure 4(c), analogous to the beam profiles identified for the upper branch limit cycle around operating point U2 (figure 3b). It emerges that, for this model, the intermediate branch is always unstable for all the parameters tested, consistent with earlier predictions in flow through flexible-walled channels (Stewart Reference Stewart2017; Herrada et al. Reference Herrada, Blanco-Trejo, Eggers and Stewart2021), with the profile evolving to the upper branch limit cycle.
Unsteady solutions at  $Re=202.1$, $c_{\lambda }=1600$ (operating points U7, I2 and L2) showing: (a) time trace of the wall mid-point pressure $p_{mid}$ initiated close to the intermediate static branch point I2; (b) five wall profiles as the system evolves from the intermediate static branch toward the upper branch static state, where the corresponding times are labelled in panel (a); (c) five wall profiles over a period of self-excited oscillation growing from the upper static branch, with the corresponding times labelled in the inset to panel (a). The dashed (dot-dashed) lines in (a) show the maximal (minimal) mid-point pressure from the upper branch limit cycle U7, while the blue dot-dashed line shows the time trace of the wall mid-point pressure $p_{mid}$ initiated close to the lower static branch point L2. The beam profile plotted with open squares (circles) in (b) shows the corresponding intermediate (upper) static configurations.

3.3. Overview of the parameter space
Following Luo et al. (Reference Luo, Cai, Li and Pedley2008), in figure 5 we present an overview of the stability of the system in the parameter space spanned by the Reynolds number ( $Re$) and extensional stiffness ( $c_\lambda$), where they showed that the space could be partitioned into a number of unstable tongues. These predictions were updated slightly by Hao et al. (Reference Hao, Cai, Roper and Luo2016) using a global stability eigensolver, and their neutral stability curve is shown as a solid black line in figure 5. The corresponding neutral stability points from the lower static branch computed using our numerical method are shown as filled black circles. These points agree well with the neutral stability curve of Hao et al. (Reference Hao, Cai, Roper and Luo2016), and the slight differences are attributed to the difference between the two constitutive laws (the critical Reynolds number is displaced by less than 1 % for all points tested). In general, the lower static branch becomes unstable as the Reynolds number increases (similar to Heil Reference Heil2004; Stewart Reference Stewart2017; Herrada et al. Reference Herrada, Blanco-Trejo, Eggers and Stewart2021). However, Luo et al. (Reference Luo, Cai, Li and Pedley2008) (see also Hao et al. Reference Hao, Cai, Roper and Luo2016) showed that this neutral stability curve is non-monotonic and for large $c_\lambda$ the system restabilises again as the Reynolds number becomes sufficiently large, although we did not investigate this regime.
An overview of the parameter space spanned by the Reynolds number and extensional stiffness, summarising the steady and unsteady solutions of the model. The limit points of the upper and lower static branches are plotted as red and black dot-dashed lines, respectively, and the region with multiple static solutions is shaded in light blue. The neutral stability curve initially identified by Luo et al. (Reference Luo, Cai, Li and Pedley2008) and refined by Hao et al. (Reference Hao, Cai, Roper and Luo2016) is plotted as a solid line (associated with the lower static branch). The computed neutral points from the current model are marked as filled black circles. The neutral stability curve associated with the upper static branch is estimated as the dotted line between the computed neutral points. The regions where the system is stable to self-excited oscillations are shaded in grey.

However, as noted in figure 3, the upper branch of static solutions can also become unstable to oscillations. The corresponding computed neutral stability points for the upper static branch are plotted in figure 5, revealing a new region of instability to the left of the region noted by Luo et al. (Reference Luo, Cai, Li and Pedley2008) and Hao et al. (Reference Hao, Cai, Roper and Luo2016).
To extend our understanding of this parameter space, in figure 5 we also highlight the region of parameter space with more than one static solution, by tracing the upper and lower branch limit points as a function of the Reynolds number and the extensional stiffness  $c_\lambda$ for all other parameters held fixed. It emerges that the region which admits multiple static solutions (shaded in figure 5) is very narrow. As $c_\lambda$ increases, the upper and lower limit points approach each other and, for $c_\lambda \gtrsim 3500$, the static solution becomes unique for all Reynolds numbers (not shown). Conversely, the width of the region with multiple static states expands slightly as $c_\lambda$ decreases, but is confined to $202.495\leq Re \leq 204.554$ for $c_\lambda =500$.
3.4. Self-excited oscillations of the upper branch of static solutions
The flow fields and pressure contours associated with oscillations of the lower branch of static solutions have been presented elsewhere (Heil Reference Heil2004; Luo et al. Reference Luo, Cai, Li and Pedley2008). Self-excited oscillations originating from the upper branch of static solutions are explored in more detail in figure 6, where we show time traces of the channel inlet pressure on the wall at  $y=1$ and the mid-point pressure on the flexible wall for $Re=199$ (figure 6a) as well as streamlines and pressure contours at four equally spaced times over a period of oscillation (figure 6b–e). When the mid-point pressure takes its minimal value, the flexible wall is entirely inflated but with two prominent outward bulges (figure 6b), located close to the upstream and downstream ends of the compliant segment, respectively. Each bulge is associated with a local increase in fluid pressure (with a region of lower pressure between). As time progresses the downstream bulge grows at the expense of the upstream bulge (figure 6c), translating upstream and leading to a small indentation at the downstream end of the beam, with an accompanying change in the fluid pressure profile (figure 6d). As the bulge propagates upstream the driving pressure must increase abruptly to maintain the prescribed flow (between the points marked (d) and (e) in figure 6a). However, the upstream bulge is eventually suppressed by interaction with the upstream rigid segment (figure 6e). As the upstream bulge diminishes the resulting downstream fluid motion drives a new bulge at the downstream end of the compliant segment and the process repeats. Hence, the $x$-position of the maximal channel width does not change smoothly over time (two local maxima interchange as the global maximum). The associated flow fields are very laminar with almost no cross-stream pressure gradient (figure 6b–e). In particular, there are no regions of flow separation or vorticity waves in the downstream rigid segment, which are typically associated with lower branch flow fields (see figure 9 below). A movie of the dynamics of these upper branch oscillations is provided in online supplementary material, available at https://doi.org/10.1017/jfm.2021.642. In summary, this figure shows that the upper branch instability involves upstream propagation of a bulge in the wall profile (which develops at the downstream end). However, this bulge does not propagate back downstream again over a period; instead it is washed out by interaction with flow through the upstream rigid segment and replaced by an entirely new bulge at the downstream end of the compliant segment.
Dynamics of self-excited oscillations from the upper static branch with  $Re=199$ for $c_{\lambda }=1600$, plotting (a) the temporal evolution of mid-point wall pressure (solid line) and the upstream driving pressure evaluated on the upper wall (dashed line); (b)–(e) streamlines and pressure contours of the flow at four equally spaced time instances over a period of oscillation, as labelled panel in (a).

3.5. Bifurcation structure of the dynamical system
To assess the relative growth of the oscillatory limit cycles, in figure 7 we employ the Reynolds number as a bifurcation parameter and plot the time-averaged mid-point pressure on the flexible wall for  $c_\lambda =1600$ (figure 7a) and $c_\lambda =500$ (figure 7b) alongside the corresponding static branches of the system (a different visualisation of figure 2). As the Reynolds number increases along the upper static branch we observe supercritical growth of the oscillation from the neutral stability point, where the time-averaged mid-point pressure is decreased compared with the corresponding static value (figure 7a,b). Proceeding along the upper branch, the oscillation amplitude approaches zero as the Reynolds number approaches the upper branch limit point (figure 7a,b); the dynamics of this interaction is explored in § 3.6 below.
Nonlinear bifurcation diagram plotted as a function of Reynolds number, showing the time-averaged mid-point wall pressure  $p_{mid}^{(avg)}$ (filled black circles) and the static mid-point pressure $p_{mid}$ as solid (stable) and dashed lines (unstable) for: (a) $c_\lambda =1600$ and (b) $c_\lambda =500$. The upper and lower branch limit points are shown as red open squares. The insets show close-ups around the upper and lower limit points.

Almost identical behaviour was found for  $c_\lambda =500$ (figure 7b), although, in this case, for oscillations from the lower static branch the time-averaged mid-point pressure is increased compared with the static solution. For some values of $c_\lambda$ we might expect the lower branch Hopf bifurcation point and the lower branch limit point to eventually merge into a co-dimension 2 (Takens–Bogdanov) bifurcation point, as previously demonstrated using lower-order models of flow in collapsible tubes (Armitstead et al. Reference Armitstead, Bertram and Jensen1996) and channels (Stewart Reference Stewart2017). However, this possibility is not considered here.
3.6. Homoclinic orbits
To assess the stabilisation of the upper branch oscillations as the Reynolds number increases, in figure 8 we examine the interaction between the oscillatory limit cycles and the underlying static solutions in the approach to the upper branch limit point. In this case we use  $c_\lambda =500$, choosing two operating points on the upper branch of static solutions denoted as $\tilde {U}$1 ( $Re=196$) and $\tilde {U}$2 ( $Re=204$). Note that the former is in the region where the system has a unique steady solution and the latter is in the region with multiple steady states. At onset the period of upper branch oscillation is approximately $5.76$ units; the period increases mildly as a function of Reynolds number until the amplitude reaches its maximal value at point $\tilde {U}$2 (figure 8a). A typical phase portrait of the oscillation is illustrated in figure 8(b) for operating point $\tilde {U}$1, plotted in the space spanned by the wall pressures measured at the upstream and downstream ends of the compliant segment, while the corresponding time traces of the upstream and downstream wall pressure are shown in figures 8(c) and (d), respectively. The oscillation exhibits a complicated limit cycle enclosing the corresponding upper branch static state, where the upstream and downstream pressures trace out a broadly similar sinusoidal profile, but out of phase by approximately $9\,\%$ of a period. Smaller-amplitude pressure fluctuations are superimposed on these time traces, so the composite profile exhibits two distinct local minima and maxima over a period; the global minimum (maximum) of the upstream pressure corresponds to a local (but not global) maximum (minimum) of the downstream pressure and vice versa (figure 8c,d), resulting in the elaborate loops in the phase portrait (figure 8b). However, as the system enters the region with multiple static states, the oscillatory limit cycle shifts and no longer encloses the upper branch static state, instead becoming entrained between the upper and intermediate static states, shown for operating point $\tilde {U}$2 in figure 8(e) in the space spanned by the wall pressures measured at the upstream and downstream ends of the compliant segment. In this case the time traces of the upstream and downstream pressures have a very similar profile, and are almost perfectly in phase, although the upstream pressure is always significantly greater than the downstream pressure (figure 8f,g). Over a period the upstream wall pressure becomes very close to the intermediate static state (spending approximately two fifths of the period in the close neighbourhood of this point, visible between points 2 and 4 in figure 8f), indicating that the oscillatory limit cycle is interacting with the stable manifold associated with the intermediate static solution (figure 8f). This interaction is accompanied by a dramatic increase in period of the oscillation (figure 8a), suggestive of a nearby homoclinic orbit (Glendinning Reference Glendinning1994; Strogatz Reference Strogatz2018). The oscillation eventually reaches zero amplitude as the upper and intermediate static states coalesce, which results in a small decrease in the period close to the upper branch limit point (figure 8a). In summary, this figure demonstrates that the upper branch oscillations can interact with the other static states of the system, resulting in a large increase in the period of oscillation and a possible homoclinic orbit.
Approach to the upper branch limit point for  $c_\lambda =500$, showing: (a) the period of oscillation as a function of Reynolds number, the upper static branch enters the region with multiple static solutions at $Re\approx 202.495$ (shown with the dashed line) and terminates at the upper branch limit point $Re \approx 204.554$ (shown with the dot-dashed line); (b) phase portrait in the space spanned by the wall pressures measured at the upstream and downstream ends of the compliant segment for operating point $\tilde {U}$1 ( $Re=196$); (c) time trace of the wall pressure at the upstream end of compliant segment for operating point $\tilde {U}$1; (d) time trace of the wall pressure at the downstream end of compliant segment for operating point $\tilde {U}$1; (e) phase portrait in the space spanned by the wall pressures measured at the upstream and downstream ends of the compliant segment for operating point $\tilde {U}$2 ( $Re=204$); (f) time trace of the wall pressure at the upstream end of compliant segment for operating point $\tilde {U}$2; (g) time trace of the wall pressure at the downstream end of compliant segment for operating point $\tilde {U}$2. The corresponding values of the upper, intermediate and lower static branches are marked as filled black circles in (b,e) and as dot-dashed lines in (c,d,f,g). Five equally spaced time instances over a period of oscillation are marked as filled red circles in (b)–(g).

3.7. Energy budget for $c_{\lambda }=1600$

To assess the mechanism of instability driving the self-excited oscillations, in table 1 we compute the terms in the energy budget (2.36) at eighteen selected points with fixed  $c_{\lambda }=1600$ (those labelled U1–U8, I1–I2, L1–L8 in figure 2). In particular, we compute the energy budget for the different branches of self-excited oscillation by post-processing the fully developed limit cycles and taking the time average over a period (according to (2.41)); these terms are denoted with the superscript $^{(avg)}$. We further compute the terms in the energy budget for the corresponding static states (2.37), denoted with the superscript $^{(0)}$, and the excess between the time-averaged and the static terms in the energy budget (2.43a–c), denoted with the superscript $^{(e)}$.
The contributions to the static energy budget can be computed at all the operating points, where the work done by upstream pressure ( ${\mathcal {P}}^{(0)}$) almost exactly balances the work done by dissipation in the fluid ( ${\mathcal {D}}^{(0)}$) in every case, while the kinetic energy flux ( ${\mathcal {F}}^{(0)}$) is negligible in comparison. Such a result is to be expected because in a steady configuration the outlet flux must exactly balance the prescribed inlet flux. We find that the work done by upstream pressure generally decreases with increasing Reynolds number for all three branches. However, for fixed Reynolds number (in the region with multiple steady states), the lower static branch requires more work to be done by the driving pressure than the intermediate static branch, which in turn requires more work to be done by the driving pressure than the upper static branch.
For fully developed limit cycles we observe that the dominant energy balance is always between the rate of work of upstream pressure and the rate of work of viscous dissipation, similar to previous studies of oscillations driven by fixed upstream flux (Stewart Reference Stewart2017). Again, we might expect the net kinetic energy flux extracted from the mean flow  $({\mathcal {F}}^{(avg)})$ to be very small since the time-averaged flux at the outlet boundary must be unity to conserve mass over a period.
For those operating points which exhibit a fully developed limit cycle we can further compute the excess energy compared with the static, where we find that the excess work done by upstream pressure is positive ( ${\mathcal {P}}^{(e)}>0$) and so the upstream pressure must work harder to sustain the oscillation; this increase is balanced by an increase in the work done by dissipation from the more complicated flow field ( ${\mathcal {D}}^{(e)}$). This increase in working of upstream pressure is presumably achieved by the action nonlinear Reynolds stresses. Hence, this fluid-beam system shows a very different mechanism of energy transfer to that of the fluid-membrane system described by Stewart (Reference Stewart2017), who found that onset of oscillation reduces the overall dissipation energy by increasing the time-averaged minimal width of the channel. Thus, in that case the upstream pressure works less hard to drive the instability compared with the steady configuration. However, oscillations arising due to an increase in the rate of working of upstream pressure have been discussed elsewhere in the literature (Jensen & Heil Reference Jensen and Heil2003; Stewart et al. Reference Stewart, Waters and Jensen2009, Reference Stewart, Heil, Waters and Jensen2010).
4. Comparison with the previous fluid-beam model
In order to assess how our modifications to the Kirchhoff law influence the predictions of the fluid-beam model, in figure 9 we consider operating point  $\tilde {\text {L}}$1 ( $c_\lambda =500$, $Re=400$ along the lower static branch) and compare fully developed limit cycles found using our constitutive law ((2.16a,b), which we term the ‘new’ model) to predictions using the constitutive law of Luo et al. (Reference Luo, Cai, Li and Pedley2008) ((2.14a,b), which we term the ‘old’ model). We choose this operating point at the largest value of Reynolds number considered to maximise the deformation of the beam (see figure 7). In particular, we illustrate time traces of the upstream driving pressure measure $p(-L_u,1,t)$ and the wall mid-point pressure $p_{mid}$ computed using these two models (figure 9a) and compare the resulting pressure contours at four time instances (when $p_{mid}$ reaches zero and its extrema, respectively) over a period (figure 9b–e). In all cases we find that the two flows are almost indistinguishable, so the modification made to the wall model to make it energetically conservative makes negligible difference to the predictions. For this oscillation arising from the lower static branch (see figure 7) the channel wall is highly collapsed over the entire period of oscillation, shedding large-amplitude vorticity waves into the downstream rigid segment (Stephanoff et al. Reference Stephanoff, Pedley, Lawrence and Secomb1983). Over a period, the oscillation proceeds by altering the wall shape to constrict the channel (relative to the static) and develop a wide region of low pressure (less than the channel outlet pressure) at the downstream end of the flexible segment (figure 9b). This pressure difference locally reverses the flow, which gradually propagates the channel constriction upstream (figure 9c). The upstream driving pressure must then work harder to sustain the prescribed flow (figure 9a), while the region of low pressure becomes narrower (figure 9c). Due to local flow reversal close to the constriction, conservation of mass dictates that the wall must expand upstream to accommodate the incoming fluid. However, resistance of the wall to bending and stretching prevents its continued expansion and so drives the constriction downstream again (figure 9a,d), lowering the driving pressure and moving the region of low pressure toward the downstream end of the flexible segment (figure 9e), and the process repeats. In this case the $x$-position of the channel constriction changes smoothly as there is one local minimum width for all time. In summary, this figure demonstrates that our modification to the Kirchhoff law makes negligible difference to the fully developed oscillations along the lower branch. It also provides insight into the mechanism of instability driving the lower branch oscillation, where the channel constriction smoothly propagates backwards and forwards along the compliant segment.
Comparison of the fluid-beam model using the ‘old’ and ‘new’ Kirchhoff laws ((2.14a,b) and (2.16a,b), respectively) at operating point  $\tilde {\text {L}}$1 ( $c_\lambda =500$, $Re=400$) showing: (a) time traces of the upstream driving pressure and the wall mid-point pressure using the new (solid lines) and old (dashed lines) Kirchhoff laws, respectively, and (b)–(e) four snapshots of the fluid streamlines for the new (red solid lines) and old (black dashed lines) Kirchhoff laws, superimposed on pressure contours within the collapsible channel for the new Kirchhoff law illustrated with a colour contour map. The dot-dashed line in panel (a) is the steady wall mid-point pressure using the new Kirchhoff law.

5. Discussion
This study considered a model for flow through a finite-length collapsible channel driven by a fixed upstream flux, where the flexible wall takes the form of a long thin elastic beam with a modified Kirchhoff law, slightly adjusting the formulation of Luo et al. (Reference Luo, Cai, Li and Pedley2008) to ensure that the wall model is energetically conservative. However, this modification makes almost no difference to the final predictions (figure 9). The full unsteady model was solved using an arbitrary Lagrangian–Eulerian framework based on the finite element method.
The model predicts that there is always at least one static solution for all parameters tested and across most of the parameter space this static profile is unique. However, for sufficiently large Reynolds numbers there exists regions of parameter space with three co-existing static states (figure 2): an upper branch (where the channel is almost entirely inflated), a lower branch (where the wall is mostly collapsed) with an intermediate branch connected by a pair of limit point bifurcations. Such three branch behaviour has been previously reported in collapsible tube experiments (Bertram et al. Reference Bertram, Raymond and Pedley1991) and computations (Heil & Boyle Reference Heil and Boyle2010), and has also been found in flow through collapsible channels where the elastic wall has large pre-stress (e.g. as a thin membrane (Luo & Pedley Reference Luo and Pedley2000; Stewart Reference Stewart2017), using nonlinear shell theory (Heil Reference Heil2004) or as a hyperelastic material of finite thickness (Herrada et al. Reference Herrada, Blanco-Trejo, Eggers and Stewart2021)), but the present work is the first time it has been demonstrated in a fluid-beam model with no pre-stress but with resistance to both bending and stretching.
In line with previous studies (Luo et al. Reference Luo, Cai, Li and Pedley2008; Hao et al. Reference Hao, Cai, Roper and Luo2016), the lower branch of static solutions becomes unstable to self-excited oscillations via a supercritical Hopf bifurcation when the Reynolds number exceeds a critical threshold (figure 7, where typical flow profiles over a period of oscillation are shown in figure 9); analogous oscillations growing from the lower static branch have already been reported elsewhere (Heil Reference Heil2004; Stewart Reference Stewart2017; Herrada et al. Reference Herrada, Blanco-Trejo, Eggers and Stewart2021). Over a period of these oscillations the profile of the flexible wall exhibits a single minimum which smoothly propagates up and downstream. However, it emerges that the cascade structure described by Luo et al. (Reference Luo, Cai, Li and Pedley2008) is by no means exhaustive, showing that there are other neutral stability curves forming unstable islands in zones which were previously deemed stable (figure 5).
In particular, our simulations demonstrate that the upper branch of static solutions can also become unstable to oscillations, and this transition typically occurs for lower Reynolds numbers that those considered by Luo et al. (Reference Luo, Cai, Li and Pedley2008). However, it should be noted that this upper branch instability is not a consequence of our modification to the wall model – subsequent analysis using the original model of Luo et al. (Reference Luo, Cai, Li and Pedley2008) has confirmed the existence of this upper branch instability. A similar instability of the upper static branch has very recently been reported by Herrada et al. (Reference Herrada, Blanco-Trejo, Eggers and Stewart2021), using a global linear stability eigensolver. However, our method provides access to the oscillatory limit cycle, where we showed that the upper branch instability develops into an oscillation where the wall is almost entirely inflated over a period, growing an outward bulge at the downstream end of the domain which propagates upstream and is eventually suppressed by interaction with flow in the upstream rigid segment. The saturated amplitude of these oscillations initially grows with Reynolds number but eventually reaches a maximum and then decreases, terminating at the end of the upper branch of static solutions (the upper branch limit point). This demise is accompanied by a significant increase in the period of oscillation as the nonlinear limit cycles exhibit strong interaction with the intermediate static state, reminiscent of a homoclinic orbit (figure 8). Stabilisation of the upper branch results in a range of Reynolds numbers beyond this limit point where the system is entirely stable, before eventually becoming unstable to oscillations growing from the lower static branch. Hence, the cascade structure observed in this system is at least partially due to the complexity of the underlying static state.
Our modified fluid-beam formulation means that the elastic wall is perfectly energetically conservative, and so over a period of oscillation the only non-trivial contributions to the energy budget are the work done by upstream pressure, the work done by viscous dissipation and the net kinetic energy flux extracted from the mean flow. Of these, the latter is negligible as the upstream flux is prescribed and the oscillation must conserve mass over a period (see table 1), similar to observations made using lower-order models (Xu & Jensen Reference Xu and Jensen2015; Stewart Reference Stewart2017). For oscillations arising from both the upper and lower static branches, the work done by upstream pressure is increased by the oscillation compared with its corresponding static value. Hence, the system must work harder to oscillate, with the extra energy supplied by the action of nonlinear Reynolds stresses (a similar mechanism for pressure-driven oscillations from a non-uniform basic state was previously reported by Stewart et al. Reference Stewart, Waters and Jensen2009). This mechanism is different to that reported for lower branch oscillations when the external pressure is very large (Stewart Reference Stewart2017), where there the oscillation caused the collapsed channel to expand slightly, reducing the overall viscous dissipation. The energy analysis presented in this paper provides insight into the fundamental mechanism of instability in this system. Although simplified, this model can also serve as a mathematical prototype for general fluid–structure interaction systems commonly found in clinical applications with periodic motion, such as blood flows in the aorta and large coronary arteries, and oscillatory airflows in lung airways.
Supplementary movie
Supplementary movie is available at https://doi.org/10.1017/jfm.2021.642.
Acknowledgements
Special thanks to Professor Z. Cai (Tianjin University, China) for helpful discussions.
Funding
We gratefully acknowledge funding from the Chinese Scholarship Council (D.Y.W.), UK Engineering and Physical Sciences Research Council grants EP/S020950, EP/S030875 and EP/N014642 (X.Y.L. and P.S.S.).
Declaration of interests
The authors report no conflict of interest.
Data accessibility
The data presented in this paper are accessible at http://dx.doi.org/10.5525/gla.researchdata.1112.
Appendix A. Rate of working of external pressure
In this Appendix we manipulate the rate of working of external pressure (2.35) to be expressed as a complete time derivative.
The relationships between the Eulerian and Lagrangian coordinate systems take the form (Cai & Luo Reference Cai and Luo2003),
 \begin{equation} {\boldsymbol{e}}_1=\frac{1}{\lambda}\left(\frac{\partial x_b}{\partial l}{\boldsymbol{g}_1}+\frac{\partial y_b}{\partial l}{\boldsymbol{g}_2}\right),\quad {\boldsymbol{e}}_2=\frac{1}{\lambda}\left(-\frac{\partial y_b}{\partial l}{\boldsymbol{g}_1}+\frac{\partial x_b}{\partial l}{\boldsymbol{g}_2}\right), \quad {\boldsymbol{e}}_3={\boldsymbol{g}}_3.\end{equation}
Hence, substituting the velocity of the beam
 \begin{equation} {\boldsymbol{u}}_b=\frac{\partial{\boldsymbol{x}}_b}{\partial t} = \frac{\partial x_b}{\partial t}{\boldsymbol{g}}_1 + \frac{\partial y_b}{\partial t} {\boldsymbol{g}}_2, \end{equation}
and the unit vector  ${\boldsymbol{e}}_2$ (A1a–c) into the rate of working of external pressure ${\mathcal {P}}_e$ (2.35) we obtain
 \begin{equation} {\mathcal{P}}_e=\int_0^{L} -p_e\left(\frac{\partial x_b}{\partial l}\frac{\partial y_b}{\partial t}-\frac{\partial x_b}{\partial t}\frac{\partial y_b}{\partial l}\right)\,\textrm{d}l=\frac{\partial}{\partial t}\int_0^{L}-p_e \frac{\partial x_b}{\partial l}y_b\,\textrm{d}l+\left[p_e\frac{\partial x_b}{\partial t}y_b\right]_0^{L}.\end{equation}
The second term vanishes after applying the boundary condition (2.22a–d). Hence, the rate of working of external pressure  ${\mathcal {P}}_e$ can be written as a complete time derivative in the form presented in (2.35).
Appendix B. Convergence of the numerical method
The convergence of the numerical method is illustrated in figure 10 for operating point L8 ( $Re=216$, $c_{\lambda }=1600$). In particular, we consider simulations with three finite element meshes composed of either 29 697 elements in the bulk and 120 elements along the beam (which we term mesh 1), 36 657 elements in the bulk and 140 elements along the beam (which we term mesh 2) or 41 877 elements in the bulk and 140 elements along the beam (which we term mesh 3). The static beam shape computed using these three meshes is shown in figure 10(a), where we find that the profile is indistinguishable across the three cases. The static simulations in the main text were all computed using mesh 2. Furthermore, we consider unsteady simulations using meshes 1 and 2 for a variety of choices of timestep (figure 10b) for identical initial conditions. Note that the mesh is regenerated after each timestep (according to the procedure discussed in the main text), but the number of elements stays fixed. We find that these time traces are indistinguishable across the three different choices, indicating that our simulations are well converged. The unsteady simulations in the main text were all computed using mesh 2 with a timestep ${\rm \Delta} t=0.01$. This ensures at least 500 timesteps per period of oscillation for the examples considered in this paper.
Convergence of the numerical method illustrated at operating point L8 ( $Re=216$, $c_{\lambda }=1600$): (a) the static beam profile computed using mesh 1 (filled squares), mesh 2 (inverted triangles) and mesh 3 (filled circles); (b) time trace of the fluid pressure at the beam mid-point $p_{mid}(t)$ ( $x=L/2$) for three different combinations of mesh and timestep, including mesh 1 with ${\rm \Delta} t=0.05$ (filled squares), mesh 2 with ${\rm \Delta} t=0.01$ (inverted triangles) and mesh 2 with ${\rm \Delta} t=0.05$ (filled circles).


 Open access