


1. Introduction
On 7 November 1940, the Tacoma Narrows Bridge (TNB) collapsed only four months after it was opened. In the early morning, the bridge deck showed a vertical vibration with a wavelength of  $2L_z/9$ or $L_z/5$ at a frequency of $0.60\unicode{x2013}0.63$ Hz, where $L_z$ is the length of the bridge deck. The vertical vibration changed abruptly to a torsional one around 10:00, and the bridge oscillated at $0.23$ Hz with the angular amplitude reaching up to 45 degrees right before the collapse at 11:00 (Ammann, von Kármán & Woodruff (Reference Ammann, von Kármán and Woodruff1941); see also Olson, Wolf & Hook (Reference Olson, Wolf and Hook2015) for a brief summary of the incident).
The main cause of the collapse has been widely attributed to resonance; i.e. the natural frequency of the bridge is connected to the frequency of the Kármán vortex shedding, leading to the failure of the bridge. For example, an undergraduate fluid mechanics textbook by White (Reference White2016) says ‘Resonance can occur if a vortex-shedding frequency is near a body's structural vibration frequency.  $\ldots$ A striking example is the disastrous failure of the Tacoma Narrows suspension bridge in 1940, when wind-excited vortex shedding caused resonance with the natural torsional oscillations of the bridge’. Similar statements can be found in other engineering and physics textbooks (Den Hartog Reference Den Hartog1985; Serway & Jewett Reference Serway and Jewett2018). However, Scanlan (Reference Scanlan1982) indicated by referring to von Kármán & Edson (Reference von Kármán and Edson1967) and Yakubovich & Starzhinskii (Reference Yakubovich and Starzhinskii1975) that the torsional oscillatory behaviour of the bridge did not match that of the naturally shed vortex street, and claimed that the TNB underwent an aeroelastic separated-flow fluttering right before the collapse. Later, Billah & Scanlan (Reference Billah and Scanlan1991) showed that the frequency of the torsional vibration was considerably different from that of the vortex-shedding frequency ( $\sim$1 Hz), and indicated that the torsional fluttering of the bridge, which led the bridge to its collapse, was the result of an aerodynamically induced ‘self-excitation’, as opposed to an external excitation (see also Zhang, Dou & Gao Reference Zhang, Dou and Gao2020). They affirmed that the vortex shedding is an essential ingredient for the fluttering to occur. However, as pointed out by Larsen (Reference Larsen2000), they were unable to directly associate the vortex motion with the appearance of negative damping (note that the onset of dynamic instability due to the accumulation of energy is referred to as negative damping, as opposed to positive damping by which energy is dissipated away from the system).
To reveal the contribution of vortex motion to the torsional instability, Larsen (Reference Larsen2000) studied the instability mechanism of the H section of the TNB deck. The procedure of the deck receiving net work from the flow as vortices emerge at the leading edge and drift toward the trailing edge according to the deck oscillation was provided in detail. A critical wind speed obtained for the onset of the torsional instability was  $U_c \approx 4fB$, where $f$ is the prescribed frequency of the deck cross-section oscillation and $B$ is the deck cross-section width. For $U (\textrm {wind speed}) < U_c$, the net work done to the bridge by the vortices was negative and thus the oscillatory motion was damped (positive damping), but for $U \ge U_c$, the damping switches to negative, leading to an increase in the torsional amplitude and the onset of torsional instability. The wind speed during the vibration and collapse of the TNB in 1940 ( $U\approx 8 fB$) was higher than the critical wind speed, and thus the bridge was torsionally unstable. Green & Unruh (Reference Green and Unruh2006) further improved this result by considering the growth and reattachment of the vortices.
In contrast to the claim that the cause of the torsional vibration is aeroelastic, studies based on nonlinear structure models (see Lacarbonara (Reference Lacarbonara2013) for general introduction to the nonlinear structural mechanics) have shown that the torsional instability of the bridge is mainly a structural phenomenon, and attributed the dynamic instability of the bridge to large vertical oscillations. McKenna (Reference McKenna1999) derived a simple nonlinear two-dimensional model of a system with vertical and torsional oscillations and demonstrated a rapid transition of a large vertical vibration to torsional vibration only under the condition where a periodic torsional force was assigned. Berchio & Gazzola (Reference Berchio and Gazzola2015) and Arioli & Gazzola (Reference Arioli and Gazzola2015) provided a nonlinear model of a system (without any aerodynamic effect) and showed that, during a large vertical vibration, energy of the vertical mode is transferred to a torsional mode and torsional vibration suddenly appears. They showed the existence of an energy threshold, over which the bridge became torsionally unstable. Later, Arioli & Gazzola (Reference Arioli and Gazzola2017) suggested a more refined nonlinear model for suspension bridges in which the role of cables is also included into the nonlinearity of the system (again without any aerodynamic effect) and obtained the energy threshold of instability according to each vertical mode using the structural parameters and length scales of the TNB. They showed that the failure of the TNB was neither due to the resonance of the structure by the Kármán vortex street, nor due to pure aeroelasticity. However, their simulation did not consider the aerodynamic effect of the wind, and thus an initial condition was required to initiate the vertical vibration of the bridge.
So far, most of numerical studies have been limited to two-dimensional analyses (Billah & Scanlan Reference Billah and Scanlan1991; McKenna Reference McKenna1999; Larsen Reference Larsen2000; Green & Unruh Reference Green and Unruh2006; Adekanye & Washington Reference Adekanye and Washington2018) or to purely structural simulations (McKenna Reference McKenna1999; Arioli & Gazzola Reference Arioli and Gazzola2015, Reference Arioli and Gazzola2017; Berchio & Gazzola Reference Berchio and Gazzola2015; Adekanye & Washington Reference Adekanye and Washington2018). In those studies, how the vibration was initiated was not investigated but an initial vibration was prescribed. Previous experimental studies (Ammann et al. Reference Ammann, von Kármán and Woodruff1941; Scanlan & Tomko Reference Scanlan and Tomko1971; Hu, Zhao & Ge Reference Hu, Zhao and Ge2022) and numerical ones employing three-dimensional fluid–structure interaction (Szabó, Györgyi & Kristóf Reference Szabó, Györgyi and Kristóf2020) also prescribed the initial motions of the bridge models. Abbas, Kavrakov & Morgenthal (Reference Abbas, Kavrakov and Morgenthal2017) summarized the aerodynamic analysis techniques and numerical and experimental methods for flutter stability analysis of long-span cable-supported bridges.
As the wind is essential to the initiation of the vibration from the wind–bridge interaction and the vibration switches from vertical to torsional, an unsteady three-dimensional numerical simulation together with fluid–structure interaction is necessary to investigate the vibration mechanism. Therefore, in the present study, we perform a direct numerical simulation of the flow over a vibrating TNB together with solving the structure equations suggested by Arioli & Gazzola (Reference Arioli and Gazzola2017), to describe the vertical and torsional vibrations that occurred before the collapse of the TNB in 1940. We start the simulation in the presence of the free-stream velocity with a static condition of the TNB. Then, its vertical vibration and transition to torsional vibration occur. The Reynolds number considered is  ${Re}=10\ 000$ based on the free-stream velocity and height of the deck fence. This Reynolds number is much lower than the real one, ${Re}=3.06 \times 10^{6}$, but the realistic aerodynamic force and moment on the TNB are computed by modifying the magnitude of a fluid property (see § 2). Modal analyses are also conducted to identify the resonance modes of the vertical and torsional vibrations. A few more numerical simulations are also conducted to find the critical flutter wind speed and to examine the roles of the free-stream velocity and vertical vibration in the growth of the torsional vibration. The numerical details are given in § 2, and the behaviours of the vertical and torsional vibrations are discussed in detail in § 3, followed by conclusions in § 4.
2. Numerical methods
The governing equations for unsteady three-dimensional incompressible flow with a fluid–structure interface are solved in Eulerian coordinates, while the nonlinear dynamic equations for the TNB (Arioli & Gazzola Reference Arioli and Gazzola2017) with the aerodynamic force and moment at the interface are solved in Lagrangian coordinates. A weak-coupling approach for the fluid–structure interaction (Kim, Lee & Choi Reference Kim, Lee and Choi2018) is employed (see below for details).
2.1. Fluid flow
The governing equations for the fluid flow are the unsteady three-dimensional incompressible Navier–Stokes and continuity equations, and their non-dimensional forms are
 $$\begin{gather} \frac{\partial u_i}{\partial t}+\frac{\partial u_i u_j}{\partial x_j}={-}\frac{\partial p}{\partial x_i}+\frac{1}{{Re}} \frac{\partial^{2} u_i}{\partial x_j \partial x_j}+f_i, \end{gather}$$
 $$\begin{gather}\frac{\partial u_i}{\partial x_i}-q=0, \end{gather}$$
where  $x_i (=x,y,z)$ is the Cartesian coordinates, $u_i (=u,v,w)$ is the corresponding velocity, $p$ is the pressure and $f_i$ and $q$ are the momentum forcing and mass source/sink used for the immersed-boundary method, respectively (see Kim, Kim & Choi (Reference Kim, Kim and Choi2001) for details). The free-stream velocity ( $U$) and deck-fence height ( $h$) are used for the non-dimensionalization (figure 1). The Reynolds number is defined as ${Re} = \rho _f U h / \mu _f$, where $\rho _f$ and $\mu _f$ are the fluid density and viscosity, respectively. We perform direct numerical simulation, i.e. without using any turbulence model. The wind speed during the collapse of the TNB in 1940 was 18 m s $^{-1}$, and thus the actual Reynolds number was ${Re}=3.06\times 10^{6}$. This Reynolds number is too high to handle using direct numerical simulation because of very long TNB deck length ( $L_z = 853.44$ m). Instead of handling this actual Reynolds number, we rather perform a simulation at a much lower Reynolds number of ${Re} = 10\ 000$ by modifying the magnitude of a fluid property. Justification of using a lower Reynolds number is following: (i) as the flow separation is fixed at the leading edge of the deck fence, the Strouhal number ( $St = f_{vs} h / U$, where $f_{vs}$ is the vortex-shedding frequency) and drag coefficient ( $C_D = D / (0.5 \rho _f U^{2} h L_z$), where $D$ is the drag force) vary little with the Reynolds number for a wide range of the Reynolds number (Schew Reference Schew2013); (ii) the aerodynamic force and moment on a bluff body are mostly determined by the inertia of the flow (i.e. pressure distribution on the body) rather than by the skin friction. Therefore, even though the computation is carried out at a lower Reynolds number, we maintain the fluid density as that of air ( $\rho _f=1.247$ kg m $^{-3}$) but change the viscosity to be $\mu _f=5.387\times 10^{-3}$ N s m $^{-2}$ to match the Reynolds number as $10\ 000$. Then, the drag force can be reasonably computed by providing the actual air density ( $D = C_D \times 0.5 \rho _f U^{2} h L_z$) and neglecting the effect of the viscosity.
Computational domain and deck geometry: (a) computational domain; (b) cross-section of the deck.

An implicit fractional step method (Choi & Moin Reference Choi and Moin1994) with linearization (Kim, Baek & Sung Reference Kim, Baek and Sung2002) is used for time advancement of (2.1) and (2.2). The second-order central difference method is applied to all the spatial derivative terms in the framework of the finite volume method. The computational domain for the fluid flow and the geometry of the bridge deck are shown in figure 1. The hangers, cables and towers (see later in figure 3) are neglected and only the deck is considered for the computation of the fluid flow, because the deck is the main source of the vortex shedding which again produces the force and moment on the deck. Here, the  $x$-,
$x$-,  $y$- and $z$-axes are the streamwise, transverse and spanwise directions, respectively; $z=0$ is located at one end of the deck, and $x=0$ and $y=0$ are the location of the static deck centre. The height of the deck fence is $h=2.4$ m. The length of the deck, $L_z = 853.44$ m, is equal to the spanwise length of the computational domain, and the deck width is $2l = 12$ m. The thicknesses of the railings and deck are $a= 0.12$ m and $b=0.5313$ m, respectively. The length scales of the deck parameters with respect to $h$ are given in table 1.
Deck parameters.

The number of grid points for the flow simulation is  $4097\times 1601\times 2049$ in the $x$,
$x$,  $y$ and $z$ directions in the Cartesian mesh, and the computational domain size is $[-20h,\ 40h]\times [-20h, 20h]\times [0,\ 355.6h]$. The grids in the $z$ direction are uniformly distributed by $\Delta z=0.1736h$, and a periodic boundary condition is applied in this direction. On the other hand, non-uniform grids are distributed in the $x$ and $y$ directions with minimum grid sizes of $\Delta x=\Delta y=0.005h$, and the grid distribution in the $x\unicode{x2013}y$ plane is shown in figure 2, in which uniform grids are distributed near the deck ( $[-2.7h, 4h]\times [-2.5h$, $2.5h]$), and non-uniform grids are given with contraction (upstream of the deck) and expansion (downstream) factors of $0.9915$ and $1.0008$ in the $x$ direction and with an expansion factor of 1.013 (upward and downward) in the $y$ direction. A Dirichlet boundary condition of ( $U, 0, 0$) is applied at the inflow boundary, while a Neumann boundary condition of $\partial u / \partial y = v = \partial w / \partial y = 0$ is applied at the top and bottom boundaries (see also Kim, Lee & Choi (Reference Kim, Lee and Choi2016), Kim & Choi (Reference Kim and Choi2019) and Jin, Wu & Choi (Reference Jin, Wu and Choi2021) who used this boundary condition). A convective boundary condition, $\partial u_i / \partial t + u_c \partial u_i / \partial x = 0$, is applied at the outflow boundary to allow the vortices to exit the computational domain smoothly (Pauley, Moin & Reynolds Reference Pauley, Moin and Reynolds1990), where $u_c$ is the instantaneous streamwise velocity averaged over the outflow boundary. The initial condition for the simulation is given as $(u/U,v/U,w/U)=(1,0,0)$, and a constant CFL (Courant–Friedrichs–Lewy) number of $2$ is employed throughout the computation. We performed an additional simulation using coarser grids with $\Delta x=\Delta y=0.007h$, and obtained the same frequencies and wavelengths of the vertical and torsional vibrations as those from the present grids, although the small-scale flow structures were slightly different. We also conducted a simulation with a larger computational time step size by fixing CFL $= 3$ during a torsional vibration period, and obtained nearly the same sectional lift and moment coefficients and the vertical and angular displacements as those from CFL $= 2$.
Grid distribution in an  $x\unicode{x2013}y$ plane. Here, every eighth grid point is plotted in each direction.

Owing to the large number of grids used for flow simulation, up to  $2500$ nodes of an Intel Xeon Phi 7250, which corresponds to $160\ 000$ MPI (message-passing interface) processes, are used for the computation. Two-dimensional domain decomposition is applied to relieve the enormous computational load (Kwon et al. Reference Kwon, Lee, Lee, Kang and Choi2020), and a parallel TDMA (tridiagonal matrix algorithm) method (Kim et al. Reference Kim, Kang, Pan and Choi2021) is employed to accelerate the computation.
2.2. Structure vibration
The vertical and rotational movements of a suspension bridge follow a nonlinear model proposed by Arioli & Gazzola (Reference Arioli and Gazzola2017). In this model, the hangers are considered as a continuum connecting the cables and deck and their elastic deformation is neglected, while the tension by the cables is taken into account. The deck is divided into  $2048$ elements in the $z$ direction, the same as the computational grids used for fluid flow in § 2.1. Each element of the deck is assumed to be rigid but to move in the $y$ direction and rotate on the $x\unicode{x2013}y$ plane (Arioli & Gazzola Reference Arioli and Gazzola2017). Thus, the vertical displacement and rotational angle are functions of $z$ and $t$, i.e. $Y_c (z,t)$ and $\theta _c (z,t)$ (figure 3). In this figure, 2 cables, 110 hangers (which are treated as a continuous membrane on each side during simulation), 4 towers and a deck are shown.
Description of the bridge structure: (a) cables, hangers, towers and deck of the TNB; (b) vertical displacement  $Y_c$ and rotational angle $\theta _c$ of a deck element.

The governing equations for a deck element are as follows:
 \begin{align} & \left( M+2m\xi \right) Y_{c_{tt}}={-}EI{Y_{c_{zzzz}}}+{H_0} \left\{ \frac{2Y_{c_z}}{\xi^{2}} - 3\frac{s' ( Y_{c_z}^{2}+l^{2}\theta_{c_z}^{2} )}{{\xi^{4}}} \right\}_z \nonumber\\ &\quad + \frac{AE}{L_c} \frac{s''}{\xi^{3}} \int_{0}^{L_z} \frac{Y_{c_z}^{2}+l^{2}\theta_{c_z}^{2}}{\xi^{3}}\, {{\rm d}}z -\frac{2AE}{L_c} \left( \frac{s'}{\xi}+\frac{Y_{c_z}}{\xi^{3}} \right)_z \int_0^{L_z} \frac{s''{Y_c}}{\xi^{3}} \, {{\rm d}}z \nonumber\\ &\quad -\frac{2AE{l^{2}}}{L_c} \left( \frac{\theta_{c_z}}{\xi^{3}} \right)_z \int_{0}^{L_z} \frac{s''\theta_c}{\xi^{3}} \, {{\rm d}}z + \frac{1}{2}\rho_f U^{2} h C_{L_s}, \end{align}
 \begin{align} &\left( \frac{M}{3}+2m\xi \right) \theta_{c_{tt}}= \frac{GK}{l^{2}}\theta_{c_{zz}} + 2H_0 \left( \frac{\theta_{c_z}}{\xi^{2}} - 3\frac{s'Y_{c_z}\theta_{c_z}}{\xi^{4}} \right)_z \nonumber\\ &\quad + \frac{2AE}{L_c} \frac{s''}{\xi^{3}} \int_{0}^{L_z} \frac{Y_{c_z}\theta_{c_z}}{\xi^{3}}\, {{\rm d}}z -\frac{2AE}{L_c} \left( \frac{s'}{\xi}+\frac{Y_{c_z}}{\xi^{3}} \right)_z \int_0^{L_z} \frac{s''\theta_c}{\xi^{3}}\, {{\rm d}}z \nonumber\\ &\quad -\frac{2AE}{L_c} \left(\frac{\theta_{c_z}}{\xi^{3}}\right)_z \int_0^{L_z}\frac{s''Y_c}{\xi^{3}}\, {{\rm d}}z + \frac{1}{2} \rho_f U^{2} h^{2}\frac{C_{M_s}}{l^{2}}, \end{align}
where the subscripts  $t$ and $z$ indicate the time and spatial derivatives of the variables, $s(z)$ and $\xi (z)(=\sqrt {(1+s'^{2})})$ are the location and local length of the cables at rest, respectively, and $A, E, G, H_0, I, K, L_c, M$ and $m$ are listed in table 2. Here, $C_{L_s} (=2 L_s/(\rho _f U^{2} h))$ and $C_{M_s} (=2 M_s/(\rho _f U^{2} h^{2}))$ are the sectional lift and moment coefficients, respectively, where $L_s$ and $M_s$ are the sectional lift and moment, respectively. The structural damping is neglected in (2.3) and (2.4). The locations of the cables at rest are obtained by the following relation:
 \begin{equation} 2H_0 s''=\left( M+2m\sqrt{1+{s'}^{2}} \right) g \text{ at } {t} = 0, \end{equation}
where  $g$ is the gravitational acceleration. This equation shows the balance between the tension of the cables and the gravitational force of the deck and cables, but neglects the gravitational force of the hangers (Arioli & Gazzola Reference Arioli and Gazzola2017). The location of the cables at their ends are fixed to the four towers, i.e. $s(0)=s(L_z)=30h$. The bridge is initially at rest ( $Y_c=\theta _c=0$) and the ends of the deck ( $z=0$ and $L_z$) are fixed at their original positions. Note that the governing equations (2.3) and (2.4) are slightly different from those in Arioli & Gazzola (Reference Arioli and Gazzola2017), because in the latter the direction of the $y$ coordinate is the opposite to that in the present study. The generalized- $\alpha$ method by Chung & Hulbert (Reference Chung and Hulbert1993) is used to solve (2.3) and (2.4) in time, and the second-order central difference method and trapezoidal method are used for the spatial derivative and integral terms, respectively.
Material properties of the TNB parameters (from Arioli & Gazzola Reference Arioli and Gazzola2017).

The kinetic ( $E_{kin}$) and gravitational ( $E_{grav}$) energies of the deck and cables, the elastic energy of the deck ( $E_{el}$), the energy required for each cable to deform under tension ( $E_{c}$) and the energy required to change the cable length ( $E_{tc}$) are given as follows (Arioli & Gazzola Reference Arioli and Gazzola2017):
 $$\begin{gather} {E_{kin}}=\frac{M}{2}\int_{0}^{L_z}{\left( \frac{{l^{2}}{\theta_c}_t^{2}}{3} +{Y_c}_t^{2} \right)}\, {{\rm d}}z+\frac{m}{2}\int_{0}^{L_z}{( {p_1}^{2}_t + {p_2}^{2}_t )\xi \, {{\rm d}}z}, \end{gather}$$
 $$\begin{gather}{E_{grav}}=Mg\int_{0}^{L_z}{{Y_c}\, {{\rm d}}z}+mg \int_{0}^{L_z}{( {p_1}+{p_2})\xi\, {{\rm d}}z}, \end{gather}$$
 $$\begin{gather}{E_{el}}=\frac{EI}{2}\int_{0}^{L_z}{{Y_c}_{zz}^{2} \, {{\rm d}}z}+\frac{GK}{2}\int_{0}^{L_z}{{\theta_c}_z^{2}\, {{\rm d}}z}, \end{gather}$$
 $$\begin{gather}{E_c}(p_i)=H_0\int_{0}^{L_z}{\xi \left( \sqrt{1+{{( s'+ {p_i}_z )}^{2}}}-\sqrt{1+s'^{2}} \right)}\, {{\rm d}}z,\quad (i=1,2), \end{gather}$$
 $$\begin{gather}E_{tc}(p_i)=\frac{AE}{2L_c}{\left( \int_{0}^{L_z}{\sqrt{1 +{( s'+{p_i}_z )}^{2}}\, {{\rm d}}z}-{L_c} \right)^{2}} \quad (i=1,2), \end{gather}$$
where  $p_1(z,t)=Y_c+l\theta _c$ and $p_2(z,t)=Y_c-l\theta _c$ are the displacements of two cables sharing a deck element with respect to its static position.
2.3. Fluid–structure interaction
A weak-coupling method by Kim et al. (Reference Kim, Lee and Choi2018) is used for fluid–structure interaction, in which the governing equations of the structure and fluid are solved alternatively in a staggered manner. First, the provisional displacement and velocity of the fluid–structure interface are obtained using the information obtained at the previous time step, and the velocity and pressure of the fluid at the current time step are updated with the provisional information. Then, the hydrodynamic force and moment on the interface are obtained from the flow field at the current time step, with which the velocity and acceleration of the structure are obtained. This method provides faster computation and easier implementation than a strong-coupling method does, while keeping a second-order accuracy. The detailed procedure is given in Kim et al. (Reference Kim, Lee and Choi2018). As we shall show below (§§ 3.2 and 3.3), with the present numerical methods, the frequency and wavelength of the vertical and torsional vibrations are in excellent agreement with those of the actual incident, and the critical flutter wind speed obtained also agrees well with those of previous experimental and numerical studies.
3. Results
In this section, the characteristics of the vertical and torsional vibrations are examined and compared with the recorded data of the incident of the TNB in 1940, and the critical flutter wind speed for the growth of the torsional vibration is obtained.
3.1. Natural frequencies of the TNB
The vertical and torsional vibration modes are obtained by separately solving (2.3) and (2.4) with  $\theta _c = C_{L_s} \equiv 0$ in (2.3) and $Y_c = C_{M_s} \equiv 0$ in (2.4). The initial conditions are given as $Y_{c_t}(z,t=0)/U=A_{n_m}\sin (n_m{\rm \pi} z/L_z)$ and $Y_c(z,t=0)=0$ for the vertical modes, and $\theta _{c_t}(z,t=0)h/U=B_{n_m}\sin (n_m{\rm \pi} z/L_z)$ and $\theta _c(z,t=0)=0$ for the torsional modes, where $n_m=1,2, \ldots, 11$. To see if the vertical and torsional vibration modes depend on the initial energy level $E$ (sum of (2.6)–(2.10)), we provide two different $A_{n_m}$ values and $B_{n_m}$ values: for the vertical vibration, $A_{n_m}=0.0001$ and $0.4$, resulting in $E= 6.98$ J and $101.7$ MJ, respectively; for the torsional vibration, $B_{n_m}=0.0001$ and $1$, resulting in $E=19.0$ J and $1.90$ GJ, respectively. Note that the total energy ( $E$) does not change in time because there is no energy loss.
Figure 4 shows the variations of the natural frequencies  $f_{nat}$ with the vertical and torsional vibration wavenumbers $n_m$, together with those for the vertical vibration obtained by Arioli & Gazzola (Reference Arioli and Gazzola2017). The natural frequency for the vertical vibration increases almost linearly with the wavenumber $n_m$ and shows weak dependence on the initial energy, agreeing well with the result by Arioli & Gazzola (Reference Arioli and Gazzola2017). A notable difference is that no natural frequency exists for $n_m=1$ (wavelength of $2L_z$) from the present study, but Arioli & Gazzola (Reference Arioli and Gazzola2017) obtained its natural frequency. Currently, we do not know the reason for this difference. The natural frequency for the torsional vibration also linearly increases with the wavenumber $n_m$ but shows no dependence on the initial energy because (2.4) becomes linear with $Y_c=0$. To obtain the vortex-shedding frequency of the flow over the ‘stationary’ deck, a separate three-dimensional numerical simulation with the periodic boundary condition in the $z$ direction is conducted at the same Reynolds number of $Re= 10\ 000$. Figure 5 shows the contours of the instantaneous spanwise vorticity around the stationary deck and energy spectra of the vertical velocity $v$ at three different positions behind the deck. With the stationary deck, the flow shows a periodic alternating vortex shedding and the Strouhal number corresponding to the vortex-shedding frequency is $St=f_{vs}h/U = 0.111$. The same frequency is obtained for the fluctuating lift and moment coefficients as well. This Strouhal number closely matches the non-dimensional natural frequency of $f_{nat} h/U = 0.1\unicode{x2013}0.105$ at $n_m = 10$ (figure 4a), indicating that the vortex shedding behind a stationary deck triggers the natural frequency at $n_m=10$ (wavelength of $\lambda _z = L_z/5$). This wavelength is similar to what was observed during the vertical vibration of the TNB (Ammann et al. Reference Ammann, von Kármán and Woodruff1941).
Variations of the natural frequencies of the TNB for the (a) vertical and (b) torsional vibrations:  $\triangle$ (blue), Arioli & Gazzola (Reference Arioli and Gazzola2017) (initial energy at the energy threshold); $\triangledown$ (blue), Arioli & Gazzola (Reference Arioli and Gazzola2017) (initial energy close to 0); $\blacktriangle$ (red), present (initial energy of 101.7 MJ for (a) and 1.90 GJ for (b)); $\blacktriangledown$ (red), present (initial energy of 6.98 J for (a) and 19.0 J for (b)).

Flow over the stationary deck: (a) contours of the instantaneous spanwise vorticity; (b) energy spectra of the vertical velocity ( $v_{rms}$ is the root-mean-square vertical velocity fluctuations). In (b), ——— (red), $(x,y)=(3h,0)$; ——— (black), $(5h,0)$; ——— (blue), $(x,y)=(7h,0)$. These locations are denoted as $\times$ in (a).

3.2. Fluid–structure interaction
Figure 6 shows the temporal behaviours of the vertical displacement and rotational angle at the deck centre along the span. At early time instants ( $tU/h = 0 \sim 150$), the dominant wavelengths of $Y_c$ and $\theta _c$ are $n_m=1$ and 3 (see also figure 7). The occurrence of these wavelengths may be due to the abrupt start of the simulation ( $u=U, v=0,$ and $w=0$) at $t=0$. The vertical vibration starts at $tU/h > 250$, and changes into a torsional vibration at $tU/h \approx 550$ (see below for more details). We show in § 3.3 that these early vibration patterns at $t U/ h < 250$ are not required for the occurrence of the vertical vibration. As shown in figure 6(c), both the vertical displacement and rotational angle grow exponentially in time. However, unlike $Y_c$, $\theta _c$ is mainly composed of low wavenumber and frequency oscillations. For example, at $tU/h\le 400$, $Y_c$ contains both low and high wavenumber/frequency components, but $\theta _c$ has only low ones. At $tU/h = 500 \sim 600$, the high wavenumber/frequency components of $Y_c$ disappear, and both $Y_c$ and $\theta _c$ show very similar wavenumber/frequency characteristics at later time instants. To understand the wavenumber characteristics of $Y_c$ and $\theta _c$, we perform their discrete sine transforms; i.e. $Y_{c_j}/h$ (or $\theta _{c_j}) = \sum _{n_m=0}^{N} a_{n_m} \sin ( {\rm \pi}n_m j \Delta z/L_z )$ for $j=0,1,2,\ldots,N$ ( $N=2048$ and $\Delta z = L_z/N$), and the results are shown in figure 7. At $tU/h \approx 200$, $Y_c$ contains the primary peak at $n_m = 10$, secondary peak at $n_m = 11$ and tertiary peak at $n_m = 2$, showing that the vertical vibration at this time contains both high and low wavenumber components. On the other hand, $\theta _c$ has the primary peak at $n_m = 1$ (rotational vibration) and secondary peak at $n_m = 7$, and non-negligible peaks at $n_m = 2, 3$ and 5, showing quite different wavenumber characteristics from $Y_c$. The primary peak of $Y_c$ at $n_m = 10$ is closely associated with the vortex-shedding frequency. That is, the non-dimensional natural frequency of the deck at $n_m = 10$ is $0.1\unicode{x2013}0.105$ (figure 4a), and this frequency is very similar to the vortex-shedding frequency (figure 5b). In other words, at early time, the vertical vibration occurs in conjunction with the alternating vortex shedding. As time goes by, the contribution from $n_m = 2$ (torsional vibration) to $Y_c$ increases and becomes dominant at $tU/h = 498$ and 702, so does to $\theta _c$. Thus, $Y_c$ and $\theta _c$ have the same dominant frequency with same phase (see figure 6c). Note that the torsional vibration occurs at the wavelength of $L_z$ ( $n_m=2$), and its frequency is $fh/U = 0.025$, which is same as the natural frequency of $\theta _c$ at $n_m=2$ ( $f_{nat}h/U = 0.025$; figure 4b).
Temporal behaviours of the vertical displacement and rotational angle at the deck centre ( $x=0$): (a) $Y_c$; (b) $\theta _c$; (c) $Y_c$ (———, red) and $\theta _c$ (———, blue) at $z=L_z/4$. Note that the contour levels of the left and right figures in (a) and (b) are different. In (c), a zoom-in view of $Y_c(t)$ and $\theta _c(t)$ is given in $200 < tU/h < 300$.

Coefficients of the discrete sine series of (a)  $Y_c$ and (b) $\theta _c$ at different time instants. Note that the scales of the vertical axes at different time instants are different.

Figure 8 shows the temporal evolutions of the coefficients of the discrete sine series ( $a_{n_m=2}$ and $a_{n_m=10}$) of $Y_c$ and $\theta _c$, respectively. Here, $\vert a_{n_m=10} \vert$ of $Y_c$ exponentially grows until $tU/h \approx 400$ and decreases afterwards. On the other hand, $\vert a_{n_m=2} \vert$ values of both $Y_c$ and $\theta _c$ grow exponentially even after the decrease of $\vert a_{n_m=10} \vert$ of $Y_c$. Note that, at $200 < tU/h < 400$, $\vert a_{n_m=10} \vert$ of $Y_c$ is larger than $\vert a_{n_m=2} \vert$ of $Y_c$, indicating that the dominant wavelength of the vertical vibration at this time period is $\lambda _z=L_z/5$.
Temporal evolutions of the coefficients of the discrete sine series: (a)  $Y_c$; (b) $\theta _c$. Here, $\vert a_{n_m=2} \vert$ (———, blue) and $\vert a_{n_m=10} \vert$ (———, red).

As both  $Y_c$ and $\theta _c$ grow and the vibration changes from the vertical to the torsional mode, it is interesting to know when the vibration mode changes. For this purpose, we define a non-dimensional variable $\varDelta$ such as
 \begin{equation} \Delta(z,t)=(Y_{c_t}(z,t)+ l \theta_{c_t}(z,t))(Y_{c_t}(z,t) - l \theta_{c_t}(z,t))/U^{2}, \end{equation}
where the quantities in the first and second parentheses are the velocities of the right and left fences, respectively (see figure 3b). The vertical vibration dominates when  $\varDelta > 0$, and the torsional vibration is dominant otherwise. Although this criterion does not perfectly describe the dominance of one vibration over the other, it at least qualitatively provides an idea as to which of the two vibrations is dominant. The contours of $\Delta (z,t)$ and span-averaged $\varDelta$, $\bar \Delta (t)$, are shown in figure 9. Starting from small negative values (possibly due to the abrupt start of the free-stream velocity at $t=0$), $\Delta (z,t)$ is overall positive at $250 \le tU/h < 450$, and then it is predominantly negative at $tU/h > 550$. Thus, this figure clearly shows the vertical vibration, transition from the vertical to torsional vibration, and torsional vibration.
Relative strength of the vertical to torsional vibrations in time: (a) contours of  $\Delta (z,t)$; (b) $\bar \Delta (t)$.

Figure 10 shows the flow fields around the TNB at two different time instants corresponding to vertical and torsional vibrations. The flow separates from the left fence of the deck and vortices are shed alternately from the upper and lower sides, resulting in positive and negative lifts on the plate. At  $tU/h = 354$, the wavelength of the vertical vibration is $\lambda _z=L_z/5$ (figures 6a and 10c) and the deck at the position of $z = L_z/4$ stays nearly horizontal ( $\theta _{c_{max}} \simeq 3.3^{\circ }$ in figure 6b) and moves vertically (figures 10a and 10c). On the other hand, at $tU/h = 746$, the deck at the same spanwise position is significantly tilted, and a large leading edge vortex is formed on the lower side of the deck (figure 10b), causing strong aerodynamic moment on the deck. The wavelength of the torsional vibration is $\lambda _z = L_z$ (figure 10c). The peak frequencies of these vertical and torsional vibrations are $fh/U = 0.103$ (0.78 Hz) and 0.025 (0.19 Hz), respectively, which are similar to the recorded data ( $0.60\unicode{x2013}0.63$ and 0.18 Hz, respectively) of Ammann et al. (Reference Ammann, von Kármán and Woodruff1941) considering the uncertainty of the measurement at that time.
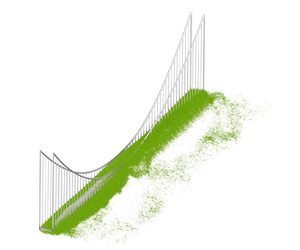
Instantaneous three-dimensional vortical structures (iso-surfaces of  $\lambda _2=-20$; Jeong & Hussain Reference Jeong and Hussain1995) coloured with the contours of the instantaneous pressure (left), and contours of the instantaneous spanwise vorticity at $z=L_z/4$ (denoted as rectangular planes on the left) (right): (a) $tU/h = 354$ (vertical vibration); (b) $tU/h = 746$ (torsional vibration). (c) $Y_c$ vs $z$ at $tU/h= 354$ (———, red) and $746$ (– – – – –, blue). Note that the bridge is scaled by 1/5 in the $z$ direction in (a,b).

The temporal variations of the vertical displacement, rotational angle and sectional lift and moment coefficients at  $z = L_z/4$ during $300 < tU/h < 700$ (including vertical and torsional vibration periods) are shown in figure 11. As shown in figure 11(a), during the vertical vibration ( $300< tU/h<400$), the frequency of the rotational angle is noticeably different from that of the vertical displacement, whereas the rotational angle and vertical displacement are in phase during the torsional vibration ( $tU/h > 500$). In figures 11(b) and 11(c), $Y_c$ is in phase with $C_{L_s}$ and $C_{M_s}$ during the vertical vibration, but is 180 $^{\circ }$ out of phase with $C_{L_s}$ and 90 $^{\circ }$ out of phase with $C_{M_s}$ during the torsional vibration. On the other hand, $\theta _c$ has a lower frequency than that of $C_{M_s}$ during the vertical vibration, but has the same frequency as that of $C_{M_s}$ and is 90 $^{\circ }$ out of phase with $C_{M_s}$ during the torsional vibration. This result indicates that the motion of the rotational angle, unlike the vertical displacement, is relatively insensitive to the force and moment on the deck during the vertical vibration, but both $Y_c$ and $\theta _c$ are strongly locked-in with the lift and moment exerted on the deck resulting from the vortex formation behind the deck. These phase relations among $Y_c$, $\theta _c$, $C_{L_s}$ and $C_{M_s}$ during the torsional vibration are closely related to the vortex formation around the deck, as shown in figure 12. Note that this vortex-formation frequency ( $f_{vf} h/U = 0.025$) is very different from the natural vortex-shedding frequency around the stationary deck. As $Y_c$ and $\theta _c$ become negative ( $tU/h = 676$), flow separates from the upper edge of the left fence and a large vortex is formed there, creating low pressure on the upper surface of the deck, resulting in positive lift and negative moment. As $Y_c$ and $\theta _c$ are negatively maximum ( $tU/h=685$), the lift is maximum and the moment is nearly zero. As the vortex formed above the upper surface travels toward the right part of the upper surface, positive moment is generated. Accordingly, the deck rotates counterclockwise (e.g. at $tU/h=688$). When $\theta _c > 0$, flow separation occurs at the lower edge of the left fence and a large vortex forms there, creating low pressure on the lower surface of the deck, resulting in negative lift and positive moment. Then, a process similar to that described above proceeds. This result clearly indicates that the torsional vibration is an aeroelastic fluttering (Scanlan Reference Scanlan1982; Billah & Scanlan Reference Billah and Scanlan1991).
Time traces of the vertical displacement, rotational angle and sectional lift and moment coefficients at  $z=L_z/4$: (a) $Y_c$ (———, red) vs $\theta _c$ (———, blue); (b) $Y_c$ (———, red) vs $C_{L_s}$ (– – – – –, red); (c) $\theta _c$ (———, blue) vs $C_{M_s}$ (– – – – –, blue). On the right figure of (c), $Y_c$ (———, red) is also added to show the phase differences from $\theta _c$ and $C_{M_s}$. Note that the scales of the $y$-axes are different between the left and right figures.

Motion of the deck at  $z = L_z/4$ during the torsional vibration and its relation with the sectional lift and moment exerted on the deck, together with the contours of the instantaneous spanwise vorticity. Here, the scarlet- and light-blue-coloured arrows indicate relative magnitudes of the sectional lift and moment, respectively.

The time traces of the total energy accumulated in the TNB are shown in figure 13, together with those containing  $Y_c$ and its derivatives ( $E_{Y_c}$) or $\theta _c$ and its derivatives ( $E_{\theta _c}$) in (2.6)–(2.10), where
 \begin{align} E_{Y_c}&= \frac{M}{2}\int_{0}^{L_z}{{Y_c}_t^{2}}\, {{\rm d}}z+m\int_{0}^{L_z}{{Y_c}_t^{2}\xi \, {{\rm d}}z} +Mg\int_{0}^{L_z}{Y_c \, {{\rm d}}z}\nonumber\\ &\quad +2mg\int_{0}^{L_z}{Y_c \xi \, {{\rm d}}z}+\frac{EI}{2} \int_{0}^{L_z}{{Y_c}_{zz}^{2} \, {{\rm d}}z}\nonumber\\ &\quad +2H_0\int_{0}^{L_z}{\xi \left( \sqrt{1+{( s'+ Y_{c_z} )^{2}}}- \sqrt{1+s'^{2}} \right)}\, {{\rm d}}z\nonumber\\ &\quad +\frac{AE}{L_c}{\left( \int_{0}^{L_z}{\sqrt{1+{( s'+Y_{c_z})}^{2}}\, {{\rm d}}z}-{L_c} \right)^{2}}, \end{align}
 \begin{align} E_{\theta_c}&=\frac{M}{6}\int_{0}^{L_z}{{l^{2}}{\theta_c}_t^{2}}\, {{\rm d}}z +m\int_{0}^{L_z}{l^{2}{\theta_c}_t^{2}\xi \, {{\rm d}}z}+\frac{GK}{2} \int_{0}^{L_z}{{\theta_c}_z^{2}\, {{\rm d}}z}\nonumber\\ &\quad +H_0\int_{0}^{L_z}{\xi \left( \sqrt{1+{{( s'- l\theta_{c_z} )}^{2}}} -\sqrt{1+s'^{2}} \right)}\, {{\rm d}}z\nonumber\\ &\quad +\frac{AE}{2L_c}{\left( \int_{0}^{L_z}{\sqrt{1 +{( s'-l\theta_{c_z} )}^{2}}\, {{\rm d}}z}-{L_c} \right)^{2}} \nonumber\\ &\quad +H_0\int_{0}^{L_z}{\xi \left( \sqrt{1+{{( s'+ l\theta_{c_z} )}^{2}}}-\sqrt{1+s'^{2}} \right)}\, {{\rm d}}z\nonumber\\ &\quad +\frac{AE}{2L_c}{\left( \int_{0}^{L_z}{\sqrt{1 +{( s'+l\theta_{c_z} )}^{2}}\, {{\rm d}}z}-{L_c} \right)^{2}}. \end{align}
At very early time ( $tU/h < 165$), $E_{Y_c}$ is smaller than $E_{\theta _c}$, and becomes larger than $E_{\theta _c}$ at $165 < tU/h <570$. The growth rate of $E_{\theta _c}$ is much bigger than that of $E_{Y_c}$ at $tU/h > 350$; $E_{\theta _c}$ becomes bigger than $E_{Y_c}$ at $tU/h > 570$, and the total energy in the TNB is mainly determined by the torsional vibration at this time period. On the other hand, the growth rate of $E_{Y_c}$ suddenly decreases at $tU/h \approx 350$ and $E_{Y_c}$ shows a limited amplitude growth unlike $E_{\theta _c}$. This behaviour is very similar to that of $|a_{n_m=10}|$ of $Y_c$ (figure 8(a); cases with $Y_c\equiv 0$ or $\theta _c\equiv 0$ are separately simulated and their results are given in § 3.3, where further discussions are made). Note that, in the absence of the free-stream velocity, the threshold energy level above which the vertical vibration changed into the torsional vibration was 82.1 MJ for $n_m = 10$ according to Arioli & Gazzola (Reference Arioli and Gazzola2017). However, as shown in figure 13, the torsional vibration starts even with a much lower energy level ( $E_{Y_c} =846$ kJ at $tU/h = 350$) in the presence of the free-stream velocity (or with fluid–structure interaction).
Time traces of the energy accumulated in the TNB: ——— (black), total energy (sum of (2.6)–(2.10)); ——— (red),  $E_{Y_c}$ (energy containing $Y_c$ and its derivatives only); ——— (blue), $E_{\theta _c}$ (energy containing $\theta _c$ and its derivatives only); – – – – – (SkyBlue), $E_{L,Y_c}$; – – – – – (VioletRed), $E_{M,\theta _c}$.

In figure 13, we also compare  $E_{Y_c}$ and $E_{\theta _c}$ with $E_{L,Y_c}$ and $E_{M,\theta _c}$ (energy accumulated in the bridge by the aerodynamic lift and moment, respectively), where $E_{L,Y_c}$ and $E_{M,\theta _c}$ are defined as
 $$\begin{gather} E_{L,Y_c}(t)=\int_{0}^{t}{\int_{0}^{L_z}{Y_{c_t}(z,t){L_s} (z,t)\, {{\rm d}}z} \, {{\rm d}}t}, \end{gather}$$
 $$\begin{gather}E_{M,\theta_c}(t)=\int_{0}^{t}{\int_{0}^{L_z}{\theta_{c_t}(z,t) {M_s}(z,t)\, {{\rm d}}z} \, {{\rm d}}t}. \end{gather}$$
The energy accumulated in the TNB by the aerodynamic force and moment are very similar to  $E_{Y_c}$ and $E_{\theta _c}$, respectively, verifying that the sources of the vertical and torsional vibrations are indeed the aerodynamic lift and moment, respectively.
3.3. Further study of the vertical and torsional vibrations
In this section, we perform a few more numerical simulations to obtain the critical flutter wind speed and investigate the roles of the free-stream velocity and vertical vibration in the growth of the torsional vibration. Figure 14 shows the temporal behaviours of  $Y_c$ and $\theta _c$ when the fluid flow is removed at $tU/h \ge 400$ (i.e. only (2.3) and (2.4) without the aerodynamic terms containing $C_{L_s}$ and $C_{M_s}$ being solved). The amplitudes and wavelengths of $Y_c$ and $\theta _c$ do not change in time, unlike those in figure 6. This result indicates that the presence of fluid flow or fluid–structure interaction is required for the transition to torsional vibration, when the energy of the vertical vibration is not sufficiently high. To see if the existence of the vertical vibration is required for the initiation of the torsional vibration even in the presence of fluid flow, we perform two additional simulations with $Y_c \equiv 0$ (i.e. no vertical displacement is allowed) or $\theta _c \equiv 0$ (i.e. no angular displacement is allowed) in the presence of the free-stream velocity, and their results are shown in figure 15. Even without vertical vibration, the torsional vibration with $\lambda _z = L_z$ ( $n_m=2$) occurs, and the energy growth rate is slightly lower than that of the natural case (figure 13), suggesting that the vertical vibration is not a necessary condition for the occurrence and rapid growth of the torsional vibration in the presence of fluid flow. Meanwhile, we observed in figure 13 that the growth of the vertical displacement becomes slow during the torsional vibration as compared with that of the angular displacement. Whether this slow growth of $Y_c$ is due to the occurrence of the torsional vibration or not, the growth of the vertical displacement with $\theta _c \equiv 0$ (in the absence of the angular displacement) is shown in figures 15(b) and 15(c). The vertical vibration with the same wavelength ( $n_m = 10$) and frequency ( $fh/U=0.103$) as those of the natural case evolves after an early transition period, and the energy of $Y_c$ is saturated at $tU/h > 400$ at a lower magnitude than that of the natural case. In general, lock-in is not necessarily induced by resonance, and can arise from instability of the structure (De Langre Reference De Langre2006; Zhang et al. Reference Zhang, Li, Ye and Jiang2015; Gao et al. Reference Gao, Zhang, Li, Liu, Quan, Ye and Jiang2017). However, the present result suggests that the slow growth of $Y_c$ is not directly caused by the occurrence of torsional vibration, and the vertical vibration itself does not evolve into fluttering even in the presence of fluid flow but only experiences the resonance-induced lock-in.
Temporal behaviours of the vertical displacement and rotational angle when the fluid flow is removed at  $tU/h \ge 400$: (a) $Y_c$; (b) $\theta _c$. Here, the maximum values of $Y_c/h$ and $\theta _c$ at $tU/h = 750$ are 0.13 and 3.6 $^{\circ }$, respectively.

Temporal behaviours of the angular and vertical displacements and energy ( $Y_c \equiv 0$ or $\theta _c \equiv 0$): (a) $\theta _c$ with $Y_c \equiv 0$; (b) $Y_c$ with $\theta _c \equiv 0$; (c) energy (——— (blue), $E_{\theta _c}$ ( $Y_c \equiv 0$); ——— (red), $E_{Y_c} (\theta _c \equiv 0$); – – – – – (blue), $E_{\theta _c}$ (natural case); – – – – – (red), $E_{Y_c}$ (natural case)).

So far, we have shown that the torsional vibration grows exponentially at  $U=18$ m s $^{-1}$ ( ${Re}=10\ 000$) even if the vertical displacement is set to zero, but it does not grow in the absence of the free-stream velocity when the energy of the vertical displacement is not sufficiently high. On the other hand, it was shown by Arioli & Gazzola (Reference Arioli and Gazzola2017) that the torsional vibration suddenly increases in the absence of the free-stream velocity when the initial vertical displacement is large enough. From these results, one can expect that there must be a critical free-stream velocity from which the torsional vibration rapidly grows under zero initial vertical displacement. To see if the torsional vibration does not grow at a lower free-stream velocity, we perform a few more simulations at $U=9$, 8, 6 and 2.25 m s $^{-1}$, respectively, corresponding to ${Re} \approx 5000, 4444, 3333$ and 1250. The temporal evolutions of $E_{\theta _c}$ and $E_{Y_c}$ for different free-stream velocities are shown in figure 16. At $U \ge 9$ m s $^{-1}$, $E_{\theta _c}$ grows exponentially and is bigger than $E_{Y_c}$, indicating that the torsional vibration is dominant. On the other hand, at $U \le 8$ m s $^{-1}$, $E_{\theta _c}$ and $E_{Y_c}$ are saturated and $E_{\theta _c}$ is much smaller than $E_{Y_c}$, indicating that the vertical vibration is dominant (for example, the maximum angular displacement is less than 1 degree for $U = 8$ m s $^{-1}$). Since the natural frequency of the torsional mode ( $n_m = 2$) is $f_{nat} = 0.025 U/h = 0.1875$ Hz (figure 4b) and $B = 2l = 5h = 12$ m in the present study, the non-dimensional critical flutter wind speed obtained from the present study is $3.56 < U_c/(f_{nat} B) \le 4$, where $U_c/(f_{nat} B) = 3.56$ and 4 correspond to $U = 8$ and 9 m s $^{-1}$, respectively. This result agrees very well with the previous ones: i.e. $U_c/(f_{nat}B)=4$ by Matsumoto, Shirato & Hirai (Reference Matsumoto, Shirato and Hirai1992), 3.55 by Scanlan (Reference Scanlan1999), $3.6\unicode{x2013}4$ (instability analysis) and $4$ (numerical simulation) by Larsen (Reference Larsen2000), 4 by Szabó et al. (Reference Szabó, Györgyi and Kristóf2020) and 3.5–4.4 by Hu et al. (Reference Hu, Zhao and Ge2022). It is also noteworthy that Ammann et al. (Reference Ammann, von Kármán and Woodruff1941) obtained $U_c/(f_{nat}B)=4$ for a two-dimensional H-section (wind tunnel test), but failed to obtain a reasonable critical wind speed for a 1 : 234 scale full model of the TNB.
Comparison of  $E_{\theta _c}$ and $E_{Y_c}$ for different free-stream velocities: black lines, $U=18$ m s $^{-1}$; green lines, $U=9$ m s $^{-1}$; red lines, $U=8$ m s $^{-1}$; blue lines, $U=6$ m s $^{-1}$; purple lines, $U=2.25$ m s $^{-1}$. Here, solid and dashed lines are for $E_{\theta _c}$ and $E_{Y_c}$, respectively.

The lowest Reynolds number at which vortex shedding occurs behind a stationary deck cross-section is obtained as  ${Re}_{cr}=89$ by performing additional two-dimensional simulations. It has been reported that a vortex-induced vibration (VIV) may occur even in the sub-critical regime where no vortex shedding exists for stationary structures (Cossu & Morino Reference Cossu and Morino2000; Mittal & Singh Reference Mittal and Singh2005; Kou et al. Reference Kou, Zhang, Liu and Li2017). Whether a similar phenomenon occurs for the present TNB, we perform two additional simulations at ${Re} = 75$ and 50. For both Reynolds numbers, the maximum vertical and angular displacements, $Y_c/h$ and $\theta _c$, are less than $2 \times 10^{-6}$ and ${10^{-4}}^{\circ }$, respectively, indicating that VIV does not occur at these sub-critical Reynolds numbers for the TNB.
4. Conclusions
The vertical vibration and transition to torsional vibration of the TNB were examined by large-scale three-dimensional direct numerical simulation using  $13.4$ billion grid points and maximum 160 000 MPI processes. Real-scale structural parameters of the bridge were used for the simulation, and the vertical ( $Y_c$) and rotational ( $\theta _c$) displacements of the deck centre were observed to investigate the vertical and torsional motions of the bridge. The Reynolds number based on the free-stream velocity and height of the deck fence was lower ( $Re= 10\ 000$) than the actual one on the day of the collapse ( $Re= 3.06 \times 10^{6}$), but the magnitudes of fluid properties were adjusted to provide the real-scale aerodynamic force and moment on the bridge deck. Fluid–structure interaction of the wind and bridge was also employed. The wavelengths and frequencies of the vertical and torsional vibrations showed good agreement with the recorded data of the incident.
The natural frequency of the vertical vibration ( $f_{nat} h/U=0.1\unicode{x2013}0.105$) with a wavelength of $\lambda _z = L_z/5$ was very similar to the vortex-shedding frequency of the flow over a stationary deck ( $f_{vs} h/U=0.111$), which indicated that the vertical vibration was induced by the lock-in with the vortex shedding. After the saturation of the vertical vibration, a torsional vibration started and grew exponentially in time. During the vertical vibration, the vertical displacement was in phase with the sectional aerodynamic lift (but not with the rotational angle). However, during the torsional vibration, the vertical displacement and rotational angle of the deck were closely associated with the fluid flow, i.e. the vertical displacement was in phase with the rotational angle, 180 $^{\circ }$ out of phase with the sectional aerodynamic lift and 90 $^{\circ }$ out of phase with the sectional aerodynamic moment. The transition from the vertical to torsional vibration was indicated by suggesting a new non-dimensional variable $\varDelta$ by comparing the relative strength of the vertical to torsional vibrations. The magnitudes of the energy from the vertical and angular displacements mostly consisted of the energy accumulated by the aerodynamic lift and moment, respectively, indicating close interaction between the bridge and fluid flow. Initially, the energy containing the vertical displacement exponentially grew in time and then became saturated. After the saturation of the vertical displacement energy, the energy of the angular displacement grew exponentially in time and became much larger than that of the vertical displacement. By testing a few more free-stream velocities, we showed that the critical flutter wind speed is $3.56 < U_c / (f_{nat} B) \le 4$, where $f_{nat}$ is the natural frequency of the torsional vibration, and $B$ is the deck cross-section width. This critical wind speed agreed very well with those by previous studies (Ammann et al. Reference Ammann, von Kármán and Woodruff1941; Matsumoto et al. Reference Matsumoto, Shirato and Hirai1992; Scanlan Reference Scanlan1999; Larsen Reference Larsen2000; Szabó et al. Reference Szabó, Györgyi and Kristóf2020; Hu et al. Reference Hu, Zhao and Ge2022).
We also showed that the presence of fluid flow is required for the development of the torsional vibration, when the vertical vibration energy is not sufficiently high. For example, the energy accumulated in  $Y_c$ and $\theta _c$ ( $E_{Y_c}$ and $E_{\theta _c}$, respectively) revealed that the torsional vibration sufficiently grows even with $E_{Y_c} =846$ kJ at $tU/h=350$, which is much lower than the energy threshold of instability (82.1 MJ) of the vertical mode ( $n_m=10$) in the absence of the free-stream velocity suggested by Arioli & Gazzola (Reference Arioli and Gazzola2017). The vortex-formation frequency during the torsional vibration was significantly different from the natural vortex-shedding frequency behind the stationary TNB deck, and the energy accumulated by the aerodynamic lift and moment matched well with $E_{Y_c}$ and ${E_{\theta _c}}$, respectively, meaning that the torsional instability occurs through the aeroelastic fluttering. Apart from the real vibration process during the collapse of the TNB in 1940, we conducted a simulation by setting a zero vertical displacement. The torsional vibration still developed through a large-amplitude aerodynamic fluttering even in the absence of the vertical vibration.
Finally, we would like to mention two approximations made in the present study. One is that the structural damping effect was neglected in the present nonlinear structure model (Arioli & Gazzola Reference Arioli and Gazzola2017), and thus the energy growth might be over-predicted. Introducing the damping effect may reduce the natural frequencies of the vertical and torsional modes and delay their growth, but the essential vibration patterns are not expected to change significantly. The second is that we used a much lower Reynolds number than the real one in 1940. Thus, there exist some effects from small-scale turbulence that was not resolved in the present simulation, but we expect that the force and moment generated by those small scales have no significant effect on the TNB vibration motion.
Funding
This work was supported by the Korea Institute of Science and Technology Information (P20015), the National Supercomputing Center with supercomputing resources including technical support (KSC-2020-CHA-0005) and the National Research Foundation through the Ministry of Science and ICT (2019R1A2C2086237 and 2022R1A2B5B02001586).
Declaration of interests
The authors report no conflict of interest.


 Open access