




1. Introduction
Hul’q’umi’num’ is a Salish language spoken on southeastern Vancouver Island and the adjacent Gulf Islands (British Columbia, Canada). Although there are fewer than 40 remaining first-language (L1) Hul’q’umi’num’ speaking elders, there is also a vibrant community of committed language activists engaging in Hul’q’umi’num’ revitalization (First Peoples’ Cultural Council, 2022). Thanks to decades-long collaborations between community-based and university-based Hul’q’umi’num’ linguists, comprehensive documentation exists in the form of dictionaries (e.g., Cowichan Valley School District, 2013; Gerdts et al., Reference Gerdts, Edwards, Ulrich and Compton1997), stories (e.g., Gerdts, Reference Gerdts2015; Hul’q’umi’num’ Language & Culture Collective, 2015), and educational materials (Cowichan Valley School District, 2024; Harris, Reference Harris2016; Hul’q’umi’num’ Language & Culture Collective, 2016). Language programming has also increased in the past decade; for instance, both Simon Fraser University and the University of Victoria offer post-secondary programmes in Hul’qumi’num’ language and linguistics. These initiatives have contributed to an emerging base of adult second-language (L2) speakers (Bird et al., Reference Bird, Leonard, Nolan, Levis and Guskaroska2022) who teach and research the language. While L2 speakers currently comprise the majority of the Hul’q’umi’num’ speaker base, recent revitalization efforts have also established early immersion programmes in homes and schools, promoting learning among young children (e.g., First Peoples’ Cultural Council, 2014; Ryan, Reference Ryan2022).
From a scholarly perspective, the study of Hul’q’umi’num’ presents an opportunity to assess and refine the generalizability of theories of early language acquisition, both because of its sound system and because of the complex bilingual/revitalization context in which it is spoken. For example, recent reviews reveal that work outside of historically well-studied languages is relatively rare in major journals (e.g., Cristia et al., Reference Cristia, Foushee, Aravena-Bravo, Cychosz, Scaff and Casillas2023; Kidd & Garcia, Reference Kidd and Garcia2022). In their comprehensive review of publications over the past 45 years in four child language acquisition journals, Kidd and Garcia (Reference Kidd and Garcia2022) found that only 1.5% of the world’s languages were described in one or more articles, with a strong skew towards Indo-European languages, especially English, and a predominant focus on monolingual children. Nonetheless, research on understudied languages, particularly those that are typologically distinct from Indo-European languages, has challenged prior expectations about universal properties of language acquisition, for example, by documenting early passive constructions in K’iche’ Mayan (Pye & Poz, Reference Pye and Poz1988), or illuminating an early verb bias in some Mayan languages as opposed to the noun bias documented in many Indo-European languages (Brown, Reference Brown1998; Casillas et al., Reference Casillas, Foushee, Girón, Polian and Brown2024). Salish languages, with their rich phonological and morphological systems, could extend this work by facilitating further tests of how speech production develops across typologically diverse languages (e.g., Cook, Reference Cook2006, on Dëne Sųłiné; Mahura & Pascoe, Reference Mahura and Pascoe2016, on Setswana; Maphalala et al., Reference Maphalala, Pascoe and Smouse2014, on isiXhosa; and Pye et al., Reference Pye, Mateo Pedro, Pfeiler and Stengel2017, on Mayan languages). In addition, across Salish-language-speaking communities, children are mostly acquiring the language from adult L2 speakers, with exposure varying among children from just a few hours per week to a daily basis at home. Currently, very little is known about this unique mode of language acquisition in children, and it is not possible to learn about it by studying the acquisition of majority languages.
Aside from the fact that Salish language development is not well described in the scientific literature, documenting language acquisition in Indigenous language communities can also directly support revitalization efforts (Chee & Henke, Reference Chee, Henke, Dagostino, Mithun and Rice2024). Children learning their language in a revitalization context face challenges that may differ from those faced by children learning a majority language. Some of these are familiar across minority-language learners (e.g., heritage learners): the amount of target language input can vary greatly among individuals and does not always correlate with age (Hoff & Core, Reference Hoff and Core2013), and lexical items may bear culturally specific functions or semantic nuances differing from those of their dominant-language counterparts (Lipner et al., Reference Lipner, Armon-Lotem, Walters and Altman2021). However, other challenges are specific to language revitalization contexts, where children may be exposed to input primarily from L2 speakers, with limited exposure to L1 speakers. Speech communities may also lack anecdotal norms of early acquisition that arise through natural intergenerational transmission. Research on language acquisition can therefore be particularly valuable, guiding caregivers’, teachers’, and clinicians’ expectations of which structures are typically acquired at different developmental stages (Chee & Henke, Reference Chee, Henke, Dagostino, Mithun and Rice2024), setting standards for typical versus delayed language development (Edwards & Beckman, Reference Edwards and Beckman2008a) and focusing teaching and clinical intervention on areas of difficulty unlikely to resolve naturally with age and experience.
The current study focuses on the emerging production of Hul’q’umi’num’ consonants by young children, with the dual aim of contributing to the broader literature on early phonological development and informing expectations for acquisition trajectories among children learning Hul’q’umi’num’ in a community-based revitalization context. This research represents an ongoing collaboration between community members involved in early Hul’q’umi’num’ programming and university-based researchers. This paper begins by providing background information on the Hul’q’umi’num’ language, its sound system, and its challenges for learners. We then outline our experimental design, including both a simple count analysis and more complex loglinear analyses. Finally, we present a preliminary discussion of the developmental pathway of early Hul’q’umi’num’ phonological acquisition and its implications for the wider literature.
2. Background
Studying adult L2 pronunciation is often a priority in language revitalization contexts, both to support learners and to guide decision-making about how to manage variation, as the speaker base shifts from primarily L1-speaking elders to L2-speaking adults (Bird & Kell, Reference Bird and Kell2017). Language revitalization communities that are working towards full intergenerational transmission may also experience a transition in focus from creating competent L2 adults or older children to creating opportunities for earlier childhood exposure in the home and community, leading to another gradual shift in speakerhood from largely L2-speaking adults to also L2-acquiring children and eventually L1-acquiring children (Chee & Henke, Reference Chee, Henke, Dagostino, Mithun and Rice2024; Hinton & Meek, Reference Hinton, Meek, Coronel-Molina and McCarty2016). Studying child speech production, therefore, becomes central to understanding how to support young L2 speakers and new L1 speakers in revitalizing communities (Chee & Henke, Reference Chee, Henke, Dagostino, Mithun and Rice2024; O’Grady & Hattori, Reference O’Grady and Hattori2016). For English and other majority languages, norms for productive consonant repertoires throughout early childhood have been established for decades (e.g., Grunwell, Reference Grunwell1981; Sander, Reference Sander1972; Smit et al., Reference Smit, Hand, Freilinger, Bernthal and Bird1990) and serve as the basis of phonological assessment and evaluation (Bernhardt & Stemberger, Reference Bernhardt, Stemberger, Li, Pollock and Gibb2020; Edwards & Beckman, Reference Edwards and Beckman2008a). Increasingly, there are efforts to understand the trajectory of consonant production acquisition across a larger range of languages (McLeod & Crowe, Reference McLeod and Crowe2018). However, very little is known about child language acquisition in Salish languages, which include several sounds that, to our knowledge, have not previously been documented in studies on child language acquisition (e.g., glottalized resonants), in addition to the commonplace occurrence of complex consonant clusters. Because we do not have language-appropriate benchmarks for the trajectory of phonological development in languages with these properties, we also do not have assessment tools and training strategies that might help children who are lagging behind. As noted by several scholars in the field (Chee & Henke, Reference Chee, Henke, Dagostino, Mithun and Rice2024; Dench et al., Reference Dench, Cleave, Tagak and Beddard2011; McLeod & Crowe, Reference McLeod and Crowe2018), and as introduced above, documenting cross-linguistic similarities and differences to establish evidence-based norms in understudied languages is a critical step in enhancing pedagogical and clinical practice in diverse communities.
2.1. Hul’q’umi’num’ sounds and adult acquisition
Table 1 shows the consonant inventory of Hul’q’umi’num’. Our analysis demarcates the inventory into consonants that are unique to Hul’q’umi’num’ versus consonants that are shared between Hul’q’umi’num’ and English (Bird et al., Reference Bird, Leonard, Nolan, Levis and Guskaroska2022). Shared consonants include all sounds that appear in any English phonetic contexts, including sounds that are limited in their distribution, like the glottal stop that appears only word-initially and intervocalically in English. This shared set also includes consonant sounds that are single sounds in Hul’q’umi’num’ but appear in sequence in English, such as [kʷ] in queen and acquire, and [ts] in Betsy and cats.
Hul’q’umi’num’ consonants by place and manner of articulation

Table 1. Long description
The table organizes consonants by Manner of Articulation (rows) and Place of Articulation (columns). Each entry includes the Hul’q’umi’num’ orthography in italics followed by the I P A symbol in forward slashes.
* Manner of Articulation rows: Stops, Glottalized stops, Affricates, Glottalized affricates, Fricatives, Resonants, and Glottalized resonants.
* Place of Articulation columns: Labial, Dental, Alveolar, Lateral, Palatal, Velar, Labialized velar, Uvular, Labialized uvular, and Glottal.
Key data points:
* Stops: Labial p /p/, Alveolar t /t/, Velar k /k/, Labialized velar kw /k super w/, Uvular q /q/, Labialized uvular qw /q super w/, Glottal ’ /glottal stop/.
* Glottalized stops: Labial p’ /p glottalized/, Alveolar t’ /t glottalized/, Labialized velar kw’ /k super w glottalized/, Uvular q’ /q glottalized/, Labialized uvular qw’ /q super w glottalized/.
* Affricates: Dental tth /t theta/, Alveolar ts /ts/, Palatal ch /t esh/.
* Glottalized affricates: Dental tth’ /t theta glottalized/, Alveolar ts’ /ts glottalized/, Lateral tl’ /t belt-l glottalized/, Palatal ch’ /t esh glottalized/.
* Fricatives: Dental th /theta/, Alveolar s /s/, Lateral lh /belt-l/, Palatal sh /esh/, Labialized velar hw /x super w/, Uvular x /chi/, Labialized uvular xw /chi super w/, Glottal h /h/.
* Resonants: Labial m /m/, Alveolar n /n/, Lateral l /l/, Palatal y /j/, Labialized velar w /w/.
* Glottalized resonants: Labial m’ /m glottalized/, Alveolar n’ /n glottalized/, Lateral l’ /l glottalized/, Palatal y’ /j glottalized/, Labialized velar w’ /w glottalized/.
Note: Bold font indicates consonants that appear in Hul’q’umi’num’ only. To accommodate both readers from the language community as well as those familiar with the IPA, this figure uses Hul’q’umi’num’ orthography in italics followed by IPA symbols in slashes. Throughout the text, we use the IPA in reference to specific sounds.
Notably, Hul’q’umi’num’ makes extensive use of glottal articulations, with ejective stops /p’ t’ kw’ q’ qw’/ and affricates /tᶿ’ tl’ ts’ tʃ’/, glottal stop–which carries a fairly heavy functional load–and glottalized resonants /m’ n’ l’ y’ w’/. Glottalized resonants are rare cross-linguistically, found in only 20 of the 317 languages surveyed by Maddieson (Reference Maddieson1984). They consist of a resonant with secondary glottalization (either a full glottal stop or creakiness). Phonologically, they count as single, complex consonants rather than as sequences of resonant + glottal. Timing is determined on a language-specific basis (Bird et al., Reference Bird, Marion, Fiona, Bryan and Patricia2008); in Hul’q’umi’num’, the timing of glottalization depends on the position of the glottalized resonant with respect to the stressed vowel: Post-glottalization is the default (e.g., sxun’u [ˈsxənˀə] “foot, leg”; chichkun’ [ˈtʃitʃkənˀ] “chick”); pre-glottalization only occurs if the glottalized resonant immediately follows a stressed, short, full vowel (e.g., yuse’lu [juˈseˀlə] “two”).
Hul’q’umi’num’ also contains more phonemic place contrasts than English, particularly among obstruents. For instance, Hul’q’umi’num’ contrasts velar and uvular stops and fricatives, with secondary labialization at both places (/k kʷ kʷ’ q q’ qʷ qʷ’ xʷ χ χʷ/). There are also extensive fricative and affricate series in the coronal region (/θ s ɬ ʃ/ and /tθ tθ’ ts ts’ tɬ’ tʃ tʃ’/). Adding to the complexity of the sound system, Hul’q’umi’num’ words can include long sequences of consonants (clusters), for example, in hwthtiwun /xʷθtiwən/ “think” and hwtth’xwuw’i’tst /xʷtᶿ’χ w əw’i’tst/ “wash someone’s back” (Bird et al., Reference Bird, Leonard, Nolan, Levis and Guskaroska2022), although in our child-directed word set, two-consonant clusters were the most frequent.
Prior literature documents production patterns by L1 English adults learning Coast Salish languages, including Hul’q’umi’num’ and neighbouring SENĆOŦEN, with deviations from L1 speaker norms treated as errors (e.g., Bird et al., Reference Bird, Gerdts and Leonard2016, Reference Bird, Leonard, Nolan, Levis and Guskaroska2022). The term error is used relative to these reference norms and does not preclude the possibility that some variants occur in specific contexts or overlap with L1 variation. All target forms are attested among L1 and L2 speakers, indicating that the L1 norms referenced are not merely assumed underlying forms. In Hul’q’umi’num’, common errors include de-ejectivizing ejectives and de-glottalizing glottalized resonants (e.g., /k w ’et’ən’/ → [k w etən] for kw’et’un’ “mouse”), substituting /ɬ/ for /θ/ (e.g., /snəxʷəɬ/ → [snəxʷəθ] for snuhwulh “canoe race”) and vice versa, altering the place of articulation of Hul’q’umi’num’-only consonants to match English ones (e.g., /qiq’qəq’əl’s/ → [kikkəkəl’s] for qiq’quq’ul’s “policemen”), producing affricates as stops (e.g., /st͡seːɬtən/ → [steːɬtən] for stseelhtun “salmon”) or fricatives (/t͡siːtməxʷ/ → [siːtməxʷ] for tsiitmuhw “owl”), producing fricatives as stops (e.g., /ʔesxʷ/ → [ʔeskʷ] for ‘es-hw “seal”), and reducing consonant clusters (e.g., /t͡s’ɬxʷəlməxʷ/ → [t͡s’xʷəlməxʷ] for ts’lhhwulmuhw “fellow First Nations person”) (Bird et al., Reference Bird, Gerdts and Leonard2016, Reference Bird, Leonard, Nolan, Levis and Guskaroska2022).
In neighbouring SENĆOŦEN, common adult errors include substituting /k/ for any velar and uvular consonants, inserting vowels into clusters, and omitting glottal stops (Bird & Kell, Reference Bird and Kell2017). These errors reflect a general preference for the L1 English phonological system, with difficulty acquiring new segments and syllable types, maintaining non-English contrasts, and knowing when sounds – such as glottal stops – are lexically contrastive. We expect to see some of these patterns reflected in the children’s speech studied here, as well as in their caregivers’ speech. It is also critical to note that errors are typically measured against L1 speakers – often elders – but that Coast Salish communities are currently navigating what constitutes acceptable variation over time, and which differences should be addressed as learners fine tune their pronunciation (Bird & Kell, Reference Bird and Kell2017).
2.2. Predictions for Hul’q’umi’num’ acquisition
The Hul’q’umi’num’-learning children in this study are L1 English speakers, reflecting the wider community. They are learning Hul’q’umi’num’ in an early L2 acquisition context, at home and in community-based language programmes. We therefore considered acquisition patterns in L1 English as well as in other languages that share non-English sounds with Hul’q’umi’num’. Together with existing research on bilingual effects and on adult L2 Hul’q’umi’num’ effects, these patterns provide a basis for predicting the trajectory of Hul’q’umi’num’ speech acquisition.
Among typically developing monolingual English-learning children, consonants emerge gradually over early childhood, with plosives, nasals, and glides acquired earliest, followed by affricates and fricatives. Sander (Reference Sander1972) reported that plosives /p b t d k g/, nasals /m n ŋ/, and glides /w j/ are customarily produced by ages 1;6–2;0 and mastered by 3;0–4;0, where “customary production” and “mastery” refer to 50% and 90% accuracy, respectively. Liquids /l ɹ/ and affricates /tʃ dʒ/ develop later, with customary production by 3;0–4;0 and mastery by 6;0–8;0 (Sander, Reference Sander1972). Fricatives show the greatest variability, as /h f/ are customarily produced by 1;6–2;0 and mastered by 3;0–4;0, while /v s z θ ð ʃ ʒ/ are customarily produced by 3;0–5;0 and mastered by 7;0–8;0 (Sander, Reference Sander1972). More recent data from Dodd et al. (Reference Dodd, Holm, Hua and Crosbie2003), based on British English-speaking children, suggest slightly earlier acquisition for some consonants, with acquisition defined as correct spontaneous production or imitation by 90% of children in each age group. While plosives, nasals, and glides are acquired by 3;5, similar to Sander’s (Reference Sander1972) findings, affricates /tʃ dʒ/ are acquired earlier, by 4;0 to 4;5; fricatives /f v s z h/ are acquired by 3;0–3;5; /ʒ/ by 4;0–4;5, /ʃ/ by 5;0–5;5, and /θ ð/ after 7;0. Overall, both studies show a consistent order of development but variation in the timing of mastery.
McLeod and Crowe’s (Reference McLeod and Crowe2018) cross-linguistic review of consonant acquisition (64 studies, 27 languages) provides a further reference point for Hul’q’umi’num’, particularly its non-English consonants. They report that by age 5, typically developing children produce at least 93% of their language’s consonants. In addition, plosives and non-pulmonic sounds (in their review, clicks and ejectives) tend to precede fricatives and affricates. For example, L1 isiXhosa learners acquire most nasals, glides, unaspirated plosives, implosives, and some clicks by 3;0, and aspirated plosives, fricatives, and trills by 4;1, with some affricates and other clicks – especially nasal clicks – still developing at 6;0 (Maphalala et al., Reference Maphalala, Pascoe and Smouse2014; Pascoe et al., Reference Pascoe, Rossouw, Fish, Jansen, Manley, Powell and Rosen2016). Similarly, Setswana-learning children acquire most ejectives, nasals, fricatives, and approximants by 3;5, but rounded aspirated ejectives, uvular fricatives, and rounded voiced affricates remain difficult until 4;0, while trills—especially rounded trills—are acquired by 6;0 (Mahura & Pascoe, Reference Mahura and Pascoe2016). In Amharic, children typically master most singleton ejectives by 4;0, with de-ejectivization as the most frequent error (Alamirew & Mekonnen, Reference Alamirew and Mekonnen2021). Overall, the delayed mastery of affricates, rounded consonants, and fricatives, together with the observation that when errors occur, ejectives are mostly de-ejectivized and affricates mostly de-affricated, suggest that added complexity from coordinating multiple articulatory gestures takes longer to acquire.
Such studies provide reference points for monolingual phonological development, but evidence on bilingual effects is mixed. Some research reports lower consonant accuracy in bilingual children relative to monolingual peers, suggesting potential challenges from managing two phonological systems (e.g., Fabiano-Smith & Goldstein, Reference Fabiano-Smith and Goldstein2010). Other studies indicate bilingual advantages, or “bootstrapping” effects. For example, Lleó et al. (Reference Lleó, Kuchenbrandt, Kehoe, Trujillo and Müller2003) found that German–Spanish bilingual children up to age 3;0 showed advanced coda production relative to Spanish monolingual peers, potentially due to higher frequency of codas in German, suggesting positive transfer from compatible phonological patterns. Similarly, Grech and Dodd (Reference Grech and Dodd2008) reported that Maltese–English bilinguals aged 2;0–6;0 exposed to both languages achieved higher consonant accuracy than monolinguals exposed only to Maltese at home, suggesting that bilinguals show increased phonological skills in mixed-language environments.
As noted above, Hul’q’umi’num’ also allows for extensive consonant clusters, and cross-linguistic studies show that mastery of these is developmentally protracted. Typically developing monolingual English-learning children begin to produce two-consonant and three-consonant clusters around age 2;0 (McLeod et al., Reference McLeod, van Doorn and Reed2001). While children’s word-final consonant clusters are phonotactically legal by age 2;0, their word-initial cluster inventory tends to also contain clusters that are not permissible in English, at least until age 3;0, for example, [fw], [pw], and [bw] (McLeod et al., Reference McLeod, van Doorn and Reed2001). In general, mastery of consonant clusters occurs between ages 6;0 and 9;0, with two-consonant clusters mastered before three-consonant clusters (Smit et al., Reference Smit, Hand, Freilinger, Bernthal and Bird1990). Clusters containing a stop + /w/ (e.g., queen) are typically produced by age 3;6, while those containing an obstruent + /l/ (e.g., flat) are produced by ages 4;0 to 5;6 (Smit et al., Reference Smit, Hand, Freilinger, Bernthal and Bird1990). Clusters containing an obstruent + /ɹ/ (e.g., prone) are typically produced by 6;0 years, although the specific cluster /θɹ/ (e.g., three) is produced by 7;0 years (Smit et al., Reference Smit, Hand, Freilinger, Bernthal and Bird1990). S-clusters (e.g., string) are typically produced by ages 4;6 to 7;0 (Smit et al., Reference Smit, Hand, Freilinger, Bernthal and Bird1990). However, even by 9;0 years, mastery of all clusters may be incomplete (Smit et al., Reference Smit, Hand, Freilinger, Bernthal and Bird1990). It is worth pointing out that, in English, clusters often consist of obstruent + resonant sequences, at least in onset position and with the exception of s-clusters. In Hul’q’umi’num’, obstruent + obstruent clusters are much more frequent, and the developmental trajectory of these may be different. In particular, phonological principles like the Sonority Sequencing Principle predict that onset obstruent + resonant and coda resonant + obstruent sequences (as in English) are relatively unmarked (Ohala, Reference Ohala1999); consequently, we might expect them to be acquired earlier than the Hul’q’umi’num’ obstruent + obstruent sequences.
Cross-linguistically, cluster acquisition is complex. While children begin at age 2;0 to produce clusters in languages that permit more complicated cluster patterns than in English (e.g., Russian), errors persist, and children will often engage in a number of distinct phonological processes to reduce cluster complexity, including epenthesis, metathesis, and others. (Jarosz, Reference Jarosz2017; Kistanova, Reference Kistanova2021; Ohala, Reference Ohala1999; Schaefer & Fox-Boyer, Reference Schaefer and Fox-Boyer2017). In addition, we know from previous studies that bilingual children may use patterns of cluster reduction that differ from their monolingual peers. For example, in Grech and Dodd’s (Reference Grech and Dodd2008) study of cluster acquisition by children exposed to either Maltese only or both Maltese and English at home, the authors indicated that for children aged 3;0 to 3;5, although both groups reduced a variety of syllable-initial cluster types (that is fricative + plosive, fricative + nasal, and plosive + plosive), just the Maltese-only group also reduced plosive + approximant clusters. Similarly, Holm and Dodd’s (Reference Holm and Dodd1999) longitudinal study of two Cantonese–English bilingual children over the ages 2;3 to 3;1 and 2;9 to 3;5 found that the children produced clusters that retained the phonotactic appropriateness of the target language while sometimes being atypical of monolingual peers.
Other studies have shown that bilingual children display advanced patterns of cluster acquisition, reflecting the bilingual advantage introduced above in relation to single consonants. For example, Mayr et al. (Reference Mayr, Jones, Mennen, Thomas and Mennen2018) observed that Welsh-English bilingual children between the ages of 2;6 and 6;0 demonstrated faster rates of acquisition of consonant clusters compared to their English monolingual peers, suggesting that bilingual contexts facilitate development through increased pressure to discriminate phonological systems. The overall patterns suggest that the application and manifestation of phonological processes are guided by constraints in each language, and that cross-language transfer can play a role in bilingual phonological development.
To sum up, our expectations for Hul’q’umi’num’ sound acquisition among children are guided by two areas of literature: child sound acquisition in other languages and adult sound acquisition in Hul’q’umi’num’. Table 2 summarizes expected order of acquisition of Hul’q’umi’num’ sounds by children, based primarily on McLeod and Crowe’s (Reference McLeod and Crowe2018) review of the literature. Sounds are organized into sets (Kent, Reference Kent, Ferguson, Menn and Stoel-Gammon1992) and by order of acquisition rather than age of acquisition. Considering the revitalization context in which children are learning Hul’q’umi’num’, they most likely have less exposure to Hul’q’umi’num’ than do children exposed to minority or L2 languages in other contexts. We therefore expect acquisition of non-English Hul’q’umi’num’ consonants to proceed at a slower pace than the literature would otherwise suggest. Note that Table 2 groups glottalized resonants along with clusters. While linguists analyse glottalized resonants as single, complex sounds, anecdotal evidence suggests that Hul’q’umi’num’ and neighbouring SENĆOŦEN speakers sometimes think of these sounds as sequences of resonant + glottal stop (or glottal stop + resonant), which we expect may be acquired along similar timelines as clusters.
Predicted order of acquisition for Hul’q’umi’num’

Table 2. Long description
The table consists of three columns: Order of acquisition, Hul’q’umi’num’ sounds included in previous literature, and Other Hul’q’umi’num’ sounds.
* 1st Order: Includes p, t, k, q, p-apostrophe, t-apostrophe, m, n, j, w, h, and glottal stop in the literature column; q-apostrophe is listed in the other sounds column.
* 2nd Order: Includes l, barred l, s, esh, chi, x-w, ts, t-esh, k-w, and k-apostrophe-w in the literature column; chi-w, ts-apostrophe, t-esh-apostrophe, q-w, and q-apostrophe-w are listed in the other sounds column.
* 3rd Order: Includes theta in the literature column; t-theta, t-theta-apostrophe, and t-barred-l-apostrophe are listed in the other sounds column.
* 4th Order: Includes clusters in the literature column; m-apostrophe, n-apostrophe, l-apostrophe, w-apostrophe, and j-apostrophe are listed in the other sounds column.
In addition to exhibiting the general patterns outlined in Table 2, we also expect children to show similarities with adult Hul’q’umi’num’ learners, for two reasons: 1) the children are L1 English speakers and learning Hul’q’umi’num’ as an early L2 rather than an L1, and 2) their caregivers – and language models – are most often L2 speakers themselves. Recall that adult learners tend to show a general preference for less marked sounds, and for sounds more similar to those of English (Bird et al., Reference Bird, Leonard, Nolan, Levis and Guskaroska2022). Based on this, we expect that the order of sound acquisition among Hul’q’umi’num’-learning children will show some blending of the patterns provided in Table 2 with the patterns observed previously for adult L2 Hul’q’umi’num sound acquisition, such that, all else being equal, consonants/sequences shared with English are more likely to be produced earlier by children than those that are unique to Hul’q’umi’num’. For example, among fricatives in Table 2, /s/ is likely to be acquired earlier than /ɬ/.
2.3. Current study
The current study aims to determine which sounds Hul’q’umi’num’-learning children are capable of producing in optimal conditions: When simply repeating a caregiver’s word productions. Our approach consists of a descriptive analysis based on transcription notes followed by two quantitative analyses: first, a count analysis that compares the raw frequency distributions of consonants in child versus adult productions, and second, a loglinear analysis to reveal patterns of interaction between consonant/cluster features, descriptions of phonological deviations from a target form, and age group. In pioneering this loglinear method, we also aim to provide an example of how to conduct phonological analysis in a data-sparse environment.
3. Method
3.1. Community collaboration
Scholars in Indigenous Language Revitalization work within a framework of relational accountability: conducting research that centres relationships and is grounded in, benefits, and remains responsible to the community on which it is focused on (Czaykowska-Higgins, Reference Czaykowska-Higgins, McDonnell, Berez-Kroeker and Holton2018; Leonard, Reference Leonard, McDonnell, Berez-Kroeker and Holton2018). In our work, we adopted this framework in the following ways: our team consisted of community-based and university-based researchers. Community-based researchers were young parents learning Hul’q’umi’num’ as an L2; they were participating in early language programming (e.g., a language nest) and bringing the language into the home as much as possible. This project was, in fact, initiated by these young adults, who wanted access to more and better information on what to expect of their children in terms of Hul’q’umi’num’ pronunciation acquisition. University-based researchers were faculty members and students at the University of Victoria and Simon Fraser University, with combined expertise in Salish phonetics, language acquisition, and computational linguistics (involved in data analysis), and with existing relationships in the community.
As Cristia (Reference Cristia2023) notes, research into understudied languages can benefit from specialized methodological adaptations. This does not imply that such languages are inherently different or deficient; rather, it is a recognition that widely used research methods may have been developed in specific sociocultural contexts and, from the perspective of relational accountability, each new community participating in a study may benefit from tailored adaptations. In our research, methodological decisions were made collaboratively, prioritizing capacity-building and the development of methods appropriate to the team as a whole. Together, we designed a flexible, home-based “repeat after me” task that leveraged caregiver expertise and autonomy while maintaining experimental control sufficient for quantitative analysis and preliminary insights into child phonological acquisition in Hul’q’umi’num’.
3.2. Participants
The children who participated in our study varied substantially in their age and exposure to Hul’q’umi’num’, as well as in their knowledge of vocabulary. In particular, we note that our sample included a large 4-year age range. Because of the status of the language in the Hul’q’umi’num’ speaking community, child age is not clearly linked to experience speaking the language (see Appendix D). A more homogeneous sample is not currently feasible.
Caregivers led participant recruitment. Child participants were drawn from a pool of children attending a language nest programme run through the Hul’q’umi’num’ Language & Culture Society, which provides young children with Hul’q’umi’num’ language immersion through nurturing interactions with adult caregivers, primarily L2 adult speakers, and occasionally with L1-speaking Elders. There were 13 child participants, with the youngest child being almost 3 years old and the eldest child being around 8 years old. Of the children, eight were recorded on only one occasion, while four were recorded on two occasions, and one was recorded on eight occasions. The time from first recording to last recording spanned 0–8 months with a mean of 1 month.
The adult participants consisted of eight adults in their twenties and thirties: most adults were L1 English speakers and L2 Hul’q’umi’num’ learners with a range of previous exposure to the language, with the exception of one bilingual English and Hul’q’umi’num’ speaker who had been exposed to Hul’q’umi’num’ from the ages of 1–6, then resumed learning as an adult. All were enrolled in Hul’q’umi’num’ Language Academy programming and/or were members of the Hul’q’umi’num’ Language & Culture Society at the time of the study, and were all caregivers familiar to the children.
3.3. Stimuli
Stimuli choices were self-directed by adult participants, and drew upon their knowledge of the vocabularies of the children in their care. Since lexical frequency in Hul’q’umi’num’ is not documented, the adult participants (as caregivers) effectively acted as “lexical frequency experts,” informed by daily interactions and involvement in community language revitalization initiatives. While this decision limited the dataset size, diversity, and phonological balance, it was made collaboratively to increase child and caregiver willingness and ability to participate. The cumulative word set consisted of 77 words that were all familiar to the children, such as numbers, animals, and body parts. Each caregiver–child dyad contributed a subset of the total set of words used in this study (see token counts for each child in Appendix D). Each unique word was pronounced between 1 and 17 times across the entire dataset, with an average of four times (see Appendix A for the word list with token counts). The target words contained 35 of the 42 Hul’q’umi’num’ consonants (including pre- and post-glottalized versions of /m’ n’ l’ j’ w’/). The 7 missing consonants were /tɬ’/, /tʃ’/, and /tᶿ/ (the distribution /tᶿ/ is limited to a small closed class of words) and some of the glottalized resonants ([‘j], [j’], [‘n], [‘w]). Recall that glottalized resonants can be either pre- or post-glottalized; each version was considered distinct in our analyses. A complete list of consonants and token counts is provided in Appendix B, which are also categorized by context: as a single consonant (adjacent to vowels) versus in a cluster.
Our loglinear analysis focused specifically on three sound classes that were challenging for Hul’qumi’num’ learners to produce: fricatives, ejectives, and clusters, including 41 unique clusters, of which 2 contained 3 consonants and 39 contained 2 consonants. Note that we use the term “cluster” to refer to CC sequences, even though some are likely separated by a syllable boundary. In presenting and discussing the results, we refer to syllabification only as needed. Appendix C provides a list of clusters with token counts, categorized by position: word-initial (tautosyllabic), word-medial (likely heterosyllabic) and word-final (tautosyllabic).
3.4. Procedure
We followed caregivers’ preference to conduct sessions at home without observers (Bornstein et al., Reference Bornstein, Haynes, Painter and Genevro2000). Home sessions reduced disruption to daily life by eliminating the need to travel to a university laboratory. Caregivers also requested that the elicitation task be naturally integrated into at-home language practice. They determined that a “repeat after me” activity was simple, low-effort, and cost-effective, as it reliably elicited a range of lexical items without requiring a structured play context or supplies. Words were elicited in isolation, rather than in sentences, to capture phonological skills while avoiding confounds with syntactic processing, because many children were not yet producing full utterances. Caregivers controlled session duration, stopping before signs of fatigue or disengagement to preserve attention and positive affect (Jangraw et al., Reference Jangraw, Keren, Sun, Bedder, Rutledge, Pereira and Stringaris2023). During each session, adults produced single words clearly, naturally, and at a moderate pace, which children then repeated. To capture children’s natural production patterns, adults withheld verbal feedback. Session length varied from 10 to 184 seconds, with an average of 51 seconds. Accordingly, words per recording varied from 1 to 74 child words, with an average of 14 child words. Within a recording, all words belonged to one semantic category to reduce ambiguity and aid recognition in the absence of contextual cues. Caregivers conducted recordings at home. Equipment varied, typically consisting of Zoom H4N (Zoom Corporation) recorders or iPhone (Apple Computers) smartphones using built-in microphones, resulting in variable audio quality. The placement of the recording device, in terms of distance and angle to the speakers, was not controlled.
By centring community decisions in task design choices, we acknowledge that our elicitation methodology differs from much of the existing scientific literature. Indeed, stricter protocols with fixed stimuli in a lab would have offered greater experimental control. However, our priority was to ensure that the study felt feasible and appropriate for data collectors and also laid sustainable groundwork so that future work – whether led independently by the community or in collaboration with external researchers – could continue effectively.
3.5. Transcription and coding
Recordings were annotated in Praat (Boersma & Weenink, Reference Boersma and Weenink2024) collaboratively by trained phoneticians and adult Hul’q’umi’num’ learners. Annotators examined both child and adult productions, as adult productions were not assumed to be uniformly target-like. Annotations included the target word in Hul’q’umi’num’ orthography, the actual production in Hul’q’umi’num’ orthography, the English gloss, the speaker’s name, the observed replacements that transformed the target to the actual production in Hul’q’umi’num’ orthography, and any descriptive notes. Replacements were denoted with an encoding scheme developed by the team, consisting of the target grapheme(s), a right chevron, and the actual grapheme(s) per replacement (see Table 3, for example). Multiple replacements per word were semicolon-delimited. To represent no grapheme (e.g., in cases of insertion or deletion), a “0” was used. Two graphemic representations per glottalized resonant exist to denote the pre-glottalized (e.g., [’m]) and post-glottalized (e.g., [m’]) versions. These are predictably distributed in Hul’qumi’num’ based on prosodic factors; therefore, they were also differentiated in our analysis. Annotations were extracted through a Praat script and split into adult and child spreadsheets based on the speaker. Speakers were anonymized within adult and child speaker groups in datasheets (published at https://osf.io/rf8va).
Labels for production strategies for ejectives, fricatives, and clusters

Table 3. Long description
The table consists of five columns: Sound type, Label, Description, Example replacement, and Example token.
1. Ejective sound type strategies:
- Preserve: No change. /t s apostrophe/ yields [t s apostrophe]. Example: nuts’a’ meaning one.
- No ejective: Ejective element removed. /t s apostrophe/ yields [t s].
- Keep ejective: Changed, but ejective element preserved. /t s apostrophe/ yields [t apostrophe].
- Change: Changed, with ejective closure or constriction removed. /t s apostrophe/ yields [t].
- Delete: Absent. /t s apostrophe/ yields the null symbol. Example: luluts’ meaning yellow.
2. Fricative sound type strategies:
- Preserve: No change. /s/ yields [s]. Example: smuyuth meaning deer or meat.
- Place: Place of articulation changed. /s/ yields [esh].
- Manner: Manner of articulation changed. /s/ yields [t]. Example: s’athus meaning face.
- Change: Any other change. /s/ yields [glottal stop]. Example: yuse’lu meaning two.
- Delete: Absent. /s/ yields the null symbol. Example: wuxus meaning frog.
3. Cluster sound type strategies:
- Preserve: No change. /glottal stop k w/ yields [glottal stop k w]. Example: tth’a’kwus meaning seven.
- Drop plus change: One consonant deleted and remaining consonant changed. /glottal stop k w/ yields [h].
- Drop: One consonant deleted. /glottal stop k w/ yields [k w].
- Change: Any other change. /glottal stop k w/ yields [h k w].
- *Delete: Entire cluster deleted. Note indicates this never occurred in the dataset.
Note: We used community orthography rather than IPA in the annotation process. Moreover, in the Praat Textgrid coding process, the absence of an explicit replacement in the Replacement column implied preservation of the target sound. The asterisk in the last row indicates that this process never occurred in the dataset, but was considered as a possibility as part of the coding scheme before annotation.
A Python script processed the spreadsheets to generate a table of the number of target and actual productions of each consonant by adults and children in each file; this table was used in the count analysis described in the next section. Another Python script processed the spreadsheets to generate separate tables for the realizations of ejectives, fricatives, and clusters by adults and children. Each ejective, fricative, and cluster was labelled according to production strategy, using the encoding depicted in Table 3. Ejective labels emphasized participants’ treatment of the glottal feature, central to ejective production. Cluster labels focussed on simplification strategies, common for complex sequences. Fricative labels noted general place and manner, but distinctions between specific places or manners were not annotated because limited token counts precluded reliable place-based or manner-based analysis. These labels were then used in the loglinear model analysis.
Two tokens of the word syulwulhnet “Monday” were excluded, since in these cases the child seemed to be aiming for prosodically correct words, but retained just the vocalic nuclei in production. In this case, we considered the production to be the output of a whole-word phonological process rather than one that targeted specific consonants or clusters. Of all remaining word tokens, two additional ones were excluded because coders could not make sense of (or agree on) the child’s production.
3.6. Data analysis
The first stage of data analysis involved a preliminary, descriptive examination of child and adult speech, conducted during transcription of the elicitation sessions. Annotators identified prevalent types of errors and proposed potential explanations. This stage helped narrow the scope of the project. The descriptive findings indicated that ejectives, glottalized resonants, fricatives, and clusters posed a particular challenge to children, generating community interest in further quantitative analysis.
Quantitative analysis of this dataset was constrained both by the limited amount of tokens and by the lack of phonological contrasts across stimuli. In Hul’q’umi’num’, morphological complexity makes minimal pairs extremely rare. Consequently, it was not feasible to generate phonotactic controls, a strategy that is relatively easy in studies of child English phonology. For example, in English, children can be asked to produce different consonants (like /b/ or /m/ or /f/) in the same phonetic context (/_æt/) by eliciting words such as bat, mat, and fat. The present dataset necessitated a broad approach that accommodated data limitations while illuminating systematic difficulties in child phonological acquisition of Hul’q’umi’num’, providing a foundation for more targeted investigations in future research. In the present study, therefore, quantitative analysis focused on broad patterns via a count analysis of speech tokens and subsequent loglinear analyses of phonological processes.
First, the count analysis provided a high-level overview of consonant production, without detailed phonological framing. For each consonant, we counted productions by children, productions by adults, and occurrences in target stimuli. This allowed us to visualize how child consonant production compared to target and adult consonant tokens. This analysis did not differentiate between singletons versus clusters in order to get an initial overview of consonant production and confirmed the descriptive observation that ejectives, fricatives, and glottalized resonants were particularly challenging for children and, to a lesser extent, adults.
Because the uncontextualized count approach did not capture children’s difficulties with consonant clusters, nor the phonological processes used in mispronunciations, we turned to a new type of analysis of complex patterns of categorical data (Friendly & Meyer, Reference Friendly and Meyer2015). We operationalized our questions by asking how counts of distinct speech production strategies differed among adults and children, as well as among different consonants (or consonant clusters). We generated separate loglinear models for ejectives, fricatives, and clusters. Although glottalized resonants were identified as challenging in the descriptive analysis and quantitative count analysis, they were excluded from the loglinear analysis due to insufficient tokens (n = 65 for adults and children, respectively).
Each of the three loglinear models included three categorical variables: Consonant (individual consonants within each class of phonological unit), Description (production strategies, grouped into broader categories when token counts were too low for fine-grained contrasts; see Table 3), and Age (child vs. adult). We note that this is a new approach to the description of consonant production, but in the absence of controlled datasets, we reasoned that this new approach might provide novel insights to datasets that are otherwise irregular, messy, and sparse.
4. Results
4.1. Descriptive analysis
A number of impressionistic patterns emerged from our transcription notes. First, adults were relatively consistent and accurate in their productions, whereas children were much more variable. For ejectives specifically, both groups tended to de-ejectivize consonants (e.g., /t’/ → [t]) intervocalically and in pre-consonantal position. Adults seemed to de-ejectivize velar /kʷ’/ and /qʷ’/ more often than other ejectives. In contrast, our impression was that children tended to maintain the ejective component of the labialized uvular ejective stop more than adults, and also maintained ejectives more often in word-final position (for all ejectives).
For fricatives, adults had very few errors, with our impressions being that /x/ and /ɬ/ were the mostly likely to be replaced by other sounds. In addition, /xʷ/ was sometimes uvularized ([χʷ]) and /θ/ was sometimes replaced with [ɬ], especially word-finally. Children’s fricatives were extremely variable, with very little consistency even within participants. The production of /s/ in particular was affected by position: in initial clusters, /s/ was often deleted in /s/ + stop clusters (e.g., /speʔəθ/ → [peʔəθ] for spe’uth “bear”) whereas in /s/ + fricative clusters, other kinds of simplifications were more common (e.g., /sχənʼə/ → [ʃhənʼə] for sxun’u “leg”); in final clusters, /s/ was always preserved (e.g., /sχəʔæθəns/ → [sχəʔæθəns] for sxu’athuns “Thursday”).
In terms of clusters, adults were relatively accurate in their production compared to what is reported in Bird et al.’s (Reference Bird, Leonard, Nolan, Levis and Guskaroska2022) study. This suggests that familiarity plays an important role in production; the words in the present study were very familiar ones (e.g., numbers and animals), whereas in Bird et al. (Reference Bird, Leonard, Nolan, Levis and Guskaroska2022) they were much more mixed. Children were much more variable in their production of clusters. Many clusters were preserved across all positions. Interestingly, vowel insertion to break up a cluster was unattested. In cases where words with initial clusters were reduced by deletion, it was generally the first consonant that was deleted, for example, /ɬq’et͡səs/ → [q’et͡səs] for lhq’etsus “five”. In our dataset, the initial consonant was most often a fricative, so it is unclear whether this pattern is an effect of position or manner of articulation, or both.
4.2. Count analyses
The distribution of consonants in our recordings was uneven: Coronals like /s n t/ are highly frequent in our word set (and in Hul’q’umi’num’), while other consonants, particularly glottalized resonants, occurred much less frequently (see Appendix B). As a descriptive overview, Figure 1 charts adult and child productions in relation to target productions using log10 frequencies; the top panel includes sounds common to English and Hul’q’umi’num’, and the bottom panel includes sounds only found in Hul’q’umi’num’.
Bars indicate (log) frequency counts of consonants from our dataset found in both English and Hul’qumi’num’ (top plot, orange) or only in Hul’qumi’num’ (bottom plot, purple). Note that five Hul’q’umi’num’ consonants did not occur in target words (and two additional glottalized resonants were unattested in either targets or child/adult production). For each bar, yellow lines and dots indicate whether adult token counts differed from target counts, while green lines and dots indicate whether child tokens counts differed. IPA labels in bold and red font indicate consonants where child counts exceeded adult counts. Y-axis tick marks are on a log10 scale.

Figure 1. Long description
A multi-panel bar chart with two vertical sections. The Y-axis represents Count on a log 10 scale with ticks at 0, 50, 100, 150, and 200. The X-axis lists I P A symbols.
Top Panel (Orange Header: Both Languages):
Contains 16 bars for consonants shared by both languages. From left to right, frequencies generally decrease. Symbols in red bold (indicating higher child counts) are t, m, p, esh, t-esh, and k. Each bar has a yellow line with a dot for Adult counts and a green line with a dot for Child counts. For most shared consonants like s, glottal stop, and n, adult and child counts are near the top of the bar. For h and k at the far right, child counts (green dots) are significantly higher than the bar height and adult counts.
Bottom Panel (Purple Header: Hul’qumi’num’ Only):
Contains 23 bars for consonants unique to Hul’qumi’num’. Symbols in red bold are q, n-apostrophe, l-apostrophe, t-esh-apostrophe, t-theta-apostrophe, n-apostrophe, and w-apostrophe. The bars show a steeper decline in frequency from left to right. Many bars on the right side, such as t-theta and n-apostrophe, show adult counts (yellow dots) at zero while child counts (green dots) remain higher. The green lines for child counts show high variability, often extending well above or below the grey bar levels.
Visual inspection of the comparison between adult and child productions indicates a few notable patterns. First, many consonants shared between English and Hul’q’umi’num’ (Figure 1, top panel), such as /ʃ tʃ k h w/, were produced more often by children than by adults, indicated by higher values for green lines (children) than yellow lines (adults). Because our task simply involved children shadowing adults, this indicates that these consonants were substituted for other consonants that might have been harder to produce. Conversely, many of the Hul’q’umi’num’ only consonants (Figure 1, bottom panel), such as /xʷ χ kw q’ tθʼ/ were produced less by children than by adults, indicated by lower values for green lines (children) than yellow lines (adults). These included many of the sounds with manners and/or places of articulation that are not present in English, supporting the idea that children replaced these more challenging sounds with ones found also in English. Many of these sounds are difficult for adults as well (see also Bird et al., Reference Bird, Gerdts and Leonard2016, Reference Bird, Leonard, Nolan, Levis and Guskaroska2022), but our results show that they are even more challenging for children.
When comparing adults’ and children’s productions to the target forms, several patterns emerged. As expected, adults generally showed accurate performance for most consonants used in both English and Hul’q’umi’num’, indicated by relatively short yellow lines in Figure 1. However, some consonants unique to Hul’q’umi’num’ were pronounced less often than expected, including many of the glottalized resonants. Interestingly, although the post-glottalized resonants /m’ n’ l’ j’/ were clearly challenging, the pre-glottalized resonants /‘l ‘m/ were successfully produced by adults. Children showed similar divergences from target forms as adults did, which was expected given that the task was to shadow adult models. Interestingly, children produced a few Hul’q’umi’num’-only consonants more often than prompted by adults, including the uvular stop /q/ and the glottalized resonants /l’ n’/. In some cases, children even produced Hul’q’umi’num’-only sounds spontaneously, when neither adults nor target forms contained them, including two ejectives /tɬ’ tʃ’/ and two pre-glottalized resonants /‘n ‘w/.
As shown in Appendix D, which reports count analyses of individual dyads, there was substantial variability in terms of whether children followed adult productions within dyads. Nevertheless, many of the same group-level patterns were reflected at the individual level. For example, the uvular stops /q qw/ were also precocious at the individual level, produced by all but 1 of the 7 children when present in target forms, and with 4 additional children showing spontaneous production of a uvular stop, even though it did not occur in a target form. In addition, fricatives were also unstable at the individual level, variably produced by some of the children, but not others (e.g., lateral fricatives /ɬ/ were produced by 5 of the 11 children who had them in targets or in adult models; uvular fricatives /χ χw/ were produced by 8 of 12 children). Glottalization and ejectivization were similarly inconsistent across children (e.g., 10 of 14 children for glottalized resonants; 10 of 14 children for ejective stops; note that these were not always the same 10 children). By and large, then, at the individual level, the overall patterns held up.
In sum, this preliminary count analysis provided a first look into which sounds children (and adults) learning Hul’q’umi’num’ had trouble pronouncing. Results suggest many parallel challenges in child and adult learners, particularly in the area of ejectives and glottalized resonants, which do not occur in English. Interestingly, some children produced some of the Hul’q’umi’num’-only consonants more often than adults and more often than prompted by the target stimuli (see red IPA labels in the bottom panel of Figure 1). These include some of the glottalized resonants, the plain uvular stop /q/, and some coronal ejective affricates. Our conclusions for this point are limited by the relatively few examples of these sounds in our word set, but future work will need to better understand why children showed these patterns. One possibility is that they reflect the relative ease with which Hul’q’umi’num’-learning children may produce (and thus overproduce) certain consonant types. Another is that children are aware that adults are not always reliable models in terms of consonant production, and are (over-) compensating in their own speech.
4.3. Loglinear analyses of phonological substitutions
The above count approach suggested certain classes of sounds that children found difficult to produce in Hul’q’umi’num’ (i.e., ejectives, fricatives), along with several consonants that were overused, possibly to substitute for the difficult-to-pronounce sounds. However, this analysis was an aggregate one, and thus not able to examine specific patterns of sound substitutions. Moreover, we could not look at combinations of consonants produced together in clusters, which we know are challenging for adult Hul’q’umi’num’ learners (Bird et al., Reference Bird, Leonard, Nolan, Levis and Guskaroska2022) as well as for children cross-linguistically (Jarosz, Reference Jarosz2017; Kistanova, Reference Kistanova2021; Mayr et al., Reference Mayr, Jones, Mennen, Thomas and Mennen2018; Schaefer & Fox-Boyer, Reference Schaefer and Fox-Boyer2017).
Here, we used a novel approach to conduct a phonological analysis of sound substitutions for two classes of sounds: ejectives and fricatives. Specifically, we used loglinear models (Friendly & Meyer, Reference Friendly and Meyer2015) implemented using the vcd (Meyer et al., Reference Meyer, Zeileis and Hornik2006) and vcdExtra (Friendly et al., Reference Friendly, Turner, Meyer, Zeileis, Murdoch, Firth and Sun2023) packages in R. The basis of this approach was to understand phonological substitutions in children’s and adults’ Hul’q’umi’num’ consonant productions, based on three factors. First, we defined the factor Consonant ([C]) whose levels were the specific consonants that were the target of analysis (ejectives in the first analysis and fricatives in the second). Second, we defined the factor Description ([D]), whose levels were the phonological processes/strategies used to generate the substituted sound, in cases where the target sound was not produced (see Table 3). Third, we defined the factor Age ([A]), which referred to whether adults or children produced this sound pattern.
Because this is a novel approach in the field of phonological description, we outline the steps of this analysis in detail here. We first ran eight models testing assumptions about the relatedness of these three factors. The simplest model tested the mutual independence of Consonant, Age, and Description, abbreviated [C][A][D], which assumes that each factor is independent of the others. The next three models assume joint independence of Consonant [C][AD], Description [D][AC], and Age [A][CD], respectively. This means that the target factor (e.g., Consonant in the [C][AD] model) is jointly independent of the two remaining factors (e.g., Description and Age), which are themselves interdependent. The next three models assumed conditional independence of Consonant [CD][AC], Description [CD][AD], and Age [AC][AD], respectively. These models are defined by the fact that the target factor (e.g., Consonant in the [CD][AC] model) interacts with the other two factors (e.g., Description and Age), but does so independently for each factor. The last model assumed homogeneous associations [AC][AD][CD], which models two-way interactions between all three variables. This is summarized in Table 4.
Statistics for model fits

Table 4. Long description
The table contains six columns: Sound type, Model type, Model description, A I C, B I C, and G super 2.
For Ejectives:
- Mutual independence [C][A][D]: A I C 357.37, B I C 384.35, G super 2 176.389.
- Joint independence of Consonant [C][AD]: A I C 301.7, B I C 337.68 (bold), G super 2 112.718.
- Conditional independence of description [CD][AD]: A I C 279.28 (bold), B I C 369.22, G super 2 42.292.
- Homogeneous associations [AC][AD][CD]: A I C 284.21, B I C 387.64, G super 2 35.224 (bold).
For Fricatives:
- Mutual independence [C][A][D]: A I C 609.04, B I C 636.02, G super 2 401.79.
- Joint independence of Consonant [C][AD]: A I C 326, B I C 361.98 (bold), G super 2 110.75.
- Homogeneous associations [AC][AD][CD]: A I C 293.54 (bold), B I C 396.97, G super 2 18.29 (bold).
For Consonant clusters:
- Mutual independence [PS][A][D]: A I C 399.56, B I C 429.16, G super 2 197.361.
- Joint independence of cluster [PS][AD]: A I C 315.93, B I C 352.35 (bold), G super 2 107.727.
- Conditional independence of description [PSD][AD]: A I C 291.46 (bold), B I C 382.52, G super 2 35.258.
- Homogeneous associations [APS][AD][PSD]: A I C 302.84, B I C 412.12, G super 2 30.639 (bold).
Note: Lower values indicate better fit. Bolded B I C values indicate the model used in mosaic plots.
Note: For all model metrics (AIC, BIC, and G2), lower values indicate a better fit, and the lowest values within each sound type are bolded. Bold font in the model type and model description columns indicates the model used in the mosaic plots (i.e., always the model with the lowest BIC values).
The second step in our loglinear analysis was to explore not just which of these models best accounted for the data (G2), but also which had the lowest values following the Akaike Information Criterion (AIC) and Bayesian Information Criterion (BIC). Information criteria are measures of model fit that are weighted by model complexity (lower values indicate better fit). Note that AIC and BIC values can sometimes diverge, which was the case for our dataset. AIC values can be interpreted more straightforwardly as enhancing the predictive power of models by minimizing estimate error (Emiliano et al., Reference Emiliano, Vivanco and de Menezes2014). On the other hand, BIC values are often thought to reward parsimony over predictive power and are considered better for enhancing the explanatory power of models (Sober, Reference Sober2002). We rely primarily on BIC values in this analysis; given the limitations that small sample sizes have on the predictive power of our data, we preferred an information criterion that weighted explanatory power more. Future research that uses larger datasets may see AIC and BIC values converge, or may decide to weight AIC values over BIC values in making similar determinations.
The third step in our analysis was to graph our data using the mosaic plotting function from the vcd package in R to represent the observed patterns visually. Mosaic plots use surface area to represent the proportion of items from a categorical dataset with multiple dimensions (Friendly, Reference Friendly1994). Our mosaic plots (Figures 2–4) thus visualized how certain consonants may have been preserved, deleted, or changed among the two age groups. As a last step, we also shaded patterns that significantly contributed to any divergence from the model fit, highlighting standardized residuals that exceeded marginal (light shading) and highly significant levels (dark shading) of divergence (Friendly, Reference Friendly1994; Zeilis et al., Reference Zeilis, Meyer and Hornik2007). This final step highlights the patterns that stood out from the larger, more general tendency.
For a third type of sound class, consonant clusters, we pursued a very similar approach as with ejectives and fricatives, but because there were dozens of different types of clusters (even in the child-centred vocabulary in our study), we focused instead on two factors that are widely thought to affect children’s accuracy in consonant cluster production (Ohala, Reference Ohala1999). Specifically, we coded changes in Sonority over the cluster (rise, fall, or level) and the Position of the cluster within a syllable or word: word-initial, word-medial, or word-final. Our cluster analysis was, in fact, analogous to our ejective and fricative analysis, except that we replaced the factor of Consonant with the interaction of Position and Sonority [PS] (Table 3). The goal of this analysis was, therefore, to understand how the factors of Age [A] and Description [D] interacted (or not) with the well-understood Position-Sonority interaction [PS] seen in the literature.
This loglinear approach is novel in phonology and is useful for visualizing relations between relevant factors in production studies for easy interpretation, particularly when sample sizes are limited, as was the case in our research context. In our analyses, it is important to note that we are unable to tease apart the causes of the observed patterns of phonological substitutions or mispronunciations. That is, we could not systematically understand how complex influences from prosodic, syllabic, and segmental factors might shape our results. This would almost certainly require additional and better-controlled data than those available here. Nevertheless, we hope that this method will still be able to help us identify specific challenges for Hul’q’umi’num’ learners in consonant production and, if so, that this method may provide a model for other child production researchers working in low-resource contexts.
Ejectives. Seven ejectives occurred 267 times in our sample of target words, and their actual productions were described in five ways as noted in Table 3. Table 4 describes the outcomes from the model. Here, the lowest BIC value indicated that the joint independence of Consonant [C][AD] provided the best fit without overfitting the data. In other words, the target consonant ([C]) was independent of the phonological description of how this consonant surfaced ([D]) and whether the producer was a child or adult ([A]), but these latter two factors were interdependent ([AD]).
Figure 2 illustrates the mosaic plot that shows overall patterns and also reveals production patterns that diverged from the Joint Independence of Consonant ([C][AD]) model with shading. Overall, the model did especially poorly in capturing adults’ performance, with 80% of the cells diverging from the model being linked to adult performance, perhaps due to wider variability in adults’ ability to master ejective production.
Mosaic plot of ejective productions. The surface area of each cell is proportional to the token counts, leading to some misalignment between description categories across ejectives. Circles indicate that either adults or children did not produce any of the corresponding ejectives with that particular phonological description, while lines indicate that neither adults nor children did so. Purple shading indicates productions that were more frequent than expected, assuming joint independence of Consonant [C][AD]; red shading indicates productions that were less frequent than expected in this model.

Figure 2. Long description
The plot is organized with Description categories on the top X-axis (Preserve, No Ejective, Keep Ejective, Change, Delete) and Consonant types on the Y-axis (p prime, t theta prime, t s prime, t prime, k w prime, q w prime, q prime). A secondary X-axis at the bottom divides each cell by Age (Adult on the left, Child on the right).
* A vertical color bar on the right labeled rstandard ranges from negative 4.1 (red) to 2.8 (purple), with grey representing zero.
* The p-value is noted as 4.1392 e minus 11.
* Data highlights include:
- t theta prime / Delete: A large purple cell for Adults (count 5).
- t s prime / Preserve: A large purple cell for Children (count 12).
- t prime / Delete: A tall purple cell for Adults (count 3).
- k w prime / Keep Ejective: A purple cell for Adults (count 4).
- q w prime / Keep Ejective: A purple cell for Adults (count 3).
- t theta prime / No Ejective: A small red circle for Adults (count 2).
- Small red semi-circles appear in several cells, such as q prime / Change for Children (count 7) and t prime / Change for Children (count 7), indicating lower than expected frequency.
- Empty cells are marked with circles (one group absent) or vertical lines (both groups absent).
We specifically note several instances where production patterns were unexpectedly different from the model’s predictions, indicated by red (less than expected) and purple (more than expected) boxes: First, adults found the ejective /qwʼ/ to be particularly challenging to produce, as no adult preserved it in their productions. This is somewhat surprising based on findings from previous studies on Hul’q’umi’num’ and neighbouring Salish languages (Bird, Reference Bird2016; Bird et al., Reference Bird, Leonard, Nolan, Levis and Guskaroska2022), where uvular ejectives were more often preserved than velar ones. Second, adults showed divergent de-ejectivization patterns for affricate ejectives, de-ejectivizing less than expected for /tθʼ/ but more than expected for /ts’/. In the case of /tθʼ/, a possible explanation is that de-ejectivization would lead to /tθ/, which has a very restricted distribution in the language, limited to a small set of demonstratives. Many learners know this (it is often taught explicitly), which may affect their willingness to produce /tθ/ outside of this small set of words. Third, adults changed their place or manner when producing the labialized back ejectives /kwʼ qwʼ/ more than the model predicted (and these changes were more complex than simple delabialization), but did not do so when producing non-labialized ejectives /p’ t’ q’/. This latter pattern of not making any place or manner changes for non-labialized ejectives was especially interesting given that children did make many place or manner changes when trying to produce these sounds (once for /p’/; seven times each for /t’/ and /q’/). Fourth, children deleted /tθʼ/ more often than predicted by the model (perhaps given that adults never deleted this sound).
Fricatives. The fricative /h/ only occurred four times in our target word set (i.e., each time /h/ was pronounced correctly by an adult and by the child who imitated the adult), and so we excluded it from our analysis. Additionally, nine fricatives were inserted without being in the target word, and we did not consider these tokens in our loglinear analysis. Otherwise, seven Hul’q’umi’num’ fricatives occurred 739 times in our sample of target words, and their actual productions were described following several processes, as noted earlier in Table 3. Table 4 describes the outcomes from the model. Similar to what we saw with the ejectives, the lowest BIC value indicated that the joint independence of Consonant [C][AD] provided the best fit without overfitting the data. Figure 3 illustrates the mosaic plot for fricatives.
Mosaic plot of fricative production. The surface area of each cell is proportional to the token counts, leading to some misalignment between description categories across fricatives. Circles indicate that either adults or children did not produce any of the corresponding fricative with that particular phonological description, while lines indicate that neither adults nor children did so. Purple shading indicates productions that were more frequent than expected, assuming joint independence of Consonant [C][AD]; red shading indicates productions that were less frequent than expected under this model.

Figure 3. Long description
The mosaic plot organizes data by Consonant on the vertical axis and Description categories on the horizontal axis.
Vertical Axis (Consonants): From top to bottom, the rows are theta, s, esh, f, x super w, X super w, and X.
Horizontal Axis (Description): From left to right, the columns are Preserve, Place, Manner, Change, and Delete. Each column is subdivided into Adult (left) and Child (right).
Data Trends:
- The ‘s’ row contains the largest cells, particularly in the Preserve category with counts of 162 for adults (grey) and 89 for children (blue, indicating higher than expected frequency).
- Red shading (lower than expected frequency) appears in the theta-Preserve-Child cell (8), s-Manner-Child cell (24), s-Change-Child cell (23), and X-Preserve-Child cell (11).
- Blue shading (higher than expected frequency) is prominent in s-Preserve-Child (89), esh-Preserve-Child (12), x super w-Place-Child (15), and X-Change-Child (24).
- Small circles indicate zero production by one group, while vertical lines indicate zero production by both groups, notably in the esh and X super w rows.
- A color scale on the right indicates r-standard values from -4.2 (red) to 4.0 (blue), with a p-value of 3.2796e-12.
Several patterns emerged: First, children and adults differed substantially in their production of fricatives: adults, by and large, followed the predictions of the model, whereas children diverged from it in many ways, reflected in the larger number of red and purple boxes for children than for adults. Second, children preserved /s ʃ/ more often and /χ θ/ less often than other sounds, suggesting fricatives that children may find to be particularly easy (/s ʃ/) or difficult (/χ θ/). Third, several back fricatives may pose particular problems for Hul’q’umi’num’-learning children, but in distinct ways. Specifically, children changed the velar /xw/ more often than predicted, often to /χw/ (9/13 tokens), mirroring the preference for uvular place observed with /q/. On the other hand, they had a few (unique) issues with the manner when pronouncing this fricative. When producing /χ/, on the other hand, children had a surprising number of combined place and manner difficulties, instead using a wide range of other sounds, for example, [t k kw ʔ] (i.e., the level “Change” in the Description factor) instead.
Consonant clusters. We coded 344 two-element clusters according to the manner of articulation of each sound (Affricate + Stop; Stop + Affricate; etc.). Note that there were also five instances of adults producing a three-element cluster (Fricative + Fricative + Stop: n = 2; Fricative + Stop + Stop: n = 3), which were not faithfully pronounced (i.e., changed) by children in all but one case. Because there were so few cases, we excluded these three-element clusters from our analysis.
We described the surface productions in five ways, as noted in Table 3. Table 4 describes the outcomes from the model analysis. The lowest values for BIC suggested that the joint independence of Cluster (Position * Sonority) [PS][AD] provided the best fit without overfitting the data. Figure 4 shows overall patterns in a mosaic plot. Word position is represented on the left y-axis, such that the largest mosaic elements were grouped by word position and phonological description. Within each of these large elements, individual rows represent falling, level, or rising sonority from top to bottom. Note that word-initial and word-medial clusters include sequences with all sonority profiles; however, word-final clusters only include falling and level profiles. As in Figures 3 and 4, the leftmost tiles within each element represent adults and the rightmost ones represent children.
Mosaic plot of consonant cluster productions, where clusters are classified by the level of sonority (Rise, Level, Fall). The surface area of each cell is proportional to the counts of cluster productions for adults or children, leading to some misalignment between description categories across clusters. Circles indicate that either adults or children did not produce any clusters in a particular position, with a particular level of sonority, and with a particular phonological description. Purple shading indicates productions that were more frequent than expected, assuming joint independence of Cluster, which is represented as the Position*Sonority interaction [PS][AD]; red shading indicates productions that were less frequent than expected in this model.

Figure 4. Long description
A mosaic plot organized into three horizontal rows for Position: Word-Final, Word-Medial, and Word-Initial. The vertical columns represent Description categories: Preserve, Drop plus Change, Drop, and Change. Within each cell, the area is divided by Age (Adult on the left, Child on the right) and Sonority (Fall at the top, Level in the middle, Rise at the bottom).
* Legend: A vertical color bar for r standard values ranges from negative 2.8 (red) to 4.9 (blue). Grey indicates values near 0.0. A p-value of 5.2958e-09 is noted.
* Word-Final Row: Mostly small cells or circles indicating zero production. In the Preserve column, Adults have a count of 11 (grey) and Children have 8 (blue shading).
* Word-Medial Row:
- Preserve: Large grey blocks for Adults (counts 7, 7, 28) and Children (6, 4, 8). One Adult Level cell is shaded red (count 7).
- Drop plus Change: Small vertical slivers. Children have counts of 4, 2 (red), and 10.
- Drop: A large blue cell for Adults (count 12) and a light blue cell for Children (count 10).
- Change: Grey blocks with counts ranging from 1 to 8.
* Word-Initial Row:
- Preserve: Largest blocks in the plot. Adults show counts of 31, 11, and 20. Children show 6 (red), 2, and 5.
- Drop plus Change: Vertical blocks for Children with counts of 20, 9 (blue), and 8.
- Drop: Narrow vertical blocks for Children with counts of 12, 3, and 6.
- Change: Vertical blocks for Children with counts of 11, 3, and 11 (blue). A small red cell with count 1 is at the bottom of the Drop column.
There were several patterns of note that diverged from expectations of this model. First, in word-final clusters, children preserved clusters with falling sonority relatively more often than predicted from the model, which fits with predictions from the literature on position-sonority interactions (Ohala, Reference Ohala1999). Second, word-medially, adults preserved clusters with level sonority relatively less often than predicted by the model, and correspondingly, dropped one of the consonants in the cluster more than model predictions. Children showed similar tendencies, also dropping clusters with level sonority more than predicted in the medial position. This may be an artefact of the clusters involved: many of the word-medial clusters produced were tokens of one of two words (tth’a’kwus “seven” and te’tsus “eight”) containing a glottal stop + stop sequence (see Table C2 in Appendix C). Possibly, deletion of the glottal stop in these words is less about cluster simplification and more about under-glottalization in general, a common pattern among adult learners (Bird et al., Reference Bird, Leonard, Nolan, Levis and Guskaroska2022). Curiously, in word-medial clusters with falling sonority, children did not seem to drop consonants as much as the model would have predicted, which suggests that children do relatively well with medial-CC sequences that respect the syllable contact law (Murray & Vennemann, Reference Murray and Vennemann1983). Lastly, in word-initial clusters, children faced several challenges with all types of clusters, as illustrated by shading in the bottom word-initial mosaic elements. For example, in accordance with the predicted position-sonority interaction, children preserved word-initial clusters with falling sonority less than expected from the model. Also in word-initial position, children deviated from model predictions in dropping and/or changing consonants in clusters with rising or level sonority.
5. Discussion
In language revitalization contexts, research on phonological development requires many unique considerations, exemplified in this study on Hul’q’umi’num’-learning children. For example, relatively few children (and caregivers) were available to participate in our study, and each child’s experience acquiring Hul’q’umi’num’ was somewhat different. Additionally, the word set we used was relatively small, and phonological control over our stimuli was challenging, due to both study-specific and language-specific factors, which we detail below.
Our approach to these special considerations was to use both descriptive analysis and (count and loglinear) quantitative analyses, methodologically adapted to extract usable insights from limited datasets. In combination, these approaches have provided us with important insights into child acquisition of the Hul’q’umi’num’ sound system. Many of these reflect our predictions summarized in Table 2 above: For example, the production of Hul’q’umi’num’ stops, including /q/, was relatively robust, reflecting its placement in the first set of sounds acquired in Table 2. Likewise, fricatives and affricates, particularly those involving /θ/, were relatively challenging compared to stops (Figure 3), aligning with /θ/ being in the third set of sounds acquired in Table 2. For ejective stops, production was somewhat mixed, particularly for labialized ejective stops (Figure 2). This likely has to do with the added complexity of secondary labialization rather than with the ejective quality, leading to labialized ejectives being acquired somewhat later, within the second set in Table 2. Finally, clusters were also challenging for Hul’q’umi’num’-learning children, as they are for children cross-linguistically (Ohala, Reference Ohala1999): We observed a number of strategies to simplify word-initial clusters among the children. As reflected in Figure 4, their productions generally respected the Sonority Sequencing Principle (Ohala, Reference Ohala1999) and the Syllable Contact Law (Vennemann, Reference Vennemann1987). Finally, although not analysed using our loglinear models due to the lack of data, the production of glottalized resonants was also quite challenging.
Hul’q’umi’num’-learning children also showed additional patterns that reflected more universal tendencies. For example, we observed a number of instances of debuccalization, where consonants were replaced with a glottal stop, also common in L1 acquisition (e.g., Abou-Elsaad et al., Reference Abou-Elsaad, Afsah and Rabea2019; Stemberger, Reference Stemberger1993). In the sections below, we first discuss how our results are consistent with the L2 patterns that we have encountered in previous work with adult Hul’q’umi’num’ (and neighbouring SENĆOŦEN) speakers. Second, we discuss three other notable production patterns that have implications for several aspects of phonological theory. Third, we integrate these findings under general theoretical approaches to child phonology.
5.1. Hul’q’umi’num’ children: Similarities or differences with adult L2 learners
Many of the patterns exhibited by the children that can be ascribed to general phonological development (as predicted in Table 2) are also typical L2 patterns; adult L2 Hul’q’umi’num’ speakers also show variation in the strategies they use in pronouncing the more complex and less familiar aspects of the Hul’q’umi’num’ sound system (Bird et al., Reference Bird, Leonard, Nolan, Levis and Guskaroska2022), as do learners in closely related SENĆOŦEN (Bird & Kell, Reference Bird and Kell2017). For the most part, the children in our study exhibited more unexpected productions than adults; this was the case in general for the ejectives, fricatives, glottalized resonants (Figure 1) and clusters (Figure 4). One way to interpret this finding is that, compared to adults, children are less advanced L2 learners, with less prior exposure to the language. For example, McLeod and Crowe (Reference McLeod and Crowe2018) find that simple ejective stops are acquired relatively early by L1 speakers in other languages, but in our sample, ejective stops were still relatively difficult for children, which suggests that they are acquired more like L2 than L1 sounds.
Nonetheless, children did not always show less production of Hul’q’umi’num’ sounds compared to adults, for example, they used /q/ relatively frequently compared to both adults and target forms (Figure 1 and Appendix D). This pattern also echoes teachers’ impressions of child production in the neighbouring language SENĆOŦEN, documented in Bird and Kell (Reference Bird and Kell2017). Six of 12 teachers interviewed in that study noted that children seem to have less difficulty than older learners in mastering some of the more “difficult” sounds of the language, including uvular consonants (p. 558). This particular Hul’q’umi’num’-only sound is perhaps more natural for children to produce than for adults, possibly based on developing oral/pharyngeal structures (Vorperian et al., Reference Vorperian, Kent, Lindstrom, Kalina, Gentry and Yandell2005). In contrast, adults have had less exposure to Hul’q’umi’num’ during childhood, potentially increasing the challenge of adult L2 consonant learning, especially for consonants with a close L1 counterpart, for example, Hul’q’umi’num’ /q/ versus English /k/ (Flege et al., Reference Flege, Yeni-Komshian and Liu1999). Indeed, even for children aged 13–15, reduced perceptual sensitivity to place of articulation contrasts (e.g., uvular vs. velar) and airstream contrasts (e.g., ejective vs. non-ejective) compared to younger children may result in more limited accuracy and greater inter-speaker variation in non-English consonant production (Smith, Reference Smith2011).
Very little is known about early L2 acquisition in language revitalization contexts. Future work may incorporate longitudinal research, which would be particularly valuable to allow practitioners to focus pedagogical efforts on challenges that may not resolve naturally in development, as children’s vocal tracts and fine motor control mature and as their exposure to the language increases.
5.2. Other interesting patterns
Setting aside questions specific to early language acquisition, three other patterns emerged that also point to potential areas for future work. First, the adults in our study seemed to produce target sounds more successfully than they did in Bird et al. (Reference Bird, Leonard, Nolan, Levis and Guskaroska2022), which had suggested a link between word familiarity and target-like production (Koirala, Reference Koirala, Helm, Bradley, Guarda and Thouësny2015; Thomson & Isaacs, Reference Thomson and Isaacs2009). Here, the target words were all ones that caregivers of young children are very familiar with: numbers 1–10, body parts, animals, and similar themes. The fact that, overall, adults’ production was relatively target-like (Figure 1) offers further support for the effect of familiarity on production. One specific instance where familiarity likely played a role was in the de-ejectivization of ejective affricates. In the loglinear analysis of ejectives, adults tended to de-ejectivize /ts’/ more than predicted, but to de-ejectivize /tθʼ/ less than predicted (Figure 2). As mentioned above, a possible explanation is that adults are familiar with the fact that /tθ/ occurs only in a very limited number of function words (demonstratives), and this influences their production of /tθʼ/ in particular, mitigating the prevalence of de-ejectivization.
Another finding of interest echoes the typological study of glottalized resonants (Gordon & Ladefoged, Reference Gordon and Ladefoged2001; Howe & Pulleyblank, Reference Howe and Pulleyblank2001; Silverman, Reference Silverman1997). We found that pre-glottalized resonants were more successfully produced than post-glottalized resonants (Figure 1). Based on our production data, it seems as though pre-glottalization is more salient than post-glottalization from the learner’s perspective, possibly because of the strong prosodic position with which it is associated with. This finding, if supported by more data, will shed further light on the functional (perceptual and articulatory) explanations of glottal timing in glottalized resonants (Howe & Pulleyblank, Reference Howe and Pulleyblank2001; Silverman, Reference Silverman1997).
Finally, children’s production of clusters is interesting from a cross-linguistic perspective. Two of the interviewed teachers in Bird and Kell (Reference Bird and Kell2017), who taught SENĆOŦEN to children in the band-run immersion school, noted that children insert vowels to break up consonant clusters, with one of the teachers indicating that this tendency resolves with practice. Interestingly, in our study, we did not observe vowel insertion among the children. This inconsistency is reminiscent of Holm and Dodd’s (Reference Holm and Dodd1999) findings, where one Cantonese–English bilingual child applied different phonological processes to the same cluster depending on the language, while another reduced clusters in both languages but with language-specific surface realizations that maintained phonotactic appropriateness. Holm and Dodd (Reference Holm and Dodd1999) also observed that the bilingual children sometimes used phonological processes atypical of monolingual speakers of either language, but attested among successive bilingual Cantonese–English learners. Taken together, these patterns suggest that the choice and realization of phonological processes may be shaped by language-specific constraints and that transfer-related mechanisms can influence bilingual phonological development.
5.3. Towards a description of Hul’q’umi’num’ child phonology
Many theoretical approaches to phonological acquisition seek to explain child production patterns within a coherent framework. Early theoretical approaches focused on the role of markedness and articulatory complexity in predicting when children produce consonants (Jakobson, Reference Jakobson1968; Kent, Reference Kent, Ferguson, Menn and Stoel-Gammon1992), examining typological frequencies or gestural properties of particular sounds to predict when they may emerge in child speech. A second approach instead emphasizes phonological patterns, including how the production of a particular sound interacts with its phonological context and the developing phonological system within a particular language (Edwards & Beckman, Reference Edwards and Beckman2008b; Edwards et al., Reference Edwards, Beckman and Munson2015; Ingram, Reference Ingram, McLeod and Goldstein2012). A third approach tries to capture the complex interplay between language-centred phonological factors and child-centred articulatory ones, accounting in a unified way for children’s individual cognitive, motor, and perceptual development (Vihman, Reference Vihman1996).
Methodological considerations limit our ability to lend evidence to any particular theoretical approach. We focused our analysis on ejectives, fricatives, and clusters, because these features of the sound system showed the most interesting patterns. Even for these sounds, though, our findings are limited: we are not able to systematically assess the influence of phonological factors, including markedness, phonotactics, and other frequency effects, because there does not yet exist a thorough description of Hul’q’umi’num’ phonology (although see Appendix B for consonant frequency within this dataset). Such factors would surely impact the ability of children to produce a particular sound (Edwards & Beckman, Reference Edwards and Beckman2008b; Edwards et al., Reference Edwards, Beckman and Munson2015; Ingram, Reference Ingram, McLeod and Goldstein2012).
Aside from limitations stemming from our incomplete understanding of Hul’q’umi’num’ sound structure and its processing by speakers and listeners, we also encountered limitations related to the specific data available. In several cases, prosodic, syllabic, and segmental effects were confounded. For example, word-medial clusters often showed more consonant deletion than predicted by the loglinear model (Figure 4). The most frequent word-medial clusters in our data were /ʔts/ and /ʔkʷ/, found in te’tsus “seven” (17 of 69 tokens) and tth’a’kwus “eight” (16 of 69 tokens; see Appendix C, Table C2). Both clusters start with the glottal stop /ʔ/, which previous Hul’q’umi’num’ work shows is often deleted word-medially by learners (Nolan & Bird, Reference Nolan and Bird2025). It is, therefore, unclear whether the source of /ʔ/-deletion was its position in the cluster, or the sound itself. A similar issue arose for word-initial fricatives, which often occurred in clusters (e.g., /ɬ/ in lhq’etsus “five”) (15 of 94 tokens – see Appendix C, Table C1). The under-production of /ɬ/ among children (Figure 1) may thus reflect cluster effects rather than, or in addition to, segmental effects. Likewise, /x/ was preserved less often by children than the loglinear model predicted (Figure 3), but this may be due to position. Among the stimuli, /x/ appeared primarily in the initial cluster of t’xum “six” (15 of 57 tokens) and in the initial unstressed syllable in xu’athun ([xə’aθən]) “four” (15 of 57 tokens) (Appendices A and B). Its relatively low realization may, therefore, be due to the cluster in t’xum and the weak prosodic position in xu’athun, rather than inherent difficulty with /x/ itself.
Some methodological limitations also stemmed from properties of the Hul’q’umi’num’ language itself. As is typical of Salish languages, Hul’q’umi’num’ has a rich consonant inventory and high morphological complexity, with many clusters resulting from single-consonant morphemes affixing onto verb stems, adjacent to another consonant. Consequently, minimal pairs are rare, making it inherently more difficult to establish benchmarks for phoneme acquisition compared to languages like English, which has extensive sets of minimal pairs (e.g., bat, pat, mat, fat, vat, that, sat, etc.).
Another limitation on experimental control stemmed from the wordlist design: caregivers devised word sets they considered most appropriate for the children in their care. This resulted in stimuli organized around semantic sets rather than phonological contrasts. As mentioned above, this approach was selected following community-oriented, collaborative decisions about preferred data collection methods. Following the work of Leonard (Reference Leonard, McDonnell, Berez-Kroeker and Holton2018) and others, we prioritized relationality by entrusting key aspects of methodological decision-making to community members, including choices that shaped experimental control. Ultimately, in a language with relatively few minimal pairs, and with the goal of increasing participation by allowing caregivers to select words familiar to their children, the limited wordlist unavoidably introduced some confounds. As child lexicons grow and caregiver collaboration strengthens, future research teams can develop more targeted wordlists to help disentangle these confounds.
More broadly, the limitations outlined above illuminate interesting avenues for future research in relation to the frequency of exposure to sounds in general as well as to specific consonants. First, it is essential to obtain better data about children’s exposure to Hul’q’umi’num’ sounds. The children in our study are exposed to much less Hul’q’umi’num’ than children growing up in a typical L1, or even an early L2, environment (c.f. Hoff & Core, Reference Hoff and Core2013; Hoff et al., Reference Hoff, Core and Shanks2020). In addition, they are most frequently exposed to Hul’q’umi’num’ from adult L2 learners, which also needs to be taken into consideration. For example, previous work (Bird et al., Reference Bird, Leonard, Nolan, Levis and Guskaroska2022; Nolan & Bird, Reference Nolan and Bird2025) has shown that adult learners often pronounce glottalized resonants as their plain counterparts, and similarly pronounce ejective stops as plain stops. This may further limit the children’s exposure to these sounds. It is unclear whether the children’s challenges with certain Hul’q’umi’num’ sounds are due to lack of exposure, perceptual difficulties, or productive difficulties. In addition, Hul’q’umi’num’ words and their consonants may be distributed unevenly across child and adult contexts of use; for example, children may use particular words, like the ones in the current study, more frequently than adults, such as through school programmes or children’s songs. We know nothing yet about the frequency of exposure to specific consonants across domains of language use, and therefore how this might affect production. This is another area for future work.
In general, because adults and children in the Hul’q’umi’num’-speaking community are English-dominant, the L1 age of acquisition reported elsewhere (e.g., Maphalala et al., Reference Maphalala, Pascoe and Smouse2014; McLeod & Crowe, Reference McLeod and Crowe2018; Wagner & Baker-Smemoe, Reference Wagner and Baker-Smemoe2013) may not provide an appropriate or practical baseline because of both the amount and the nature of exposure. The best data from which to characterize the progress of any specific Hul’q’umi’num’-learning child must come from the Hul’q’umi’num’ community itself, and this paper is the first step in this direction.
6. Conclusions
The present study sheds light on child production of Hul’q’um’num’ consonants. The results demonstrate multiple consistencies with established findings on monolingual consonant acquisition in English and other languages, including greater variation among children than adults (especially for fricatives), difficulty with commonly later-acquired consonants (e.g., /l/ and /θ/), and the use of phonological processes like debuccalization and cluster simplification (Stemberger, Reference Stemberger1993). Such parallels suggest that similar developmental constraints (e.g., cognitive, motoric, and perceptual) underlie consonant acquisition across languages (McLeod & Crowe, Reference McLeod and Crowe2018). The findings also align with research on imbalanced bilingualism and L2 acquisition, where both children and adults tend to show lower accuracy and greater variability for sounds absent from their dominant language (Hoff et al., Reference Hoff, Core and Shanks2020).
Interestingly, some Hul’q’umi’num’ consonants (e.g., certain ejectives, fricatives, and resonants) posed greater challenges for children than adults, while others (e.g., the uvular stop /q/) showed the opposite pattern. This indicates that age-related and language-experience-related factors may interact in non-uniform ways across sound types, underscoring the complexity of Hul’q’umi’num’ phonological development and the need for further systematic investigation. As the revitalizing speech community grows and diversifies, future work should examine how intergenerational transmission, varied exposure, and bilingual experience shape consonant acquisition trajectories.
By investigating Hul’q’umi’num’ consonant acquisition, this study aims to support the local community of parents, teachers, and other practitioners working with young children learning Hul’q’umi’num’, shaping early expectations about consonant acquisition trajectories. As Bird and Kell (Reference Bird and Kell2017) observe, “A better understanding of the developmental course of speech production would likely help to alleviate teachers’ and Elders’ stated concerns specific to younger speakers” (p. 557), particularly in communities that have had limited opportunities to develop anecdotal norms through natural transmission. The consistencies observed with L1 and L2 research suggest that shared developmental and transfer-related mechanisms guide Hul’q’umi’num’ acquisition. Recognizing these parallels, future work that teases apart these sources of variation can clarify which patterns reflect typical developmental trajectories that are likely to resolve with age and which patterns signal persistent gaps that may require intervention (Chee & Henke, Reference Chee, Henke, Dagostino, Mithun and Rice2024). Pedagogical resources can then be more effectively designed, with strategies devised according to the underlying source, such as increasing the quantity and quality of exposure or providing more explicit instruction. The findings may also be relevant to neighbouring speech communities engaged in language revitalization.
Finally, this study documents early child speech production in Hul’q’umi’num’, which contains ejectives, glottalized resonants, extensive coronal contrasts (i.e., dental, alveolar, and lateral) spanning multiple manners of articulation (i.e., plain and ejective stops, fricatives and affricates), and velar and uvular contrasts across both manner (i.e., plain and ejective stops, fricatives) and coarticulation (i.e., labialized vs. non-labialized). The production patterns observed here may also bear implications for phonological theory, particularly regarding the role of word familiarity and explicit rule awareness in target-like productions, potential functional explanations for glottal timing in glottalized resonants, and cross-linguistic variation in phonological processes such as vowel insertion in clusters. Finally, we provide a model for documenting and analysing phonological acquisition with sparse data, in contexts where prescribing phonologically optimal wordlists is not always feasible, and in a learner population that is exposed primarily to L2 speakers, in some cases for just a few hours per week. Altogether, future studies of Hul’q’umi’num’ acquisition can accelerate local pedagogical efforts while deepening academic understanding of phonological development in language revitalization contexts.
Acknowledgements
In collaboration with Roseanna George, Swustanulwut Delores Louie, Donna Gerdts, Elise K. McClay, Samantha Sundby, Blair Chartrand, Chloë Farr, Elaine Seymour, Georgina Seymour, Sti’tum’atul’wut Dr. Ruby Peter, and Allegra Simionato.
nan ’uw’ stl’i’ tthu s’aa’lh sqwal, tthu hul’q’umi’num’ sqwal, ’i’ nan ’uw’ thimatstum tthu s’ul’eluhw tst kws ta’ulthuns tthu shmuneem’ tst. Sutst ’uw’ ts’iyulhnamut ’utl’ First Peoples’ Cultural Foundation kws ’amustaal’t ’u tthu telu xwte’ ’u tthu ’iyus mumun’lh Language Nest. ts’iit tst tse’ tthu shhwuw’elis tthu shmuneem’s kwsus ts’ewetaal’t. nan tst ’uw’ ’iyus tthu sqwaluwun tst kwutst hwu’alum’stuhw tu’i syaays hwnem’ ’u tthu ts’lhhwulmuhwtst. tl’uw’ ts’iyulhnamut ’utl’ Sti’tum’at, late Dr. Ruby Peter, ’i’ Swustalnulwut, late Delores Louie. ’i’ sp’aqw’um’ultunat, Professor Donna Gerdts, kws ts’ets’uw’utaal’t ’u tthu syaays.
Our Hul’q’umi’num’ language is very important to us, and so it is important to our Elders that the children learn our language. We thank the First Peoples’ Cultural Foundation for funding our ‘iyus mumun’lh Language Nest. We want to thank the parents and the children who helped us. We are happy to return this work to our community. We also thank Sti’tum’at (the late Dr. Ruby Peter), Swustalnulwut (the late Delores Louie) and Sp’aqw’um’ultunat (Professor Donna Gerdts) for helping us with this work.
ni’ hul’q’umi’num’stum ‘utl’ pul-hwuletse’, Wayne Charlie, tu’i sqwal tst.
Our words here were translated by pul-hwuletse’ (Wayne Charlie).
Funding statement
This project was funded by SSHRC Partnership Development Grant #890–2017-0026, Hul’q’umi’num’ phonetic structures: Exploring paths towards fluent pronunciation and by SSHRC Partnership Grant #895–2020-1004: Ensuring Full Literacy in a Digital and Multicultural World.
Competing interests
The authors declare none.
Ethics statement
Our ethics protocol is administered by the University of Victoria’s Human Research Ethics Board. The protocol is harmonized with Simon Fraser University’s ethics board. Protocol/approval number: H21-01658. Consent: written consent from the parents, who also made sure that the children in their care wanted to participate.
Disclosure of use of AI tools
The authors declare none.
Appendix A
Target words

Table A1. Long description
The table is organized into two side-by-side sections, each with three columns: Hul’q’umi’num’ word, English gloss, and Count.
Left Section Highlights:
- yuse’lu: 2 (Count 17)
- te’tsus: 8 (Count 17)
- t’xum: 6 (Count 17)
- tth’a’kwus: 7 (Count 16)
- toohw: 9 (Count 16)
- nuts’a’: 1 (Count 16)
- xu’athun: 4 (Count 15)
- lhq’etsus: 5 (Count 15)
- lhihw: 3 (Count 15)
- ‘apun: 10 (Count 15)
- t’eluw’: arm or wing (Count 8)
- kwushou: pig (Count 6)
- tunuqsun: duck or mallard (Count 5)
- tumus: otter (Count 5)
- qwuni: seagull (Count 5)
- qw’oon’: ear (Count 5)
- q’ullhanumutsun: killer whale (Count 5)
- kw’aant’: dolphin or porpoise (Count 5)
- tsq’ix: black (Count 4)
- qulum’: eye (Count 4)
- luluts’: yellow (Count 4)
- yuxwule’: bald eagle (Count 3)
- yunus: tooth (Count 3)
- tumulhalus: brown (Count 3)
- tskwim: red (Count 3)
- tsiitmuhw: owl (Count 3)
- thathun: mouth (Count 3)
- syulwulhnet: Monday (Count 3)
- sxun’u: foot or leg (Count 3)
- sxu’athuns: Thursday (Count 3)
- stqeeye’: wolf (Count 3)
- spe’uth: bear (Count 3)
- spaal’: raven (Count 3)
- snuxshun: toe (Count 3)
- she’itun: hair (Count 3)
- s’athus: face (Count 3)
- q’e’mi’: young lady (Count 3)
- p’uq’: white (Count 3)
- kwulu’a’alus: orange (Count 3)
Right Section Highlights:
- xihwu: sea urchin (Count 2)
- wuxus: frog (Count 2)
- tth’etth’uhwum’: purple (Count 2)
- sxwut’ts’uli: hummingbird (Count 2)
- sxayukw’us: raccoon (Count 2)
- suxulhnet: Sunday (Count 2)
- stseelhtun: salmon (Count 2)
- stiqiw: horse (Count 2)
- sthumunts: Tuesday (Count 2)
- sqwumey’: dog (Count 2)
- sqw’ulesh: bird (Count 2)
- sququweth: rabbit (Count 2)
- squl’ew’: beaver (Count 2)
- sqi’mukw’: octopus (Count 2)
- smuyuth: deer or meat (Count 2)
- smuqw’a’: heron (Count 2)
- slhq’etsuss: Friday (Count 2)
- slhihws: Wednesday (Count 2)
- shes: sea lion (Count 2)
- s’axwa’: butter clam (Count 2)
- qwunus: whale (Count 2)
- pous: cat (Count 2)
- neni: goat (Count 2)
- mousmus: cow (Count 2)
- ma’uqw: duck (Count 2)
- lumutou: sheep (Count 2)
- lul’puts: little rabbit (Count 2)
- kw’et’un’: mouse (Count 2)
- hewt: rat (Count 2)
- chichkun’: chick (Count 2)
- ‘ey’x: crab (Count 2)
- ‘exu: goose (Count 2)
- tth’ele’: heart (Count 1)
- tsqway: green (Count 1)
- t’aqw’tum’: Saturday (Count 1)
- quqi’lum’: eyes (Count 1)
- muxwuye’: belly button (Count 1)
- muqsun: nose (Count 1)
Appendix B
Target consonants

Table B1. Long description
The table consists of four columns: Consonant, Tokens in C C sequences, Tokens not in C C sequences, and Tokens total.
* Glottal stop: 38, 83, 121
* Glottalized l: 0, 19, 19
* Glottalized m: 0, 5, 5
* Glottalized n: 0, 0, 0
* Glottalized w: 0, 0, 0
* Glottalized y: 0, 0, 0
* ch: 2, 2, 4
* ch-prime: 0, 0, 0
* h: 0, 2, 2
* h w: 2, 38, 40
* k: 2, 0, 2
* k w: 19, 9, 28
* k w-prime: 0, 11, 11
* l: 8, 41, 49
* l-prime: 2, 5, 7
* l h: 31, 19, 50
* m: 9, 45, 54
* m-prime: 0, 8, 8
* n: 18, 93, 111
* n-prime: 0, 12, 12
* p: 8, 18, 26
* p-prime: 0, 3, 3
* q: 15, 10, 25
* q-prime: 21, 11, 32
* q w: 3, 9, 12
* q w-prime: 3, 7, 10
* s: 71, 97, 168
* s h: 3, 13, 16
* t: 13, 56, 69
* t-prime: 24, 11, 35
* t h: 2, 34, 36
* t l-prime: 0, 0, 0
* t s: 29, 27, 56
* t s-prime: 2, 20, 22
* t t h: 0, 0, 0
* t t h-prime: 0, 21, 21
* w: 5, 6, 11
* w-prime: 0, 10, 10
* x: 30, 27, 57
* x w: 2, 6, 8
* y: 3, 32, 35
* y-prime: 2, 2, 4
* Total: 367, 812, 1179
Note: The table titles are the same as the appendix titles, which seems like a bit of unecessary duplication. Is this ok? If there’s a better way to label the appendices and their tables, let us know.
Appendix C
Word-initial target CC sequences

Table C1. Long description
The table contains five columns: Cluster, Hul’q’umi’num’ word, Token count, Cluster type, and Sonority change.
* Row 1: t’x, t’xum, 17, Stop-Fricative, Rise.
* Row 2: lhq’, lhq’etsus, 15, Lateral fricative-Stop, Fall.
* Row 3: tsq’, tsq’ix, 4, Affricate-Stop, Fall.
* Row 4: stq, stqeeye’, 3, Fricative-Stop-Stop, Mixed.
* Row 5: sp, spe’uth, 3, Fricative-Stop, Fall.
* Row 6: sp, spaal’, 3, Fricative-Stop, Fall.
* Row 7: s’, s’athus, 3, Fricative-Stop, Fall.
* Row 8: sy, syulwulhnet, 3, Fricative-Resonant, Rise.
* Row 9: sn, snuxshun, 3, Fricative-Resonant, Rise.
* Row 10: sx, sxun’u, 3, Fricative-Fricative, Level.
* Row 11: sx, sxu’athuns, 3, Fricative-Fricative, Level.
* Row 12: tskw, tskwim, 3, Affricate-Stop, Fall.
* Row 13: st, stiqiw, 2, Fricative-Stop, Fall.
* Row 14: sqw’, sqw’ulesh, 2, Fricative-Stop, Fall.
* Row 15: sqw, sqwumey’, 2, Fricative-Stop, Fall.
* Row 16: sq, sququweth, 2, Fricative-Stop, Fall.
* Row 17: sq, squl’ew’, 2, Fricative-Stop, Fall.
* Row 18: sq, sqi’mukw’, 2, Fricative-Stop, Fall.
* Row 19: s’, s’axwa’, 2, Fricative-Stop, Fall.
* Row 20: sm, smuyuth, 2, Fricative-Resonant, Rise.
* Row 21: sm, smuqw’a’, 2, Fricative-Resonant, Rise.
* Row 22: slhq’, slhq’etsuss, 2, Fricative-Lateral fricative-Stop, Mixed.
* Row 23: slh, slhihws, 2, Fricative-Lateral fricative, Level.
* Row 24: sxw, sxwut’ts’uli, 2, Fricative-Fricative, Level.
* Row 25: sx, sxayukw’us, 2, Fricative-Fricative, Level.
* Row 26: sth, sthumunts, 2, Fricative-Fricative, Level.
* Row 27: sts, stseelhtun, 2, Fricative-Affricate, Fall.
* Row 28: tsqw, tsqway, 1, Affricate-Stop, Fall.
The final row indicates a total token count of 94.
Word-medial target CC sequences

Table C2. Long description
The table contains 16 data rows and a total row.
* Row 1: Cluster t s, word te’tsus, count 17, type Stop-Affricate, sonority Rise.
* Row 2: Cluster k w, word tth’a’kwus, count 16, type Stop-Stop, sonority Level.
* Row 3: Cluster q s, word tunuqsun, count 5, type Stop-Fricative, sonority Rise.
* Row 4: Cluster l l h, word q’ullhanumutsun, count 5, type Lateral resonant-Lateral fricative, sonority Fall.
* Row 5: Cluster t m, word tsiitmuhw, count 3, type Stop-Resonant, sonority Rise.
* Row 6: Cluster l w, word syulwulhnet, count 3, type Lateral resonant-Resonant, sonority Level.
* Row 7: Cluster l h n, word syulwulhnet, count 3, type Lateral fricative-Resonant, sonority Rise.
* Row 8: Cluster x s h, word snuxshun, count 3, type Fricative-Fricative, sonority Level.
* Row 9: Cluster t’ t s’, word sxwut’ts’uli, count 2, type Stop-Affricate, sonority Rise.
* Row 10: Cluster l’ p, word lul’puts, count 2, type Lateral resonant-Stop, sonority Fall.
* Row 11: Cluster l h t, word stseelhtun, count 2, type Lateral fricative-Stop, sonority Fall.
* Row 12: Cluster l h n, word suxulhnet, count 2, type Lateral fricative-Resonant, sonority Rise.
* Row 13: Cluster s m, word mousmus, count 2, type Fricative-Resonant, sonority Rise.
* Row 14: Cluster c h k, word chichkun’, count 2, type Affricate-Stop, sonority Fall.
* Row 15: Cluster q w’ t, word t’aqw’tum’, count 1, type Stop-Stop, sonority Level.
* Row 16: Cluster q s, word muqsun, count 1, type Stop-Fricative, sonority Rise.
* Total Row: Token count 69.
Word-final target CC sequences

Table C3. Long description
The table consists of five columns: Cluster, Hul’q’umi’num’ word, Token count, Cluster type, and Sonority change.
* Row 1: Cluster n t apostrophe; Word kw’aant’; Token count 5; Cluster type Resonant-Stop; Sonority change Fall.
* Row 2: Cluster n s; Word sxu’athuns; Token count 3; Cluster type Resonant-Fricative; Sonority change Fall.
* Row 3: Cluster w t; Word hewt; Token count 2; Cluster type Resonant-Stop; Sonority change Fall.
* Row 4: Cluster y apostrophe x; Word ey’x; Token count 2; Cluster type Resonant-Fricative; Sonority change Fall.
* Row 5: Cluster n t s; Word sthumunts; Token count 2; Cluster type Resonant-Affricate; Sonority change Fall.
* Row 6: Cluster s s; Word slhq’etsuss; Token count 2; Cluster type Fricative-Fricative; Sonority change Level.
* Row 7: Cluster h w s; Word slhihws; Token count 2; Cluster type Fricative-Fricative; Sonority change Level.
* Final Row: Total Token count 18.
Appendix D
Consonant frequency by dyad.
Note: Bars indicate (log) frequency counts of consonants spoken within each dyad; orange bars refer to consonants found in both English and Hul’q’umi’num’; purple bars correspond to Hul’qumi’num’ only consonants. As in Figure 1, yellow lines and dots indicate adult token counts, while green lines and dots indicate child token counts. IPA labels in bold red font indicate where child counts exceeded adult counts. Y-axis tick marks are on a log10 scale.

Figure D1. Long description
A multi-panel figure containing 14 individual bar charts, each representing a specific child-adult dyad (e.g., Child 0 with Adult 3).
* Axes and Legend: Each chart has a vertical y-axis labeled Count on a log 10 scale with ticks at 0, 1, 3, 10, 30, and 60. The horizontal x-axis lists various I P A consonant symbols. A legend at the bottom indicates that orange bars represent consonants found in both languages, while purple bars represent Hul’q’umi’num’ only consonants. Yellow dots and lines indicate adult token counts, while green dots and lines indicate child token counts.
* Data Trends: In most panels, orange bars (shared consonants) appear on the left with higher frequencies, while purple bars (language-specific) appear on the right with lower frequencies.
* Comparative Markers: Red bold I P A labels on the x-axis highlight specific consonants where the green child dots are positioned higher than the yellow adult dots, indicating higher child usage. For example, in Child 7 with Adult 3, several symbols at the far right are marked in red.
* Distribution: The charts show varying levels of phonetic overlap. Some dyads, like Child 7 and Child 9, show a much wider range of consonants (up to 60 counts) compared to others like Child 5 or Child 12 which peak around 10 counts.
Speaker dyads

Table D1. Long description
The table contains 8 columns: Child I D, Child age, Child age of exposure, Adult I D, Files, Words, Consonant attempts, and Unique-consonant attempts.
* Child_0: age 3;8, exposure ~3, Adult_3, 2 files, 10 words, 34 consonant attempts, 19 unique.
* Child_1: age 3;0, exposure Unknown, Adult_4, 1 file, 20 words, 64 consonant attempts, 18 unique.
* Child_10: age 7;11, exposure Unknown, Adult_1, 2 files, 20 words, 64 consonant attempts, 18 unique.
* Child_11: age 2 almost 3, exposure Unknown, Adult_6, 10 files, 10 words, 34 consonant attempts, 17 unique.
* Child_12: age ~6, exposure Unknown, Adult_6, 10 files, 10 words, 32 consonant attempts, 18 unique.
* Child_2: age ~6, exposure Unknown, Adult_3, 1 file, 10 words, 32 consonant attempts, 18 unique.
* Child_3: age ~8, exposure Unknown, Adult_6, 10 files, 10 words, 33 consonant attempts, 18 unique.
* Child_4: age 4;2 and 4;3, exposure ~2, Adult_5, 2 files, 31 words, 100 consonant attempts, 18 unique.
* Child_5: age Unknown, exposure Unknown, Adult_0, 1 file, 10 words, 32 consonant attempts, 18 unique.
* Child_6: age Unknown, exposure Unknown, Adult_0, 1 file, 7 words, 22 consonant attempts, 15 unique.
* Child_7: age 7;3, exposure ~4, Adult_3, 2 files, 88 words, 315 consonant attempts, 35 unique.
* Child_8: age 4;2, exposure ~2, Adult_5, 1 file, 20 words, 64 consonant attempts, 18 unique.
* Child_9: age 3;5, exposure 0;3, Adult_2, 3 files, 6 words, 18 consonant attempts, 8 unique.
* Child_9 (second entry): age 3;2, 3;5, and 3;10, exposure 0;3, Adult_3, 5 files, 89 words, 335 consonant attempts, 26 unique.
Note: Each row describes one child–adult dyad. Child age of exposure refers to the age at which the child was first exposed to Hul’q’mi’num’. Files refer to the number of recordings featuring the dyad. Words refer to the number of words produced per member of the dyad, excluding words removed from analysis (e.g., due to noise). Consonant attempts refer to the number of times that each member of the dyad attempted to produce a consonant, excluding those in removed words. Unique-consonant attempts refer to the number of unique consonants that each member of the dyad attempted to produce, excluding those in removed words.
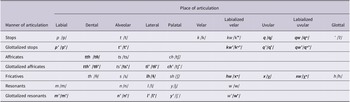
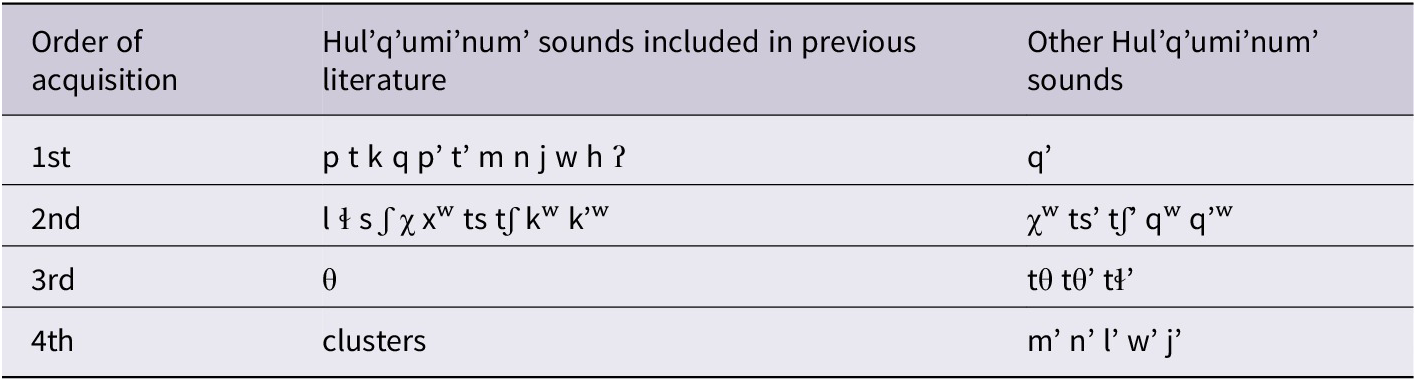
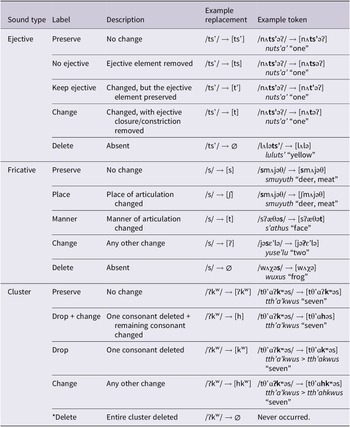

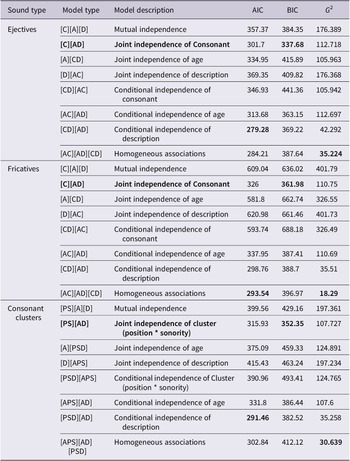
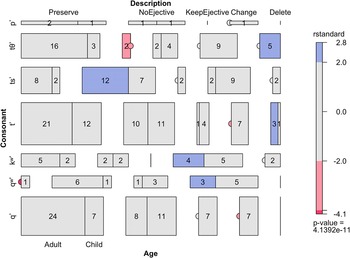
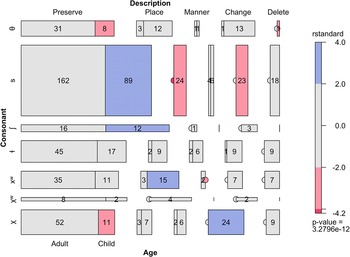
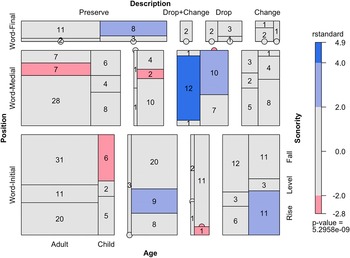
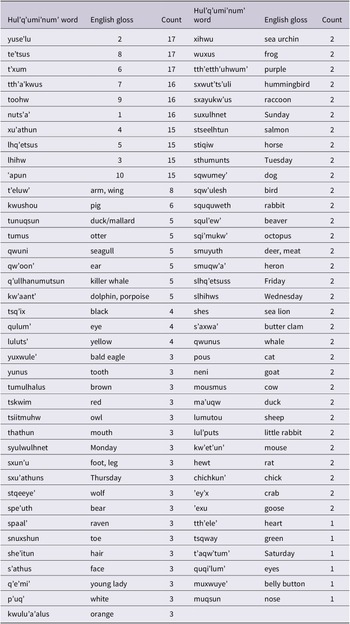
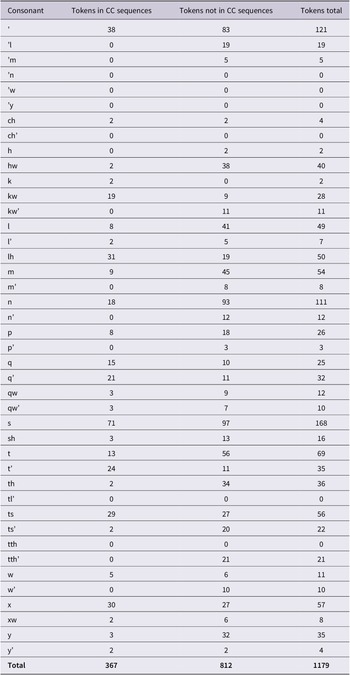
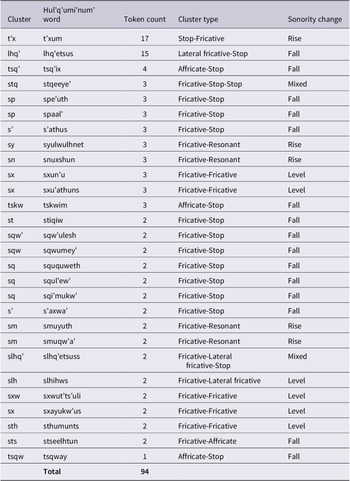
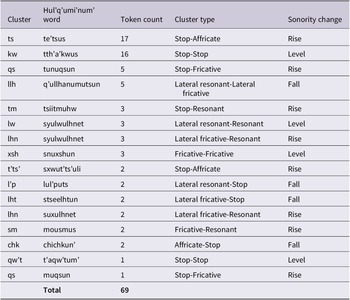

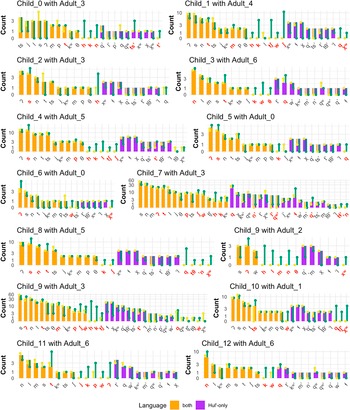
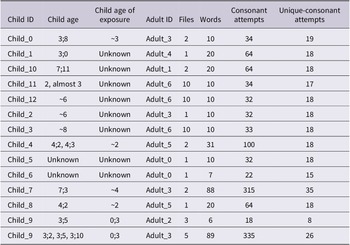

 Open access

