


INTRODUCTION
Arctic sea-ice coverage, especially the summer ice coverage, has been observed to be undergoing accelerated depletion since satellite-based measurements became available in the late 1970s (e.g. Parkinson and others, Reference Parkinson, Cavalieri, Gloersen, Zwally and Comiso1999; Comiso and Nishio, Reference Comiso and Nishio2008; Peng and others, Reference Peng, Meier, Scott and Savoie2013; Parkinson, Reference Parkinson2014; Serreze and Stroeve, Reference Serreze and Stroeve2015). Arctic ice has been declining at a faster rate for the last 20 years (1997–2016) compared with the average decline over the previous 20 years (1978–97). The record low value for annual minimum sea-ice coverage level was observed in 2012, breaking records previously set in 2005, and then again in 2007. The 2016 value tied with 2007 for second lowest Arctic sea-ice minimum on record according to the National Snow and Ice Data Center (NSIDC) (http://nsidc.org/arcticseaicenews/2016/09/2016-ties-with-2007-for-second-lowest-arctic-sea-ice-minimum/). Since the late 1970s, satellite measurements have recorded a decrease of 10–15% per decade in the Arctic annual minimum sea-ice extent (SIE), as measured by the area within the 15% concentration contour (e.g. Comiso and Nishio, Reference Comiso and Nishio2008; Cavalieri and Parkinson, Reference Cavalieri and Parkinson2012), with a reduction of 49% sea ice in extent based on remote-sensing observations (Cavalieri and Parkinson, Reference Cavalieri and Parkinson2012) and 80% in sea-ice volume based on output from the Pan-Arctic Ice Ocean Modeling and Assimilation System (PIOMAS; Zhang and Rothrock, Reference Zhang and Rothrock2003), relative to the 1979–2000 average. This loss of Arctic sea ice is also occurring at a rate that is faster than what climate models with enhanced greenhouse forcing have predicted (Stroeve and others, Reference Stroeve2012). In addition, the sea-ice winter ice extent has been setting record lows for the last 3 years in a row (Thompson, Reference Thompson2017), reducing the amount of Arctic sea ice available for potential melting.
Temporal and regional variability of sea-ice coverage has also been observed, indicating that the changes are not uniform in space and time as a result of local geographic and weather effects (e.g. Parkinson and others, Reference Parkinson, Cavalieri, Gloersen, Zwally and Comiso1999; Liu and others, Reference Liu, Curry and Hu2004; Meier and others, Reference Meier, Stroeve and Fetterer2007; Koldunov, Reference Koldunov2010). Sea-ice decline has been observed to be most pronounced in the coastal zones of the Laptev, East Siberian, Chukchi, Barents and Beaufort Seas (Meier and others, Reference Meier, Stroeve and Fetterer2007). Arctic summer circulation may contribute to regional sea-ice anomalies (Lynch and others, Reference Lynch, Serreze, Cassano, Crawford and Stroeve2016). Spatial sea-ice variability may lead to a large spread in climate model sea-ice area projections and therefore induce high uncertainty on regional scales (Semenov and others, Reference Semenov, Martin, Behrens and Latif2015).
The rapid and accelerated sea-ice loss has local and remote effects on climate and weather systems (Bhatt and others, Reference Bhatt2014; Vihma, Reference Vihma2014). It poses extreme challenges to the sustainability and resilience of the Arctic system, while potentially bringing new opportunities, such as access to new sources of natural resources and ocean transportation routes (ACIA, 2004; Kattsov and others, Reference Kattsov2010; Jeffries and others, Reference Jeffries, Richter-Menge and Overland2014).
Since satellite-based measurements became available in the late 1970s, satellite-derived sea-ice estimates of concentration and extent have helped the cryosphere community understand and monitor Arctic sea-ice state. However, multiple types of sensors from multiple missions are utilized to formulate long-term time series of sea ice. Therefore, it is essential to update and baseline the historical change on the Arctic-wide and regional scales from a consistent, intercalibrated, well-documented, long-term time series of sea-ice data to help understand the vulnerability of the Arctic system, monitor and communicate future changes, and guide future opportunity development. In this paper, a long-term time series of sea-ice coverage is analyzed using a satellite-based, intercalibrated, and mature sea-ice concentration data product for the period of 1979–2015. The temporal and regional variability of sea-ice coverage in the Arctic is examined and regions of summer-opening vulnerability to further warming are identified.
DATASET DESCRIPTION
Monthly sea-ice concentration fields from a long-term, consistent, satellite-based passive microwave sea-ice concentration climate data record (CDR) are utilized (Meier and others, Reference Meier2013). This sea-ice concentration product leverages two well-established concentration algorithms – namely, the NASA Team (NT) and Bootstrap (BT) – both developed at and produced by the NASA Goddard Space Flight Center (GSFC). The CDR product is generated by a combined sea-ice algorithm and meets CDR criteria in terms of reproducibility, transparency, documentation and metadata standards. Description and verification of the CDR can be found in Peng and others (Reference Peng, Meier, Scott and Savoie2013) and Meier and others (Reference Meier, Peng, Scott and Savoie2014), respectively.
The monthly merged Goddard sea-ice concentration fields (hereinafter referred to as GSFC SIC) for the period of 1979–2015 are used for the study. These GSFC SIC fields are on a nominal 25 km × 25 km grid in the northern polar region. Previous studies of SIE trends have been using SIC retrievals from either the NT or BT algorithm. The CDR merging algorithm helps mitigate the known issue of underestimated SIC values from NT and BT algorithms (Meier and others, Reference Meier, Peng, Scott and Savoie2014). It is particularly improved in the Arctic summer over the previous publications that used the NT algorithm; this means that the summer trends likely have more confidence because there is less influence of melt on the summer concentration trend. The CDR product matches closely with the BT algorithm (Meier and others, Reference Meier, Peng, Scott and Savoie2014), but regional trends from BT have not been published since 2008 with data through 2007 (Comiso and Nishio, Reference Comiso and Nishio2008).
The sea-ice concentration estimates derived from satellite measurements are generally reliable for values that are at 15% or higher, with sensor footprints up to ~45 km × ~70 km. The spatial resolution varies depending on the data source. The accuracy of estimated SIE and their trends is dependent on the SIC retrieval accuracy and the satellite measurement resolutions.
SIE in this paper is computed based on the 15% SIC threshold from the monthly GSFC SIC fields for the record period of 1979–2015. Retrieved estimates of zero SIE derived from this approach does not necessarily mean that the region is totally ice-free, but instead denotes the state that there are no grid cells with SIC values of higher than 15% estimates from the GSFC SIC algorithm. All the cells within the pole hole are assumed to be covered by at least 15% of ice.
Spatial distributions of climatological averages and SDs of GSFC SIC from monthly fields over 1979–2015 are shown in Figs. 1a and b with the number of valid data points in Fig. 1c. The variation in valid data points in the central Arctic is due to the change in the pole hole sizes in July 1987. Figure 1d shows the percentage of ice presence with SIC >15% (hereinafter referred to as ice frequency).
Spatial distributions of (a) SIC climatological mean from monthly fields, (b) SIC SD, (c) valid data points and (d) percentage of ice presence for SIC ≥ 15%, for the period of 1979–2015. The color bar unit is ice area fraction for (a) and (b). Landmasses are shaded gray. Other water masses and the pole hole are denoted in white.
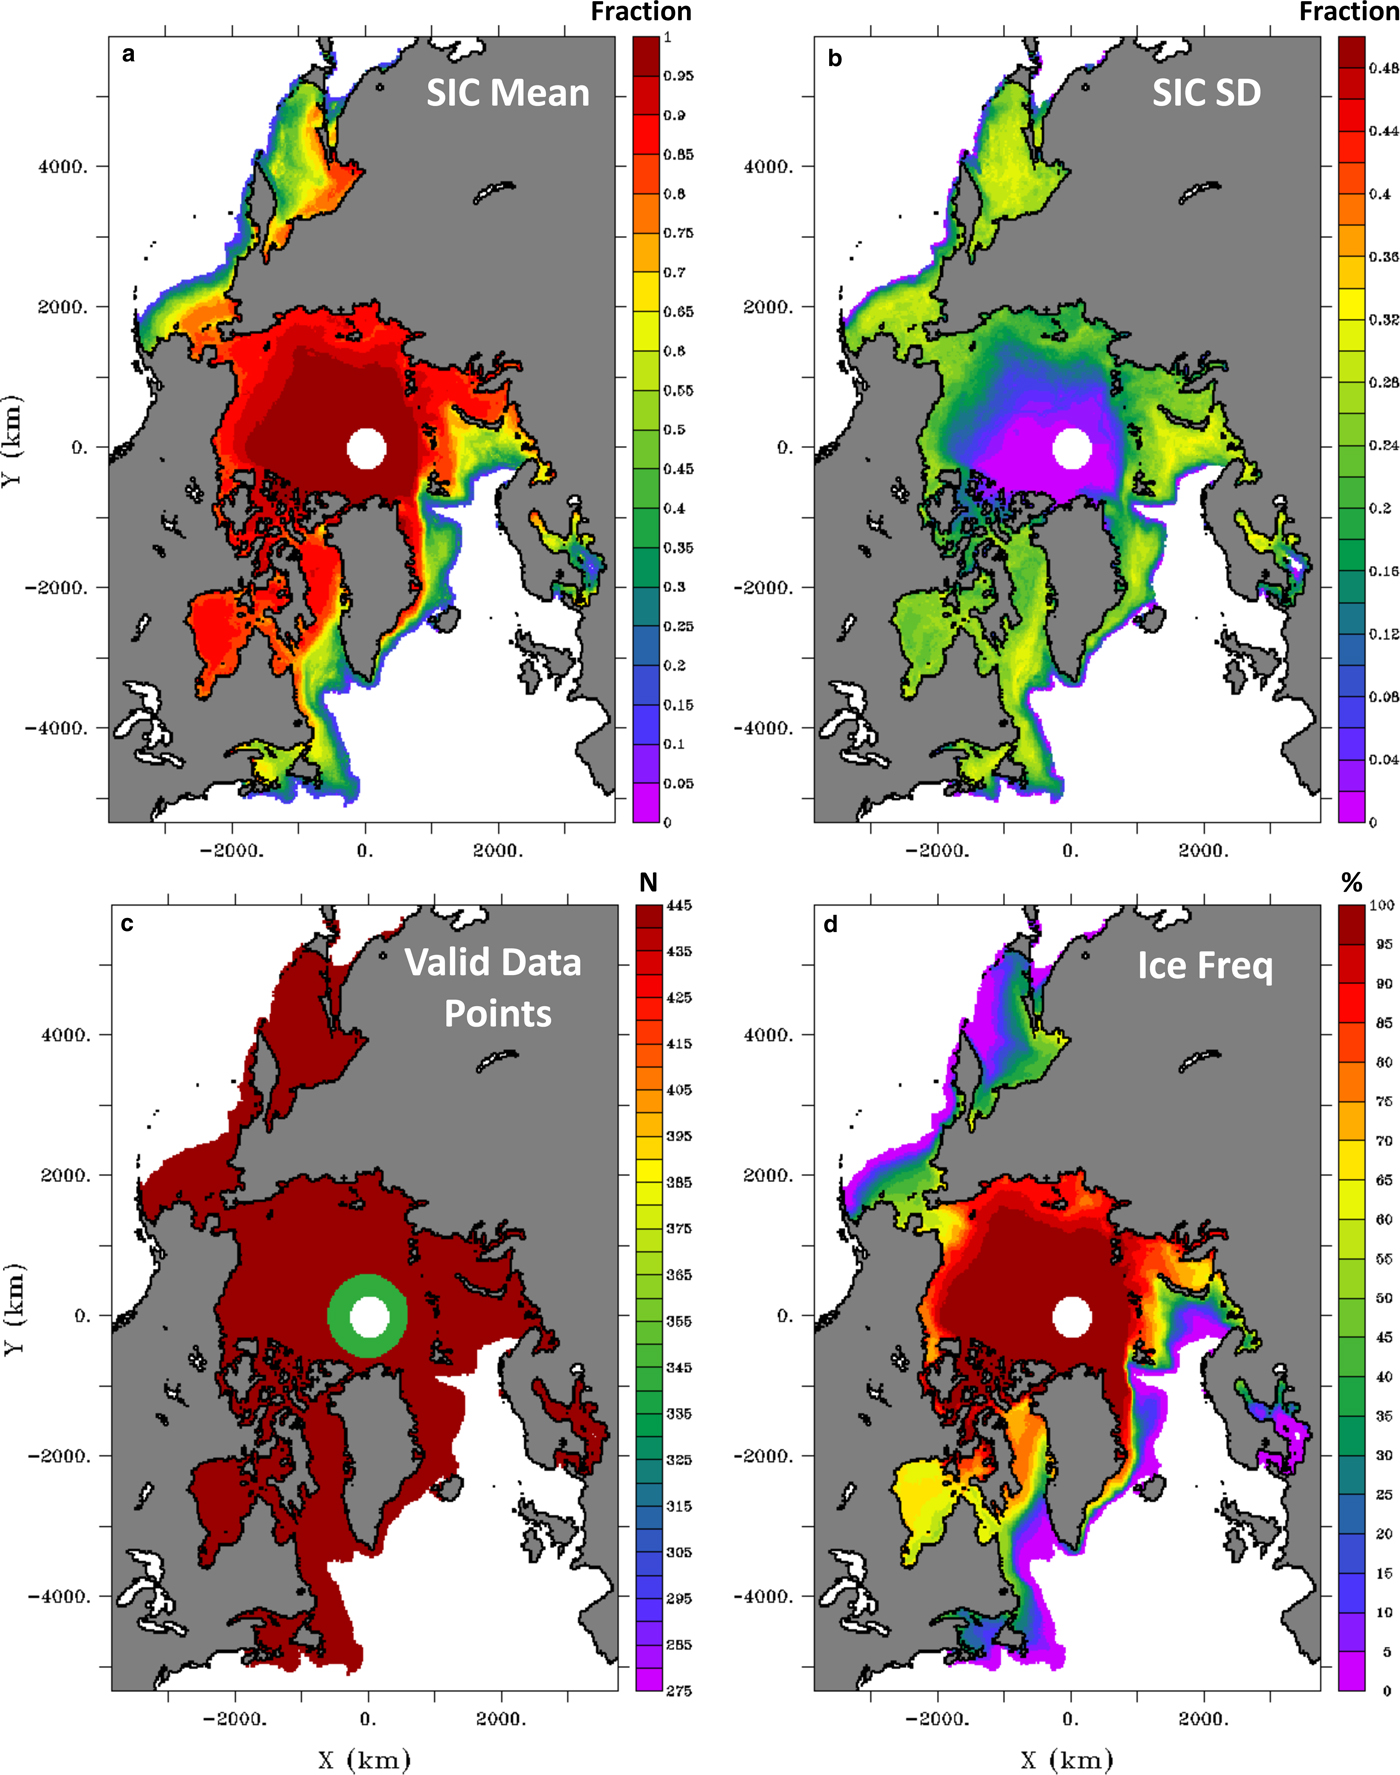
The areas with larger spatial variability appear to have larger temporal variability (comparing Fig. 1a with b) and relative low ice frequency (comparing Fig. 1a with d) as well. This is largely driven by the fact that ice is seasonal in these areas. In some regions, there are persistent winter freeze-ups or summer openings. As the result, the monthly SIC values in these areas can be mostly either zeros in summer months or ones in winter months. Therefore, the distribution of SIC (over the 12 calendar months) may not be normal. Although the standard derivation shown in Fig. 1b still measures the deviance of the monthly SIC values from their climatology averages shown in Fig. 1a, it is possible all the values of SIC may not necessarily lie within three SDs. Furthermore, depending on whether the distribution skews toward zero or one, the mean, namely, the climatology average, is smaller or larger than its median.
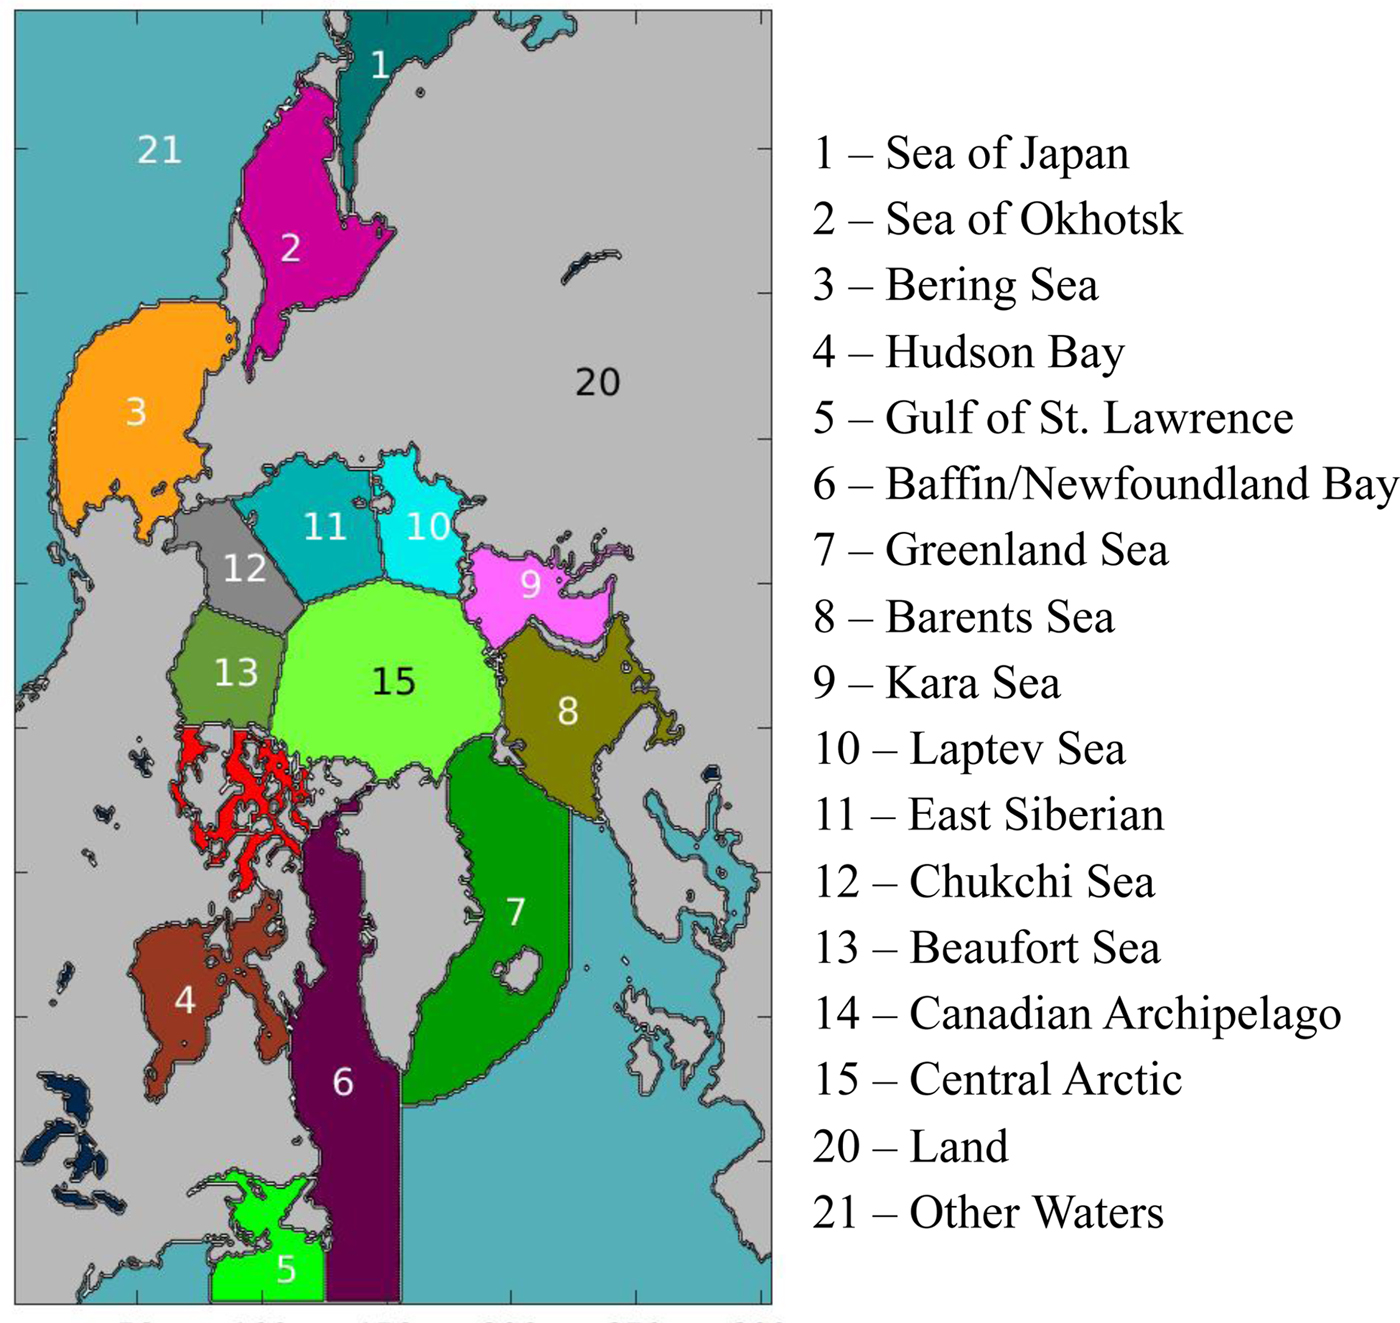
The regional definitions from Meier and others (Reference Meier, Stroeve and Fetterer2007) are adapted here, except the seas of Japan and Okhotsk are now separated (see Fig. 2). Monthly sea-ice coverage (area and extent) are computed for the whole Arctic and each of the 15 regional divisions, but only the results of SIE are discussed below.
Location map of the regions in Arctic.
TEMPORAL AND SPATIAL VARIABILITY OF SEA-ICE COVERAGE
Seasonal and annual cycle variability of SIEs
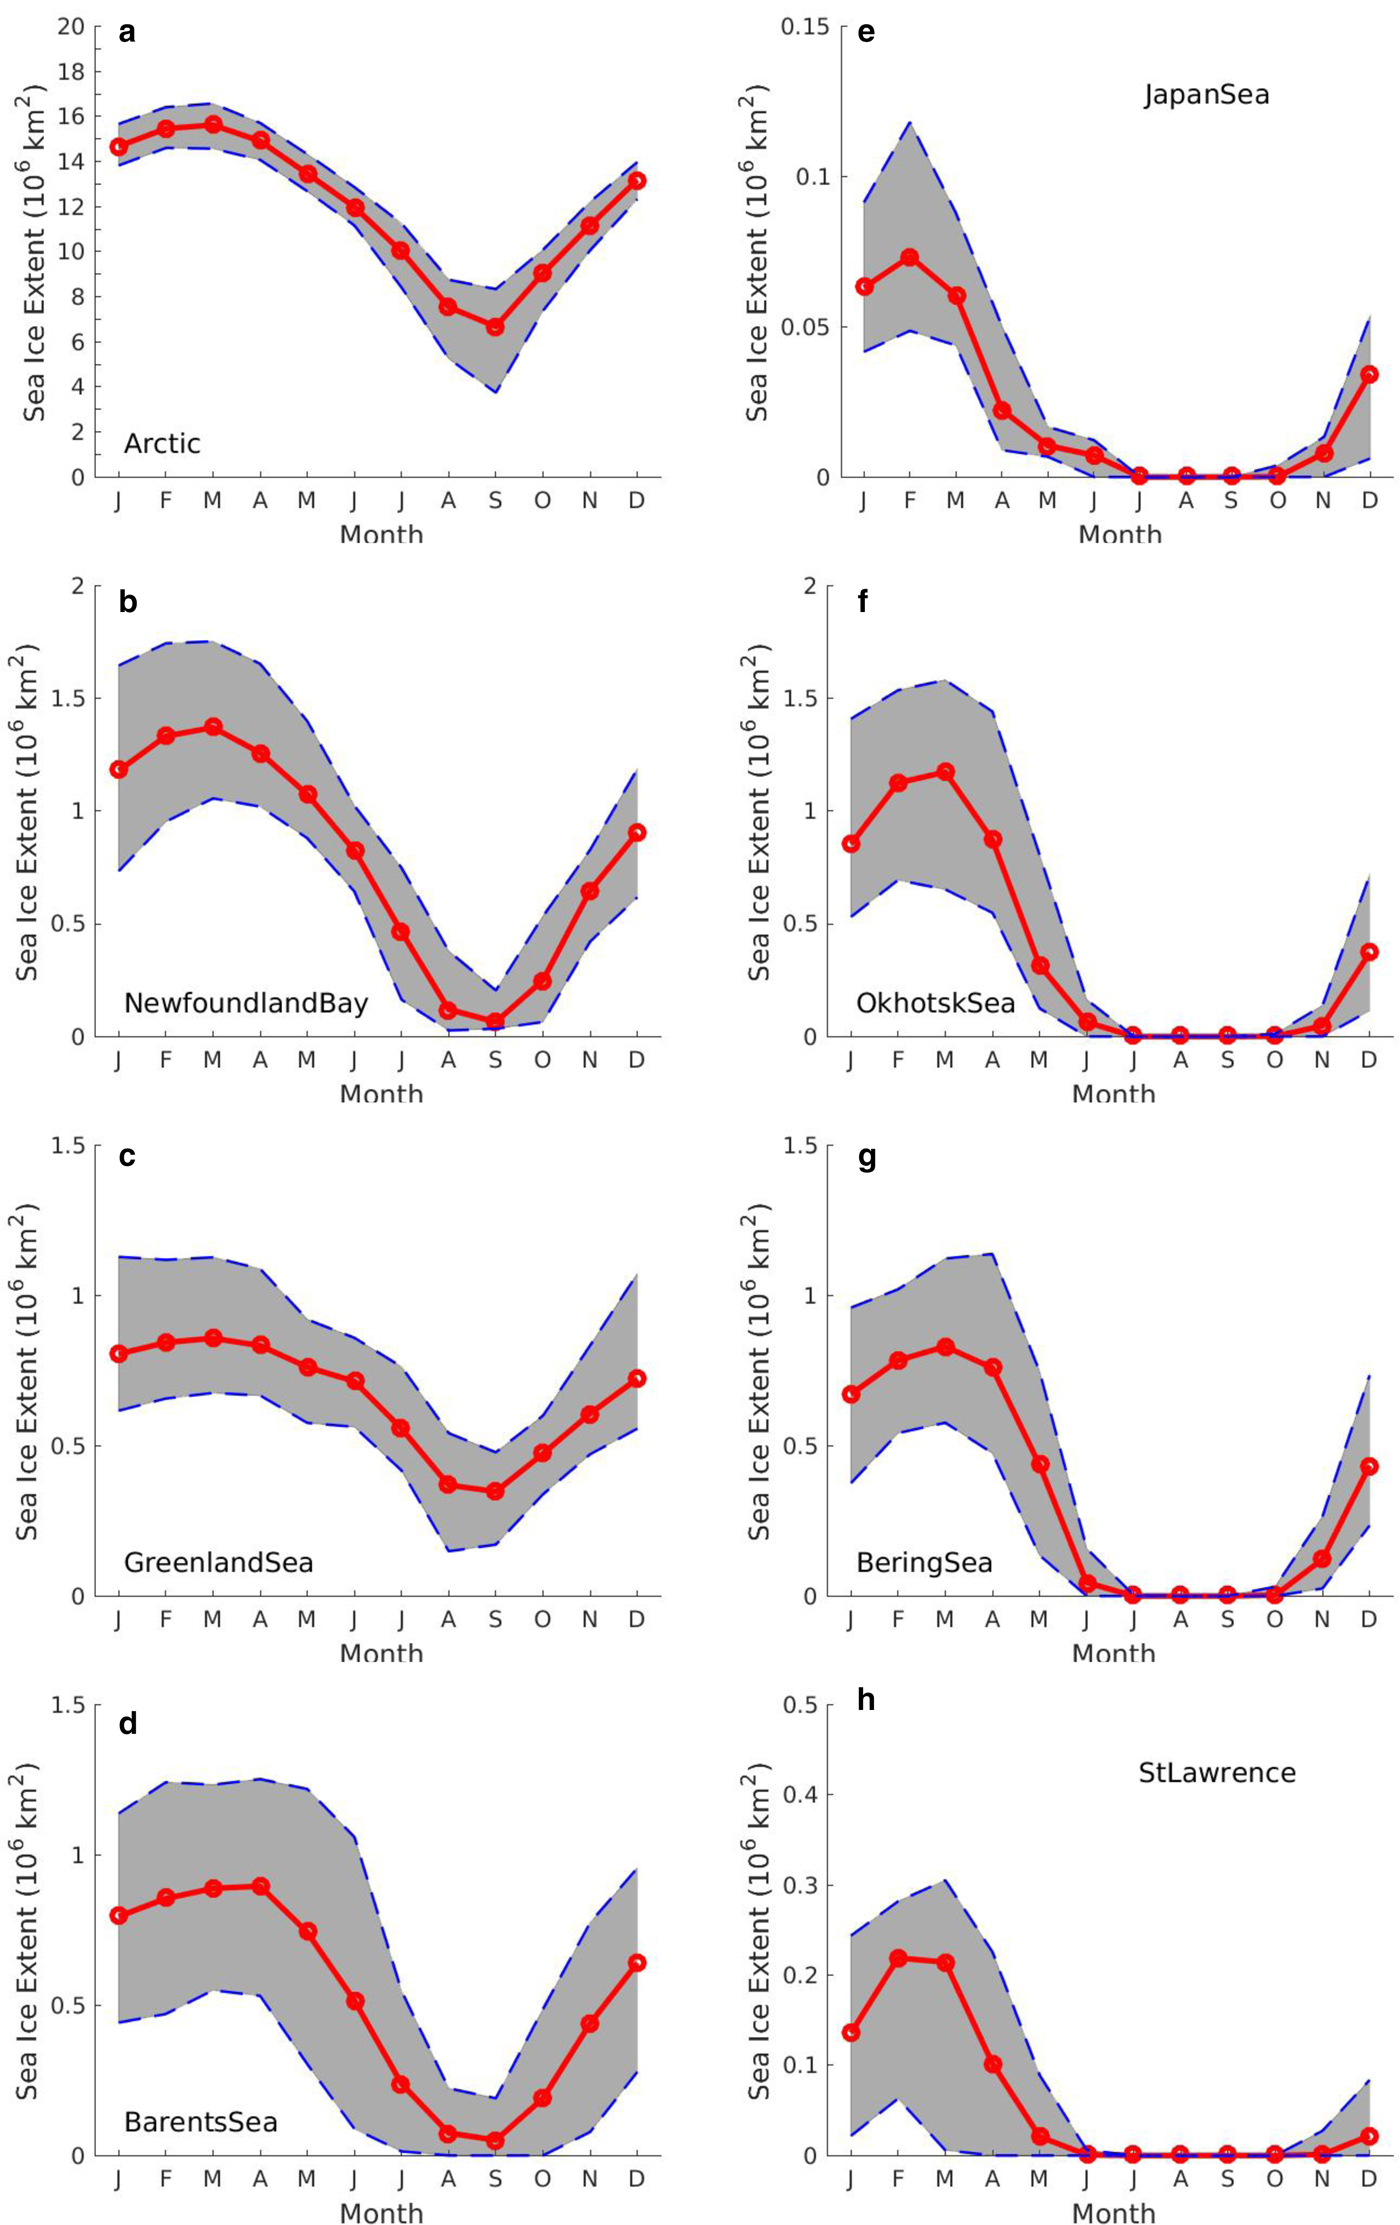
After Yashayaev and Zveryaev (Reference Yashayaev and Zveryaev2001), the seasonal cycle has been considered to be the evolution of SIE through the year and the annual cycle the annual harmonic. As expected, the Arctic region as a whole shows a distinct seasonal cycle, with the annual maximum of SIE in March and minimum in September (Fig. 3a). The interannual range and variability for the annual minimum are much larger than that for the annual maximum (see the spread in Fig. 3a and compare the SD values of annual SIE minimum and annual maximum in Table 1). However, the pattern varies in the individual regions. For example, more than one-third of the regions display larger SD values for the annual SIE maximum (Fig. 3; see also Table 1), while half of them show very little to no annual maximum spread but a larger annual minimum spread (Fig. 3; see also Table 1). These very small annual maximum/minimum spreads are due to nearly complete ice freezing/melting in winter/summer, respectively (see the categories of seasonal cycle characteristics below). The Barents Sea SIE climatological average reaches its annual maximum in April, with annual SIE maximum time ranging from February to May (Fig. 3d). An annual SIE maximum at the Bering Sea occurred in April at least once (Fig. 3g), while the Sea of Japan tends to reach its SIC annual maximum in February (Fig. 3e).
Type I (left panels) and type II (right panels) seasonal cycles of climatological average of monthly SIE (106 km2, thick red line with filled circles) and the maximum and minimum values for each month (dashed blue lines) for the regions of (a) Arctic, (b) Newfoundland Bay, (c) Greenland Sea, (d) Barents Sea, (e) Japan Sea, (f) Okhotsk Sea, (g) Bering Sea and (h) Gulf of St. Lawrence. SIE is computed assuming that all the cells within the pole hole are covered by at least 15% of ice. Shading area represents the spread of monthly SIE values for the period of 1979–2015.
Basic statistical attributes of sea-ice extent (SIE, 106 km2), decadal trends (106 km2 decade−1) and their margin of error* (106 km2 decade−1) at the 95% confidence level
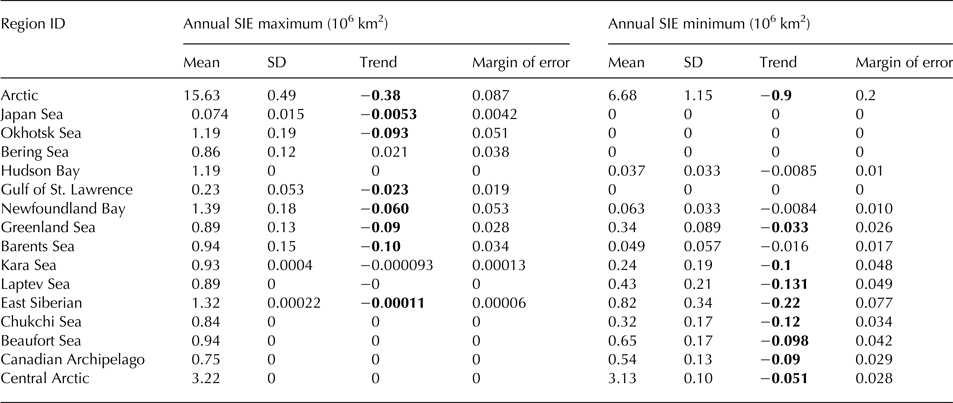
The trends in bold are significant at the 95% confidence level using Student's t test.
* The margin of error for the linear trend at the 95% confidence level is computed as: 2.028 StdErr, where StdErr denotes the standard error of the linear regression slope.
Generally speaking, the characteristics of seasonal evolution of monthly means and their spreads can be categorized as the following three types.
a) Type I – Distinct annual cycle with sinusoidal temporal evolution (Figs 3a–d: Arctic, Baffin/Newfoundland Bay, Greenland Sea and Barents Sea); these geographic regions are not bound by land on all sides, yet retain some ice year-round, allowing a fully sinusoidal seasonal cycle to exist. The Arctic as a whole has a large spread for the summer SIE minimum, while the other three regions display relatively large spreads for the winter SIE maximum. The summer-opening vulnerability can be seen at the Newfoundland Bay and Barents Sea, with at or near zero SIE values. However, all type I regions could potentially lose more ice during summer and eventually could become open in the summer.
b) Type II – Complete summer opening (Figs 3e–h: Japan Sea, Okhotsk Sea, Bering Sea and Gulf of St. Lawrence). This type exhibits a distinct late fall and winter rebuild and a spring and early summer melt with a complete and persistent summer opening. The mean, minimum and maximum of monthly SIE values are all at the zero SIE, and this pattern persists for more than 2 months in summer. Note that zero SIE value represents a state such that there is no cell that has a SIC value of more than 15% in the region. These regions are vulnerable to further warming because there is no multi-year ice to keep the region cool and to reflect solar radiation, allowing more solar insolation that would lead to earlier melt and later freeze-up, expanding the open season (e.g. Polyakov and others, Reference Polyakov, Walsh and Kwok2012).
c) Type III – Complete or near-complete winter freeze-up (Fig. 4: the rest of the eight regions, i.e. Hudson Bay, Laptev Sea, East Siberian, Chukchi Sea, Beaufort Sea, Canadian Archipelago, Kara Sea and Central Arctic). This type shows the rapid late fall and early winter freeze-up for the whole region with early summer melting. The mean and minimum of monthly SIE values are very close to that of the monthly SIE maximum and this pattern persists for more than 2 months in winter. The annual SIC minimums for Hudson Bay, Laptev Sea, East Siberian, Chukchi Sea and Kara Sea have reached zero at least once (Figs 4a–d and g). They are the most vulnerable regions in this group to further warming to become routinely opening during summer, although the potential risk exists for all Arctic regions.
Same as Fig. 3 except for type III and for the regions of (a) Hudson Bay, (b) Laptev Sea, (c) East Siberian, (d) Chukchi Sea, (e) Beaufort Sea, (f) Canadian Archipelago, (g) Kara Sea and (h) Central Arctic.

The Kara Sea and Central Arctic regions are noticeable for not always being completely frozen for the whole region every winter (Figs 4g and h); the inflow of warmer Atlantic water can in some years keeps small areas of these regions ice-free through the winter (e.g. Polyakov and others, Reference Polyakov2017). We will refer to them as type IIIa.
Temporal distributions of SIEs
Figure 5a shows the temporal distribution of monthly SIE over the whole Arctic. Although, as expected, there is a dominant annual SIE cycle, the interannual variability is noticeable with overall decreasing values in both annual SIE maximums and minimums. One region from each of three aforementioned seasonal cycle types has been selected to demonstrate the different seasonal variability characteristics at the regional scale (Figs 5b–d). In some regions, such as the Greenland Sea (Fig. 5b), year-round variability is seen with distinct and pronounced annual minimums. Other regions, such as the Bering Sea (Fig. 5c), have ice-free conditions every summer and SIE variability is primarily limited to winter; in addition, contrary to most other regions, the Bering Sea shows relatively higher winter (e.g. March) SIE in recent years (2007–15). This positive trend of the annual maximum SIE in the Bering Sea has been noted by Cavalieri and Parkinson (Reference Cavalieri and Parkinson2012) with 1979–2010 sea-ice data. It is also worth noting the lower than the normal sea-ice coverage in the last two winters (2016/17). Although it may not reverse the long-term trend, it warrants close, continual monitoring for the region.
Temporal distributions of monthly SIE (106 km2) for the period of 1979–2015 for the region of (a) whole Arctic, (b) Greenland Sea, (c) Bering Sea and (d) Chukchi Sea, respectively. The value 0+ in the color scale denotes the state when there is no data cell in the region with SIC value >15%. Note that the color scale varies in the different plots.
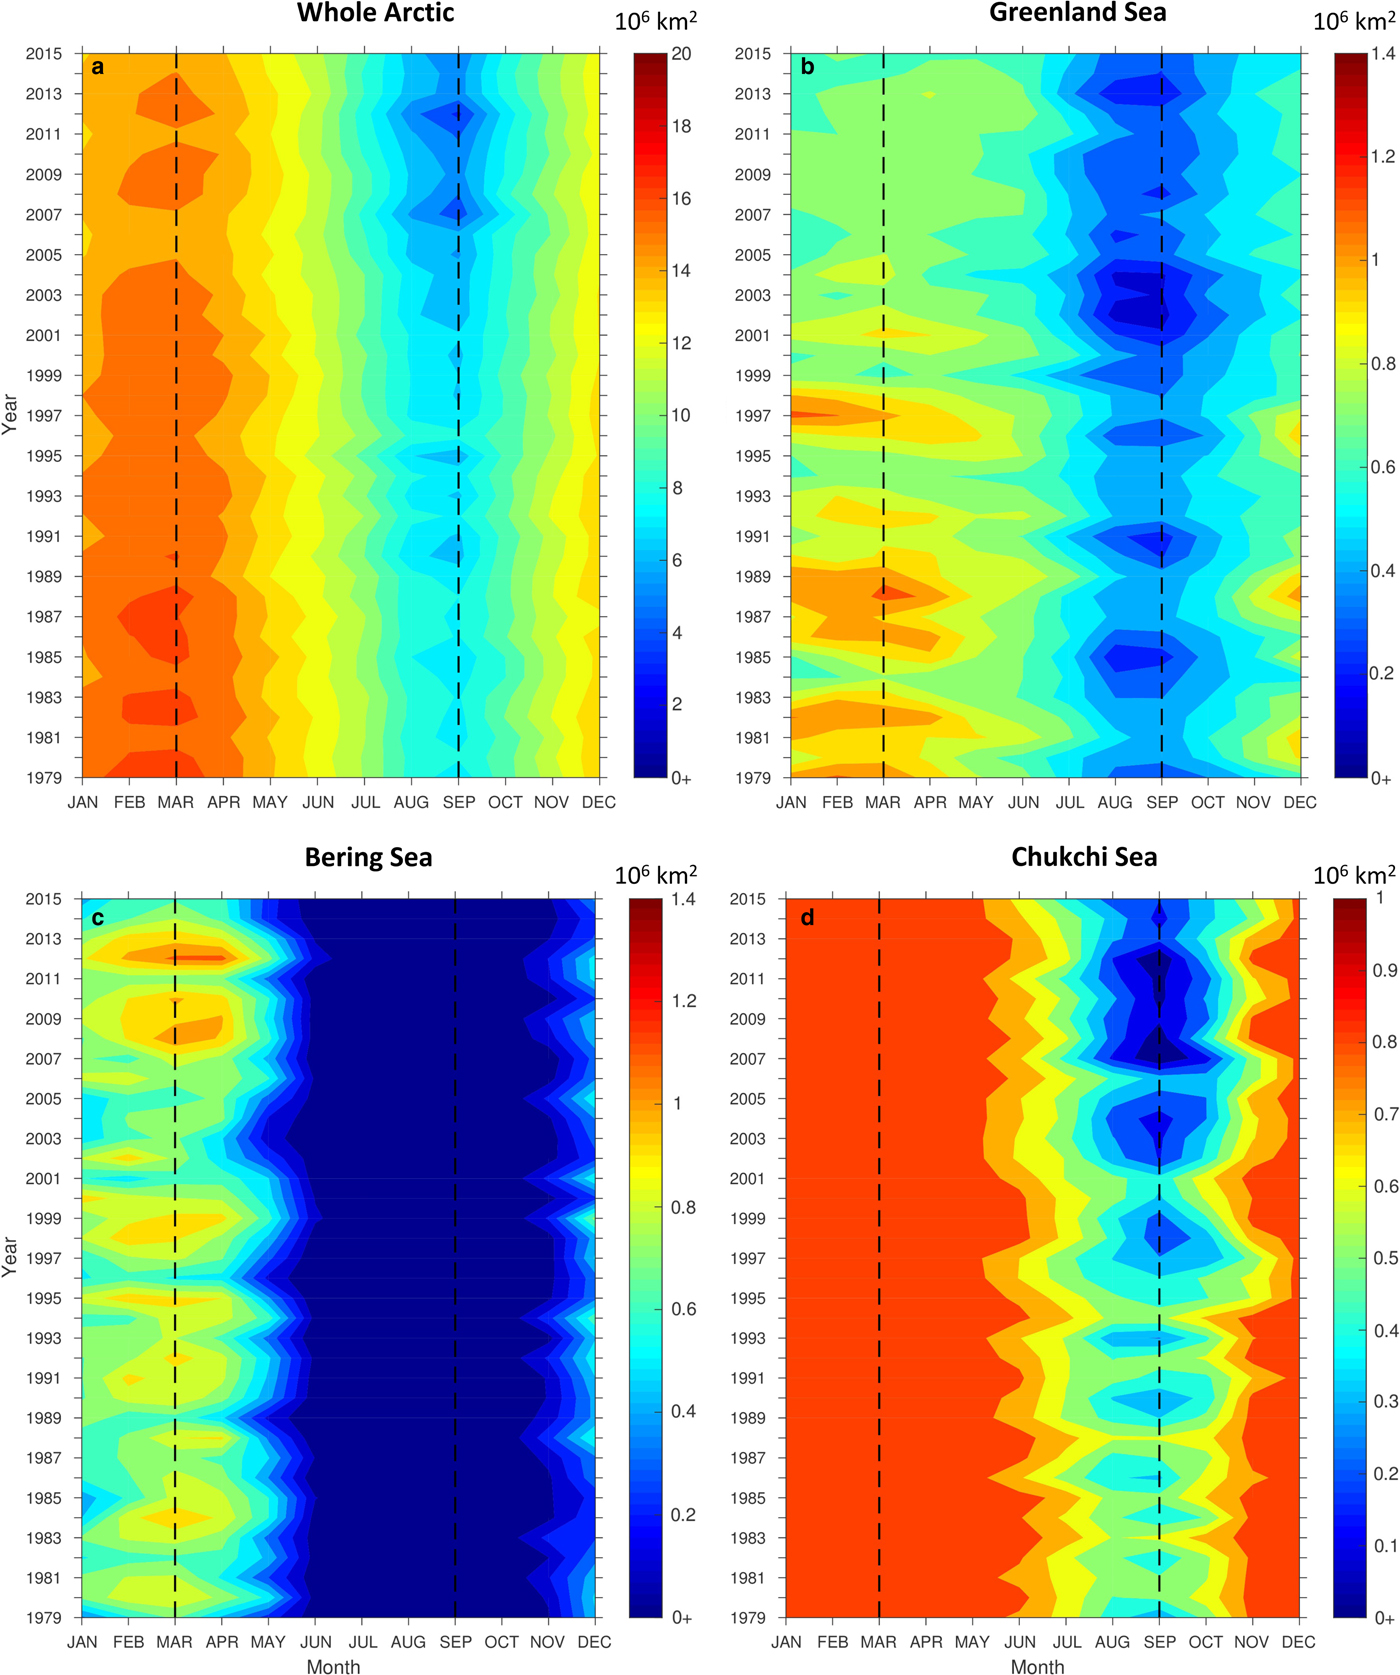
Finally, other regions, such as the Chukchi Sea, are fully covered by ice in winter and thus have no variability during this period, but rather have increasingly enhanced summer opening (Fig. 5d). These different temporal variability characteristics on the regional scales clearly demonstrate the need for regional monitoring in addition to that of the whole Arctic. Interannual variability in sea-ice summer-opening beginning and ending dates can also be observed on the regional scale, though visually, clear trends are not discernible (Figs 5a–d). A study is underway to examine and baseline the long-term average and variability of sea-ice retreat and advance dates in these regions.
Decadal trends of SIEs
Time series of the annual SIE maximum, minimum and the spread along with decadal trends for the Arctic and selected regions are shown in Fig. 6. For the Arctic region as a whole, a trend of −2.41 ± 0.56% decade−1 has been observed for the annual SIE maximum, −13.5 ± 2.93% decade−1 for the annual SIE minimum and 5.84 ± 2.4% decade−1 for the difference between the two (annual SIE maximum−minimum) (Fig. 6a). The reduction in the annual SIE maximum in recent years has helped establish the statistical significance of the downward trend in the annual Arctic SIE maximum.
Time series of sea-ice extent (106 km2, red circles with solid black line), its linear regression trend lines (thick green dashed lines) for the annual maximum (left panels), minimum (middle panels) and the difference between the two (right panels) for (a) whole Arctic, (b) Greenland Sea, (c) Bering Sea and (d) Chukchi Sea. The dash-dotted lines are one SD of each time series. The decadal trends in percentage relevant to the regional mean in red/green are significant at the 99%/95% confidence level using Student's t-test.
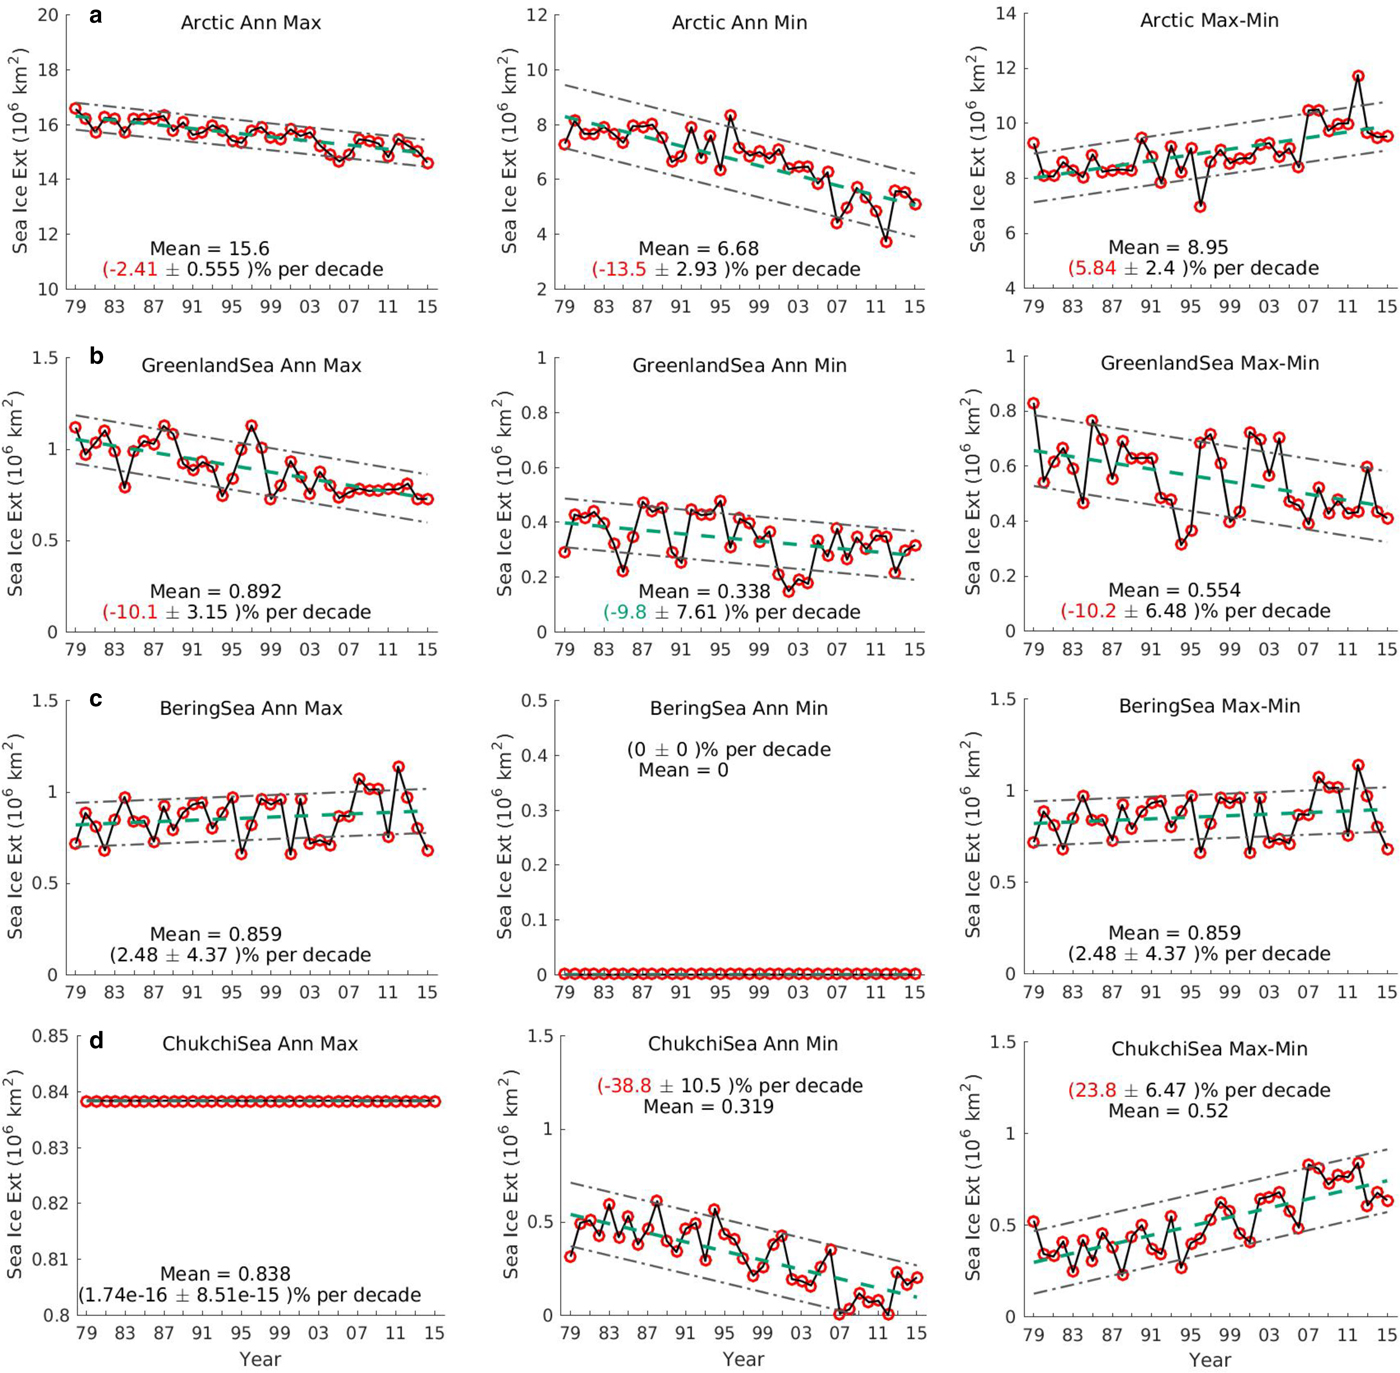
The annual SIE maximum represents the sea-ice reservoir, which ‘replenishes’ through the autumn and winter and ‘depletes’ through the spring and summer. A non-zero annual SIE minimum value implies the existence of multi-year ice. The difference between the annual SIE maximum and minimum is the annual spread of SIE and generally is indicative of the annual ice melt amount, though some ice is lost annually through advection out of the Arctic via Fram Strait and the channels of the Canadian Archipelago. Although there are downward trends for both the maximum and minimum SIE in the Arctic, the long-term decrease of the annual SIE minimum has outpaced that of annual SIE maximum. This suggests a reduction in multi-year ice coverage, as pointed by Polyakov and others (Reference Polyakov2017), assuming the annual sea-ice lose due to advection remains at the same level. All three decadal trends are significant at the 99% confidence level.
The majority of annual maximum and minimum values in the Arctic are within one SD from its linear regression, which is represented by the thick-green dashed line in Fig. 6a. However, there are exceptions, such as the record high annual Arctic SIE minimum in 1996 and the record low annual Arctic SIE minimums in 2007 and 2012.
The Greenland Sea has shown similar rates of long-term changes for both annual SIE maximum and minimum as well as the spread, all significant at the 95% confidence level (Fig. 6b). The Bering Sea shows a long-term increase rate for the annual SIE maximum, but the trend is not significant at the 95% confidence level (Fig. 6c). On the other hand, the Chukchi Sea shows a strong downward trend of −38.8% for the annual SIE minimum, which is significant at the 99% confidence level (Fig. 6d). With the persistent winter freeze, this strong downward trend results in a significant 23.8% decade−1 upward trend in the seasonal ice loss.
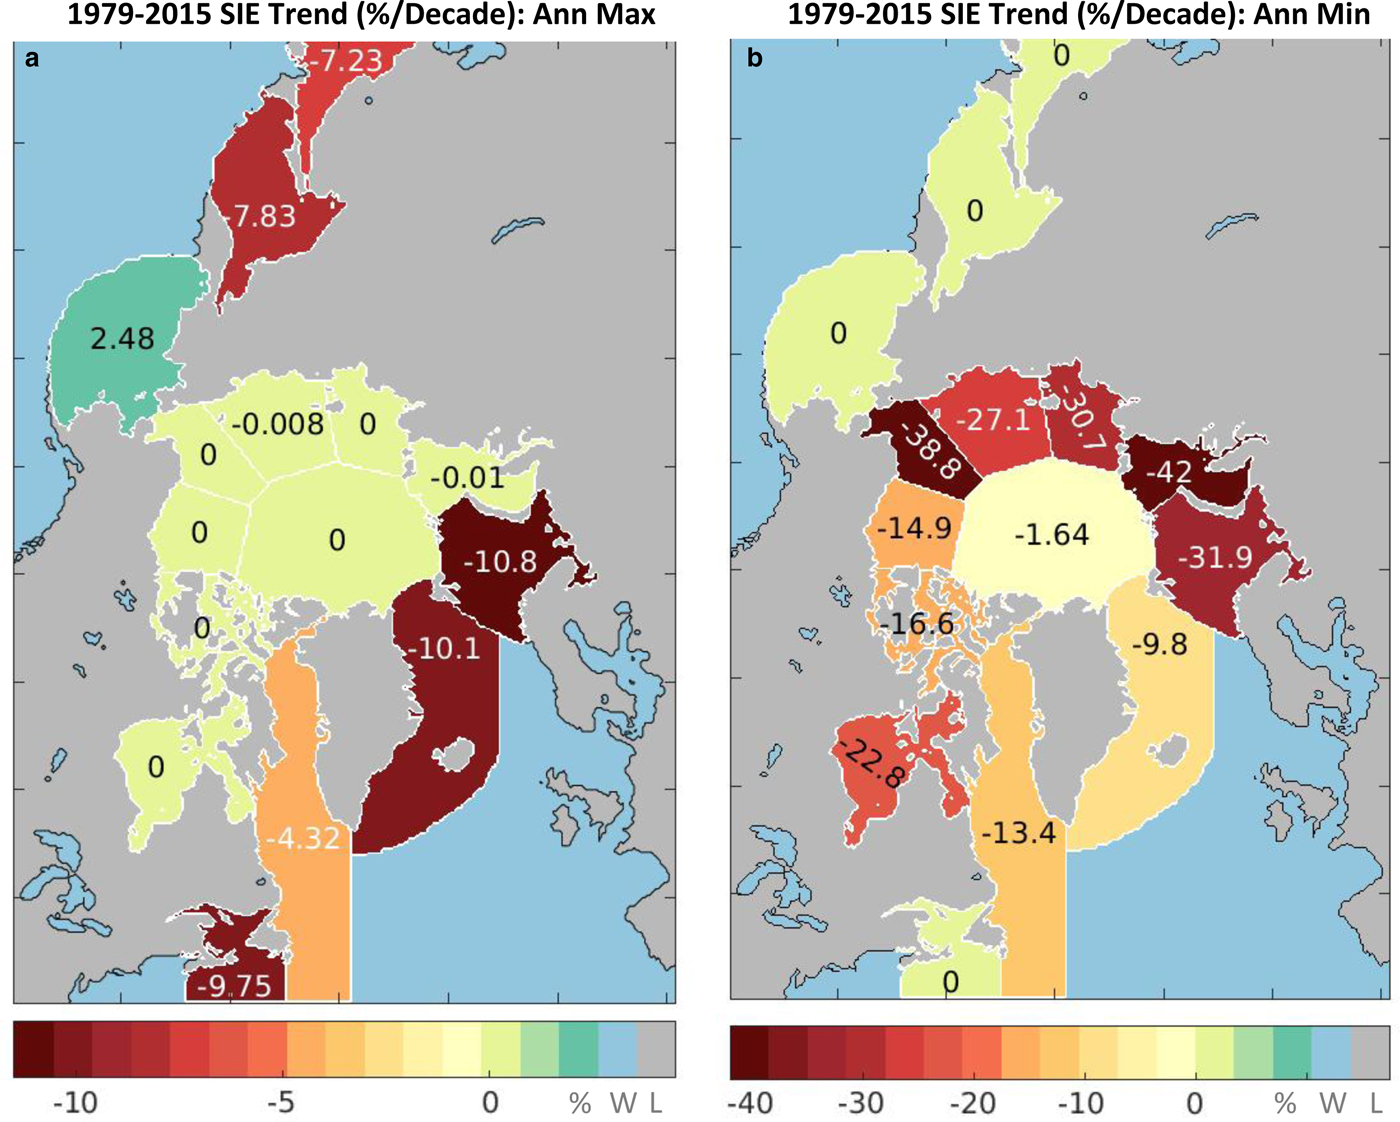
Maps of intensity color-coded decadal trends in percentage of all 15 regions are shown in Fig. 7. (The trends in 106 km2 decade−1 and their margins of error at the 95% confidence level are captured in Table 1 – the trends that are significant at the 95% confidence level are in bold.) The winter maximum ice coverage reduction in percentage is most profound in the Barents and Greenland Seas, followed by the Gulf of St. Lawrence and the Seas of Okhotsk and Japan (Fig. 7a). The map clearly shows the enhanced long-term reduction in summer minimum ice coverage in the coastal regions (Fig. 7b). Decadal trends of more than −20% are found in Hudson Bay; the Seas of Barents, Kara, Laptev and Chukchi; and in the East Siberian region. Therefore, the Barents Sea has experienced significant ice reduction percentage wise in both annual SIE maximum and minimum.
Regional trends (% decade−1) for (a) annual SIE maximum and (b) annual SIE minimum for the period of 1979–2015. Landmasses are shaded gray. Other water masses are shaded in light blue.
SUMMARY
A consistent, intercalibrated, well-documented, long-term time series of the sea-ice data from remote-sensing measurements have been used to examine temporal and regional variability of Arctic sea-ice coverage.
Three types of SIE annual cycle are identified, with type II being the most vulnerable to further summer warming as summer ice-free conditions allow for more solar insolation. Continued summer sea-ice loss could potentially result in the transition of type I regions to type II.
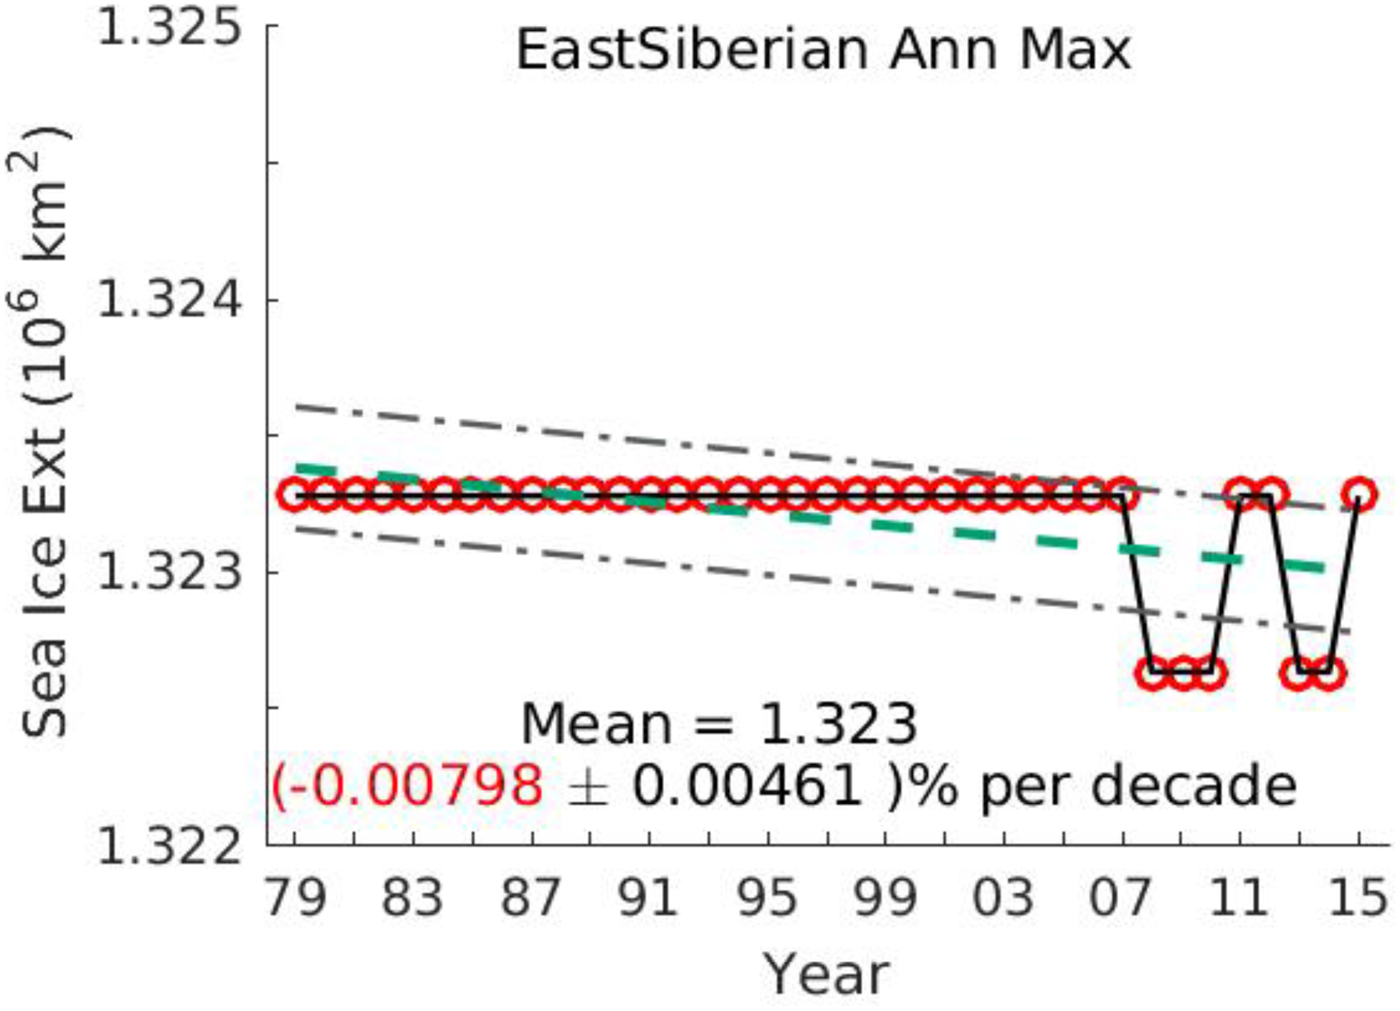
For the annual SIE maximum, six regions tend to completely freeze-up in the winter, but all remaining regions except one experienced negative trends ranging from ~0 to −10.8% decade−1. The negative trends for Japan Sea, Okhotsk Sea, Gulf of St. Lawrence, Newfoundland Bay, Greenland Sea, Barents Sea and East Siberian are significant at the 95% confidence level (Table 1). Sea ice covered the whole region of the East Siberian Sea in the first 27 years in winter since 1979. However, 5 out of the last 8 years have shown a slight erosion, which helps to establish the very small but yet statistically significant downward trend (Fig. 8). Giving the small amplitude of sea-ice loss at this stage, this trend may not be physically significant. However, if it continues, the East Siberian Sea will eventually migrate to type IIIa.
Time series of the East Siberian SIE annual maximum (106 km2, red circle with solid black line,) and its linear regression trend lines (thick green dashed line). The dash-dotted lines are one SD from the linear regression of the time series.
At the same time, for the annual SIE minimum on the regional scale, apart from four regions that have persistent summer openings, there is a negative decadal trend of up to −42% decade−1. The −42% decade−1 trend occurred in the Kara Sea. Eight of these trends are significant at the 95% confidence level (Greenland, Kara, Laptev, Chukchi, Beaufort, East Siberian, Canadian Archipelago and Central Arctic) (Table 1).
For the Arctic as a whole, the trend for the period of 1979–2015 is −2.41 ± 0.56% decade−1 for the annual SIE maximum, −13.5 ± 2.93% decade−1 decade for the annual SIE minimum, and 5.84 ± 2.4% decade−1 for the annual sea-ice melt, all significant at the 99% confidence level.
This paper presents the first SIE analysis utilizing the sea-ice concentration CDR produced by NSIDC and archived by NOAA's NCEI (National Centers for Environmental Information) (the dataset doi: 10.7265/N55M63M1) that meets CDR requirements on reproducibility, transparency, file format, documentation and metadata. The results shown in this paper are consistent with that in the literature.
This analysis has been carried out to establish the most up-to-date regional long-term average and variability characteristics of sea-ice coverage from the CDR. These SIE characteristics will be used to monitor the ice state to support climate adaptation and risk mitigation at regional scales at NCEI. It is also our hope that this paper will help standardize the way the community displays the seasonal and interannual SIE variability (Figs 3 and 5) and decadal SIE trends (Fig. 6).
ACKNOWLEDGEMENT
This work is supported by NOAA's NCEI under Cooperative Agreement NA14NES432003. Ethan Shepherd contributed to data processing. Russell Vose contributed to the design of Fig. 7. Comments and edits from Michael Palecki, Jake Crouch and Russell Vose improved the clarity and presentation of the paper. Tom Maycock and Jason Yu proof-edited the manuscript. We thank two anomalous reviewers from Annals of Glaciology for their constructed edits and suggestions, which have improved the quality and clarity of the paper. The Ferret data visualization and analysis program was used for this paper. Ferret is a product of NOAA's Pacific Marine Environmental Laboratory. (Information is available at http://ferret.pmel.noaa.gov/Ferret/). The concept of temporal distribution maps (Fig. 5) is adapted from a presentation given by Richard Hoehler.


 Open access

