


1. Introduction
The focus of this paper is on non-native phoneme discrimination in multilingual learners, i.e., those who, in addition to their second language (L2), have acquired at least one additional foreign language (L3/Ln). The field of L3/Ln phonology has been extensively explored in recent years, with the last decade witnessing manifold studies on the phonological system developed by multilinguals. Notably, the majority of this research has focused on speech production rather than perception, although this trend seems to be partially reversing in recent years (see Wrembel, Reference Wrembel, Cabrelli, Chaouch-Orozco, Alonso, Soares, Puig-Mayenco and Rothman2023, for a review). Still, a modest number of researchers have directly explored the processing of non-native phonemes in L2 when compared with L3/Ln, and the experimental techniques used to investigate the non-native phoneme perception in multilinguals have typically involved forced-choice goodness tasks (e.g., Cabrelli Amaro, Reference Cabrelli Amaro2017), perceptual assimilation tasks (e.g., Kopečková, Reference Kopečková, Gut, Fuchs and Wunder2015), foreign-accentedness ratings (e.g., Lloyd-Smith, Reference Lloyd-Smith2023; Wrembel et al., Reference Wrembel, Marecka, Szewczyk and Otwinowska2019), or discrimination tasks (e.g., Wrembel et al., Reference Wrembel, Marecka and Kopečková2019). What has been scarcely studied so far is the neural markers of phonemic contrast perception by multilingual listeners, with most of the work prioritizing bilingual research (e.g., Jakoby et al., Reference Jakoby, Goldstein and Faust2011; Liang & Chen, Reference Liang and Chen2022; Song & Iverson, Reference Song and Iverson2018). In order to bridge this gap, we report the results of a phonemic perception event-related potential (ERP) study, which focused on trilingual L1 Polish – L2 English – L3 Norwegian speakers who acquired their L3/Ln in a formal (i.e., classroom-instruction) setting. The selection of trilingual instead of bilingual listeners enabled us to elucidate the issue of language status (operationalized as L2 or L3/Ln) as a factor affecting non-native phoneme processing.
Categorical perception (Liberman et al., Reference Liberman, Harris, Hoffman and Griffith1957) is an empirical phenomenon, when the ability to distinguish two sounds is affected by the categories they belong to. In a native language, we can discriminate sounds that belong to two different phonemes, but not when they belong to a single category. Categorical perception helps us process the incoming speech signal fast in the L1, but in a non-native language, it tends to hinder differentiation between phones that belong to two different phonemes in L2, but are assimilated to a single L1 phoneme. Major theories of L2 acquisition of speech, such as the Speech Learning Model (Flege, Reference Flege and Strange1995), revised Speech Learning Model (Flege & Bohn, Reference Flege, Bohn and Wayland2021), Perceptual Assimilation Model – L2 (Best & Tyler, Reference Best, Tyler, Munro and Bohn2007) and Second Language Perception Model (Escudero, Reference Escudero2005, Reference Escudero, Boersma and Hamann2009; Escudero & Boersma, Reference Escudero and Boersma2004) associate category formation in a non-native language with the ability to detect differences between L1 and target language sounds. Whereas a large body of research dealt with studies of conscious non-native phone discrimination using behavioral techniques (e.g., Flege et al., Reference Flege, Munro and Fox1994; Best et al., Reference Best, McRoberts and Goodell2001; Levy & Strange, Reference Levy and Strange2008; Tyler et al., Reference Tyler, Best, Faber and Levitt2014) the present study concentrates on neural, pre-attentional discrimination of native and non-native sounds. This is particularly novel with respect to investigating online phonemic perception in multilinguals, comparing two non-native languages.
As a next step, we juxtapose the results of the current study with the data obtained earlier in the same task by a group of trilingual speakers who acquired the foreign languages (i.e., English and Norwegian) in a naturalistic (i.e., immersion) setting (Kędzierska et al., Reference Kędzierska, Rataj, Balas, Cal, Castle and Wrembel2023). In this way, we examine whether the learning context (i.e., the acquisition setting) may potentially affect the neural discrimination of phonemic contrasts. Even more crucially, the current research also contributes to the ongoing debate concerning the effectiveness of foreign language learning, with non-native phoneme perception and consequently, their production as its central components.
One of the most pertinent questions both within the field of L2 and L3/Ln acquisition concerns the effectiveness of the learning process shaped by the learning context (or setting), with the nature of this context typically instantiated as either naturalistic (i.e., immersive) or formal (i.e., instructed). The former one typically progresses in natural communicative contexts, holistically, without interruptions and in a country or region where the target language is used on an everyday basis. The latter one is assumed to be “notably less than ideal with respect to the natural ecology of language learning” (Best & Tyler, Reference Best, Tyler, Munro and Bohn2007, Reference Best, Tyler, Munro and Bohnp. 19), as it takes place in a restricted classroom setting, does not extend much outside classroom time, it happens in smaller portions, often with the learner’s L1 used for instruction, and usually centered around grammatical and lexical information. Moreover, the exposure quality in the formal classroom setting is specific, because it primarily involves interactions with L1-accented teacher and fellow classmates, entailing many mistargeted phonetic details. Obviously, there are also numerous other acquisition contexts situated somewhere in between these two archetypal learning scenarios (see Muñoz, Reference Muñoz2008, for a discussion). One could mention here, for instance, a mixed context where formal education proceeds by means of immersion or self-learning attempts facilitated by such resources as podcasts, videos, or language learning apps. However, since most studies to date have focused on non-native language acquisition in either immersive or formal settings, an apparent need arises for more systematic comparisons of patterns observed among two learner types with shared language repertoires (e.g., Muñoz, Reference Muñoz2008; Puig-Mayenco et al., Reference Puig-Mayenco, González Alonso and Rothman2020; Wrembel, Reference Wrembel, Cabrelli, Chaouch-Orozco, Alonso, Soares, Puig-Mayenco and Rothman2023). Hence, in the current paper, we will focus on two markedly different learning scenarios, i.e., one involving formal classroom instructions of L2 English and L3/Ln Norwegian (the study reported in this paper) as compared to the one involving naturalistic acquisition of L3/Ln Norwegian and naturalistic/mixedFootnote 1 acquisition of L2 English by Polish migrants in Norway (Kędzierska et al., Reference Kędzierska, Rataj, Balas, Cal, Castle and Wrembel2023).
2. Study motivation and background
The method employed in the current research is event-related brain potentials (ERP), which, thanks to its high temporal resolution, is perfectly suited to track such rapidly occurring cognitive processes as phoneme recognition (Kaan, Reference Kaan2007). These processes are reflected in the ERP components, i.e., parts of the ERP waveforms elicited as a reaction to the manipulation (Woodman, Reference Woodman2010, p. 4). The component that is typically associated with the listeners’ sensitivity to discriminable phonemic changes presented within a series of sounds is the mismatch negativity (MMN) (Kujala & Näätänen, Reference Kujala, Näätänen and Polich2003; Näätänen et al., Reference Näätänen, Lehtokoski, Lennes, Cheour, Huotilainen, Iivonen, Vainio, Alku, Ilmoniemi, Luuk, Allik, Sinkkonen and Alho1997, Reference Näätänen, Paavilainen, Rinne and Alho2007). This component is typically elicited in oddball tasks, in which a series of standard stimuli (e.g., identical sounds) is occasionally interrupted by the occurrence of a deviant stimulus (e.g., a different sound). The occurrence of the deviant violates the prediction that the listener has made on the basis of standard sounds. As a consequence, the MMN effect – defined as the difference in voltage between the deviant and standard sound – is elicited over fronto-central sites at around 150–250 milliseconds (ms) from the onset of the deviant stimulus (Näätänen et al., Reference Näätänen, Paavilainen, Rinne and Alho2007). Quite importantly, this brain response is believed to be elicited pre-attentively, and hence does not require the participants’ attention, which is typically focused on an unrelated primary task, such as watching a video or reading a book. The MMN is often followed by late discriminative negativity (LDN), i.e., a negativity (also observed over fronto-central sites) at around 350–600 ms after the onset of the deviant. While the functional role of the LDN has not yet been fully established (see Jakoby et al., Reference Jakoby, Goldstein and Faust2011, for a discussion), the component is typically associated with pre-attentive cognitive evaluation of the stimulus (Ceponiene et al., Reference Ceponiene, Cheour and Näätänen1998; Liang & Chen, Reference Liang and Chen2022) or a successful formation of memory traces associated with a specific phonemic representation (Barry et al., Reference Barry, Hardiman and Bishop2009; Jakoby et al., Reference Jakoby, Goldstein and Faust2011). In general, in the context of non-native phoneme processing, previous studies observed reduced MMN in non-native languages when compared with L1 (Jakoby et al., Reference Jakoby, Goldstein and Faust2011; Liang & Chen, Reference Liang and Chen2022; Song & Iverson, Reference Song and Iverson2018) as well as in L3/Ln when compared with L2 (Kędzierska et al., Reference Kędzierska, Rataj, Balas, Cal, Castle and Wrembel2023). At the same time, the LDN effect, which followed the MMN in some ERP studies on bilingual phoneme processing, was typically higher in more successful/higher proficiency L2 learners as opposed to less successful/lower proficiency ones (Jakoby et al., Reference Jakoby, Goldstein and Faust2011 and Liang & Chen, Reference Liang and Chen2022, respectively). In Kędzierska et al. (Reference Kędzierska, Rataj, Balas, Cal, Castle and Wrembel2023), no significant difference was found between L2 and L3/Ln in terms of the LDN amplitude, but for both foreign languages, the effect was smaller when compared with L1.
Notably, research on bilingual listeners’ phonological sensitivity has also produced several conflicting findings, suggesting the significance of listener-oriented factors in the processing of non-native phonemic contrasts. One of these factors seems to involve the learning setting differences discussed above. In the study conducted by Winkler et al. (Reference Winkler, Kujala, Tiitinen, Sivonen, Alku, Lehtokoski, Czigler, Csépe, Ilmoniemi and Näätänen1999), native speakers of Finnish and late learners of Finnish in an immersive context both showed a similar MMN effect to Finnish vowel contrasts. On the other hand, Peltola et al. (Reference Peltola, Kujala, Toumainen, Ek, Aaltonen and Näätänen2003) discovered a significant difference between native English speakers and instructed learners: for the latter ones, English vowel contrasts elicited lower MMN amplitudes (a finding also supported by Wottawa et al., Reference Wottawa, Adda-Decker and Isel2022). In a recent study, Kędzierska et al. (Reference Kędzierska, Rataj, Balas, Cal, Castle and Wrembel2023) examined how sensitive the MMN effect is to phoneme contrasts in L1 Polish, L2 English (naturalistic/mixed), and L3/Ln Norwegian (naturalistic) learners. Language status (defined in terms of dominance rather than chronology) had an impact on the MMN effect, which was reflected in significant differences between L1 and L3/Ln as well as between L2 and L3/Ln. More specifically, the amplitude of the MMN effect was smaller for L3/Ln when compared with both L1 and L2.
In the current study, we aimed to contribute to an ongoing scientific debate on multilingual phoneme processing by investigating the perception of L1 Polish, L2 English, and L3/Ln Norwegian vowels among formal L2 English and L3/Ln Norwegian learners. In order to determine whether the listeners’ phonological systems are sensitive to the non-native vowel contrasts, we decided to use the MMN as a neurophysiological marker reflecting ease of phonemic discrimination (Näätänen et al., Reference Näätänen, Lehtokoski, Lennes, Cheour, Huotilainen, Iivonen, Vainio, Alku, Ilmoniemi, Luuk, Allik, Sinkkonen and Alho1997). Therefore, an ERP experiment was designed with a passive oddball paradigm, where the vowels in each language were presented independently in three blocks.
To control the conditions well, it would be desirable to have the same standard in all three languages and deviants that are equidistant and are not different in terms of phonetic features, so that we could examine the effect of language status on their processing. Such ideal conditions, however, cannot be found in natural languages, so we need to study various scenarios, as each of them contributes to a bigger picture encompassing numerous variables that influence acquisition of speech in non-native languages. In the present paper, we used a common standard in all three languages and different, non-overlapping deviants. The deviants differed in terms of phonetic features and also the Euclidean distances between the standard and the deviant varied across languages, which was taken into consideration in the analysis and interpretation of the results. In order to account for the acoustic properties of vowels, we also analyzed formant distances between vowels in a given language pair (see Table S1 in Appendix S1), as well as between language pairs (see Table S2 in Appendix S1), to mirror the analysis conducted on MMN differences and see which phonetic component is most closely related to the MMN differences.
The design we employed permitted three research questions to be addressed and several predictions to be made. First of all, we were interested in whether we would observe any significant difference in phoneme processing as indexed by the MMN and LDN in the native language (i.e., L1 Polish), when compared with non-native languages (i.e., L2 English and/or L3/Ln Norwegian). Since previous studies in bilingual phoneme processing indicate that the MMN effect is typically smaller in the non-native when compared with native languages, especially if acquired in a classroom setting (e.g., Jakoby et al., Reference Jakoby, Goldstein and Faust2011; Liang & Chen, Reference Liang and Chen2022; Song & Iverson, Reference Song and Iverson2018), we expected that the effect would be significantly larger in L1 Polish when compared with L2 English and L3/Ln Norwegian. At the same time, based on the research of Kędzierska et al. (Reference Kędzierska, Rataj, Balas, Cal, Castle and Wrembel2023), we expected the LDN effect to be significantly smaller in non-native languages when compared with L1.
Further, we wished to answer a research question concerning any significant differences in the MMN or LDN in L3/Ln Norwegian as opposed to L2 English. On the basis of previous L2 research (e.g., Jakoby et al., Reference Jakoby, Goldstein and Faust2011; Liang & Chen, Reference Liang and Chen2022; Song & Iverson, Reference Song and Iverson2018) as well as research involving multilingual listeners (Kędzierska et al., Reference Kędzierska, Rataj, Balas, Cal, Castle and Wrembel2023), we could tentatively assume that the MMN effect in L3/Ln (quite crucially, defined in terms of proficiency and dominance, rather than chronology) would be smaller relative to L1, and similar or smaller relative to L2. We also predicted that the effect might be influenced by the age of acquisition (AoA) and/or proficiency in non-native languages. However, again, based on the findings of Kędzierska et al. (Reference Kędzierska, Rataj, Balas, Cal, Castle and Wrembel2023), we did not predict any significant differences in terms of the LDN component when comparing L2 English and L3/Ln Norwegian.
Finally, we also wished to explore the potential neural differences expressed in terms of the MMN and LDN effects for the L3/Ln Norwegian contrast between formal/instructed-setting learners as opposed to naturalistic language learners. We expected the MMN effect in L3 to be enhanced in naturalistic when compared with instructed language learners due to more exposure to L3 Norwegian (Peltola et al., Reference Peltola, Kujala, Toumainen, Ek, Aaltonen and Näätänen2003; Winkler et al., Reference Winkler, Kujala, Tiitinen, Sivonen, Alku, Lehtokoski, Czigler, Csépe, Ilmoniemi and Näätänen1999). To enable such a comparison, we decided to analyze the current results in light of the ones obtained earlier by Kędzierska et al. (Reference Kędzierska, Rataj, Balas, Cal, Castle and Wrembel2023). Due to the lack of previous research that would focus specifically on the influence of language setting on the LDN, no specific predictions could be made concerning the LDN effect.
3. Methods
3.1. Participants
Twenty-two participants (mean age = 22.55, age range: 18–38, 17 females, five males) were recruited to take part in the study. Twenty participants were right-handed and two were mixed-handedFootnote 2 as assessed by the Edinburgh Handedness Inventory (adapted from Oldfield, Reference Oldfield1971), with the mean laterality quotient (LQ) equal to 85.91% (range: 45.00%–100.00%, SD = 16.74%). All of the participants were college students (N = 18) or college graduates (N = 4) whose native language was Polish, and who also spoke English (L2) and Norwegian (L3/Ln). For all the participants, Polish was their only native language, and English was the first foreign language they started learning at school or preschool before puberty. For the majority of the participants, Norwegian was chronologically either the third (N = 9) or the fourth (N = 11) language; however, there were also two participants for whom it was chronologically the fifth and the sixth language. The age of acquisition, according to self-report, was 5.86 years (range: 3–10, SD = 1.83) for L2 English and 20.27 years (range: 13–36, SD = 4.73) for L3/Ln Norwegian. At the time of the experiment, 18 participants were enrolled in the BA (N = 16) or MA (N = 2) program of Scandinavian Studies (i.e., Norwegian philology) at the Adam Mickiewicz University or the College of Modern Languages in Poznań, Poland, and two had recently graduated from one of these programs (i.e., a year earlier, N = 2). Additionally, two participants graduated from other courses (i.e., geography and civil engineering) and learnt Norwegian at a private language school. None of the participants reported any neurological and psychiatric impairments nor any language-related issues (such as dyslexia or dysorthography). All participants received gift cards as compensation for their time.
The participants were asked to self-assess their knowledge of Polish, English, and Norwegian in listening, speaking, reading and writing skills on a scale from 1 (very low) to 7 (proficient). They all assessed their Polish skills as 7.00 (range: 7.00–7.00, SD = 0), their English skills as 5.85 on average (range: 5.25–7, SD = 0.60), and their Norwegian skills as 3.88 on average (range: 2–6.5, SD = 1.16). In addition, the participants’ knowledge of the two foreign languages was verified with the aid of the Cambridge General English Assessment Test and the UiT Norwegian Placement Test, both taken immediately after the EEG session in the presence of the experimenters. The average result of the English proficiency test equaled 82.00% (range: 40.00%–100.00%, SD = 16.22%) and that of the Norwegian proficiency test equaled 65.78% (range: 22.22%–91.67%, SD = 22.41%). A more detailed summary of the participants’ biographic data and proficiency results is included in Table 1.
The summary of the participants’ biographic details and language proficiency

3.2. Stimuli
In order to select the sounds that would be used as stimuli in the current study, a comparison of phonological systems of Polish, English and Norwegian was undertaken. The decision to use vowels as experimental stimuli was motivated by previous electrophysiological research on non-native phoneme sensitivity, where vowels were used fairly frequently, either in isolation (e.g., Díaz et al., Reference Díaz, Mitterer, Broersma, Escera and Sebastián-Gallés2016; Liang & Chen, Reference Liang and Chen2022; Peltola et al., Reference Peltola, Tamminen, Toivonen, Kujala and Näätänen2012; Winkler et al., Reference Winkler, Kujala, Tiitinen, Sivonen, Alku, Lehtokoski, Czigler, Csépe, Ilmoniemi and Näätänen1999), or embedded in syllables (e.g., Jakoby et al., Reference Jakoby, Goldstein and Faust2011; White et al., Reference White, Titone, Genesee and Steinhauer2017). We decided against using syllables as stimuli because the consonants would carry over additional language-related differences, and we would not be sure what drives listeners’ reactions – differences in vowels or consonants. Moreover, the three languages used in the current study differ considerably with respect to their vowel inventory density, making vowel perception and production particularly problematic for foreign language learners. While Polish has a rather small vowel inventory, with only six monophthongal vowels (Jassem, Reference Jassem2003), the vocalic systems of English and Norwegian are richer with 12 and 18 monophthongal vowels, respectively (Wells, Reference Wells1962; Upton et al., Reference Upton, Kretzchmar and Konopka2003; Bjelaković, Reference Bjelaković2016; Kristoffersen, Reference Kristoffersen2000). Furthermore, the three languages in question differ with respect to the combination of lip-rounding with backness: while all of them have front unrounded vowels and back rounded vowels, English and Norwegian have high central rounded vowels, but only Norwegian has front rounded vowels – a configuration which seems generally dispreferred (or marked) among world languages (Maddieson, Reference Maddieson, Dryer and Haspelmath2013).
As the participants of the current study acquired Polish since birth, English in childhood, and Norwegian in adulthood, in their case, the order of acquisition would presume a gradual enlargement of phonemic (and, specifically, vocalic) repertoire. Consequently, our choice of standard stimuli was motivated by the high degree of cross-linguistic similarity between the three standard sounds, i.e., Polish /ɨ/, English /ɪ/ and Norwegian /i/. On the other hand, the selection of deviants was motivated by systematic differences between the three languages studied, with an additional criterion that the standard and deviant sounds in each language should be comparably distanced from one another. Thus, we selected the following pairs: /ɨ/−/ɛ/ for Polish, /ɪ/−/ʊ/ for English, and /i/−/ʏ/ for Norwegian. The Polish /ɨ/−/ɛ/ contrast is expressed mainly in vowel height and also exists in the other languages under investigation. The English /ɪ/−/ʊ/ contrast manifests itself mainly in backness and rounding, and is also present in Norwegian, but not in Polish, a language with no near-high rounded vowels. Finally, the /i/−/ʏ/ contrast in Norwegian is expressed mainly through roundness and is absent in Polish and English, which do not have front-rounded vowels.
In order to address the research questions and to compare the results of the current study directly to those obtained earlier by Kędzierska et al. (Reference Kędzierska, Rataj, Balas, Cal, Castle and Wrembel2023) for naturalistic language learners, we used the same experimental stimuli involving a set of six monophthongal vowels: /ɨ/ and /ɛ/ for Polish (as in the Polish words byty ‘beingPL’ and bety ‘bed linenPL’), /ɪ/ and /ʊ/ for English (as in fit and foot respectively) and /i/ and /ʏ/ for Norwegian (as in the Norwegian words sin ‘hisREFL’ and synd ‘shame’ respectively). The vowels used in the current study were synthesized with the aid of the PRAAT software (Boersma, Reference Boersma2001) based on formant frequency values available in the literature (Weckwerth & Balas, Reference Weckwerth and Balas2019 for Polish; Bjelaković, Reference Bjelaković2017 for English). Due to the lack of similar reference data for Norwegian, the Norwegian vowels were generated based on the average values obtained from four male native speakers of Norwegian. For all the synthesized stimuli, the duration was 150 ms, the amplitude contour had a 3 ms linear onramp and 75 ms linear offramp, and the f0 trajectory had a steady linear fall from 140 Hz to 110 Hz. The formant values for each vowel as well as Euclidean distances between vowels presented in the same language pairs are presented in Table 2. We also report formant distances between vowels in a given language pair in Appendix S1 (Table S1) to analyze the distances between language pairs (see Table S2) and to establish which phonetic parameters are closely related to the differences reported for MMN.
The summary of vowel formant frequencies used for stimuli synthesis (in Hz) and Euclidean distances between vowels (in Hz and Bark)

3.3. Procedures
The participants were comfortably seated in a sound-attenuated room. At the beginning of the experimental session, they were asked to complete a language history questionnaire (LHQ) (based on Li et al., Reference Li, Zhang, Yu and Zhao2020) and the Edinburgh Handedness Inventory (adapted from Oldfield, Reference Oldfield1971). Further, the experimental stimuli were presented over earphones in three language blocks, the order of which was counterbalanced across participants. Each block contained 660 trials, including 600 standard trials and 60 deviant trials, which means that the probability of a deviant sound occurrence equaled 9.00% in each experimental block. The order of trials was pseudorandomized (independently for every participant), so that each deviant sound was preceded by at least three standard sounds. The volume level was kept constant. While the stimuli were presented, the participants watched a silent movie (more specifically, a cartoon titled Bolek i Lolek). They were explicitly instructed (in Polish) to focus their attention on the cartoon rather than on the sounds and informed that they would be asked 10 detailed open questions about the content of the movie at the end of the experimental session. The language blocks were separated by short breaks of approximately 3 min during which the participants continued watching the cartoon in silence. At the end of the experimental session, the participants completed several tests: a movie comprehension quiz, a gating task aimed at assessing their phonological aptitude (understood as a general ability to differentiate between sounds), as well as English and Norwegian multiple choice proficiency tests.
Gating task
In order to control for any potential individual differences, a gating task in English was administered to the participants to tap into speech-specific capabilities in a foreign language. English was selected as the language of the task, due to its being chronologically the first and more advanced foreign language of the participants. The gating task followed a two-alternative forced choice test procedure, as used by Sebastián-Gallés and Soto-Faraco (Reference Sebastián-Gallés and Soto-Faraco1999) and Sebastian-Gallés and Baus (Reference Sebastián-Gallés, Baus and Cutler2005). A similar test was also employed by Díaz et al. (Reference Díaz, Mitterer, Broersma, Escera and Sebastián-Gallés2016) in order to assess bilingual participants as good or poor L2 perceivers (Díaz et al., Reference Díaz, Mitterer, Broersma, Escera and Sebastián-Gallés2016, p. 959). As in the study of Díaz et al. (Reference Díaz, Mitterer, Broersma, Escera and Sebastián-Gallés2016), the participants were exposed to perceptual stimuli consisting of four minimal pairs with the /æ/−/ɛ/ contrast (i.e., BAG-BEG, LAUGHED-LEFT, SHALL-SHELL, GAS-GUESS). We chose this contrast to be used in the task because /æ/ is not part of the Polish vowel repertoire, and is hence one of the sounds the discrimination of which is problematic for native Polish speakers. The participants were asked to identify the word whose fragment was presented via earphones by pressing one of the two keys (“L” or “A”) on the computer keyboard. Further, they were instructed to assess their confidence level on a 7-point Likert scale. The experimental tokens could be considered a continuum: each word was divided into 10 gates (i.e., fragments) by adding or subtracting 10 ms from the alineation point, i.e., the point where the token words from a given pair (e.g., BAG-BEG) started to diverge. The point was determined based on the visual inspection in PRAAT (Boersma, Reference Boersma2001). Each word token of the minimal pairs was presented twice, which totaled 160 trials (4 pairs × 2 words × 10 gates × 2 presentations), with a break after 80 trials. The words were recorded by a native speaker of American English and presented at an intensity of 75 dB. The gating experiment was conducted in PsychoPy (Peirce et al., Reference Peirce, Gray, Simpson, MacAskill, Höchenberger, Sogo, Kastman and Lindeløv2019).
EEG recordings
The EEG signal was recorded using Brain Products actiCHamp acquisition device at a 500 Hz sampling rate from 64 active electrodes placed at the elastic cap according to the extended 10–20 convention. The ground was positioned at AFz. Two electrodes were placed at the outer canthus of each eye (HEOG1 and HEOG2) and two were placed below and above the right eye (VEOG1 and VEOG2). The signal was referenced online to the right mastoid bone (approximated from TP8), and later re-referenced offline to the average of right and left mastoid bones (approximated from TP7 and TP8). Electrode impedances were kept below 10 kΩ. The EEG data were processed with the Brain Vision Analyzer 2 software (Brain Products, Gilching).
EEG signal processing and data analysis
The pre-processing steps were the same as reported by Kędzierska et al. (Reference Kędzierska, Rataj, Balas, Cal, Castle and Wrembel2023): first, the data were filtered offline with a 0.1–30 Hz band-pass filter, followed by a semi-automatic ICA ocular correction and re-referencing. Epochs time-locked to the onset of each stimulus were extracted between −200 and 800 ms. All deviant stimuli (N = 180) and the standard stimuli immediately preceding a deviant stimulus (N = 180) were included in the analysis. Baseline correction was performed in reference to pre-stimulus activity (i.e., −200 to 0 ms). Epochs contaminated by ocular or muscular artifacts (maximal allowed voltage step: 50 μV/ms, maximal allowed difference of values in intervals of 200 ms: 200 μV, minimal allowed amplitude: −100 μV, maximal allowed amplitude: 100 μV) were rejected from further analysis. This resulted in the exclusion of 2.99% of trials (3.11% for Polish standards, 3.03% for Polish deviants, 3.18% for English standards, 2.50% for English deviants, 2.95% for Norwegian standards and 3.18% for Norwegian deviants).
For each participant, we first computed the averaged waveforms for the standard and the deviant stimuli. After that the difference waveforms (i.e., deviant minus standard) were created. Following Luck and Gaspelin (Reference Luck and Gaspelin2017), we defined the time windows used further in the statistical analysis based on the so-called ‘collapsed’ waveforms (in our case, averaged waveforms elicited by all standard and deviant stimuli, ignoring the three language conditions). As in the case of Kędzierska et al. (Reference Kędzierska, Rataj, Balas, Cal, Castle and Wrembel2023), this approach revealed an increased negativity in the 100–200 ms time window, which was followed by a late negativity in the 350–800 ms time window. Notably, the selected time windows have already been used in the literature: both in the case of MMN (Kujala & Näätänen, Reference Kujala, Näätänen and Polich2003) and LDN (Di Dona et al., Reference Di Dona, Scaltritti and Sulpizio2022). We only included electrodes from the fronto-central brain area in the analysis (F1, F2, F3, F4, Fz, FC1, FC2, FC3, FC4, FCz, C1, C2, C3, C4, Cz), since both investigated effects are typically observed over these sites (Ceponiene et al., Reference Ceponiene, Cheour and Näätänen1998; Kujala & Näätänen, Reference Kujala, Näätänen and Polich2003).
In order to compare the effect sizes for significant effects observed in the lme analysis, we calculated the difference wave (i.e., deviant minus standard) for each participant, individually in each of the analyzed electrodes. We used the lme4 package (Bates et al., Reference Bates, Maechler and Bolker2012) in the R software (R Core Team, Reference Team2012) to perform a linear mixed effects analysis to assess the relationship between the investigated languages and the size of the MMN and LDN effects. The procedure was conducted twice: in the earlier time window (i.e., 100–200 ms) for the MMN effectFootnote 3 and in the later time window (i.e., 350–800 ms) for the LDN effect. Language (i.e., Polish, English and Norwegian) was included in the model as a fixed effect and the intercepts for participants and for electrodes were included as random effects. In the MMN analysis, during model fitting, we encountered a singularity issue, indicating perfect multicollinearity. To address this issue, we removed the intercept for electrodes from the MMN model. We chose to remove the intercept for electrodes rather than the intercept for participant based on model fit diagnostics (model with participant as a random effect: AIC = 3436.31; model with electrode as a random effect: AIC = 3610.86). Visual inspection of residual plots did not reveal any obvious deviations from homoscedasticity or normality in either of the two analyzed time window data sets. P-values were obtained by likelihood ratio tests of the full model with the main effect of language against the model with no main effects.
Additionally, in order to compare the results across two different learning settings, we conducted a statistical analysis with data pooled from the study of Kędzierska et al. (Reference Kędzierska, Rataj, Balas, Cal, Castle and Wrembel2023) (naturalistic learners) and from the current study (formal learners). Given that in the study of Kędzierska et al. (Reference Kędzierska, Rataj, Balas, Cal, Castle and Wrembel2023), 32 electrodes were used,Footnote 4 we selected only these electrodes from the fronto-central region which were used in both experiments (C3, C4, Cz, F3, F4, Fz, FC1, FC2, FCz). We constructed a model with Setting (i.e., naturalistic and formal) and Language (i.e., Polish, English and Norwegian) set as fixed effects and with the intercepts for participants and electrodes included as random effects. The same analysis was conducted twice: in the MMN time window (100–200 ms) and in the LDN time window (350–800 ms). P-values were obtained by likelihood ratio tests of the full model with the setting × language interaction effect against the model with two main effects.
4. Results
4.1. Behavioral tests results
On average, the participants answered correctly to 73.64% (range: 50.00%–100.00%, SD = 16.20%) of the open questions concerning the content of the cartoon they watched. This suggests that during the task, they focused on the movie.
As far as the gating task is concerned, following Kędzierska et al. (Reference Kędzierska, Rataj, Balas, Cal, Castle and Wrembel2023), we determined both the participants’ overall accuracy (range: 56.25%–100.00%, M = 79.83%, SD = 12.34%) as well as the mean ‘gate’ at which the word was correctly recognized and the decision was not changed afterward (range: 6.7–10, M = 8.53, SD = 0.92).
4.2. ERP results
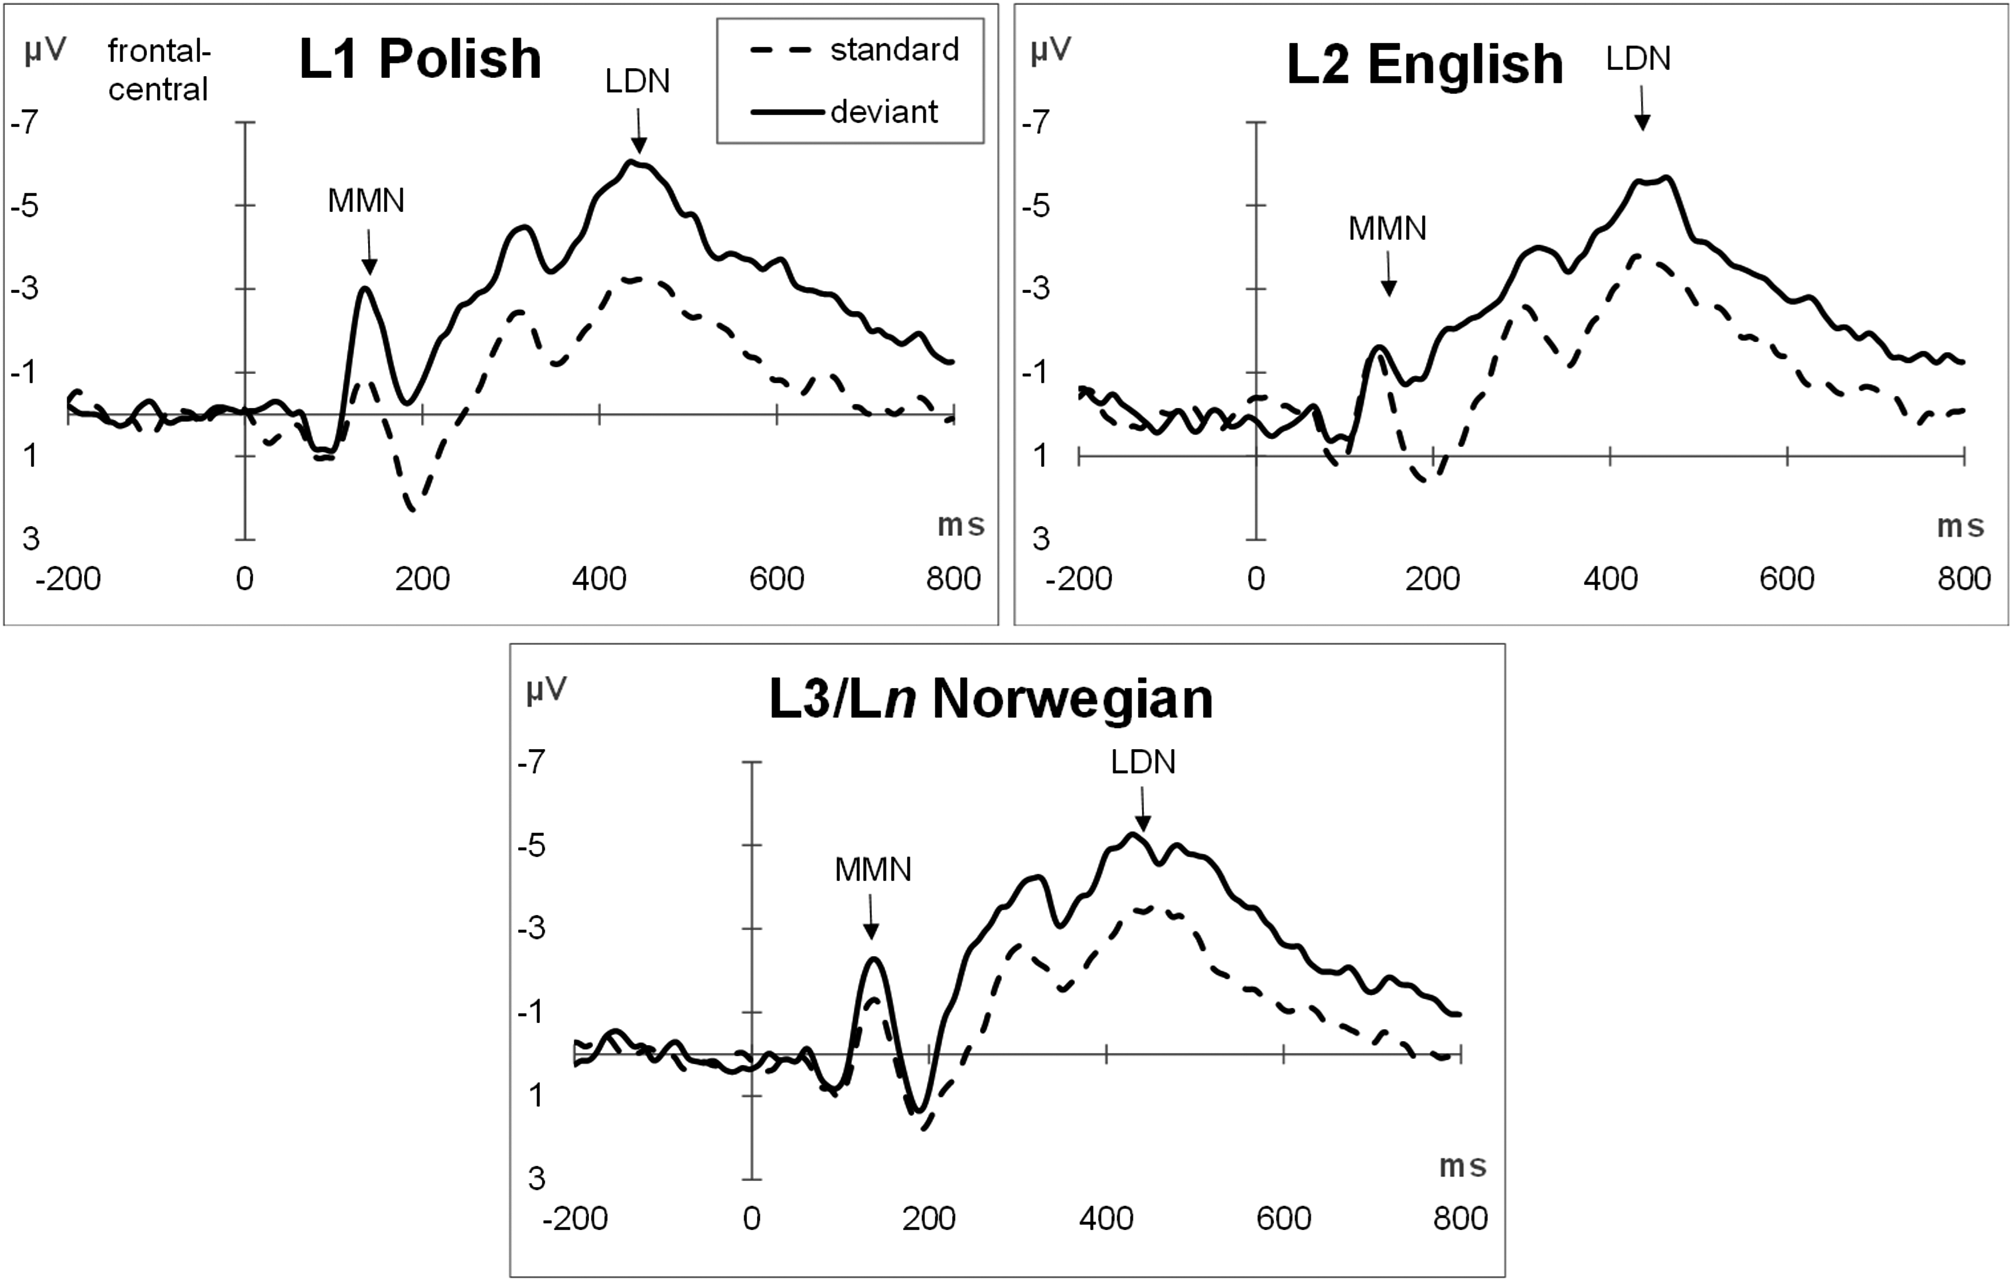
As expected, the deviant sounds in all three languages elicited the MMN-LDN effect. The grand average ERPs and mean voltage difference maps are shown in Figure 1 and Figure 2, respectively. Descriptive statistics for the analyzed conditions in the two-time windows of interest are presented in Table 3.
The grand average ERPs time-locked to the onset of the standard (dashed line) and deviant (solid line) for Polish (A), English (B) and Norwegian (C). The figures present the averaged data obtained from 15 EEG electrodes included in the analyses (i.e., F1, F2, F3, F4, Fz, FC1, FC2, FC3, FC4, FCz, C1, C2, C3, C4 and Cz).

Mean voltage difference maps (deviant minus standard) for Polish (left), English (middle) and Norwegian (right) in the 100–200 ms (upper panel) and 350–800 ms (bottom panel) time windows. The upper middle map presents the electrodes included in the analyses (i.e., F1, F2, F3, F4, Fz, FC1, FC2, FC3, FC4, FCz, C1, C2, C3, C4 and Cz).

Descriptive statistics for the experimental conditions: standard/deviant and Polish/English/Norwegian and for the MMN effect expressed in terms of the deviant minus standard difference in the three language conditions

MMN
In the 100–200 ms time window, we calculated the difference wave between deviant and standard conditions for each participant and each electrode included in the analysis. We then conducted a linear mixed effects analysis of the relationship between the languages and the deviant minus standard difference, reflecting the size of the MMN effect (recall Table 3 for the descriptive statistics for each language condition). Model comparison conducted on this data set revealed a statistically significant main effect of language (χ 2 (2) = 122.06; p < .001). Tukey-based pairwise comparisons (see Table 4) revealed that the differences in the MMN effect were statistically significant for each language pair, i.e., English–Norwegian (Estimate = −0.370, p < .01), English–Polish (Estimate = 0.783, p < .001) and Norwegian–Polish (Estimate = 1.153, p < .001) (see Figure 3 and Figure 4). The results of all statistically significant pairwise comparisons for language contrasts are presented in Table 4.
Pairwise comparisons for the MMN and LDN effects expressed in terms of the deviant minus standard difference in the three language conditions: Polish, English and Norwegian. Degrees-of-freedom method: Kenward-Roger; p-value adjustment: Tukey method for comparing a family of 3 estimates

Mean amplitude values (in μV) observed in each standard/deviant condition and each target language within the 100–200 ms time window (panel A) and the 350–800 ms time window (panel B). Bars indicate standard deviations.

Mean amplitude differences, i.e., deviant minus standard (in μV) for each target language in the 100–200 ms time window (panel A), the 350–800 ms time window (panel B). Bars indicate standard deviations.

LDN
In the 350–800 ms time window selected to measure the LDN effect, we also conducted a linear mixed effects analysis of the relationship between the languages and the deviant minus standard difference, reflecting the size of the LDN effect (recall Table 3 for the descriptive statistics for each language condition). Model comparison conducted on this data set revealed a statistically significant main effect of language (χ 2 (2) = 26.57; p < .001). Tukey-based pairwise comparisons (recall Table 4) revealed that the deviant minus standard difference was statistically significant for the Polish–English pair (Estimate = 0.60, p < .001) and the Polish–Norwegian pair (Estimate = 0.60, p < .001), but not for the English– Norwegian pair (Estimate = 0.00, p = .99) (recall Figure 4).
4.3. Correlation tests
In order to test whether the size of the observed MMN and LDN effects correlated with the participants’ AoA, proficiency or phonological aptitude, we conducted six additional linear mixed-effect analyzes, each evaluating the impact of one of the three predictor variables mentioned above on one of the two investigated ERP effects. We report the results of these analyses in the sections below and present the findings visually in Figure 5.
The results of correlational tests assessing whether AoA, phonological aptitude and proficiency predicted the size of MMN and LDN effects.

Age of acquisition
To determine if the AoA was related to the MMN or the LDN effect, we conducted a linear mixed effect analysis with the self-reported ages of acquisition for English and Norwegian as a predictor variable and the average deviant minus standard amplitude value obtained for each participant in the respective language conditions as a criterion variable. An intercept for participants was included as a random effect in all the models reported in this section. We found out that the AoA did not predict the size of the MMN effect (χ 2 (1) = 2.22; p = .14, R 2 = .05) nor of the LDN effect (χ 2 (1) = 0.17; p = .68, R 2 = .00).
Phonological aptitude
Further, we checked whether the size of the observed ERP effects correlated with the participants’ phonological aptitude operationalized in terms of the result of the gating task. We conducted a linear mixed effect analysis with the participants’ overall accuracy (M = 79.83%, SD = 12.34%) as a predictor variable, but no statistically significant results were observed for the MMN effect (χ 2 (1) = 0.29; p = .60, R 2 = .00) nor for the LDN effect (χ 2 (1) = 2.07; p = .15, R 2 = .11). In addition, we used the mean ‘gate’ at which the word was correctly recognized (M = 8.53, SD = 0.92) as a predictor variable, but this analysis yielded no statistically significant results (MMN: χ 2 (1) = 0.61; p = .43, R 2 = .01; LDN: χ 2 (1) = 2.17; p = .14, R 2 = .11).
Proficiency
In the final analysis, we used the participants’ scores obtained in English and Norwegian proficiency tests as a predictor variable determining their ERP responses in the English and Norwegian language conditions. We found out that proficiency influenced the MMN effect (χ 2 (1) = 3.68; p = .05, R 2 = .08), but not the LDN effect (χ 2 (1) = 1.72; p = .19, R 2 = .22).
4.4. Settings comparison
The results of the comparative analysis revealed a statistically significant Setting × Language interaction effect in the MMN time window (χ 2 (2) = 6.15; p < .05). Tukey-based pairwise comparisons revealed that the MMN effect was significantly different for each language pair in the case of formal learners, i.e., English–Norwegian (Estimate = −0.402, p < .01), English–Polish (Estimate = 0.779, p < .001) and Norwegian–Polish (Estimate = 1.181, p < .001), and for two language pairs, i.e., English–Norwegian (Estimate = −0.440, p < .01) and Norwegian–Polish (Estimate = 0.775, p < .001) in the case of naturalistic learners. The results of all pairwise comparisons for language and setting contrasts are presented in Table 5.
Pairwise comparisons for the MMN effect (100–200 ms time window) expressed in terms of the deviant minus standard difference in the three language conditions: Polish, English and Norwegian and two learnings settings: formal (the current study) and naturalistic (Kędzierska et al., Reference Kędzierska, Rataj, Balas, Cal, Castle and Wrembel2023). Degrees-of-freedom method: Kenward-Roger; p-value adjustment: Tukey method for comparing a family of 3 estimates

In the LDN time window, we only observed a statistically significant main effect of Language (χ 2 (2) = 33.31; p < .001). Tukey-based pairwise comparisons revealed that Polish stimuli elicited a significantly larger LDN effect when compared with English and Norwegian stimuli (English–Polish: Estimate = 0.6028, p < .001; Norwegian–Polish: Estimate = 0.5874, p < .001). We did not find any statistically significant difference between the two non-native languages, though (English–Norwegian: Estimate = 0.0154, p = .99). Figures presenting the comparison of ERP effects obtained for formal learners (the current study) and naturalistic learners (the study of Kędzierska et al., Reference Kędzierska, Rataj, Balas, Cal, Castle and Wrembel2023) are included in the Supplementary Material (Appendix S3).
4.5 Comparison of differences in phonetic parameters and MMN for language pairs
In order to relate differences in phonetic parameters to differences in MMN obtained for language pairs, we can compare data in Table S2 (Appendix S1), which summarizes formant differences for language pairs to the results in Table 4, which summarizes pairwise comparisons for the MMN and LDN effects expressed in terms of the deviant minus standard difference in the three language conditions. For the time window between 100 and 200 ms, the largest difference was observed for Norwegian–Polish, then English–Polish and lastly English–Norwegian. Out of all the phonetic parameters that were taken into account, i.e., F1 (related to differences in vowel height), F2 (related to the tongue advancement) and F3 or F3–F2 (related to lip rounding) and Euclidean distances between vowels (i.e., Euclidean distances calculated for either F1 and F2 or F1, F2 and F3), it turns out that MMN differences were most closely related to differences in F1. The hierarchy of differences was not organized in the same order for other phonetic parameters.
5. Discussion
In the globalized world, it is possible to learn a new language through various means and modalities. In the absence of opportunity to analyze every possible manner of learning a new language, we decided to narrow down our research questions so that they applied to two radically different groups of language learners, i.e., those acquiring a foreign language in a formal classroom setting and those learning it abroad in a naturalistic setting. We wondered whether significant differences would emerge in terms of L1 Polish, L2 English, and L3/Ln Norwegian phoneme processing among formal L2 English and L3/Ln Norwegian learners, and whether we would observe any differences between this group of learners, when compared with an independently recorded group of naturalistic L3/Ln Norwegian learners (Kędzierska et al., Reference Kędzierska, Rataj, Balas, Cal, Castle and Wrembel2023). To achieve this goal, we used a passive oddball paradigm, where the vowels in each investigated language were the same as the stimuli used by Kędzierska et al. (Reference Kędzierska, Rataj, Balas, Cal, Castle and Wrembel2023) and the procedure was almost identical to those employed in the study involving naturalistic Norwegian learners. The participants in the current experiment acquired both foreign languages under investigation in a formal classroom setting. For this group, the difference between L2 English and L3/Ln Norwegian learning history mostly lies in the much earlier AoA for L2 English (i.e., 5.86 years on average), when compared with L3/Ln Norwegian (i.e., at 20.27 years on average). Unlike the naturalistic learners in the study of Kędzierska et al. (Reference Kędzierska, Rataj, Balas, Cal, Castle and Wrembel2023), in the case of the current participants, the L3/Ln acquisition proceeded in a very intensive way during academic-level courses. What seems vital in the comparison of these two groups of learners is that the naturalistic learners acquired both foreign languages later than the instructed group (i.e., at around 9.48 years and 27.33 years, respectively). What is more, the naturalistic group predominantly reported to use English much more frequently than Norwegian in their everyday lives (Kędzierska et al., Reference Kędzierska, Rataj, Balas, Cal, Castle and Wrembel2023, p. 9).
The study aimed to answer several research questions, with the most general one concerning the comparison of the MMN amplitudes in the native language (i.e., Polish) with respect to the non-native languages (i.e., L2 English and L3/Ln Norwegian). Previous studies in bilingual phoneme processing have shown that the MMN effect is typically smaller for non-native when compared with native phoneme contrasts, especially if the investigated languages are acquired in a formal setting (e.g., Jakoby et al., Reference Jakoby, Goldstein and Faust2011; Liang & Chen, Reference Liang and Chen2022; Song & Iverson, Reference Song and Iverson2018). Therefore, we hypothesized that the MMN effect will be significantly larger in L1 Polish when compared with L2 English and L3/Ln Norwegian. This prediction was confirmed in the instructed learning context in the present study as the amplitude of the MMN was the greatest in L1 Polish, smaller in L2 English and the smallest in L3/Ln Norwegian, with all pairwise comparisons yielding statistically significant results. However, in the previous study investigating phonemic perception in the naturalistic context for language learners recorded in Norway, Kędzierska et al. (Reference Kędzierska, Rataj, Balas, Cal, Castle and Wrembel2023) observed no statistically significant difference between L1 Polish and L2 English. Our analysis of data pooled from the two studies further confirmed this finding. This result shows that despite higher AoA, the naturalistic group seems to have developed more native-like mechanisms of phoneme processing, when compared with the instructed group. Quite interestingly (and perhaps somewhat counterintuitively), the difference is only visible in L2 English, though. Since the naturalistic participants were more dominant in L2 English than in L3/Ln Norwegian (i.e., they predominantly used English for communication, especially in the work environment, despite living in Norway), this difference, in our view, should be attributed to the influence of immersive learning context on the ability to discriminate non-native phonemic contrasts. This conclusion is also in accordance with the results obtained by Winkler et al. (Reference Winkler, Kujala, Tiitinen, Sivonen, Alku, Lehtokoski, Czigler, Csépe, Ilmoniemi and Näätänen1999), who showed that naturalistic learners of Finnish exhibited a native-like MMN response to Finnish vowel contrasts.
In terms of the differences between L2 English and L3/Ln Norwegian, a weaker MMN effect in the L3/Ln also signals the importance of – very broadly understood – language dominance as a factor greatly contributing to effective phoneme discrimination. Early age of acquisition and higher language proficiency seem to considerably facilitate this task, as evidenced by the results of several correlation analyses in the current study (recall Section 3.3) as well as those conducted previously by Kędzierska et al. (Reference Kędzierska, Rataj, Balas, Cal, Castle and Wrembel2023). As in the case of numerous previous studies on non-native phoneme discrimination, in the current study, the MMN was followed by the LDN effect, which is – among other suggested explanations – believed to indicate whether memory traces associated with a specific phonemic representation have been formed successfully (Barry et al., Reference Barry, Hardiman and Bishop2009; Jakoby et al., Reference Jakoby, Goldstein and Faust2011). For this response, we also observed statistically significant differences between L1 Polish and the two non-native languages in question in the instructed learning context. In contrast to the MMN, we found no statistically significant difference between L2 English and L3/Ln Norwegian, though. In this way, we have replicated the results of Kędzierska et al. (Reference Kędzierska, Rataj, Balas, Cal, Castle and Wrembel2023), who also observed no such difference in naturalistic learners – a finding further corroborated by the results of a comparative statistical analysis with data pooled from the two studies. This result supports an idea still debated in the literature (e.g., Deroche et al., Reference Deroche, Wolfe, Neumann, Manning, Towler, Alemi, Bien, Koirala, Hanna, Henry and Gracco2023; Halliday et al., Reference Halliday, Barry, Hardiman and Bishop2014) that the two ERP components – the MMN and the LDN – indicate two distinct processes.
In light of the current results, while the MMN might (in consistence with previous findings) be assumed to index auditory discrimination, the functional significance of the LDN should be viewed as going beyond the mere continuation of the earlier effect (i.e., the so-called ‘late MMN’ interpretation), since the two components do not show a similar pattern. The current results also seem to speak against the interpretation of the LDN as a response evoked by the re-orientation of attention after being distracted by a deviant sound (Shestakova et al., Reference Shestakova, Huotilainen, Ceponiene and Cheour2003; Wetzel et al., Reference Wetzel, Widmann, Berti and Schröger2006). Rather, the LDN might be considered an index of successful formation of phonological representations (Barry et al., Reference Barry, Hardiman and Bishop2009), which – at least in the current study – remained unaffected by the foreign language status (L2 and L3/Ln) or learning context (instructed and naturalistic). This would suggest that the processing differences between the two non-native languages are better reflected at the pre-attentional level in the MMN time window, and – assuming a sufficient amount of training has been received – might further shade at a higher order cognitive level.
A more detailed examination of the acoustic parameters of the vowel stimuli was conducted to ensure that the observed effects are not solely attributable to acoustic differences between standards and deviants in each language block. Since we are dealing with natural spoken languages, it is impossible to designate equidistant stimuli. When Euclidean distances in Bark between stimuli in each language block were examined, the distance was the largest in English (4.77), then in Polish (2.31) and the smallest in Norwegian (1.51). The MMN effects in the 100–200 ms time window, as evaluated on the basis of estimates in pairwise comparisons between experimental conditions, were, however, the largest for Polish (−1.81), then for English (−1.03) and the smallest for Norwegian (−0.66). This means that although the Euclidean distance between Polish stimuli was nearly twice as small as between English stimuli, it was the native phonemic contrast that evoked larger MMN effects. In similar studies (Kędzierska et al., Reference Kędzierska, Rataj, Balas and Wrembelsubmitted; Kędzierska et al., Reference Kędzierska, Rataj, Balas, Cal, Castle and Wrembel2023), Euclidean distances did not determine the MMN effects, either. In Kędzierska et al. (Reference Kędzierska, Rataj, Balas, Cal, Castle and Wrembel2023), a study with the same stimuli and a different participant group of naturalistic language learners, the MMN effects were similar for L1 Polish and L2 English, but smaller for L3 Norwegian. In Kędzierska et al. (Reference Kędzierska, Rataj, Balas and Wrembelsubmitted), the Euclidean distances between stimuli in all languages were fairly balanced, and we obtained similar results when it comes to the hierarchy of MMN effects, suggesting that these were not pure acoustic differences between the stimuli in a given language block that influenced the MMN response.
Also, although the stimuli were presented to the participants in separate language blocks, in the statistical analysis, we compared the MMN effect size across languages. When we attempted to compare distances between vowel stimuli in Bark across languages, it turned out that out of all phonetic parameters taken into account (i.e., F1, F2, F3, F3–F2 and Euclidean distances based on F1 and F2 or F1, F2 and F3), it was the distance in F1 (see Appendix S1) that best reflected the hierarchy of MMN differences (see Table S2 in Appendix S1): both the distance and the MMN effect were largest for the Norwegian minus Polish condition, followed by English minus Polish and English minus Norwegian. F1 is related to vowel height, and vowel height distinctions in world languages are equal to or more numerous than backness distinctions (Crothers, Reference Crothers, Greenberg, Ferguson and Movarvcsik1978). The former turned out to be relatively easily perceivable (Balas, Reference Balas2018). The lack of a straightforward relationship between other phonetic parameters, especially Euclidean distances and MMN effects, suggests that the MMN effects that we observed were not artifacts of acoustic effects, but were rather attributable to language status (native versus non-native) and AoA. So far, we have shown that the largest Euclidean distance between L2 vowels did not entail the biggest MMN effects. Future research should examine other combinations of languages and vowel contrasts, especially with the largest Euclidean distance in L3/Ln when compared with L2 and L1. In such studies, other vowel pairs could be examined in order to disentangle the effects of language status (operationalized as L2 or L3/Ln) and the effects associated with the characteristics of the presented auditory stimuli. However, it is not viable to include all combinations of distances between stimuli in a single study due to inherent limitations of natural languages.
One limitation of the current study is that it involves a relatively small sample size stemming from the overall low population of Polish–English–Norwegian trilinguals. This also resulted in a specific acquisition order with L2 English and L3 Norwegian. The reverse combination would hardly be feasible to find among adult formal learners due to the well-established status of English as the most frequent L2 choice. Moreover, assessing speech-specific capabilities could be extended to other tasks, e.g., a word identification or a lexical decision task, rather than only the gating task, which should also ideally involve phoneme pairs in all three languages under investigation. The reason why we decided to conduct the task only in one language was motivated by the overall long duration of the study. We focused on English since we predicted the Polish vowel contrasts might be too easy to detect for native Polish speakers, given the generally modest repertoire of Polish vowels, while English was chronologically the first and more advanced foreign language of our participants.
6. Conclusions
The main objective of this study was to investigate the processing of vowel contrasts by multilingual learners, a topic particularly relevant in times of rapid globalization, the strengthening status of English as a lingua franca, and numerous other factors that favor increasing linguistic heterogeneity. The novelty of our investigation includes the selection of trilingual participants who learnt both foreign languages in a formal setting and the analysis of the results in the light of those obtained earlier for a group of naturalistic/mixed learners of the same languages. Altogether, our research supports the idea that foreign language status (i.e., L2 vs. L3/Ln) influences early auditory processing. However, such factors as learning context and language proficiency can undeniably affect the efficiency of phoneme discrimination in a non-native language. Therefore, under certain circumstances, the contrasts between native and non-native languages may considerably diminish, possibly leading to native-like phoneme discrimination in the most advanced learners and/or for the most dominant language.
The novelty of the current research mostly relies on the inclusion of various learners’ groups: all studies to date have investigated non-native phoneme perception from the perspective of one acquisition setting – be it either naturalistic or instructed. The current study is, to the best of our knowledge, the first ERP study which focused on a purely formal (i.e., classroom-instruction) learners of two non-native languages. We then analyzed the results in the light of the ones obtained earlier for exactly the same experimental material, but processed by naturalistic/mixed learners (Kędzierska et al., Reference Kędzierska, Rataj, Balas, Cal, Castle and Wrembel2023). An advantage observed for the naturalistic group who seemed to process the L1 and L2 sounds equally effectively yet again shows that non-native phonemic processing benefits from frequent use in natural communicative contexts. However, it should not so much lead to a detrimental division into ‘better’ and ‘worse’ acquisition settings, but rather should inform educational decisions of those whom they concern. Undoubtedly, phonemic processing and, consequently, successful phonemic production, is one of the most relevant skills in which any learner strives to achieve competence. Understanding the determinants that enhance the efficiency of non-native phonemes acquisition ought to exert more impact on the pedagogical decisions undertaken by educators, as well as on the choices made by learners or their parents.
Supplementary material
To view supplementary material for this article, please visit http://doi.org/10.1017/S136672892400066X.
Data availability statement
The data that support the findings of this study are openly available in the OSF repository at the following link: https://osf.io/2956a/.
Acknowledgements
We thank Zuzanna Cal and Tristan Czarnecki-Verner for their assistance with the EEG recordings and Kamil Kaźmierski for his comments on data analysis.
Funding statement
The research leading to these results has received funding from the Norwegian Financial Mechanism 2014–2021 project number 2019/34/H/HS2/00495.
Competing interest
The authors declare none.


 Open access