

1. Introduction
Since climate change has a profound influence on the environment that sustains life, the warming in the second half of the 20th century has important implications for publicly shared resources and public policy. Over the past century, one of the best-documented trends is the increase in the Earth’s globally averaged near-surface temperature (Reference HoughtonHoughton and others, 2001). However, regional temperature trends show marked differences. For instance, warming trends have been greater in western China than in eastern China (Reference QinQin, 2005). Precipitation usually exhibits much greater spatial variability, such that regional differences are even more variable and complex than those of temperature. It has been reported that the climate in northwestern China is becoming both warmer and wetter (Reference Shi, Shen and HuShi and others, 2002; Reference ShiShi, 2003), while the trends are less clear in southwestern China.
The near-global-scale retreat of glaciers during the last few decades is frequently mentioned as a clear and unambiguous sign of increasing temperatures (Reference HoughtonHoughton and others, 2001; Reference OerlemansOerlemans, 2005). The Tibetan Plateau is one of the important glacierized regions in the middle and low latitudes, where glacier retreat appears to be prevalent (Reference Yao, Wang, Liu, Pu, Shen and LuYao and others, 2004). Glacier variations and climate changes in the central Himalaya along the southern margin of the Tibetan Plateau are particularly interesting, as these are among the Earth’s highest peaks and the regional precipitation is dominated by the monsoon system. Here, meteorological stations are sparse, with relatively short-term instrumental records, but these have been augmented by ice-core records from glaciers on Qomolangma (Mount Everest) and Xixiabangma in the central Himalaya (Fig. 1). The ice-core records suggest that annual net accumulation has been decreasing over the last century (Reference Hou, Qin, Wake, Mayewski, Ren and YangHou and others, 2000; Reference QinQin and others, 2000; Reference Thompson, Yao, Mosley-Thompson, Davis, Henderson and LinThompson and others, 2000; Reference Yao, Duan and TianYao and others, 2000; Reference Duan, Yao, Pu and SunDuan and others, 2002), while at the same time temperatures (inferred from stable-isotopic ratios) have been increasing (Reference Thompson, Yao, Mosley-Thompson, Davis, Henderson and LinThompson and others, 2000; Reference YaoYao and others, 2002). The degree to which stable-isotopic ratios reflect temperature and over what timescales this relationship may be valid remain open for debate (Reference Zhang, Qin and HouZhang and others, 2003). Although glacier mass balances and variations in the terminus positions have not been systematically and continuously monitored, the relative positions of some glacier margins have been measured during ice-core drilling programs. These have been compared to observations made by earlier field parties. Comparisons of glacier terminal positions in different years allow a general estimation of recent glacier changes in this region. Here we present the available data for five different glaciers in the central Himalaya and we discuss the possible climatic drivers responsible for the observed changes.
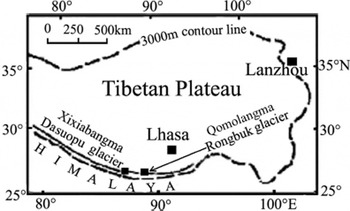
Fig. 1. A sketch map showing the location of Qomolangma and Xixiabangma.
2. Observation Results of Glacier Variation
The term glacier variation is very general and may refer to various observations that include changes in length, width, thickness, area and total volume. However, only rarely are all the components necessary to determine volume changes obtained, due to the rigors of the field site or the length of time available for the measurements. Often these observations are made opportunistically. The most common observation is the position of the glacier terminus, such that changes over time are inferred to represent variations in glacier length.
Field investigations and inventory data from the 1950s to the 1980s (Reference Ren and ShiRen, 1988) suggest that most of the glaciers in the Himalaya within the boundaries of China have been retreating over the last 50 years. In the central Himalaya, the glaciers on Qomolangma and Xixiabangma have been measured several times over the past few decades.
The first survey and mapping with high precision was done on Qomolangma in 1966. Since 1997, the boundary between the debris-covered ice and debris-free areas of both Rongbuk and East Rongbuk Glaciers has been measured six times, and for Far East Rongbuk Glacier it has been measured twice. On Xixiabangma, the termini of two glaciers were measured twice (Table 1). These data allow the retreat of the termini and/or the near-terminal position (see discussion below) to be determined.
Table 1. Observed retreat rates of glacier terminus positions on Qomolangma and Xixiabangma

On the lower part of Rongbuk Glacier, there is a debris-covered area; the section A–B (Fig. 2) is very rough, covered by a debris layer and a number of small pools of water. The buried ice beneath the debris layer seems to be stable, suggesting that the debris-covered area has not changed greatly since the 1966 observations. In 1966, section B–C (Fig. 2) was a debris-free area, but in 1997 it was observed to be a flat debris-covered area with a surface that is lower than that of section A–B. It appears that no ice remains under section B–C. Henceforth, section B–C has enlarged continuously but point B has not changed. Therefore, we interpret the position denoted as C to be the present terminus of this glacier. Thus, the glacier terminus retreat data in Table 2 were measured relative to point C. The other glaciers in Table 2 did not have a debris cover.

Fig. 2. A sketch of the surface profile near the Middle Rongbuk Glacier terminus.
Comparisons of the terminus positions measured in different years (Table 1) show that all five glaciers have been continuously retreating since the initial observation. On Qomolangma the near-terminus retreat rate from 1966 to 1997 was 8.7, 5.5 and 7.4 ma−1 for Rongbuk Glacier and East and Far East Rongbuk Glaciers, respectively. Between 1997 and 2004 the retreat of these glaciers accelerated slightly (Table 1). On Xixiabangma, Kangwure glacier retreated at a rate of 5.23 m a−1 from 1991 to 2001, while a branch of Dasuopu glacier retreated at an average rate of 4.0 m a−1 from 1968 to 1997 (Pu, personal observation). It is reported that the glaciers on the south slope of Qomolangma have also retreated over the last few decades, and that the rate of retreat appears to have accelerated since the 1980s (Reference Fujita, Nakawo, Fujii and PaudyalFujita and others, 1997, Reference Fujita, Takeuchi and Seko1998, Reference Fujita, Kadota, Rana, Kayastha and Ageta2001; Reference Kadota, Fujita, Seko, Kayastha and AgetaKadota and others, 1997; Reference YamadaYamada and others, 1992; Reference Seko, Yabuki, Nakawo, Sakai, Kadota and YamadaSeko and others, 1998).
3. Precipitation Changes Derived From Ice Cores
In 1997, three ice cores from Dasuopu glacier were drilled to depths of 149–168m (Reference Thompson, Yao, Mosley-Thompson, Davis, Henderson and LinThompson and others, 2000; Reference YaoYao and others, 2002). Several cores have also been drilled to depths of 40–120m on East Rongbuk and Far East Rongbuk Glaciers on Qomolangma (Reference Hou, Qin, Wake, Mayewski, Ren and YangHou and others, 2000; Reference QinQin and others, 2002). The analyses of these cores yielded multi-century records of climate changes (net accumulation and isotopically inferred temperatures) for the middle part of the Himalaya. These records are important, as they provide a paleoclimatic context that should help understand the processes driving the currently observed glacier retreat in the region.
At these high-elevation drill sites it is very cold, and snowmelt is minimal. Thus little mass is lost from the annual accumulation layer that is gradually thinned by steady vertical compression. Some mass might be removed by wind scour, but there is no way to control for this effect. Thus the annual layer thicknesses (in meters of water equivalent) are assumed to approximate the net annual accumulation or possibly the local annual precipitation, particularly when averaged over multiple years and decades. A 400 year record of accumulation rate derived from the Dasuopu ice cores (Reference Yao, Duan and TianYao and others, 2000; Reference Duan, Yao, Pu and SunDuan and others, 2002, Reference Duan, Yao and Thompson2004) indicates that the annual accumulation rate has decreased continuously since 1930. Similar records from the 40 and 80m cores from Qomolangma indicate that the annual accumulation rate decreased rapidly from the 1950s to the 1960s, remained constant until the 1980s, then decreased up to the present (Reference Hou, Qin, Wake and MayewskiHou and others, 1999; Reference QinQin and others, 2002).
Precipitation in the region comes mainly via the Indian monsoon, so changes in net accumulation should at least partially reflect monsoonal variations. Monsoon precipitation exhibits large spatial variability. Reference Duan, Yao, Pu and SunDuan and others (2002) and K. Duan (unpublished information) have compared the annual accumulation time series from the Dasuopu ice cores over the past 300 years and precipitation records in various regions of India over the last century. Their comparative study confirmed that the ice-core-derived accumulation rate variations are consistent with precipitation variations in the northern, and especially the northeastern, Indian Peninsula. Zhang (2002) reached a similar conclusion using the accumulation histories from the Qomolangma ice cores. These data suggest that precipitation trends in the central Himalaya are dominated by northeastern Indian monsoon precipitation.
4. Temperature Change
Reference Thompson, Yao, Mosley-Thompson, Davis, Henderson and LinThompson and others (2000) found that over relatively long timescales (decades to century) the trend in δ18O from the Dasuopu ice core is similar to that of the Northern Hemisphere temperature history. This leads them to suggest that the δ18O profiles from Himalayan ice cores might reflect long-term changes in temperature. Reference YaoYao and others (2002) discussed temperature changes over the past 2 kyr as inferred from the Dasuopu δ18O profiles, and identified two very prominent warm periods: the Medieval Warm Period and a continuous increase in temperature since ∼1850. In contrast, a monitoring study that compared the stable-isotopic ratios in rainfall at various sites over the Tibetan Plateau (Reference Tian, Masson-Delmotte, Stievenard, Yao and JouzelTian and others, 2001, Reference Tian2003) with precipitation and snow layers on glaciers on Qomolangma and Xixiabangma (Reference Kang, Wake, Qin, Mayewski and YaoKang and others, 2000; Reference QinQin and others, 2000, Reference Qin2002; Reference ZhangZhang, 2001; Reference Zhang, Qin and HouZhang and others, 2003) showed that on very short timescales the δ18O composition of the rainfall over the southern Tibetan Plateau reflects mainly the ‘precipitation amount effect’, i.e. the higher the amount of monsoon precipitation, the lower (more negative) the isotopic ratio. Therefore, it seems unreasonable to interpret changes in the ice-core δ18O profile as indicative of only temperature changes on annual to decadal timescales.
Thus the question arises as to whether temperature has increased in the central Himalaya in the past few decades as inferred from the ice-core δ18O records. Meteorological station data reveal that this is the case. Figure 3 shows the annual and summer (June-August) mean temperatures from the meteorological stations at Dingri (4300ma.s.l.), located ∼80km northeast of Qomolangma, and Nyalam (3800ma.s.l.), located ∼40km southeast of Xixiabangma. The full observational period is shown for both stations. The four decades of data from Dingri (Fig. 3) reveal the lowest temperatures in the 1960s and continuously increasing temperatures since the 1970s. Annual and summer temperatures show similar trends, but in the late 1990s the annual average temperatures increased rapidly while summer temperatures continued to increase more slowly. At Nyalam, annual average temperatures showed little change from the 1960s to the 1990s, but increased abruptly thereafter. Interestingly, summer temperatures increased continuously over the observation period. In general, the range of temperatures over this period is larger at Dingri than at Nyalam. The Nyalam station is located in a river valley with plentiful precipitation, while Dingri station is located in an arid mountain zone. This is as expected since the temperature ranges over the course of a year are smaller in moist regions than in arid regions (Reference AhrensAhrens, 1994).

Fig. 3. The annual and the summer (June–August) mean temperatures at Dingri and Nyalam meteorological stations.
Moreover, from the Assessment Report of Climate and Environment Changes in West China (Reference Hou, Qin, Wake, Mayewski, Ren and YangQin, 2002) and the Intergovernmental Panel on Climate Change (IPCC) Third Assessment Report (Reference HoughtonHoughton and others, 2001), the increase in annual temperatures has been widespread in southwest China over the past 50 years and in south Asia since 1976. In addition, the recent large-scale retreat of glaciers on the southern slopes of the Himalaya suggests that rising temperatures may play an important role.
5. Discussion
As discussed above, observations suggest that glacier recession in the central Himalaya may be the result of both a decrease in precipitation and an increase in temperature. Unfortunately, the relative importance of temperature and precipitation cannot be assessed at this time due to the small number of available meteorological records, their relatively short length and the very limited number of glacier mass-balance observations in the remote Himalayan region.
Although glaciers inevitably respond to climate changes that affect their mass balance, the response time can vary from glacier to glacier. For most mountain glaciers, the delay time is <10 years (Reference PatersonPaterson, 1994), but the response time, i.e. the time a glacier takes to adjust to a change in mass balance, is longer. The response time depends on the glacier dimensions, especially on its length, as well as on the basic physical characteristics of the glacier such as velocity and rates of ablation. For valley glaciers, the response time is believed to be on the order of several decades (Reference PatersonPaterson, 1994). In the case of Rongbuk Glacier, for example, the response time can be estimated very roughly if we take the simplest formula introduced by Reference PatersonPaterson (1994): t = 1.5h/a 0 or t = L/(2u 0), where t is the response time (years), h is the average thickness, a 0 is the ablation rate at the glacier terminus (m a−1), L is the glacier length, and u 0 is the velocity at the terminus. The length of Rongbuk Glacier is 22.4 km, and the average value of the surface velocity is a little more than 20 m a −1 in the ablation area and about 10 m a−1 at the terminus. However, for large glaciers, such as Rongbuk and Dasuopu glaciers, basal sliding may in part determine the ice velocity (Reference Shi, Huang and RenShi and others, 1988). The ablation rate at the terminus is 2–3 m a−1. Although the ice thickness has not been measured, the average thickness is likely to be <120 m because the deepest ice-core drilling to bedrock in the accumulation area is about 120m. If we take the average thickness as 80–120m, the response time, is estimated to lie somewhere between 40 and 120 years. It is shorter for the other glaciers in Table 1. Thus it is likely that the glaciers in the central Himalaya are still responding to changes in their regional climate that occurred several decades ago.
This estimate is based on an ideal assumption that the mass balance remains steady at the new value (mass balance) until the response ends. In reality, climate, and hence glacier mass balance, do not remain constant for long time periods. In this region, as mentioned above, temperatures have been increasing while precipitation has been decreasing over the past few decades. Consequently, not only the glacier mass balance but also the ice velocity undergoes continuous change. Therefore, the response time is likely to be shorter than the value above that was estimated using the simple formula. The situation is actually more complex, as warmer temperatures are likely to lead to increased meltwater production that may increase the ice velocity, which will further shorten the response time. For further discussion, particularly for modeling response times, detailed observations of many glacier parameters are needed.
According to recent comprehensive studies of climate in western China (Reference Wang, Gong, Zhai, Cau, Mu, Wang and DongWang and others, 2002; Reference Zhao, Gao, Tang, Xu and DingZhao and others, 2002), temperatures are expected to increase in the near future. As the accumulation rate inferred from ice-core records has been shown to be highly negatively correlated with Northern Hemispheric temperatures (Reference Thompson, Yao, Mosley-Thompson, Davis, Henderson and LinThompson and others, 2000; Reference Yao, Duan and TianYao and others, 2000; Reference Duan, Yao, Pu and SunDuan and others, 2002; K. Duan, unpublished information), it is possible that the warm-dry trend in the central Himalaya will continue in concert with the projected global temperature trends, and glacier retreat in the region may accelerate. Even if the trend toward warmer and dryer conditions reverses toward colder and drier or colder and wetter conditions, the glaciers in the region should continue to retreat for some time into the future due to the time needed to respond to the change in the climate regime.
Acknowledgements
This work was supported by the Chinese Academy of Sciences (grant No. KZCX2-SW-118 and KZCX3-SW-235). Special thanks to K. Fujita and an anonymous reviewer for helpful comments and suggestions, and to L. Thompson, H. Brecher and E. Mosley-Thompson for improving the manuscript.


