


Introduction
Detection of climate change involves determining a multi-year baseline for a climate parameter and then detecting variations that exceed its observed range over the baseline period. Increasing temperatures, possibly linked to global climate warming, have been detected at sites on the Antarctic Peninsula (Reference Jacka, Budd, Weller, Wilson and SeverinJacka and Budd, 1991; Reference KingKing, 1994; Reference Vaughan and DoakeVaughan and Doake, 1996). Further inland, at specific automatic weather stations (AWSs), data on near-surface temperature (TA) are beginning to define a climate baseline (Reference Shuman and StearnsShuman and Stearns, 2001). However, these data have significant gaps and may not be representative of broader regional or continental-scale patterns. Temperature fields derived from satellite infrared (Reference ComisoComiso, 2000) or passive-microwave sensors can provide a much more complete characterization of spatial and temporal variations in Antarctic temperature. Currently, the only spatially detailed record of surface temperature across Antarctica is provided by Advanced Very High Resolution Radiometer (AVHRR) infrared channels (TIR), but they must be carefully processed to remove the effects of clouds (Reference ComisoComiso, 2000). Passive-microwave data from the 37 GHz channel of the Special Sensor Microwave/Imager (SSM/I) are not influenced by cloud cover and can be calibrated (TC) at specific AWS locations (Reference Shuman, Alley, Anandakrishnan and StearnsShuman and others, 1995) or by complex radiative transfer models (Reference Fung and ChenFung and Chen, 1981; Reference Comiso, Zwally and SabaComiso and others, 1982), but cannot yet be broadly extrapolated in space and time because of still poorly understood spatial variations in the emissivity of the surface. Time series of these satellite data, if they could be used consistently, would provide the temperature data needed to identify regional and continental-scale climate change across Antarctica. This study, using recently published temperature data, analyzes in situ and satellite temperature information, and documents the advantages and limitations of each approach. The intent of this study is to use the AWS data to gain insight into the accuracy of the surface temperatures retrieved from satellite infrared and microwave sources and establish confidence limits on these data.
This project used three types of temperature data from 1992 that were spatially and temporally co-registered:
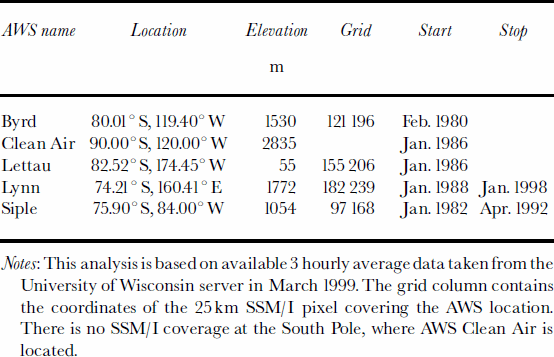
(1) daily-average TA records from five AWSs in Antarctica operated by the University of Wisconsin (see Fig. 1; Table1);
(2) daily-average AVHRR TIR data compiled and processed as described in Reference ComisoComiso (2000); and
(3) daily-average TC data derived from the SSM/I datasets compiled by the U.S. National Snow and Ice Data Center (NSIDC) and calibrated as described in Reference Shuman, Steffen, Box and StearnsShuman and Stearns (2001).
The locations and dates of operation of the five inland Antarctic AWSs used in this study. Dates are mm/dd/yy.

Site data for inland Antarctic AWS temperature records
The three measurements are not exactly for the same physical parameter since the AWS measures near-surface air temperature (~2 m), the infrared sensor measures skin-depth temperature, and the passive-microwave sensor measures the average temperature of the upper surface layer. This comparative analysis will help establish how the three datasets can be used in conjunction to study the variations of an important climate parameter through time.
Statement Of Problem
Near-surface air-temperature data have been consistently monitored by AWS since 1980 at some sites, and many of these observations continue to the current day (Reference Shuman and StearnsShuman and Stearns, 2001). However, as the data in Figure 2 illustrate, the records from Antarctic AWS sites are not continuous. Because of equipment and logistics challenges in this harsh environment, AWS records may be composed of segments that are separated by temporal gaps of considerable length. These data gaps complicate the effort of long-term in situ climate monitoring. In addition, AWS TA data may not perfectly represent actual temperature at all times. For
Fig 2

example, minor increases due to solar heating have been suggested at some ice-sheet locations (Reference Shuman and StearnsShuman and others, 2001). See Reference ComisoComiso (2000) for a detailed analysis of in situ temperature records from Antarctic sites.
AVHRR data have been available since the 1970s, but it was not until 1981 that digital versions of continuous orbital records became available. Their wide swath (2240 km) and a revisit time of about 102 min makes AVHRR data suitable for variability studies of surface temperatures at a reasonably good temporal resolution. For temperature studies, a large fraction of the data, however, must be discarded because of cloud effects since infrared radiation cannot penetrate through the clouds. Nevertheless, because of a relatively high sampling rate, there are enough cloud-free surface data to cover the entire Antarctic region in a week. Weekly maps of the entire Antarctic region can thus be produced with AVHRR, but because of residuals in the cloud masking, these are not as accurate as the monthly maps where the averaging of more observations makes the impact of any cloud-contaminated pixels less prominent.
Passive-microwave brightness temperatures (TB) from Antarctica also begin in the 1970s, from 1978 onward consistently, and can be an effective surrogate temperature indicator over polar snow if they can be accurately calibrated into TC values (see Fig. 2). The TB data do not provide a pure temperature signal, however; they are a function of the characteristics of the snow and ice over the depth of emission (Reference Shuman, Alley, Anandakrishnan and StearnsShuman and others, 1995; Reference Shuman and StearnsShuman and Stearns, 2001). This means that passive-microwave data cannot be used directly to substitute for missing TA or TIR temperatures but must first be calibrated to account for approximately annual variations in snow-emission characteristics. As discussed in Reference Shuman, Alley, Anandakrishnan and StearnsShuman and others (1995), radiative transfer modeling will account for all the factors that influence the conversion of TB data into temperature estimates. Currently, however, field observations are required to account for variations in snow characteristics, so this approach is not yet widely applicable. A temperature inferred from the passive-microwave data represents the average of a layer of snow that may vary in thickness from one location to another because of changes in snow properties. Depending on frequency, the penetration depth can be as much as a few meters, but is thought to be a few tens of centimeters for the 37 GHz channel used here (Reference Shuman, Alley, Anandakrishnan and StearnsShuman and others, 1995). An additional complication for the passive-microwave technique is introduced by brief melt events in the vicinity of some Antarctic AWSs (Reference Zwally and FieglesZwally and Fiegles, 1994; Reference Abdalati and SteffenAbdalati and Steffen, 1997). Large brightness-temperature increases associated with the presence of liquid water do not significantly impact this analysis, but they are discussed later (see Fig. 3 and associated dates in the AWS Lettau TC record (Fig. 2c)).
Illustration of the spatial extent of a melt event (lighter gray tones) that briefly impacts the Lettau TC record. The event lasted from approximately 21 December 1991 to 6 June 1992 and reached its apparent maximum extent on 23 December 1991 (illustrated). This daily average SSM/I 37 GHz horizontal polarization image also shows the coverage gap around South Pole, and inconsistent data values associated with an isolated sensor sweep in East Antarctica.

Methodology
The AWS data were obtained from the 3 hourly files at the anonymous file transfer protocol (ftp) site operated by the University of Wisconsin, Madison. These data are quality-controlled samples of 10 min AWS observations that are also available from this site (ftp://ice.ssec.wisc.edu/). The daily-average TA values are then derived from the 3 hourly data. Detailed information on the AWS units that are used here, including data transmission and quality control, is presented in Reference Stearns, Weidner, Bromwich and StearnsStearns and Weidner (1993) and Reference Stearns, Keller, Weidner, Sievers, Bromwich and StearnsStearns and others (1993). These papers specify the temperature resolution of the AWS sensors as 0.125°C. Absolute calibration in the longer term and adjustments to sensor height as snow accumulates remain problems for TA data (Reference Shuman and StearnsShuman and Stearns, 2001; Reference Shuman and StearnsShuman and others, 2001).
The technique for using infrared data to obtain skin-depthtemperaturemaps of the polar regions has been discussed previously (Reference SteffenSteffen and others, 1993; Reference Stroeve and SteffenStroeve and Steffen, 1998; Reference ComisoComiso, 2000). The key infrared sensor has been the AVHRR because of continuous and long-term coverage. The sensor has five channels, from the visible to thermal infrared, but it is the thermal channelat11 μm that is used to estimate surface temperatures, while the other channels are used for cloud masking and atmospheric correction. Also, clouds are especially difficult to discriminate from snow surfaces in the data, and although a special masking technique has been used (Reference ComisoComiso, 2000) in addition to conventional techniques, some cloud-impacted pixels remain. It is their presence that is thought to cause some of the larger errors in this daily dataset. However, because this problem occurs in different places at different times, the impact on the accuracy of the monthly data, which is a standard climatology product (Reference Genthon and BraunGenthon and Braun, 1995), is not as great because of the averaging period. The AVHRR dataset used for this study is the Global Area Coverage (GAC) dataset that has a resolution of 5 km by 3 km at nadir. The continuous orbital dataset was acquired from the NASA Goddard Space Flight Center AVHRR Pathfinder Project that did much of the original quality control. The data were subsequently mapped to polar stereographic maps similar to that used for passive microwave but at a resolution of 6.25 km.
The passive-microwave data used here were extracted from NSIDC CD-ROMs (NSIDC, 1992). Daily-averaged, 37 GHz, vertical-polarization (V) brightness temperatures (TB) from the SSM/I-F11 for the 25£25 km gridcell covering each AWS site were compiled to document their multi-year temperature trends for each site. The South Pole record examined here cannot be studied by this technique, as it is not covered by passive-microwave data (see Fig. 3). Brightness-temperature data from the 37 GHz V (0.81cm wavelength) channel begin in 1978 and continue through the present day. The TB measurement accuracy of the 37 GHz V channels on this instrument is ±2K for the SSM/I (Reference Hollinger, Pierce and PoeHollinger and others, 1990). The 37 GHz V TB data are calibrated using AWS air temperatures by an emissivity modeling technique (Reference Shuman, Alley, Anandakrishnan and StearnsShuman and others, 1995; Reference Shuman and StearnsShuman and Stearns, 2001) to create the TC time series to be compared to the TA and TIR data.
Results And Discussion
The daily temperature plots (Fig. 2) illustrate the challenge of interpreting temperature data from different datasets in Antarctica for just 1 year. Although each of the temperature records documents the same general annual trend, there are characteristics that need to be understood with each dataset. The Byrd record is 550% complete for TA and contains a several-week period (late May to early June) where TIR appears to be too low. The Clean Air site has a distinct offset between TA and TIR throughout the year, as well as gaps in TIR. The Lettau record has a roughly 3 month gap in TA, and the Siple record has less than one-third of a year of TA data (this AWS ceased operations in 1992). Only the Lynn record is substantially complete for 1992, but this AWS too is no longer operating (see Fig. 1; Table 1). For each site, the TC data are complete (see Reference Shuman and StearnsShuman and Stearns, 2001) but are considerably less variable due to their dependence on emission from the near-surface snow. Incidentally, this analysis is arbitrarily focused on 1992 largely because of the availability of daily TIR data for that particular year (see Reference ComisoComiso, 2000, for details). Unfortunately, this focus on 1992 will limit to some extent the comparisons capable of being conducted from these data. Further work on additional years of data is planned to insure that the conclusions based on 1992 are representative.
The plots in Figure 4 illustrate the overall relationship between the two satellite temperature records and the in situ measurements. Daily differences can be estimated visually from the plots in Figure 2. The satellite measurements necessarily cover a larger region (four ~6×6km pixels for TIR and a 25 £25 km pixel for TC) than that measured by the point source AWS. Therefore, exact correspondence between the datasets is unlikely. In general, the Figure 4 plots show that the TIR data have a strong correlation with TA, as the majority of daily values fall in the ±10K range along the zero-difference line. The same is true of the TC data, but they tend to overestimate temperature at the low end of the data range. All averages discussed here are based on exactly corresponding dates. This means the datasets are as compatible as possible. Table 2 summarizes the daily-temperature difference data.
Fig 4

Difference statistics for all 1992 daily mean temperatures
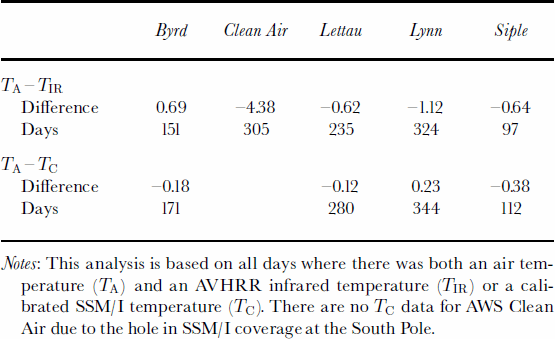
With the exception of the period in late May and early June at Byrd where TIR values are too low (Fig. 4a), infrared temperature estimates track TA closely at all the sites except Clean Air. The TIR values there show a consistent offset, with a mean difference value of >4K (Fig. 4b). The offset is distinctly linear across the temperature range, suggesting that it should be possible to compensate for it in the AVHRR processing algorithm. Preliminary examination of the problem suggests it may be the result of the scan angle needed to retrieve data at this latitude. In general, data from scan angles closer to nadir (±48.5˚ instead of the 55.4˚ needed to cover the South Pole) are used for temperature retrievals (Reference ComisoComiso, 2000). It should be noted that assigning the offset entirely to the infrared data assumes that the AWS data are always accurate, even though some problems with TA are known to occur (Reference Shuman and StearnsShuman and others, 2001). Similarly, the Lynn data (Fig. 4d) also show a small offset from TA that suggests TIR values here are apparently more than 1 K too high. Overall, scatter in these data is likely a result of incomplete cloud masking, and its daily magnitude is suggested by the standard deviation values shown in Fig. 4. Averaging the daily data to derive monthly values diminishes the impact of any individual day’s data (Reference ComisoComiso, 2000).
The TIR values are thought to be too low during late May and early June at Byrd largely because the TC values show a temperature trend similar to but smaller than that of TA values during this period. As noted above, the tendency for TC data to overestimate temperature is illustrated by values plotting above even the upper diagonal lines at Byrd, Lettau and Lynn (the TA – TC difference is negative). The scatter plots shown in Figure 4 also suggest a slight curvature (see Fig. 4c) that can be traced to the technique’s tendency to slightly overestimate emissivity in the spring and fall and slightly underestimate it in the winter and summer (Reference Shuman, Alley, Anandakrishnan and StearnsShuman and others, 1995). The winter period seems to be the most significant at these sites, for reasons which are not well understood but are probably related to the emissivity correction not being the simple sinusoid that is currently required by the technique.
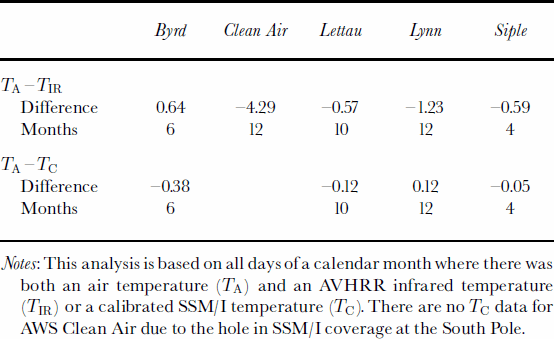
The monthly difference plots (see Fig. 5) show smaller means and standard deviations as discussed above. These plots give confidence that these temperature data can be used in climatological analyses (Reference Genthon and BraunGenthon and Braun, 1995). All differences are within 5K of the zero line if the problematic period at Byrd is discounted and the offset is corrected at Clean Air in the TIR data. The mean values for both TA –TIR and TA – TC are <1Kat all sites if allowance is made for the small TIR offset previously noted at Lynn. The reasons for the offset at Lynn are unclear but may be connected with the relatively steeper topography (in the immediate vicinity of the AWS; see Fig. 1). In other words, the satellite view of the site may cover more variable topography than at the less mountainous AWS sites, and the TIR values may not as accurately match TA as a result. Table 3 summarizes the monthly-temperature-difference data.
Fig 5

Difference statistics for all 1992 monthly mean temperatures
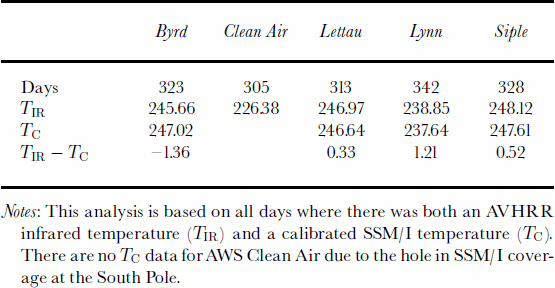
Because of the relatively short TA records available for analysis at several of the AWS sites, annual mean comparisons with TIR and TC were not satisfactory representations of the true annual temperature. Consequently, annual means were calculated and differenced using the more complete TIR and TC values. This provides a more representative value and allows the uncertainty of these independent datasets to be conveniently evaluated (see Table 4). In all cases, the annual difference was 51.5 K. Note that the larger difference values at Byrd and Lynn include a period of problematic data and a distinct offset, respectively. These annual difference values provide a confidence limit on annual average data derived from satellite sources that is compatible with those reported in Reference Shuman and StearnsShuman and Stearns (2001, fig. 10).
Difference statistics for all 1992 TIR and TC daily mean temperatures
Comparative analysis has revealed unique characteristics and unexpected weaknesses of the satellite datasets. The daily infrared data show basically the same variability as the AWS data, but there are times when the differences are large. An examination of the values from individual AVHRR orbits that went into these daily data indicate that there are times when some values are a few standard deviations away from the daily average. This is likely due to imperfections in the cloud-masking technique, but further studies are required, especially through comparative analysis with the TERRA/MODIS (Moderate Resolution Imaging Spectroradiometer) data that may have the right set of channels for accurate cloud masking in the polar regions. The monthly averages, which are the final temperature product as reported by Reference ComisoComiso (2000), show better agreement with corresponding coastal AWS data and may be further improved through the use of an appropriate filtering technique. The daily microwave data show basically the same long-term variability as the other datasets, but do not capture short-term variability as well as the infrared or AWS data. This is likely associated with the microwave data representing an average temperature that is less responsive to short-term fluctuations in atmospheric temperature. Because the snow surface is optically thin at microwave frequencies, the observed temperatures actually represent the average temperature of a layer of snow. And since snow is a good insulator, the short-term fluctuation of this layer may not be identical to that of the surface. However, temporal averages, starting with weekly averages of passive-microwave data, agree very well with both AWS data and infrared data. This makes the passive microwave a very useful dataset for filling in gaps in both infrared and AWS datasets.
Conclusions
The significance of this study is that it enabled an improved understanding of three currently available Antarctic surface temperature datasets. At present, the thermal infrared data provide the only spatially detailed temperature distributions in Antarctica, but contain data gaps due to intermittent cloud cover. The passive-microwave data have the potential to provide spatially detailed, continuous and gap-free temperature distributions. However, more research is needed to correctly calibrate these data for regional changes in the radiative characteristics of the snow cover. The AWS data are the most accurate, but are the most difficult to use for large-scale scientific research because of their limited spatial coverage and gaps in the temporal series due to occasional instrument malfunction. The AWS data, however, provide the means to determine the value and the significance of both the infrared and the passive-microwave datasets.
These different near-surface temperature datasets are quite complementary and should enable the development of improved temperature baselines for sites in Antarctica. Although TA data may be discontinuous, TIR data can accurately fill most gaps at specific sites. Any gaps due to cloud cover in the TIR record can then be filled with extrapolated TC values, and these values also provide a reliability check on the spatially more extensive TIR data. Processing requirements are significant, especially for TIR, however, and detecting and removing cloud impacts and accurately calibrating these data remains a challenge. Overall, this study has demonstrated that the satellite data compare quite well inmost cases, assuming that these AWS TA data reliably represent these locations. The limited comparisons presented here certainly justify continued efforts with additional years of data at these and other sites across the Antarctic continent. Although individual day differences between in situ and satellite temperatures can be quite large, the average errors are relatively small and appear well constrained. For the thermal infrared dataset, the standard products are the monthly averages that appear to provide a realistic representation of temperature distributions around the continent. Some of the discrepancies between the methods studied here are probably due to the differing spatial and temporal resolutions of the three different methods. We also have assumed that the AWS hardware for measuring temperature is always in perfect condition, which is not guaranteed in such an adverse environment, and there may be some instances when the AWS actually provides erroneous results despite quality-control procedures. For optimal accuracy, especially at high temporal resolution, a combination of the three methods may be necessary to determine an accurate climate baseline and then evaluate potential changes that may come in the years ahead.
Acknowledgements
We would like to thank the staff of the Antarctic Automatic Weather Stations Project (http://uwamrc.ssec.wisc.edu/aws/) at the University of Wisconsin and L.V. Stock (CAELUM Research Corp.) for their support. This research was supported by U.S. National Science Foundation grant OPP-9526566 and 9904295 and NASA grants MTPE-00027 and NCC5374.



