


Introduction
As the contemporary climate crisis intensifies, deepening our understanding of the interactions between climate and human social networks is increasingly important (Pisor & Jones Reference Pisor and Jones2021). Environmental archaeologists have, for a long time, already focused on identifying behavioural strategies that enhanced human fitness in hypervariable climates (Dewar & Richard Reference Dewar and Richard2007; Petrie et al. Reference Petrie2017; Davis Reference Davis2020; Douglass & Rasolondrainy Reference Douglass and Rasolondrainy2021). Those regions with long and well-documented records of climatic change, such as Madagascar, provide ideal opportunities to assess the evolving relationships between climate and social network structures (Pisor & Jones Reference Pisor and Jones2021).
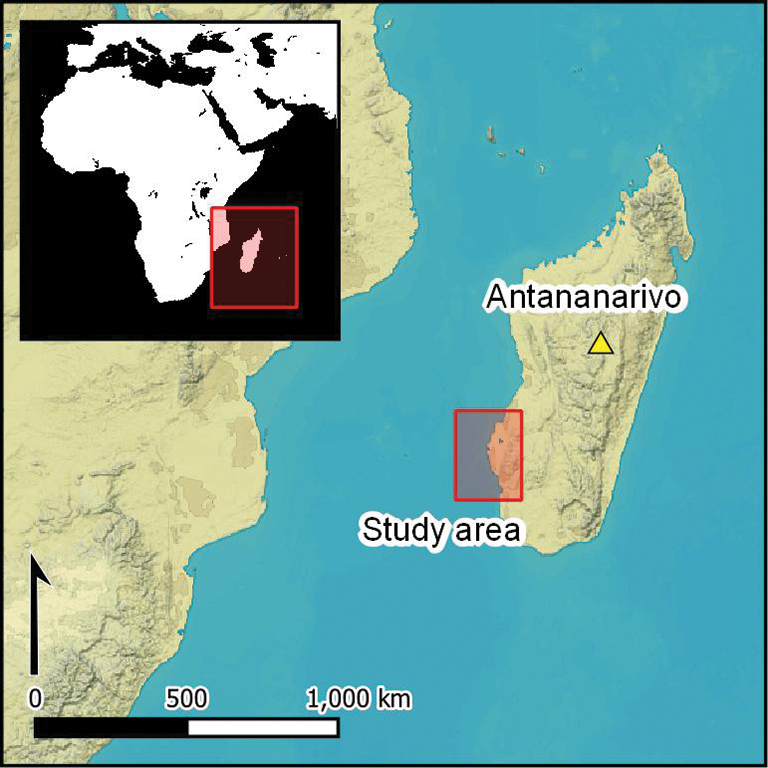
Madagascar sits at the crossroads of multiple historical migration and trade routes in the Indian Ocean (Radimilahy & Crossland Reference Radimilahy and Crossland2015). The island's climate is defined by distinct wet and dry seasons and precipitation generally declines along a gradient from east to west (Dewar & Richard Reference Dewar and Richard2007). The south-west of the island is arid, receiving less than 500mm of rainfall annually (Faina et al. Reference Faina, Burns, Godfrey, Crowley, Scroxton, McGee, Sutherland and Ranivoharimanana2021), and is home to diverse cultures and ecosystems. While the timing of the first human settlement of the island is the subject of intense debate (Mitchell Reference Mitchell2019; Hansford et al. Reference Hansford, Wright, Pérez, Muldoon, Turvey and Godfrey2020), people have lived on the island for at least the past 1500–2000 years (Douglass et al. Reference Douglass, Hixon, Wright, Godfrey, Crowley, Manjakahery, Rasolondrainy, Crossland and Radimilahy2019). Recent research has demonstrated that coastal communities in south-west Madagascar made decisions about where to settle based on a combination of environmental and social factors that sought to maximise community aggregation and safety, while ensuring access to essential resources (Davis et al. Reference Davis2020a, Reference Davis, DiNapoli and Douglass2020b). The form and extent of the social networks needed to support these decisions, and their wider role in the adaptive strategies used to cope with Madagascar's hypervariable climatic and socio-political conditions, however, require more research.
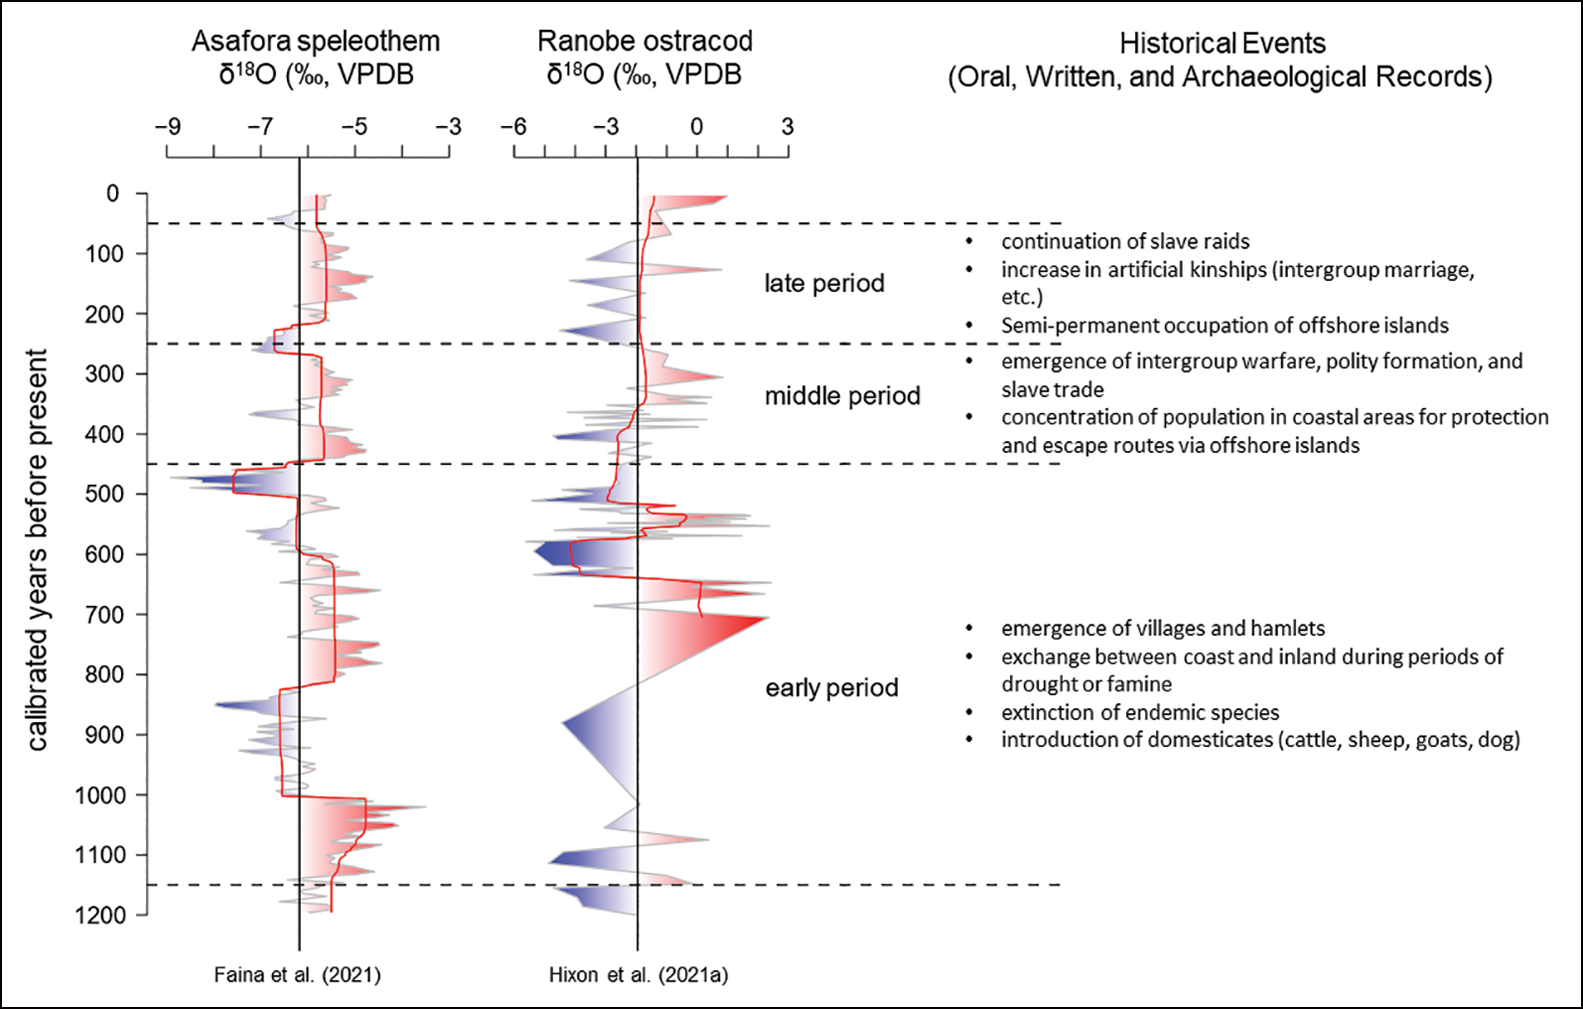
Palaeoclimate proxies from south-west Madagascar, particularly records of speleothem and lacustrine carbonate δ18O, document a highly variable climate and a series of dry intervals over the past millennium (Figure 1). Some of these changes approximately coincided with megafaunal extinction (e.g. Virah-Sawmy et al. Reference Virah-Sawmy, Willis and Gillson2010; Li et al. Reference Li2020, but see Crowley et al. Reference Crowley, Godfrey, Bankoff, Perry, Culleton, Kennett, Sutherland, Samonds and Burney2017), landscape-scale ecological shifts and changes in human land use and subsistence practices intended to cope with such environmental instability (Godfrey et al. Reference Godfrey, Scroxton, Crowley, Burns, Sutherland, Pérez, Faina, McGee and Ranivoharimanana2019; Domic et al. Reference Domic, Hixon, Velez, Ivory, Douglass, Brenner, Curtis, Culleton and Kennett2021; Hixon et al. Reference Hixon, Douglass, Rakotozafy, Clark, Anderson, Haberle and Kennett2021b).
Historical events and precipitation/aridity levels based on δ18O data (grey lines) from the carbonate of a speleothem collected from Asafora Cave (Faina et al. Reference Faina, Burns, Godfrey, Crowley, Scroxton, McGee, Sutherland and Ranivoharimanana2021) and from ostracods (Bradleystrandesia cf. fuscata) collected in laminated lake sediments at Ranobe (Hixon et al. Reference Hixon, Curtis, Brenner, Douglass, Domic, Culleton, Ivory and Kennett2021a). Mean δ18O values are given as vertical black lines, and climate shifts inferred through Bayesian change point analysis (BCPA) are illustrated by red lines. Approximate correspondence with ceramic chronological periods is indicated along with dry (red) and wet (blue) periods. BCPA is not applied to the Ranobe record before 700 cal BP due to the relative scarcity of data.
Ethnohistoric research on communities in south-west Madagascar suggests that people have responded to aridity and changes in resource availability by increasing mobility and by the adoption of a variety of subsistence strategies (Yount et al. Reference Yount, Tsiazonera and Tucker2001; Kelly Reference Kelly2005). Recent archaeological work further suggests that the long-term settlement distribution in this area reflects resource distributions and social ties (Davis et al. Reference Davis, DiNapoli and Douglass2020b).
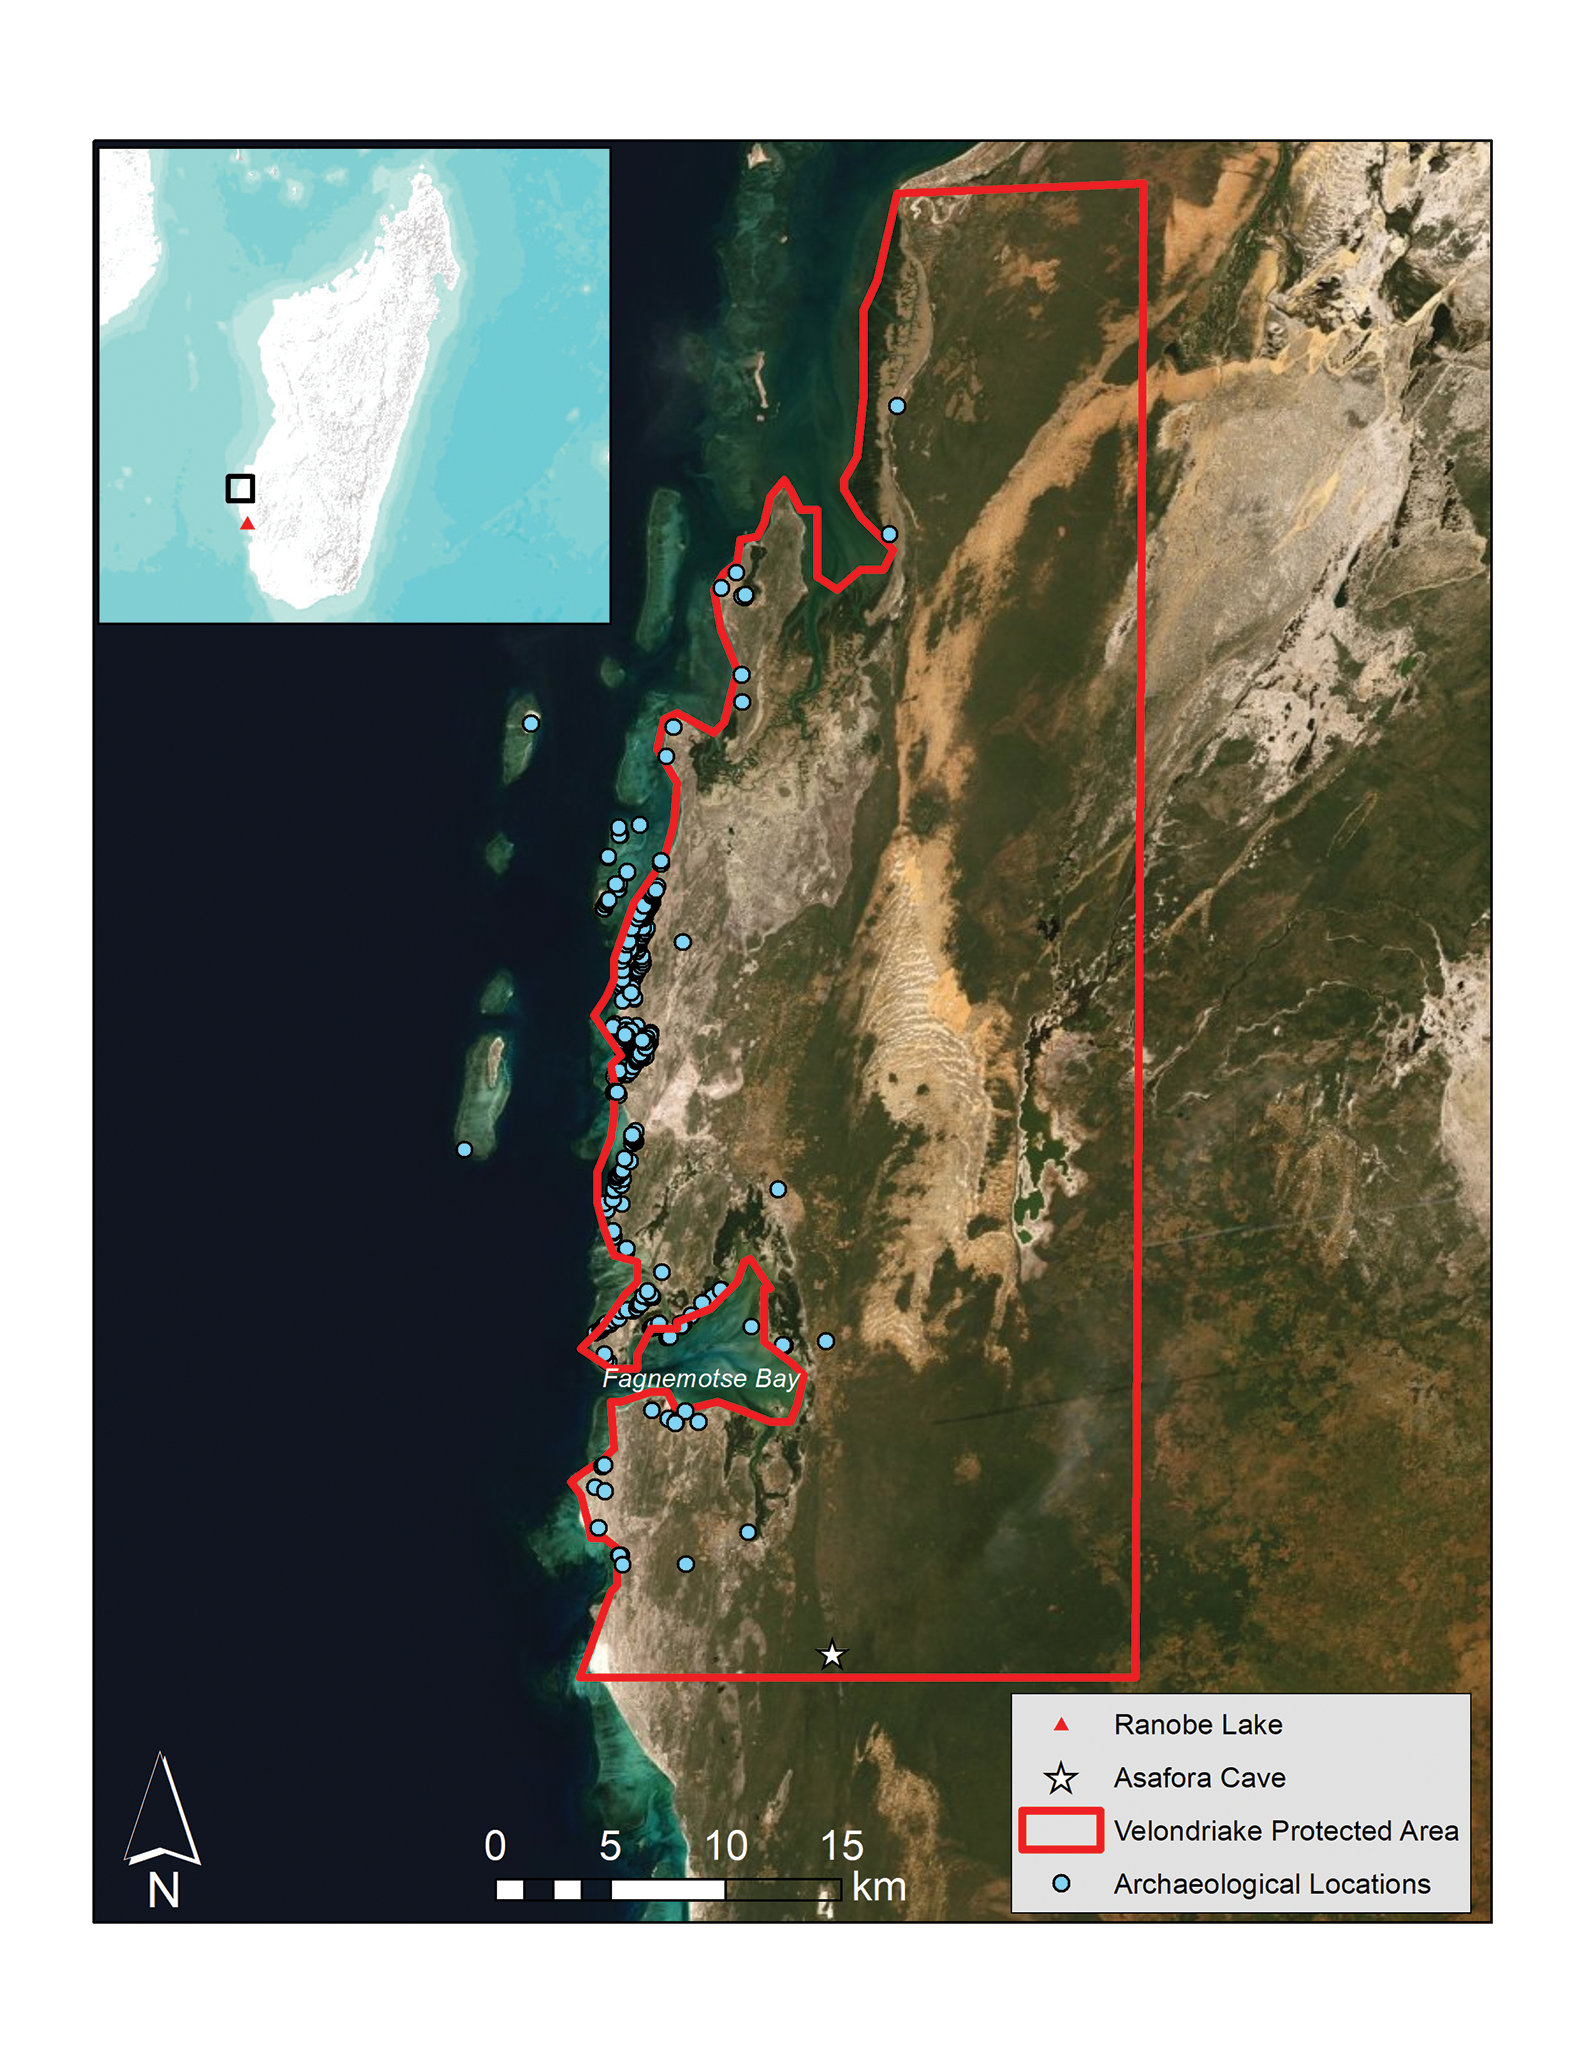
Here, we conduct a social network analysis using a ceramic assemblage consisting of 5221 pottery sherds recovered during archaeological surveys in the Velondriake region of south-west Madagascar; we separate this material into three chronological phases (Figure 2). The results of our analysis are compared with regional palaeoclimate records from Asafora Cave and Ranobe Lake (Faina et al. Reference Faina, Burns, Godfrey, Crowley, Scroxton, McGee, Sutherland and Ranivoharimanana2021; Hixon et al. Reference Hixon, Curtis, Brenner, Douglass, Domic, Culleton, Ivory and Kennett2021a), and oral historical records (Douglass & Rasolondrainy Reference Douglass and Rasolondrainy2021), to provide additional context (Figure 1). Our goal is to explore changes in the relationship between social network organisation and the socio-political and climatological shifts in this region over the past millennium.
Map of the study region, showing locations where archaeological ceramics and palaeoclimate data were recovered.
We address two main research topics. First, we seek to assess community connectivity and the geographical extent of social networks through time, as reflected in the spatial distribution of decorative characteristics in ceramic assemblages. We assume that widespread ceramic stylistic similarities (e.g. decorative attributes) that persisted over time were generated by extensive social connections (Parker Pearson Reference Parker Pearson2010). Such ceramic networks likely also reflect networks of food exchange, labour sharing and seasonal migration, all of which are historically well documented (e.g. Deschamps Reference Deschamps1959; Koechlin Reference Koechlin1975).
Second, we consider whether changes in network structures coincide with phases of notable climate change or socio-political events. We expect that alternating dry and wet intervals throughout the past millennium incentivised community mobility as people reinforced, expanded and relied upon their social connections to cope with environmental challenges, and, in the process, generated well-integrated and extensive networks of shared pottery styles. In contrast, the persistent dry conditions during the Middle and Late Periods (450–250 BP and 250–50 BP, respectively) are expected to favour spatial shifts in social/ceramic networks as inland communities moved to exploit coastal areas with relatively abundant resources less directly influenced by changes in precipitation (Douglass & Rasolondrainy Reference Douglass and Rasolondrainy2021). During the Middle Period, we also expect that socio-political instability (e.g. slave raids, violent conflict) further constrained the geographical extent of social networks as groups adopted defensive strategies and turned inward for security and to access resources (Parker Pearson Reference Parker Pearson2010; Jazwa et al. Reference Jazwa, Kennett, Winterhalder and Joslin2017). Such instability (particularly that caused by eighteenth- and nineteenth-century slavery) could have also constrained social interactions, and therefore the movement of pottery, during the Late Period despite increasingly extensive political integration (e.g. the expansion of the Sakalava Empire) that may have facilitated population movement.
Sociality and resilience in the face of external pressures
Complex systems theory (CST) seeks to explain dynamic interactions, operating at multiple scales, between people, communities and environmental/climatic events (Preiser et al. Reference Preiser, Biggs, Vos and Folke2018). Using CST, researchers have evaluated multifaceted and interwoven relationships across diverse human and environmental systems (e.g. d'Alpoim Guedes et al. Reference d'Alpoim Guedes, Crabtree, Bocinsky and Kohler2016; Penny et al. Reference Penny, Zachreson, Fletcher, Lau, Lizier, Fischer, Evans, Pottier and Prokopenko2018). Network studies provide one way to investigate complex systems dynamics pertaining to social connectivity and resilience (Janssen et al. Reference Janssen, Bodin, Anderies, Elmqvist, Ernstson, McAllister, Olsson and Ryan2006). For example, using network analysis, Baggio et al. (Reference Baggio, BurnSilver, Arenas, Magdanz, Kofinas and De Domenico2016) found that community resilience in the face of environmental stress was most closely related to cultural ties and especially the key households within those cultural networks, rather than, as the authors had expected, to a decline in natural resources. A network approach is particularly useful for archaeology because it defines the structure of social systems and their interactions with external forces and provides a semantically consistent method for describing interactions (i.e. nodes and links; see Janssen et al. Reference Janssen, Bodin, Anderies, Elmqvist, Ernstson, McAllister, Olsson and Ryan2006).
Stress caused by external pressures (e.g. environmental change) can have diverse effects on social networks, which might come to rely on ‘weak ties’ between communities or undergo contraction and transformation to rely on very close ties between a select few parties (Granovetter Reference Granovetter1973; Romero et al. Reference Romero, Uzzi and Kleinberg2019). Such different levels of connectivity come with their own advantages and drawbacks, however, and the exact adaptive responses of a network will vary based on its specific context (Janssen et al. Reference Janssen, Bodin, Anderies, Elmqvist, Ernstson, McAllister, Olsson and Ryan2006). For instance, densely clustered networks often form as a risk-mitigation strategy (Pisor & Jones Reference Pisor and Jones2021) but can also result in an ‘overconnected’ system that is prone to collapse from changes at varying scales (Redman & Kinzig Reference Redman and Kinzig2003; see also Mills et al. Reference Mills2013). On Rapa Nui, for example, despite a paucity of land and natural resources, communities thrived by adopting a nested social structure that relied on different scales of interaction (Lipo et al. Reference Lipo, DiNapoli, Madsen and Hunt2021).
Centrality, or the structural importance of a given node within a broader network, is another useful measure of network connectivity. Networks with high centrality benefit from greater control but are also disadvantaged as this centralisation can create hierarchical concentrations of power. Furthermore, node removal from the network can destabilise the entire system (Janssen et al. Reference Janssen, Bodin, Anderies, Elmqvist, Ernstson, McAllister, Olsson and Ryan2006). Indeed, there are many instances of societies consciously preventing highly centralised network organisation in favour of less-hierarchical social structures (Graeber & Wengrow Reference Graeber and Wengrow2021). In contrast, low connectivity makes a network more robust in the face of node removal and prevents hierarchical power centralisation but comes at the cost of decreased control over connections. This can make problem solving more difficult as there may be less control or accountability over decision making (Janssen et al. Reference Janssen, Bodin, Anderies, Elmqvist, Ernstson, McAllister, Olsson and Ryan2006).
Past social networks in south-west Madagascar
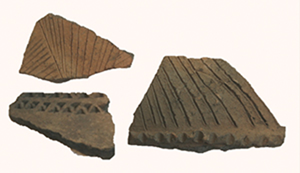
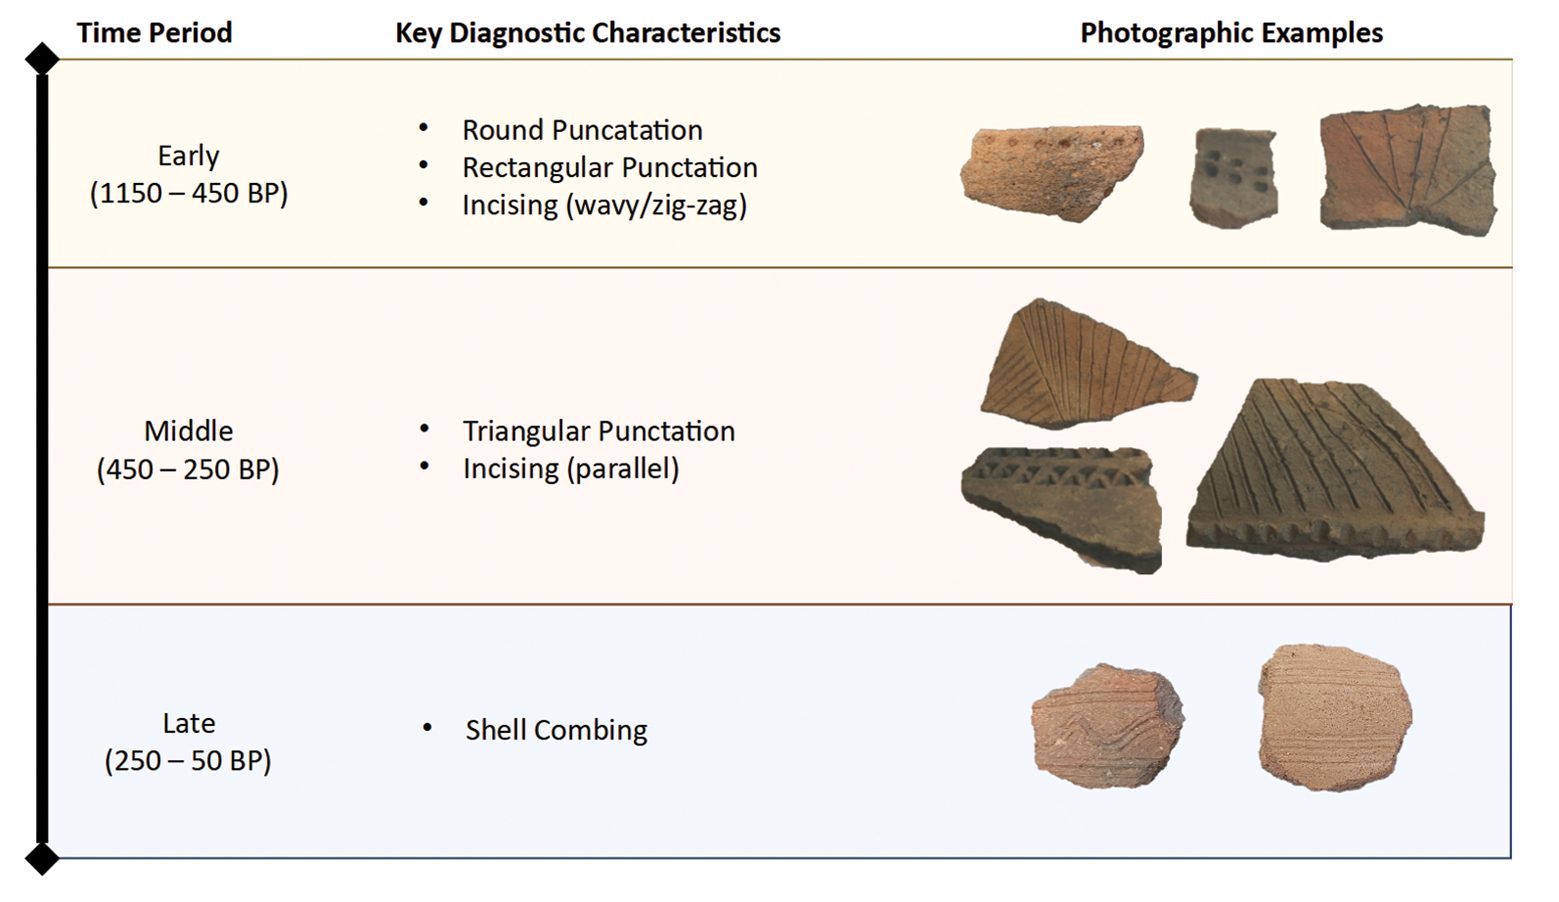
Inferring past social interactions from archaeological remains can be challenging. Ceramics are widely used, however, as an invaluable source of evidence for social connections and cultural exchange between communities across time and space (e.g. Braun Reference Braun, Moore and Keene1983; David et al. Reference David, Sterner and Gavua1988; Skibo et al. Reference Skibo, Schiffer and Kowalski1989; Rice Reference Rice2015). On Madagascar, distinct ceramic decorative styles have been linked to diverse cultural groups across the island (Dewar & Wright Reference Dewar and Wright1993), and a history of global interaction with Madagascar is recorded in the exchange of goods such as ceramics and beads (e.g. Beaujard Reference Beaujard2007). Oral histories and archaeological studies suggest that ceramic styles indicate cultural affiliation and can be used to trace the trade and exchange of pottery between regions (e.g. Vérin 1971). More generally, the presence of goods such as imported ceramics and glass beads attests to the island's role in global exchange networks. Work conducted by Douglass (Reference Douglass2016) established a relative chronology for the ceramics of south-west Madagascar based on decorations corresponding to dated archaeological contexts (Figure 3). Some decorative techniques (e.g. burnishing) were commonly used during all periods, while others (e.g. incising, combing, punctation) varied through time (Douglass Reference Douglass2016). Knowledge of these trends in ceramic decoration techniques can, in turn, help archaeologists identify and understand social connections and their organisation over time.
Ceramic characteristics and their relative chronology. The Early Period extends from 1150 to 450 BP, with most sherds dating between 950 and 450 BP (photography by D. Davis).
Materials and methods
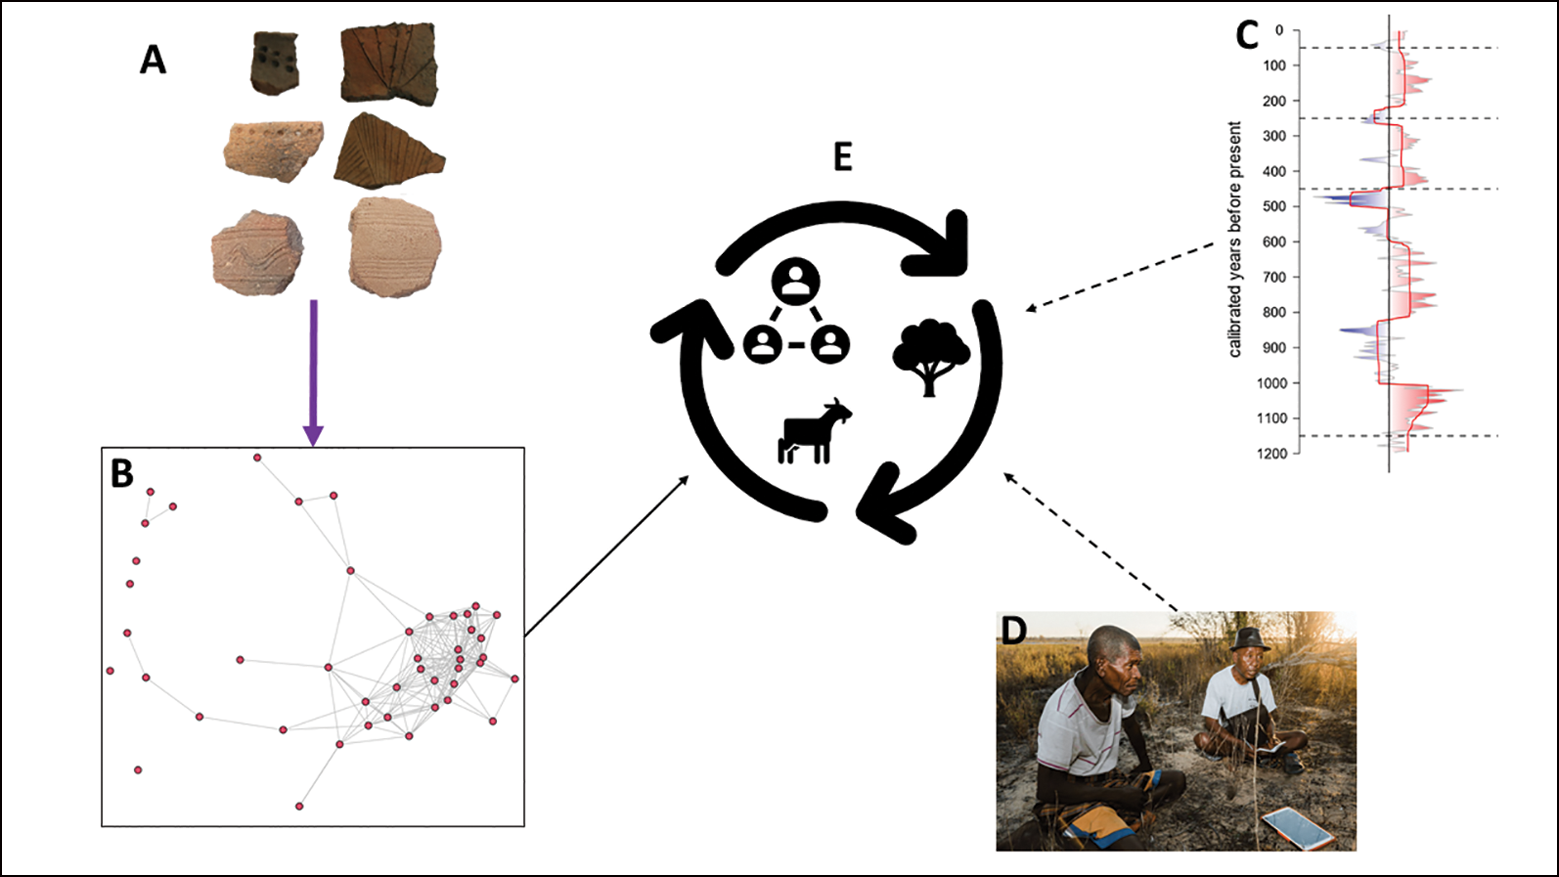
We assess human responses to socio-political and climatic events by combining archaeological, palaeoclimate and ethnohistorical records using network analysis methods (Figure 4). Archaeological ceramics were recovered during surface surveys in Velondriake between 2017 and 2020. Descriptive attributes pertaining to decorative treatment were recorded for each sherd: burnishing, shell-combing, incising and rectangular, triangular and square punctation. Next, using R, we calculated the frequencies of ceramic attributes (‘edges’) at each survey location (‘nodes’; R Core Team 2020), grouping material using the relative chronologies developed by Douglass (Reference Douglass2016) for Velondriake ceramics (Figure 3). Using these data, we then conducted various network analyses in R following a protocol developed by Peeples (Reference Peeples2017; R Core Team 2020).
Outline of methods. Archaeological (A) evidence is used as a baseline for conducting network analyses (B), with input from palaeoclimatic (C) and ethnohistoric (D) sources to generate predictions and outputs about human responses to socio-political and climatic change through time (E). Palaeoclimatic and ethnohistoric data are consulted for interpretative context in our network analysis (dashed arrows) but are not directly integrated into the method, unlike archaeological data (solid purple arrow). All data contribute equally to providing insight to the overarching question of socio-environmental dynamics (photography by D. Davis and K. Douglass).
We assess three network types including co-presence, Brainerd-Robinson (BR) similarity and chi-square (χ2) distance (see the online supplementary materials (OSM)). Co-presence establishes connections based on the presence of particular categories of data at multiple sites (Brughmans Reference Brughmans2010). Brainerd-Robinson calculates similarity between nodes as a proportion of the representation of the total number of data categories. Chi-square distance calculates similarities by inversely weighting a data category's frequency, thereby assigning greater influence to rarer categories (Dodge Reference Dodge2008). As most ceramic material from Madagascar is of similar appearance (i.e. undecorated, with the same surface treatments), prioritising rarity can be a better indicator of interactions than the presence of widely distributed ceramic types. Our χ2 distance networks are defined using the 0.8 quantile, meaning ties are established between nodes that exhibit equal to or greater than 80 per cent similarity.
Incomplete datasets caused by depositional, taphonomic or recovery processes can pose a challenge for network analysis (Brughmans Reference Brughmans2013; Östborn & Gerding Reference Östborn and Gerding2014), so we used a sensitivity analysis to assess each network for its resilience to missing data using 1000 bootstrap simulations. Burial is unlikely to conceal Early Period (1150–450 BP) ceramics disproportionately because archaeological and palaeontological deposits in Velondriake are primarily found on deflated sand surfaces that span hundreds to thousands of years (Clarke et al. Reference Clarke, Miller, Fogel, Chivas and Murray-Wallace2006). Following Mills et al. (Reference Mills2013), we then calculated centralisation measurements (degree, eigenvector and betweenness) using our binarised networks and resampled our datasets. Centralisation reflects the degree of centrality of all nodes within a network and provides an indication of the overall strength of centrality in a network (Freeman Reference Freeman1978; Peeples & Roberts Reference Peeples and Roberts2013). Additionally, we subsampled the data into 10 per cent intervals and calculated the rank-order correlation (Spearman's ρ) of the overall sample and each sub-sample (Costenbader & Valente Reference Costenbader and Valente2003) to evaluate the errors in the dataset that may arise from sampling issues (see OSM). Finally, to assess changes in network expansion across time and space, we calculated the maximum distance between nodes (i.e. sites), using ArcGIS (to assess geographical distance (i.e. square-kilometres) from the furthest two nodes within the main ceramic network) and in R using the igraph package (Csardi & Nepusz Reference Csardi and Nepusz2006) to calculate geodesic distance (i.e a non-spatial distance of how close the relationship between two nodes are within a network graph).
Palaeoclimate assessment using Bayesian Change Point Analysis
To interpret the potential relationships between social networks and external pressures, we compared the results of our network analysis with palaeoclimate datasets (Faina et al. Reference Faina, Burns, Godfrey, Crowley, Scroxton, McGee, Sutherland and Ranivoharimanana2021; Hixon et al. Reference Hixon, Curtis, Brenner, Douglass, Domic, Culleton, Ivory and Kennett2021a; Figure 1) and oral history data collected by two of this article's authors between 2017 and 2018 as part of the Morombe Archaeological Project team led by Roger Samba. In tropical zones, surface water δ18O values are sensitive to the ratio of evaporation to precipitation (with a high ratio leaving surface water enriched in 18O), and these values influence the δ18O values of carbonates that are preserved over extended time scales (Lachniet Reference Lachniet2009). The Asafora speleothem δ18O record comes from the south-eastern part of Velondriake and documents relative changes in moisture availability with sub-decadal temporal resolution. The Ranobe ostracod δ18O record comes from approximately 90km south of Asafora Cave and also documents significant changes in the ratio of evaporation to precipitation in the study region (Hixon et al. Reference Hixon, Curtis, Brenner, Douglass, Domic, Culleton, Ivory and Kennett2021a). We use Bayesian Change Point Analysis (Erdman & Emerson Reference Erdman and Emerson2008) to facilitate broad comparisons between shifts in social network configurations and climate (see OSM).
Results
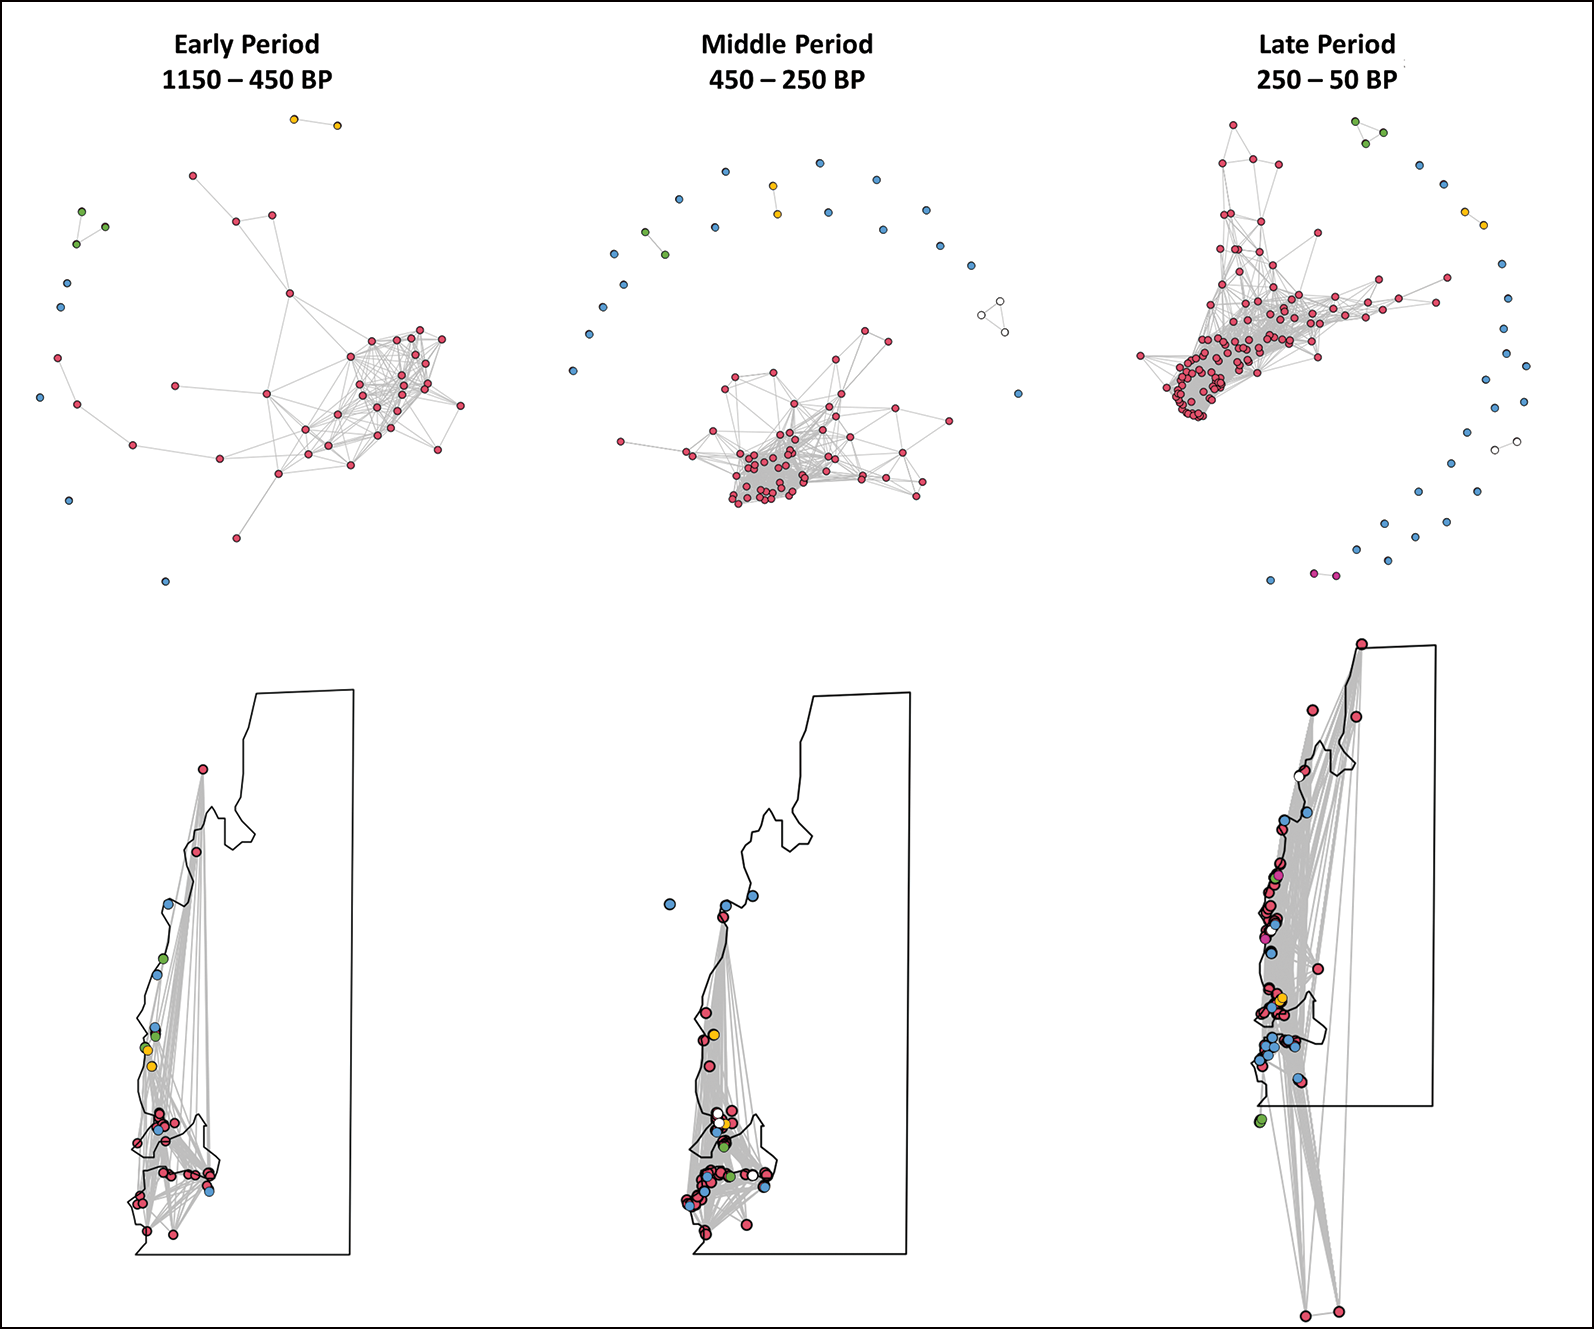
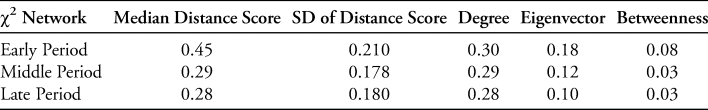
Sensitivity analyses (i.e. bootstrapping, also see OSM) show that the χ2 distance index is least prone to sampling bias. When interpreting χ2 networks, distance refers to the level of connectivity between two nodes, with lower distances having higher connectivity. Our χ2 networks reveal extensive connections between archaeological sites in the Velondriake area that shift over time. During the Middle Period, these networks shift southward and offshore, and then, during the Late Period, shift further southward as well as northward (Figure 5). Stylistic attributes of ceramics exhibit multiple connections between large numbers of archaeological sites, as well as several smaller networks of interaction between smaller numbers of sites (Figure 5). The highest χ2 distances (lowest similarity) are found among those sites with the greatest number and variability in ceramics, while lowest values (highest similarity) are found among sites with less variability in their ceramic assemblages (Table 1).
Chi-square distance network of ceramic attributes over time. Blue circles represent unconnected sites. All other colours (red, yellow, white, pink) represent sites that are connected.
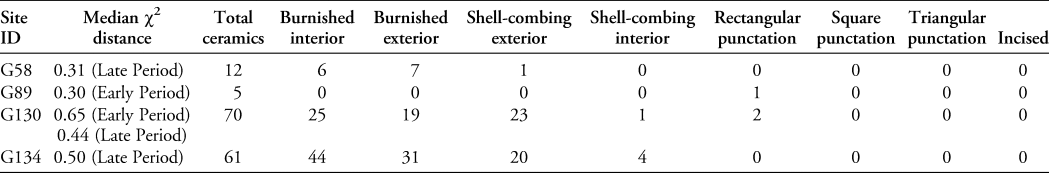
Chi-square distance scores and associated ceramic assemblages among select sites surveyed in 2019. Higher scores are associated with greater assemblage diversity.
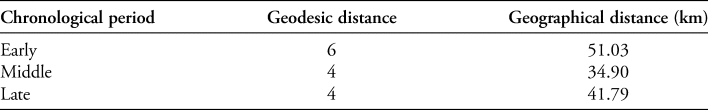
Stylistic elements such as burnishing are widespread throughout most sites in this area, but incising and triangular punctations are rare despite being present both in the north and south of the study region. We also find evidence of community mobility and spatial changes in social networks when analysing centralisation measurements of different archaeological sites (Table 2). Degree centralisation and eigenvector values—quantifying the numbers of connections and relative importance of specific nodes in a network, respectively—decrease during the Middle Period and further decrease during the Late Period. Finally, distances between sites decreased from the Early to Middle Periods and expanded slightly during the Late Period (Table 3).
Centralisation metrics for decorative networks. SD: standard deviation.
Network distance calculations. Geodesic distance calculates the shortest path between nodes in a network. Geographical distance calculates the furthest distance between two nodes in a network.
Discussion
We find evidence of spatially extensive, densely clustered and dynamic social networks in the study area over the past 1200 years. We observe spatial contractions of networks (Table 3) around resource-rich areas and defendable locations during periods of climate and socio-political instability, which is consistent with our expectations and prior research (Davis et al. Reference Davis, DiNapoli and Douglass2020b). Trends in average χ2 distance scores between locations suggest that community organisation is consistent with a core-periphery model, which helped to reduce risk by balancing redundancy and diversity in social structure (Gondal & McLean Reference Gondal and McLean2013). Ethnographically, communities in this area demonstrate a mix of strong and weak social relationships that give flexibility when coping with hypervariable climate (Douglass & Rasolondrainy Reference Douglass and Rasolondrainy2021).
Locations with higher χ2 distance scores appear to have higher ceramic abundance and variability than sites with lower scores, suggesting that these sites maintained weaker relationships with their neighbours than sites with lower distances. For example, site G130, located in the central part of the study region, attains lower χ2 distances over time (Table 1) and moves from a smaller sub-network in the Early Period to part of the primary ceramic network in the Late Period. We find that the strongest connectivity between sites occurs between locations surrounding Fagnemotse Bay, which may reflect stable food sources and/or the higher defensive potential of this area (Figure 2). It is also possible that connectivity varied with site function, with some sites acting as temporary settlements or areas of exchange, rather than long-term occupation foci. Geographical shifts in social connections may indicate mobility among communities through time, which is a historically well-established socio-economic strategy in Velondriake (e.g. Deschamps Reference Deschamps1959; Koechlin Reference Koechlin1975). We know from previous archaeological investigations in this area that settlement and mobility patterns are driven by resource availability and social aggregation (Davis et al. Reference Davis2020a). Over the last millennium, there appears to be a series of contractions and expansions of social networks (Figure 5), which we summarise below relative to different socio-environmental and socio-political contexts.
Early Period Network (1150–450 BP)
The earliest ceramic network is characterised by centuries with little change in precipitation, separated by short intervals of potentially large shifts in rainfall, representing both the wettest and driest intervals of the last millennium (Figure 1). During this time period, social networks extended along most of the Velondriake coastline and included the offshore island of Nosy Ve (Table 3; Figure 5). Apart from this main network, there appears to have been a subset of the population that participated in a separate social network, defined by connections between several sites that were disconnected from the main network (Figure 5).
Archaeological research suggests that villages and hamlets started to emerge in the south-west of Madagascar during this period (Douglass Reference Douglass2016). Ceramic sherds of Early Period date recovered during survey in the Velondriake area resemble an inland assemblage dating to between 600 and 800 BP from the site of Asambalahy in the Mangoky River valley (Vérin Reference Vérin1971). Though relating to later periods, oral history sources record a long tradition of people in the Velondriake area exchanging marine goods for agricultural products and pottery vessels from the middle valley of the Mangoky River during lean seasons or droughts. Because the climate and environment were relatively stable during the Early Period, the exchange of ceramics was most likely related to other social information networks such as food exchange (Fitzhugh et al. Reference Fitzhugh, Phillips, Gjesfjeld, Whallon, Lovis and Hitchcock2011). When climate stresses started to affect livelihoods in the Velondriake area during the last four centuries of the Early Period, but socio-political security remained stable, communities could likely continue to rely on existing trade or barter with other regions in order to alleviate the impacts of climate change. Therefore, communities did not need direct access to all necessary resources but could obtain them through trade and kinship relationships with other communities. The geographical extent of social connections is at its greatest during this period (Table 3).
Middle Period Network (450–250 BP)
In the Middle Period, fluctuations in climate conditions appear more temporally concentrated, with multiple shifts within the 200-year period. These climate shifts include a pronounced period of drought identified in other proxies c. 400 BP (Razanatsoa Reference Razanatsoa2019). These dry conditions could have contributed to the overall contraction in the spatial distribution of settlements that we see in the results of our network analysis (Table 3; Figure 5). The number of nodes disconnected from the bay area increases from 10 to 23, and a third sub-network consisting of two node connections is established, perhaps resulting from a breakdown of the larger social network. Of the 121 oral historians in the Velondriake region, 102 recount an increase in aridification and in the unpredictability of rainfall over the past 100–150 years. According to the historians, this unpredictability of rainfall pushed herders and agriculturists to abandon inland activities and adopt marine subsistence strategies along the Velondriake coast. As they were still new to a maritime subsistence, migrants to the coast described a preference for exploiting near-shore resources (e.g. gathering shellfish, gleaning octopuses and net-fishing in the near-shore (tarikaky); Douglass & Rasolondrainy Reference Douglass and Rasolondrainy2021). Places such as Fagnemotse Bay would have been ideal for exploiting near-shore resources, potentially explaining the concentration of nodes around the bay during periods of stress. All 35 oral historians living in villages around this bay confirmed that their ancestors used to be farmers, herders and foragers but converted to maritime fishing to exploit the bay's resources. As such, Middle Period networks likely saw the exchange of both social and environmental information, to compensate for the reduced predictability of climate and socio-political organisation (e.g. Fitzhugh et al. Reference Fitzhugh, Phillips, Gjesfjeld, Whallon, Lovis and Hitchcock2011).
This period also saw the emergence of intergroup warfare, polity formation and the slave trade in south-west Madagascar (Grandidier & Grandidier Reference Grandidier and Grandidier1903, Reference Grandidier and Grandidier1904). Of the 121 oral historians, 58 mentioned slave raiders and cattle raiders attacking their former villages. Most of these attacks happened inland rather than along the coast. The concentration of populations along the Velondriake coast may therefore indicate increased socio-political stability resulting from the emergence of Sakalava polities from further inland which were more interested in cattle raids and grabbing pastureland and farmland rather than venturing to the coast to attack fishing villages (Lombard Reference Lombard1988). Oral historians also reported that slave raids conducted along the Velondriake coast mostly failed because coastal fishing communities avoided confrontations by moving to offshore islands that the inland slave raiders could not access.
Late Period Network (250–50 BP)
In the most recent period, climate conditions appear more stable and consistently drier than previous centuries (Figure 1). These conditions coincide with expanded social networks, extending both north and south along the coast, including beyond the Velondriake region (Table 3; Figure 5). The number of nodes disconnected from the Fagnemotse Bay network increases from 23 to 29. The re-establishment of spatially extensive network connections, including settlements on offshore islands, suggests increased socio-political security, and possibly also demographic increase due to the arrival of new groups seeking refuge.
During this period, the number and size of archaeologically attested habitation sites increases (Douglass Reference Douglass2016), while oral history records recount an increase in artificial kinships (such as intergroup marriage, ziva and blood brotherhood) between locals and newcomers. Meanwhile, both historical documents (Grandidier & Grandidier Reference Grandidier and Grandidier1906, Reference Grandidier and Grandidier1907) and oral accounts provide evidence of ongoing raids and slave trading during this period. Groups in Velondriake often avoided these threats by temporarily moving to offshore islands; during this later period, however, the nature of archaeological sites documented on these offshore islands suggests (semi-)permanent habitation which may be the result of colonialism and other political instability. The establishment of the Sakalava Empire may have brought some level of socio-political stability to the Velondriake region at this time. Regardless, the expansion of social networks may be a response to the continuation of socio-political violence, including French colonisation, coupled with climate-induced resource scarcity. Higher levels of connectivity through natural and artificial kinship ensured access to resources, especially in the face of climate unpredictability (Douglass & Rasolondrainy Reference Douglass and Rasolondrainy2021).
Conclusion
Using network and statistical methods, we have analysed pottery collected from archaeological sites in the Velondriake region alongside oral histories to assess the interactions between socio-political organisation and changing climate over the past 1200 years. Our results demonstrate that communities maintained widespread social networks, which have expanded and contracted over time. We have found that the shifts in network structure and spatial extent coincide with changes in climate conditions and socio-political instability, suggesting that these factors influenced social connectivity. In light of these results, we offer two hypotheses: first, shifts in climate conditions impacted food procurement, leading to migrations of communities to a centralised location that was more resilient to such changes; and, second, periods of socio-political unrest (e.g. slave raids, community conflict, war and conquest) resulted in community dispersal across a broader geographical area, including offshore islands, and a reorganisation of social networks (see Yount et al. Reference Yount, Tsiazonera and Tucker2001). By establishing comprehensive chronologies for the sites explored in this study, and by generating highly resolved climate and environmental reconstructions for this region, we will be able to assess these hypotheses and, especially, the causality between variables.
More broadly, this study demonstrates how pairing archaeological network models with ethnohistorical and palaeoclimate data can provide insights into past socio-ecological relationships. Such methods can identify relevant patterns in human behavioural strategies, including risk mitigation for external pressures such as climate change, resource availability and political violence. This research, therefore, holds important implications for the current efforts of archaeologists to contribute to the resolution of contemporary challenges including climate-change risk, sustainability and resilience.
Acknowledgements
We thank the local community leaders in the Velondriake area who permitted us to conduct fieldwork on their lands. All code and data needed to replicate our analyses are provided as supplementary files (see below) and at https://github.com/d-davis/mada_ceramic.
Funding
This work was supported by the National Science Foundation (BCS-2039927, SMA-2203789), Sigma Xi, NASA Pennsylvania Space Grant Consortium, American Philosophical Society, Explorers Club and Penn State's College of Liberal Arts.
Supplementary material
To view supplementary material for this article, please visit https://doi.org/10.15184/aqy.2023.123.


 Open access