


1. Introduction
Granular flows are found in geophysical mass flows such as landslides, debris or pyroclastic flows, or in processes related to the pharmaceutical, food or construction industries. These flows can be subaerial or occur within a fluid (e.g. water), where grain–fluid interactions influence their behaviour. Courrech du Pont et al. (Reference Courrech du Pont, Gondret, Perrin and Rabaud2003) classified granular flows into three flow regimes that depend on the dimensionless numbers  $St = (\rho _{s}\,\Delta \rho \,g d^3)^{1/2}/(18 \mu _{f} \sqrt {2})$ and $\chi =\sqrt {\rho _{s} / \rho _{f}}$, where $d$ is the grain diameter, $g$ is the gravitational acceleration, $\mu _{f}$ is the fluid dynamic viscosity, and $\Delta \rho = \rho _{s} - \rho _{f}$ is the difference between the grain density $\rho _{s}$ and fluid density $\rho _{f}$. The three flow regimes are: the free-fall regime, where ambient drag is negligible ( $St \gtrsim 10$ and $\chi \gtrsim 4$); the inertial regime, where grain–fluid interactions depend on the fluid inertia ( $St / \chi \gtrsim 2.5$ and $\chi \lesssim 4$); and the viscous regime, where grains are limited by the Stokes velocity ( $St/\chi \lesssim 2.5$ and $St \lesssim 10$). In immersed granular flows, the packing fraction $\phi =V_{s}/V$, quantified as the ratio between the volume $V_{s}$ of solids and a reference volume $V$ (which could be a total or a local volume), is a feature of major importance because the magnitude of the drag force depends on it (Di Felice Reference Di Felice1994). Granular flows are commonly studied with a monodisperse distribution of grains. However, the variety of grain sizes found in nature and industrial applications, known as polydispersity, is an important characteristic (Prada-Sarmiento et al. Reference Prada-Sarmiento, Cabrera, Camacho, Estrada and Ramos-Cañón2019). Increasing the polydispersity level results in an increase of $\phi$ (Nguyen et al. Reference Nguyen, Azéma, Radjai and Sornay2014; Oquendo-Patiño & Estrada Reference Oquendo-Patiño and Estrada2022), leading to denser systems and consequently to flows with stronger grain–fluid interactions (Sufian et al. Reference Sufian, Knight, O'Sullivan, van Wachem and Dini2019).
The shear strength of a fluid-saturated granular deposit is controlled by the effective normal stresses  $\sigma '$ sustained by the grains. This effective stress is the difference between the total stress acting on the granular system and the pore fluid pressure $P$. A sudden increase of $P$, meaning a decrease of $\sigma '$, can trigger a local instability, with the potential of transforming it into an avalanche. Positive $\Delta P$ changes in the pore pressure could follow, among other things, the infiltration of rainwater or changes in the granular packing. For instance, contractions in a granular system produce an excess of pore pressure, or a positive $\Delta P$, expelling fluid from the granular structure, weakening the deposit, and enhancing a collective flow. In contrast, stabilisation is expected to be controlled by dilatancy and the reduction of pore pressure, equivalent to a negative $\Delta P$ (Iverson Reference Iverson1997, Reference Iverson2005). Rondon, Pouliquen & Aussillous (Reference Rondon, Pouliquen and Aussillous2011) showed that contraction and dilatancy in loose and dense granular systems, respectively, influence the initiation of granular flows. In loose systems, contractions produce a temporary increase of the pore pressure that results in fast flows. By contrast, dense granular systems need to dilate, inducing a temporal negative pore pressure change that increases the effective stress and delays the flow. A stable flow is then reached when the changes in the pore pressure stabilise, $\Delta P \simeq 0$, having grains that move in constant friction with the base. Contrariwise, excess pore pressure results in a fluidised flow without shear strength where grains may collide with the base but remain suspended (Ilstad et al. Reference Ilstad, Marr, Elverhøi and Harbitz2004). Moreover, the excess pore pressure has been identified as the driving mechanism behind long runout distances in submarine debris flows (Gee et al. Reference Gee, Masson, Watts and Allen1999).
A benchmark experiment for studying granular flows is the collapse of a granular column. In this configuration, a pile of grains with initial length  $L_0$ and height $H_0$, having aspect ratio $A = L_0 / H_0$, is allowed to collapse by self-weight over a horizontal plane. In this experiment, the column collapse initiates with an acceleration stage, followed by a stage of lateral spreading with nearly constant velocity $U$, until the flow decelerates and stops. When the collapse comes to a halt, a final deposit with maximum height $H_{f}$ and runout $L_{f}$ describes the final geometry (Staron & Hinch Reference Staron and Hinch2005; Meruane, Tamburrino & Roche Reference Meruane, Tamburrino and Roche2010; Bougouin, Lacaze & Bonometti Reference Bougouin, Lacaze and Bonometti2017). The mobility of granular columns, also understood as the flow runout distance $L_{f}$, or its normalised form $L^* = (L_{f} - L_0)/L_0$, is a major characteristic that represents the frictional strength on a macro scale (Staron & Hinch Reference Staron and Hinch2007). Studies have shown that $L^*$ increases and scales with $A$ for different flow regimes, distinguishing between short and tall columns (Balmforth & Kerswell Reference Balmforth and Kerswell2005; Roche et al. Reference Roche, Attali, Mangeney and Lucas2011; Warnett et al. Reference Warnett, Denissenko, Thomas, Kiraci and Williams2014; Pinzon & Cabrera Reference Pinzon and Cabrera2019). This distinction arises from the collapse sequence. While short columns slide laterally from the collapse initiation, tall columns (i.e. for $A \gtrsim 2$) show dominant free-fall before spreading horizontally. In immersed columns belonging to the viscous regime, the relative increase in the initial packing fraction $\phi _0$ of monodisperse columns plays an important role in the flow behaviour, influencing the collapse initiation and mobility. Dense columns ( $\phi _0 \gtrsim 0.60$) are delayed due to the flow of fluid into the granular structure during dilation. This process produces a negative change in the pore pressure that temporarily increases the column strength, and as a result of this, dense columns have a slower collapse process and have shorter mobility than loose ones (Rondon et al. Reference Rondon, Pouliquen and Aussillous2011; Wang et al. Reference Wang, Wang, Peng and Meng2017; Yang et al. Reference Yang, Jing, Kwok and Sobral2020; Lee Reference Lee2021). The effect of $\phi _0$, although significant in viscous flows, tends to disappear for other regimes (Lacaze et al. Reference Lacaze, Bouteloup, Fry and Izard2021). The effect of pore pressure changes on the collapse initiation has been well identified, but it represents only the initial stage of the collapse process, and the role of pore pressure in the propagation phase remains unexplored.
Grain size segregation is an intrinsic phenomenon in granular materials under shear, developing when differences in size or density are found in the constituent grains (Gray & Ancey Reference Gray and Ancey2011). Previous works have shown that the mobility of bidisperse granular columns increases due to a segregation layer (Roche et al. Reference Roche, Gilbertson, Phillips and Sparks2005; Phillips et al. Reference Phillips, Hogg, Kerswell and Thomas2006; Meruane, Tamburrino & Roche Reference Meruane, Tamburrino and Roche2012). This effect is enhanced when the size ratio between big and small grains increases, and when the column is immersed (He, Shi & Yu Reference He, Shi and Yu2021). The mobility of columns is also affected by the heterogeneity of grain layers of different sizes, leading to an increase in the runout distance of initially segregated columns (Degaetano, Lacaze & Phillips Reference Degaetano, Lacaze and Phillips2013; Martinez et al. Reference Martinez, Tamburrino, Casis and Ferrer2022). For polydisperse systems, numerical studies have indicated that mobility increases with polydispersity (Watanabe, Moriguchi & Terada Reference Watanabe, Moriguchi and Terada2022) and have suggested that small grains enhance mobility because they lubricate the system (Lai et al. Reference Lai, Vallejo, Zhou, Ma, Espitia, Caicedo and Chang2017). However, it was found that the lubrication mechanism is a biased interpretation of small system to grain size ratio, showing that the mobility, which represents the frictional strength, of dry granular columns is independent of polydispersity (Cabrera & Estrada Reference Cabrera and Estrada2021). The latter result, in the granular column configuration, is in agreement with previous studies that have shown the independence of the shear strength of polydisperse granular materials when they reach a residual stage at large deformation (Nguyen et al. Reference Nguyen, Azéma, Sornay and Radjai2015; Cantor et al. Reference Cantor, Azéma, Sornay and Radjai2018; Cantor, Azéma & Preechawuttipong Reference Cantor, Azéma and Preechawuttipong2020; Polanía et al. Reference Polanía, Cabrera, Renouf, Azéma and Estrada2023). The effect of polydispersity on immersed granular flows has been studied less, but it has been shown with a numerical approach that the collapse of immersed columns is delayed with an increase in the polydispersity level (Polanía et al. Reference Polanía, Cabrera, Renouf and Azéma2022). Despite these previous works, the effect that polydispersity has on immersed granular columns remains insufficiently investigated, especially experimentally.
In the study of granular flows, mobility models provide a simplified interpretation of a complex process. These models relate granular flows of different scales to the initial and flow conditions, considering the column initial geometry and collapse kinematics. Although simple, the scaling between the column mobility and the aspect ratio is a mobility model that comes from the force balance between the basal friction force and the normal force of the moving mass (Lajeunesse, Monnier & Homsy Reference Lajeunesse, Monnier and Homsy2005). Other studies have shown, with numerical simulations, a link between the final runout and the collapse kinematics at the grain scale (Topin et al. Reference Topin, Monerie, Perales and Radjaï2012) and at the flow scale (Yang et al. Reference Yang, Jing, Kwok and Sobral2020; Guo et al. Reference Guo, Stoesser, Zheng, Luo, Liu and Nian2023). These models work well for flows with monodisperse grains but depend on fitting parameters or flow variables, such as the flow average height, which are difficult to estimate in transitional flows. Polanía et al. (Reference Polanía, Cabrera, Renouf and Azéma2022) proposed a simplified model that links the column mobility to the collapse kinetic energy. This model, which relies entirely on physically based variables, does not need fitting parameters and works for different levels of polydispersity, has not yet been verified experimentally.
Our study presents experimental evidence on how polydispersity and the packing fraction affect the collapse sequence and mobility of dry and immersed granular columns that are in the free-fall and inertial regimes, respectively. The experiments involve columns consisting of glass beads of different sizes, and allow the study of monodisperse and polydisperse systems. We use glass beads in order to avoid undesirable effects such as grain elongation, angularity or rugosity, allowing us to focus only on the influence that the grain size distribution – and, intrinsically, the packing fraction – has on granular flows. We captured the basal pore pressure beneath the column initial geometry and along the collapse principal direction. We link the evolution of the pore pressure to the sequence of the column collapse, and reveal how these two are influenced by increasing polydispersity level. Finally, we test whether the link between the collapse kinetic energy and mobility, introduced by Polanía et al. (Reference Polanía, Cabrera, Renouf and Azéma2022), remains true in three-dimensional polydisperse collapses.
2. Collapse experiments
We conducted the column collapse experiments in a rectangular glass channel that was  $100$ cm long, 60 cm high and 18 cm wide, in dry and immersed conditions. For immersed experiments, we used tap water with density $\rho _{w}\simeq 1000$ kg m $^{-3}$ and dynamic viscosity $\mu _{w}\simeq 0.001$ Pa s, up to a level of $H_{w}\simeq 50$ cm. The granular columns had initial length $L_0 \simeq 8.5$ cm and initial height $H_0\simeq [4.2, 8.5, 17, 24]$ cm, allowing the study of short and tall columns with aspect ratios $A \simeq [0.5, 1, 2, 2.8]$. A novelty of our study is the releasing mechanism of the granular column, for which we placed an acrylic gate that was 18 cm wide and 0.8 cm thick at $L_0$, and covered it with a 0.05 cm thick and 15.24 cm wide PTFE film. One end of the PTFE film was fixed to a roller, and the other end, facing the granular column, had displacement restraints. A motor rotated the roller and pulled the PTFE film from one end, removing the gate vertically with velocity $V \simeq 0.85$ m s $^{-1}$. This mechanism reduces the effects generated by the relative displacement of the gate and the grains as they are not in direct contact (see figure 1). In all cases $V > 0.4\sqrt {gH_0}$, meaning that the gate uplift velocity did not influence the column collapse (Sarlin et al. Reference Sarlin, Morize, Sauret and Gondret2021).
Sketch of the column collapse experimental set-up. (a) Side view highlighting the column initial and final heights and lengths  $(H_0,L_0)$ and $(H_f,L_f)$, respectively. Note that $L_0 \simeq 8.5$ cm for all experiments, and for immersed collapses the water level is $H_{w} \simeq 50$ cm. The inset shows the set-up for the basal pore pressure transducer (PPT) placed at $X=[3,7,10,15,20,25,30,35]$ cm and $Y=9$ cm. (b) The release mechanism. The column collapses after removing a gate vertically with velocity $V\simeq 0.85$ m s $^{-1}$. The gate is pulled by rapidly rolling a PTFE film, reducing shear on the face contacting the grains. (c) Close-up lateral views of the glass bead granular systems with size ratios $\lambda = d_{max}/d_{min} = 1$ and $20$, where $d_{min}$ and $d_{max}$ are the minimum and maximum grain diameters, respectively.

We defined the polydispersity level,  $\lambda =d_{max}/d_{min}$, as the ratio between the maximum and minimum grain diameters ( $d_{max}, d_{min}$) and studied four values of $\lambda =[1.0, 3.8, 12.6, 20.0]$. The samples’ grain size distribution (GSD) had a cumulative volume fraction (CVF) that followed a power law of the form $\mathrm {CVF}=( d/d_{max})^n$. For each $\lambda$, we chose an exponent $n = [1, 1.38, 0.69, 0.47]$, having a common $\mathrm {CVF}$ of 0.5 at $d_{50}=1.15$ mm. We used these GSDs to build samples having an initial packing fraction of $\phi _0\simeq [0.64, 0.68, 0.75, 0.76]$, studying dense columns with $\phi _0$ comparable to or exceeding the value for the random close packing of monodisperse spheres, $\phi _{rcp} \simeq 0.64$ (Scott Reference Scott1960) (see figure 2). We used silica-lime glass beads with density $\rho _{s} =2500$ kg m $^{-3}$ produced by Sigmund Linder GmbH.
(a) The CVF as a function of the grain diameter  $d$ with a distribution following $\mathrm {CVF}=(d/d_{max})^n$ with $n = [1, 1.38, 0.69, 0.47]$ for the size ratios $\lambda = [1, 3.8, 12.6, 20]$, respectively. All GSDs have common CVF 0.5 for $d_{50} = 1.15$ mm. Markers represent the mean size, and horizontal bars represent the ranges in size reported by the supplier. (b) Average sample initial packing fraction $\phi _0$ as a function of $\lambda$. The vertical error bars represent the variability among samples with the same polydispersity level. The dashed line follows a power-law function in the form $\phi _0 = \lambda ^{0.06}\phi _{rcp}$, with $\phi _{rcp}$ being the random close packing of monodisperse spheres (Scott Reference Scott1960).

Under the flow regime classification proposed by Courrech du Pont et al. (Reference Courrech du Pont, Gondret, Perrin and Rabaud2003), the immersed collapse experiments conducted in this study are considered as being in the inertial regime with  $St = 9.28$ and $\chi = 1.58$. For dry column collapses, we assumed air density to be $\rho _{a} = 1.2$ kg m $^{-3}$ and viscosity to be $\mu _{a} = 1.8\times 10^{-5}$ Pa s, having experiments classified in the free-fall regime with $St = 662.60$ and $\chi = 45.18$. We considered $d_{50}$ as the characteristic flow diameter for all polydispersity levels. In our experiments, the ratios $L_0/d_{50}$ and $W_{ch}/d_{50}$, with $W_{ch} = 18$ cm being the channel width, are sufficiently large, and the experiments are not affected by grain size (Cabrera & Estrada Reference Cabrera and Estrada2019) or side-wall effects (Jop, Forterre & Pouliquen Reference Jop, Forterre and Pouliquen2005).
We recorded the column collapse with a Motionblitz-cube-4 high-speed camera. The experimental set-up was backlit with an LED panel, improving the image contrast and allowing better recognition of the moving mass. The post-processing of the digital images included a perspective correction with known coordinates at the front wall inside the channel. We measured fluid pressures at the channel base with a series of eight pore pressure transducers (PPTs). The channel base is perforated with eight holes of diameter 10 mm centred at  $X=[3,7,10,15,20,25,30,35]$ cm. In these holes, a 6 mm hose was inserted and sealed with silicon. The hose is connected to a three-way ball valve, allowing the hose to purge for removing air bubbles, on one end, and on the other end is a connection with the PPT. The hose free tip, the one inside the channel, is covered with a mesh with openings of 0.075 mm that stops grains from flowing through the hose (see figure 1). The PPTs were of the type 26PCCFA6D produced by Honeywell, and they were tested and calibrated for a fluid pressure range of $P\in [98, 4900]$ Pa. Both the high-speed camera recordings and the PPT measurements were registered at sampling frequency 500 Hz.
To reduce segregation during the construction of the granular column, and to have the best possible homogeneous sample, we found it satisfactory to hand-mix the grains in a wide bowl and then gently pour the mix into a grid of six rectangles inside the channel. Once the grid was filled, it was pulled up and laid over the grain layer, and then the channel was knocked gently to densify the sample. We repeated this process until the desired  $H_0$ was reached. In order to avoid having air inside the granular column in immersed experiments, we went through the same process with an increasing water level, enough to cover the grid.
An experiment started with initiating the PPTs and camera recording. Then we triggered the releasing gate and let the column collapse by self-weight. When the collapse came to a halt, we measured directly the deposit final runout  $L_{f}$ and height $H_{f}$. For immersed experiments, we drained the channel, removed the grains, and let them dry over 24 h in an oven at 100 $^\circ$C. Once the grains were dry, or simply removed from the channel after a dry experiment, we sieved them and prepared them for another experiment. In order to quantify the experiment's repeatability, we conducted two repetitions for certain combinations ( $A, \lambda$) and found consistent results between them. A table summarising the experiments conducted can be found in the supplementary material available at https://doi.org/10.1017/jfm.2024.176.
3. Collapse sequence
After removing the gate, the column starts to collapse, releasing a wedge of grains that moves vertically and then spreads horizontally. For dry columns, polydispersity plays a minor role in the collapse sequence. The mobilised masses of monodisperse and polydisperse columns have similar heights and reach similar horizontal distances almost at the same time (see figure 3a,b). For immersed cases, the first stage of the column collapse reveals differences between monodisperse and polydisperse columns, showing that systems with  $\lambda = 1$ collapse faster than systems with $\lambda = 20$ (see figure 3c,d). An important aspect of polydisperse columns is the initial vertical fall of grains at the column releasing face, while the core remains still. High packing fractions, due to high polydispersity levels, frustrate the rapid percolation of water into the granular structure and produce a retrogressive collapse mechanism. Similar collapse mechanisms have been observed for sand columns (Thompson & Huppert Reference Thompson and Huppert2007) and polydisperse columns in two-dimensional simulations (Polanía et al. Reference Polanía, Cabrera, Renouf and Azéma2022). The motion of monodisperse collapses finishes earlier than that of polydisperse collapses, resulting in longer runout distances for systems with $\lambda = 20$ than for $\lambda = 1$. The final deposits of immersed collapses have a wavy shape that is produced by strong grain–fluid interactions on the surface of the moving mass. In contrast, due to the negligible air viscosity, the deposits of dry collapses have a smooth surface. The collapse sequence in figure 3 presents the collapse evolution at equivalent moments for a time scale normalised by a characteristic time $t^* = \sqrt {H_0/g^*}$, where $g^*=g\,\Delta \rho / \rho _{s}$ is a scaled gravity due to the ambient fluid (see the movies in the supplementary material).
Collapse sequence of (a,b) dry and (c,d) immersed columns with aspect ratio  $A= H_0/L_0 \simeq 2$ and with (a,c) $\lambda = 1$ and (b,d) $\lambda = 20$. The red dashed lines indicate the column initial geometry; $t^* = \sqrt {H_0/g^*}$ is a characteristic column time, where $g^*=g\,\Delta \rho / \rho _{s}$ is a scaled gravity due to the ambient fluid, with $\Delta \rho = \rho _{s} - \rho _{f}$ being the difference between $\rho _{s}$ and $\rho _{f}$, the solid and fluid densities.

From the recorded digital images, we obtained the moving mass height profile during the entire collapse sequence in the  $(X, Z)$ plane and the front position evolution $L(t)$, both measured at the front wall. Changes of the pore pressure are monitored as $\Delta P(t)=P(t)-P_0$ during the column collapse, where $P_0=\rho _{w}gH_{w}$ is the initial hydrostatic pressure. The information on $L(t)$ and $\Delta P (t)$ allows us to link the effect that one has on the other during the collapse sequence (see figure 4). We present this link in § 3.3 only for immersed columns because in our experiments the pressure changes induced by dry flows were negligible.
Evolution of the front position  $L(t)$ and fluid pressure change $\Delta P$ for a column with $A \simeq 2$ and $\lambda = 20$. The fluid pressure change is computed as $\Delta P(t) = P(t) - P_0$, where $P(t)$ is the pressure registered by the PPTs and $P_0$ is the initial hydrostatic pressure. Note that only PPT1 and PPT2 are beneath the column initial geometry. The dashed lines indicate the instants when the collapse reaches $L_{25} = L_0+0.25(L_{f}-L_0)$ and $L_{75} = L_0+0.75(L_{f}-L_0)$, which delimit the collapse steady propagation stage interval where the front velocity $U$ is computed.

3.1. Role of polydispersity and packing fraction
The evolution of the front position for dry collapses shows that increasing the level of polydispersity  $\lambda$ has a minor effect on the collapse sequence. Regardless of $\lambda$, collapses exhibit notable differences neither at the collapse initiation nor during the spreading stage. The front position of dry collapses reaches similar distances at similar times, revealing the flow independence with respect to the GSD during the constant shearing of the moving mass. At the end of the collapse, the final runout increases roughly with the polydispersity $\lambda$ (see $L(t)$ for dry collapses in figure 5a). In contrast, the collapse sequence of immersed columns depends on the polydispersity level and, intrinsically, on the initial packing fraction. Notably, polydispersity affects the collapse initiation and the final runout. Note in figure 5(a) that the horizontal spreading of immersed columns with $\lambda = 20$ is delayed compared with columns with lower polydispersity. The delay of the horizontal spreading in polydisperse systems, induced by the large initial packing fraction, is in agreement with previous studies (Pailha, Nicolas & Pouliquen Reference Pailha, Nicolas and Pouliquen2008; Rondon et al. Reference Rondon, Pouliquen and Aussillous2011). However, despite the consistent increase of the packing fraction with the polydispersity, we observed that collapses were delayed only in samples with the greatest polydispersity ( $\lambda = 20$). Interestingly, samples with $\lambda = 12.6$ and 20.0 have similar initial packing fractions, $\phi _0 \sim 0.75$ and 0.76, respectively, but their collapse initiation is considerably different, indicating that the flow initiation is affected not solely by the packing fraction but also by features of the GSD such as the proportion of small grains, which is larger for $\lambda = 20$ (see figure 2).
(a) Front position evolution  $L(t)$ for dry (red) and immersed (blue) columns, and for $A \simeq 1$ ( $\triangle$) and $A \simeq 2$ ( $\square$). (b) Front velocity evolution ${\rm d}L/{\rm d}t$ for dry and immersed columns with aspect ratio $A \simeq 2$. Shaded areas represent the variability between repetitions, with envelopes indicating the minimum and maximum values, and markers and continuous lines are the average of them. In (b), the dashed lines represent the collapse acceleration magnitudes ${\rm d}^2L/{\rm d}t^2$ for immersed columns during the collapse deceleration phase.

The time derivative of the front position  ${\rm d}L/{\rm d}t$ represents the evolution of the front velocity, and the second time derivative ${\rm d}^2L/{\rm d}t^2$ is the front acceleration (see figure 5b). Columns have an initial acceleration phase that in dry cases is similar for all polydispersity levels. For immersed columns, the velocity of samples with $\lambda =20.0$ evolves at a lower rate compared with other polydispersity levels. Then collapses transition to a stage where the peak velocity is reached and – especially for immersed cases – the collapse maintains a nearly steady velocity $U$. Finally, collapses transition to the deceleration phase where the velocity decreases almost linearly (i.e. constant deceleration). For dry cases, the velocity decreases with a similar rate independently of $\lambda$, and collapses stop at similar times. In immersed columns, the deceleration phase depends on the initial packing fraction $\phi _0$ and the polydispersity level $\lambda$. For instance, monodisperse collapses with $\phi _0 \simeq 0.64$ have a greater rate of velocity loss than the polydisperse collapses $\lambda = 12.6$ and 20.0 with $\phi _0 \simeq 0.75$ and 0.76, respectively, for which the deceleration magnitude is similar.
We found it satisfactory to consider the collapse steady stage between the times when the front had reached  $L_{25} = L_0 + 0.25(L_{f}-L_0)$ and $L_{75} = L_0 + 0.75(L_{f}-L_0)$ (see figure 4) and consider the steady-state velocity $U$ as the mean velocity on this interval. Figure 6 presents the steady velocity $U$ as a function of $H_0$ and shows that it is closely related to the theoretical free-fall velocity $U_{ff} = \sqrt {2g^* H_0}$, having good agreement when $U_{ff}$ is scaled by factors of 0.5 and 0.28, which are values typically obtained for column collapses belonging to the free-fall and inertial regimes, respectively (Bougouin & Lacaze Reference Bougouin and Lacaze2018). Moreover, $U$ has more variability in dry collapses than in immersed collapses and, for the latter, $U$ is marginally affected by $\lambda$ with a slight reduction for $\lambda = 20$.
Front velocity  $U$ during the steady propagation stage as a function of the column initial height $H_0$. Results are shown for dry (red) and immersed (blue) columns, and for all values of $\lambda$. The dashed lines indicate the theoretical free-fall velocity $U_{ff} = \sqrt {2g^* H_0}$ scaled by factors of 0.50 and 0.28 for dry and immersed columns, respectively. The interval where $U$ is computed is shown in figure 4, and vertical error bars indicate the standard deviation within the interval.

3.2. Column runout
The mobility of a granular column increases with the aspect ratio  $A$ and follows a power-law function in the form $L^* = a A^b$ (Lube et al. Reference Lube, Huppert, Sparks and Hallworth2004; Zenit Reference Zenit2005). Our results can be fitted by the coefficients $(a, b) = (2.7, 1)$ for short columns and $(a, b) = (3.7, 0.64)$ for tall columns, similar to those found by Bougouin & Lacaze (Reference Bougouin and Lacaze2018) (see figure 7a). However, for immersed columns, the results deviate from the trend because in general the increase of the polydispersity level enhances the column mobility. For instance, the mobility in monodisperse systems is slightly, but consistently, larger for dry columns than for immersed columns. The increase of the column $\lambda$, representing an increase of the column initial packing fraction $\phi _0$, boosts the mobility of immersed columns, resulting in final deposits with a longer runout distance even when compared with dry columns. The increase of the column mobility produced by $\lambda$ and $\phi$ is enhanced by the column height. In short columns ( $A \simeq 0.5$), the runout barely changes with $\lambda$ for both dry and immersed cases. In contrast – and for the sake of simplicity we compare only the cases of extreme $\lambda$ – the runout of columns with $\lambda = 20.0$ is longer than the runout of columns with $\lambda = 1.2$, with an increase of between 20 % and 39 % for aspect ratios $A \simeq 1$ and $A\simeq 2.8$, respectively, while in dry cases the runout change is less than 8 % (see figure 7b). For immersed columns, the largest runout was obtained consistently for columns with $\lambda = 12.6$, rather than for $\lambda = 20.0$. This suggests a transition from inertial to viscous behaviour due to an increase in the level of polydispersity and its associated proportion of small grains.
Normalized final runout  $L^* = (L_{f} - L_0)/L_0$ as a function of (a) $A$ and (b) $\phi _0$. The lines in (a) indicate $L^* = aA^b$, with the values $(a,b) = (2.7,1.0)$ for short columns ( $A < 2$) and $(a,b)=(3.7,0.64)$ for tall columns ( $A \geq 2$). Error bars indicate variability between repetitions.

Previous studies exploring the effect of  $\phi _0$ on monodisperse granular columns have demonstrated that the relative increase in the column packing fraction reduces the mobility of columns that belong to the viscous regime (Rondon et al. Reference Rondon, Pouliquen and Aussillous2011; Wang et al. Reference Wang, Wang, Peng and Meng2017; Lee Reference Lee2021). We observe that an increase in the column packing fraction, resulting from a higher polydispersity level, favours the mobility of immersed granular columns in the inertial regime. This result offers a new perspective on the influence of polydispersity and packing fraction on granular flows, and leads to questions about the reasons for the reduction of the effective friction strength, equivalent to a larger runout, in such systems. We observed grain size segregation in the deposit in neither dry columns nor immersed columns. Therefore, we cannot attribute to segregation the reason for the increasing runout in highly polydisperse columns, especially in immersed cases. However, we can link features of the collapse sequence, such as the deceleration phase, to changes in the basal pore pressure, thanks to our experimental set-up and instrumentation (see figure 4). In the next subsection, we discuss the relationship between varying levels of polydispersity in immersed collapses and changes in the basal fluid pressure.
3.3. Basal pore fluid pressure
We found that there is a link between the evolution of the pore fluid pressure and the collapse sequence, and vice versa. By observing the evolution of the front position, it is possible to demarcate three moments of basal pore pressure changes  $\Delta P$. The results presented in figure 4 show clearly those three moments of pore pressure evolution for the case of a column with $A \simeq 2.0$ and $\lambda = 20$ (see figure 3d). First, beneath the column initial geometry (i.e. PPT1, PPT2) the pore pressure decreases. It can be assumed that a decrease in pore pressure induces a fluid flow into the granular structure as the dense granular column dilates, resulting in a temporary increase of the effective stress $\sigma '$ (Rondon et al. Reference Rondon, Pouliquen and Aussillous2011; Rauter Reference Rauter2021). At this first moment, the PPTs outside the column initial geometry ( $X>L_0$) do not record significant pressure changes. Second, during the horizontal spreading stage, the moving mass produces a positive $\Delta P$, indicating that fluid is being expelled from the decelerating granular mass, reducing the void volume and decreasing the effective stress $\sigma '$. Note in figure 4 that the amplitude of $\Delta P$ increases significantly after the granular front arrives at any of the PPT positions. Then $\Delta P$ transitions from positive to negative values, indicating local variations in the deposit packing (e.g. dilation, contraction) and basal slip velocities (Breard, Dufek & Roche Reference Breard, Dufek and Roche2019), until a state of full dissipation (i.e. $\Delta P \simeq 0$) is reached that coincides with the front position reaching $L_{f}$. It is important to note that pore pressure changes are measured even before the moving mass passes over the PPT position. This is due to an increase in the fluid pressure driven by the moving mass, expelling and pushing the fluid as a result of the grain mixture densification and particle–fluid drag interactions (Pinzón & Cabrera Reference Pinzón and Cabrera2019).
Let us now compare the effect that  $\lambda$ and $A$ have on the first two moments of $\Delta P$. At the collapse initiation, when the pore pressure changes beneath the column are negative, the amplitude of $\Delta P$ increases with $A$,
$A$,  $\lambda$ and, intrinsically, $\phi _0$. This means that more fluid needs to enter the material pores as it dilates because the column becomes denser with the increase of $\phi _0$, and $A$ increases the column's volume. This observation is in agreement with the results of Ahmed, Martinez & DeJong (Reference Ahmed, Martinez and DeJong2023), who showed that polydisperse granular assemblies with large packing fractions develop a greater amplitude of negative pore pressure changes, indicating their tendency to dilate when deforming. Columns with $\lambda = 12.6$ and 20, which have $\phi \simeq 0.75$ and 0.76, respectively, develop the greatest amplitude of negative pore pressure changes $\Delta P$. However, it is interesting to notice that $\Delta P$ remains negative with a greater intensity and during a longer period for $\lambda = 20$ even when its packing fraction is very close to the packing fraction of $\lambda = 12.6$. This indicates that in columns with the largest polydispersity level, the fluid flow through them lasts longer (see columns PPT1 and PPT2 in figure 8).
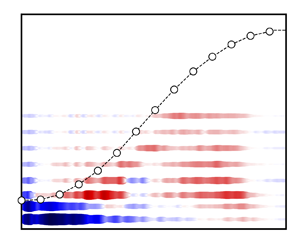
Evolution of  $\Delta P$ for the PPTs 1, 2, 3 and 5 (columns), for columns with $A \simeq [0.5, 1, 2, 2.8]$ (rows) and for all $\lambda$. Markers indicate $\Delta P$ at the time when the front reaches the $\mathrm {PPT}i$ position for $\lambda =[1, 20]$, and the horizontal red bar indicates an interval of $\bar {t} = 0.25$ s. For PPT1 and PPT2, both beneath the column initial geometry, the horizontal bars indicate the time interval $t = [\bar {t}/2, 3\bar {t}/2]$.

The flow of a fluid through a porous medium, as in the granular columns, can be interpreted as the flow through a network of interconnected pipes controlled by the column hydraulic permeability  $k$. The lower $k$ is, the slower the fluid flow through the column. The permeability $k$ depends on $\phi _0$ and the solid-specific surface $M_{s}$, and it decreases with an increase of any of the above (Carman Reference Carman1937). For a sphere of diameter $d$, the specific surface is $M_{s} = 6/d$, so a greater fraction of small grains increases $M_{s}$ and decreases the pore sizes, hindering the fluid percolation through the granular structure. Among our experiments, columns with $\lambda =20$ have the highest $\phi$ and the highest concentration of small grains (see figure 2a), hence the lowest $k$. This fact explains that in columns with $\lambda = 20$, the negative change of pore pressure $\Delta P$ lasts for a longer period, leading to a slower collapse initiation when compared with columns of lower polydispersity levels (see figure 5).
At the second moment of the pore pressure changes  $\Delta P$, the grains' collective movement and the associated void reduction induce positive pore pressure changes after, or in some cases before, the arrival of the front at the PPT position. The peak positive $\Delta P$ is recorded at an early stage of the collapse process close to the initial length of the column, and increases for tall columns. At this stage, where the collapse is transitioning mainly from vertical to horizontal motion, the flow could be assumed to be fully fluidised. It is interesting to note that for monodisperse columns ( $\lambda = 1$) with $\phi _0 \simeq 0.64$, the positive $\Delta P$ peak vanishes rapidly, while for polydisperse columns with larger initial packing fractions, the dissipation of the excess pore pressure lasts longer (see column PPT3 in figure 8).
Figure 9 shows the measurements of pore pressure changes after the front arrives at each PPT as the ratio between the average  $\Delta P$ obtained for a time interval $\bar {t}$ and the equivalent effective stress $\sigma '$. We estimate $\sigma '=\phi _0 \rho _{p} g h_{i}$, where $h_{i}$ is the average collapse height over PPT $i$ during $\bar {t}$, obtained from image analysis. The fluid pressure is averaged over a time interval of $\bar {t} = 0.25$ s, being within a range given by two characteristic times: the time of the column release, $t_g = H_0 / V$, and the viscous time in the granular column, $t_v = 18 \mu _{f} H_0 / (\Delta \rho \,g d_{50})$ (Bougouin & Lacaze Reference Bougouin and Lacaze2018). Considering the height of the tallest column, $H_0 = 0.24$ m, and the material parameters described in § 2, the characteristic time range is $[0.22 , 0.28]$ s. Although the PPT measurements are influenced not only by the moving mass but also by the induced fluid fluxes, the average results obtained from them allow a distinction between columns of different $\lambda$ and $\phi _0$. For instance, in monodisperse columns, the positive peak $\Delta P$ rapidly vanishes to $\Delta P \simeq 0$. In contrast, when the columns have high $\phi _0$ and low permeability, such as in $\lambda = 12.6$ and 20 with $\phi _0 \simeq 0.75$ and 0.76, respectively, the excess pore pressure dissipation lasts longer, because a large concentration of grains induces greater drag and reduces the depositing velocity (Kaitna et al. Reference Kaitna, Palucis, Yohannes, Hill and Dietrich2016), producing a localised fluidisation at the base. Figure 9 also includes the average $\Delta P$ measured at PPT1 and PPT2, both beneath the column initial geometry but close to the front position when the collapse starts, showing the whole transition that begins with negative $\Delta P$ at $X_{PPT} < L_0$ and shifts to positive $\Delta P$ at $X_{PPT} > L_0$.
Ratio between the basal pore pressure changes  $\Delta P$ and the effective stress $\sigma '$ when the flow front arrives at the position $X_{PPTi}$ for all $\lambda$ and for columns with $A \simeq [1,2,2.8]$. Here, $\Delta P$ was taken to be the median value of a 0.25 s interval after the front arrives at $X_{PPTi}$, and the error bars indicate the first and third quartiles of the same interval. We compute $\sigma '=\phi _0 \rho _{p} g h_{i}$ with the average flow height $h_i$ for the same time interval. For for PPT1 and PPT2, both beneath the column initial geometry, $\Delta P$ was considered for the time interval $t = [\bar {t}/2, 3\bar {t}/2]$ (see markers in figure 8). The dashed lines indicate $\Delta P / \sigma ' = 0.1$.

A comparison of two systems with extreme polydispersity levels  $\lambda = [1, 20]$ highlights differences in the collapse sequence that can be attributed to differences in the evolution of basal pore pressures. For highly polydisperse columns, positive pore pressure changes reduce $\sigma '$ for a longer period. The reduction of $\sigma '$ leads to a decrease of the deceleration magnitude, allowing the moving mass to flow for a longer time, hence resulting in longer runout distances than in monodisperse columns (see figure 5). Our results indicate that when $\Delta P$ increases to approximately 10 % of $\sigma '$, the column collapse can have a prolonged period of spreading (see figure 9). An interesting observation arises when comparing $\Delta P$ for systems with $\lambda = 12.6$ and $20$, which have $\phi _0\simeq 0.75$ and $\phi _0\simeq 0.76$, respectively. For these two polydispersity levels, changes of the basal pore pressure show a similar tendency with $\Delta P / \sigma ' \gtrsim 0.1$ beyond the column initial length, leading them to have the lowest deceleration and the greatest mobility. This result suggests that immersed polydisperse granular flows might be better described by an initial packing fraction $\phi _0$ rather than by a characteristic grain diameter $d$ (Dahl, Clelland & Hrenya Reference Dahl, Clelland and Hrenya2003; Breard et al. Reference Breard, Dufek, Fullard and Carrara2020).
4. Mobility model
Previous observations help in integrating the controlling variables of the collapse sequence into a mobility model. Mobility models are a simple yet functional way to estimate the mobility of granular flows. They provide a simplified interpretation of a complex process, and link certain initial and flow conditions to the final column runout. Polanía et al. (Reference Polanía, Cabrera, Renouf and Azéma2022) proposed a simplified model that links the column collapse kinetic energy to the final runout as
 \begin{equation} L^* \propto \frac{1}{L_0}\,\frac{\rho_p }{\Delta \rho}\,\sqrt{E_K^U}, \end{equation}
where  $E_K^U=MU^2/2$ is the collapse kinetic energy during the horizontal propagation stage and $M= L_0 H_0 \phi _0 \rho _{s}$ is the column mass. Here, $M$ is treated as a mass of unitary width, because the column collapse experiment is a width-independent problem. The concept behind the model is an analogy of a sliding block that has an initial velocity and an opposite resistance. By assessing the controlling factors within the model, it was found that the collapse energy $E_K^U$ is the foremost parameter for establishing a relationship between the flow condition and the column final runout that works satisfactorily for free-fall and inertial regime flows. In (4.1), the ratio between $\rho _p$ and $\Delta \rho$ compensates for the difference in velocity $U$ of dry and immersed collapses.
Figure 10 presents the scaling of the normalized final runout  $L^*$ with the column kinetics according to (4.1), and shows that results from numerical simulations and experiments follow a similar trend. We validate that this simplified model remains true for columns belonging to the free-fall and inertial regimes. Moreover, we verify the model with the experimental results of Bougouin & Lacaze (Reference Bougouin and Lacaze2018), who covered a wider range of aspect ratios $A\in [0.2,9.2]$, confirming the model validity for shorter and taller columns. Although polydispersity is not explicit in the model formulation, the initial packing fraction $\phi _0$, which depends on it, is indispensable for obtaining the front kinetic energy. Note that the right-hand side of (4.1) is not dimensionless, but with this formulation the collapse energy becomes the principal variable that links the mobility of gravity-driven flows, condensing all the data into a trend with power index $\sim$1 (see inset in figure 10).
Scaling of the normalized final runout  $L^*$ with the column kinetics according to (4.1). Here, $E_K^U=MU^2/2$ is the column kinetic energy during the steady propagation, $M = L_0H_0\phi _0\rho _{s}$ is the column mass with unitary width, and $\phi _0$ is the initial column packing fraction. This scaling is compared with previous experimental and numerical results (Bougouin & Lacaze Reference Bougouin and Lacaze2018; Polanía et al. Reference Polanía, Cabrera, Renouf and Azéma2022). The horizontal error bars show the variability associated with $U$. The dashed line follows a trend of power index 1.

We understand that this model is an oversimplification of a complex physical process, but it is remarkable that the model can effectively link the final runout to the collapse kinematics across various levels of polydispersity and for both dry and immersed collapses. Notably, this model does not depend on fitting coefficients, and it needs only material parameters (i.e.  $\rho _{s}$ and $\rho _{f}$) and physically based variables (i.e. $L_0$, $H_0$, $\phi$ and $U$). The fact that results from two distinct methodologies and from experimental studies conducted by different authors align with the same trend suggests the possibility of a universal model. If it is found that this simplified model can be used to establish a universal link between the collapse mobility and kinematics, then it may prove useful in analysing and understanding mass movements such as landslides or debris flows, in areas where the only available data are the mobility and an interpretation of the initial geometry (Prada-Sarmiento et al. Reference Prada-Sarmiento, Cabrera, Camacho, Estrada and Ramos-Cañón2019).
5. Conclusions
We conducted an experimental study of dry and immersed dense granular column collapses. We varied the column height, ranging from short to tall columns, as well as the columns’ grain size distribution from monodisperse to highly polydisperse systems, in order to assess the effect of the grain size distribution on the column collapse. The collapse sequence was analysed by means of image analysis and direct measurements of the basal pore fluid pressures, providing unique insight into the coupled kinematics of grains and fluid until the system comes to rest.
We have shown that the level of polydispersity has a stronger effect on immersed columns than on dry columns. For dry columns, the collapse sequence remains independent of the polydispersity level, reaching similar distances at similar times. This observation is common for short and tall columns. The final runout of dry columns increases weakly with the polydispersity level. In immersed columns, the increase of the packing fraction, associated with an increase of the polydispersity level, plays an important role, most notably in the collapse initiation and in determining the runout distance. We observed that variations of these two features are caused by differences in the evolution of the pore pressures beneath the moving mass. In the column collapse initiation, there is a negative change of the pore pressure that induces a temporal increase of the column's strength. We showed that the collapse of polydisperse columns, with large packing fraction and low permeability, is delayed because the negative change of pore pressure has a greater amplitude and remains for a longer period than in monodisperse columns. Then, during the horizontal spreading stage of immersed collapses, the grain's deposition expels fluid from the moving mass and produces an excess, the same as a positive change, of the pore pressure. We revealed that in monodisperse collapses, the excess pore pressure is dissipated rapidly. In contrast, for polydisperse collapses, the large increase of the packing fraction means that the excess pore pressure remains for a longer period, decreasing the strength and producing a localised fluidisation that results in longer runout distances.
We confirmed that the link between the collapse energy during the propagation stage and the column mobility remains valid for three-dimensional processes, and works satisfactorily for dry and immersed collapses. The model is an oversimplification of a complex physical process, but it is remarkable that it scales the final runout with the collapse kinematics for a wide range of polydispersity levels. Moreover, this model collapses numerical and experimental results onto the same curve, suggesting that it might capture a universal scaling.
The findings of this work shed light on the effect that an increasing packing fraction, induced by an increasing polydispersity level, has on granular flows, and show that immersed flows depend strongly on the polydispersity level. Our results suggest that the packing fraction may be a better descriptor than a characteristic diameter in polydisperse granular flows. Our experimental work provides novel insight into the basal pore pressure variations and the influence that these have on the collapse sequence of immersed granular flows. Further studies might enrich our understanding of these complex systems, exploring other details such as the effects that cohesive granular contacts, grains with varying density or grain shape have on immersed flows.
Supplementary material and movies
Supplementary material and movies are available at https://doi.org/10.1017/jfm.2024.176.
Acknowledgements
We thank L. Lacaze for his stimulating thoughts and discussion, and thank him and A. Bougouin for sharing with us their experimental data to enrich and strengthen our study. We acknowledge the support of J. Monroy, J. Naranjo, M. Tobar and all the technical team in the hydraulic and geotechnical lab at Universidad de los Andes. Moreover, we would like to thank the anonymous referees for their valuable and constructive comments.
Declaration of interests
The authors report no conflict of interest.


 Open access