


It is estimated that 33 % of Canadian children aged 5–11 years are overweight or obese( Reference Roberts, Shields and de Groh 1 ). Establishing good quality diets in early childhood has been shown to reduce the risks of obesity and chronic disease later in life, including type-2 diabetes, hypertension, and cardiovascular disease( Reference Swinburn, Caterson and Seidell 2 , Reference Ogata and Hayes 3 ). Additionally, poor diet quality in children aged 10–11 years has been shown to be negatively associated with intellectual capacity, social skills, and academic performance( Reference Florence, Asbridge and Veugelers 4 ). A good quality diet is one that consists of frequent intakes of vegetables, fruits, whole grains, lean meats and fish, and lower fat dairy, along with less frequent intakes of energy-dense, nutrient-poor foods, such as chips, cookies, sweets and high-sugar drinks( Reference Ogata and Hayes 3 ). Typically, eating habits and behaviours are formed in preschool children, between the age of 1·5 and 4 years( Reference Savage, Fisher and Birch 5 ), and it has been shown that diet quality established in these early years tracks to later childhood and adolescence( Reference Mikkila, Rasanen and Raitakari 6 ).
The diet quality of young children is sub-optimal with reports from the 2014 UK National Diet and Nutrition Survey highlighting that children aged 1·5–3 years obtained 11 % of their daily energy intakes from added sugars( 7 ), which is more than double the current recommendation( 8 ). In Canada, the 2012 Canadian Community Health Survey indicated that children aged 2–8 years had higher energy intake than energy expenditure, and that >75 % of these children had sodium intakes greater than the upper recommended limit( 9 ). As with many countries, to support the public to have a better quality diet, Canada has produced healthy eating guidelines for the population, and these include specific guidance for preschool children over the age of 2 years( 10 ). Canada’s Food Guide (CFG) provides recommendations for the daily consumption of portions of vegetables and fruit, grains, meat and alternatives, and milk and alternatives by gender and age category. Although there is a paucity of research on preschool children in Canada, one study of 4–5-year-olds conducted in 2007 found that only 29·6 % met recommendations for servings of vegetables and fruit and 23·5 % met the recommendations for milk and alternatives( Reference Pabayo, Spence and Casey 11 ). Furthermore, in a study of 894 2–3-year-old children in the USA, 80·3 % and 50·2 % of them did not meet the recommendations for total vegetable and fruit intake respectively( Reference Krebs-Smith, Guenther and Subar 12 ).
Many studies investigating diet and health outcomes look at the impact of a single nutrient or food( Reference Ludwig, Peterson and Gortmaker 13 ). A limitation to this approach is that people do not eat single foods, but rather consume combinations of foods( Reference Kant 14 ). One approach to ‘whole diet’ assessment is the use of a diet quality index (DQI) which can consider the intake of nutrients, food groups, or a combination of both, relative to nutrition guidelines( Reference Kant 14 ). Most DQI-type scores include healthy and unhealthy dietary components by assigning point values to different amounts of intake( Reference Anderson, Ramsden and Kaye 15 ). Points are given for higher intakes of healthy dietary components and are taken away for intakes of unhealthy dietary components.
Currently, few DQIs exist that describe the diet quality of preschool children, and none are specific to the Canadian context. Those that have been reported in the literature are based on national dietary guidelines that reflect cultural preferences and differ from country to country( Reference Kranz, Hartman and Siega-Riz 16 - Reference Voortman, Jong and Geelen 19 ), making them inappropriate to apply directly to Canadian children. For instance, the Flemish DQI components include scores for diet diversity and meal patterns; these elements are not included in CFG( Reference Huybrechts, Vereecken and De Bacquer 18 ). A DQI developed in the USA for 2–5-year-olds may have been more culturally relevant for use in Canada, but it was developed using the US dietary guidelines from 2005, which do not reflect the current CFG( 10 , Reference Kranz, Hartman and Siega-Riz 16 ). A DQI recently developed in the Netherlands was formulated to assess adherence to dietary guidelines for young children in Europe, and includes components to consider the consumption of candy, snack foods, and sugar-sweetened beverages( Reference Voortman, Jong and Geelen 19 ). In the study of 3629 preschool children, this tool adequately assessed the overall quality of 1·5–2-year-old children’s diets( Reference Voortman, Jong and Geelen 19 ). The resulting score was positively correlated with nutrients indicative of a good quality diet, such as polyunsaturated fatty acids, dietary fibre and calcium, and inversely associated with intakes of added sugar and saturated fat( Reference Voortman, Jong and Geelen 19 ). Since CFG lacks dietary guidelines for unhealthy foods, it is important to understand how intakes of these foods contribute to dietary patterns in the Canadian context. The adaptation of these tools has yet to be tested in a Canadian population. There is a strong need to identify dietary patterns in preschool children to inform context appropriate nutrition interventions.
Therefore, this study had four aims: (i) to adapt the DQI for preschool children as developed by Voortman et al.( Reference Voortman, Jong and Geelen 19 ) for the Canadian context (DQI-C); (ii) to apply the index to dietary data from 1260 3-year-old children; (iii) to describe food and beverage intakes according to quartiles of the DQI-C score; and (iv) to examine associations between the sociodemographic characteristics of mothers and DQI-C score in their children.
Materials and methods
Study design and participants
The Alberta Pregnancy Outcomes and Nutrition (APrON) study is a prospective cohort study of 2189 women during pregnancy and post-partum and their children. Participants were recruited between May 2009 and November 2012 through advertisements in the media and in physician offices in Calgary and Edmonton, Alberta. Eligibility criteria were: age 16 years or older, literate in English and <27 weeks gestation. Women who provided written informed consent were invited to attend a study centre once in each trimester following enrolment, and once at approximately three months post-partum. Further follow-ups included health and lifestyle questionnaires relating to both mother and her child, which were completed when children were 6, 12, 24 and 36 months of age. The APrON study was approved by the University of Calgary Health Research Ethics Board and the University of Alberta Health Research Ethics Biomedical Panel( Reference Kaplan, Giesbrecht and Leung 20 ). This study includes data collected from 1260 mother–child pairs when the children were aged 3 years.
Dietary assessment
Children’s dietary intake was assessed using a parent-reported 100-item semi-quantitative Food Frequency Questionnaire (FFQ). The FFQ was developed by experts in childhood nutrition for the Family Atherosclerosis Monitoring In earLY Life (FAMILY) study, a prospective birth-cohort study in Canada( Reference Morrison, Atkinson and Yusuf 21 ). In brief, food items included on the FFQ were established using commonly consumed foods reported in a nationally representative sample of preschool children from the Canadian Community Health Survey( 22 ) and recommended foods in Canada’s Food Guide. Similar methods for developing FFQ to assess young children’s diets have been used and validated in studies including the Southampton Women’s Survey( Reference Fisk, Crozier and Inskip 23 , Reference Jarman, Fisk and Ntani 24 ). Frequency of consumption along with pre-determined serving sizes, aligned with CFG, was reported. Parents indicated, on behalf of their children, the frequency of consumption of each item with one of the following options: never; 1–3 times per week; 4–6 times per week; 1 time per day; 2–3 times per day; 4–6 times per day; and >6 times per day. The FFQ also included open-ended sections for recording the frequency, portion and description of other foods consumed that were not listed in the FFQ. Food items from the FFQ were converted into weight (grams/serving) and energy (kcal/serving) using the Canadian Nutrient File database( 25 ). If food items were not in the Canadian Nutrient File, the USDA Food Composition Database( 26 ) or the manufacturer’s nutritional information from its website was used. Frequency of food intake was converted into daily consumption (g/d). For frequency categories that specified a range (e.g. 4–6 times per week), the middle value was used and divided by 7 to determine the frequency of consumption per day. Following this, the amount of each food item consumed per day was calculated by multiplying the mean weight (g/serving) by the daily frequency of consumption of the corresponding food item. Missing responses to FFQ items were imputed using the mean daily frequency of consumption for the corresponding item in the whole cohort. To determine total kcal intake per day, the kcal/serving of each food item in the FFQ was multiplied by daily frequency of consumption and summed.
Construction of the Diet Quality Index (DQI-C)
The procedure for constructing the DQI-C was based on the study by Voortman et al.( Reference Voortman, Jong and Geelen 19 ) The adapted DQI-C for the current study was comprised of six components: four components from CFG (Vegetables and Fruit, Grain Products, Milk and Alternatives, Meat and Alternatives)( 10 ) and two components for less-healthy food and drinks as specified in Voortman et al. (Candy and Snacks, Sugar-Sweetened Beverages (SSB)). Each item from the FFQ was assigned to one of the six components. Food items that were reported as responses to the open-ended questions in the FFQ were also categorized into one of the six components (e.g. rhubarb was not in the original FFQ, and so was added to the Vegetables and Fruit component). To determine each child’s overall consumption of each of the six components, g/d of the food items included in the component were summed. In accordance with CFG recommendations, only food items considered healthy were counted towards the recommended servings/d of the four food groups from CFG, whereas unhealthier food items were excluded from the DQI-C (e.g. baked or broiled chicken was included, but chicken nuggets were excluded). Decisions for the inclusion/exclusion of the items was discussed by three nutrition experts (MJ, AA and RB) and in conjunction with the details of included items from Health Canada( 27 - 30 ). A protocol for the assignment of FFQ food items to the groups was written and strictly followed, which detailed exactly which food item was to be categorized into which group. The items were electronically separated into their food groups and the group assignment was checked by MJ. Excluded FFQ items were not included in the computation of the final DQI-C, but they were included when calculating total daily energy intake (kcal/d). In addition, mixed dishes were excluded from the DQI-C due to a lack of information about proportions of multiple ingredients.
Details about scoring criteria are shown in Table 1. The recommended intake for each CFG component (g/d) was determined using information from CFG on what constitutes a ‘serving’ for each food included in the component( 27 - 30 ) and multiplying by the recommended number of servings indicated in CFG. For Candy and Snacks and SSB, the g/d criteria were used as specified by Voortman et al.( Reference Voortman, Jong and Geelen 19 ) as no such guidance on these foods exists in CFG. To calculate the total DQI-C score, the ratio of the reported intake: recommended intake was calculated for each child (truncated at 1) and summed for each of the six components and resulting in scores ranging from 0 to 6 (Table 1). Candy and Snacks and SSB were reverse scored.
Components of the Diet Quality Index (DQI-C) and scoring criteria
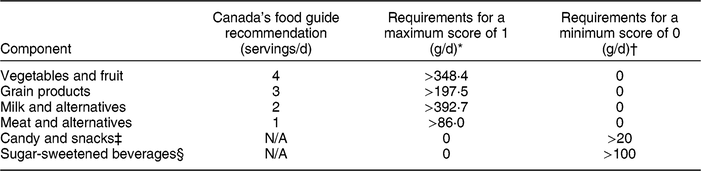
N/A: not applicable.
* Grams per day based on Canada’s Food Guide servings converted into weights using the Canadian Nutrient File database.
† Grams per day for Candy and Snacks and Sugar-Sweetened Beverages adapted from Voortman et al. (Reference Voortman, Jong and Geelen19).
‡ Candy and Snacks included salty snacks (e.g. chips, French fries, pretzels and popcorn) and sugary snacks (e.g. cookies, cake, chocolate bars, ice cream and pudding).
§ Sugar-Sweetened Beverages included soft drinks, fruit drinks, 100 % fruit juice, milkshakes and flavoured milk.
Data analysis
Participants who completed <50% of the FFQ were excluded from the DQI-C analysis (n45) leaving a final sample for analysis of 1215. Children with implausible intakes of more than 1 kg of vegetables and fruit per day (n 34) were imputed with the mean intake for the whole group after exclusion of the outliers. The final score was energy adjusted using the residual method to account for variations in the amount children eat( Reference Willett, Howe and Kushi 31 ). In brief, a linear regression analysis was performed with total daily kcal intake as the independent variable and unstandardized DQI-C score as the dependent variable to calculate energy-adjusted DQI-C score residuals for each child. Then, the predicted DQI score for a daily energy intake of 5439 kJ/d (1300 kcal/d) was added as a constant, which is the recommended energy intake for 3-year-old children( 32 ). This constant was added to the unstandardized residuals to obtain final standardized DQI-C scores adjusted to an energy intake of 5439 kJ/d (1300 kcal/d). Children were ranked based on their final DQI-C score and grouped into quartiles. Descriptive statistics were used to compare food and beverage intakes of children according to quartiles of the total DQI-C score. Differences in the proportion of children meeting CFG recommendations by quartiles of the DQI-C were assessed using Chi-squared tests. Linear regression models were used to assess associations between demographic characteristics and the DQI-C score. Analyses were performed in IBM SPSS Statistics version 24 and a P-value of <0·05 was used to determine statistical significance.
Results
Study participants
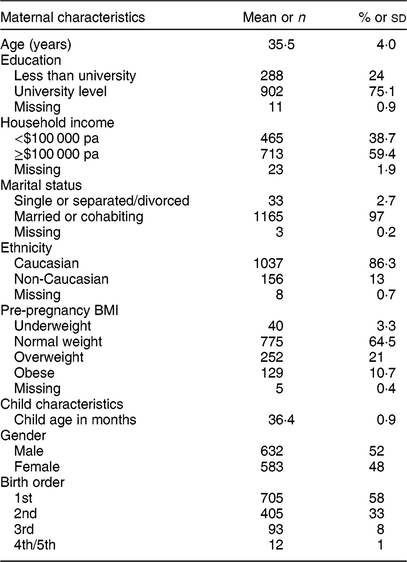
The characteristics of mothers in the APrON study are presented in Table 2. The mean age of mothers at the time these questionnaires were completed was 35·5 (sd 4·0) years. The majority were married or in a common law relationship (97 %) and had a Caucasian ethnicity (86 %). Mothers tended to be from a high socio-economic status (SES) background, with 75 % having a university education and 59 % having a household income of ≥$CAN100 000. Nearly two thirds of women had a normal pre-pregnancy BMI (64·5 %) and nearly one third were overweight or obese (32·7 %). Of the 3-year-old children, 52 % were boys and 48 % were girls, the majority were first-born children (58 %) with 33 % being second born.
Characteristics of mothers and children in the Alberta Pregnancy Outcomes and Nutrition Study
DQI-C scores
DQI-C scores were calculated for 1215 children and from a possible maximum score of 6, the mean was 3·69 (sd 0·6) with a minimum of 1·6 and maximum of 5·6. Of the six components, high mean scores were found for the Vegetables and Fruit (0·93 sd 0·1) and Meat and Alternatives (0·92 sd 0·2) components. The mean score for Milk and Alternatives was 0·8 (sd 0·3) and for Grain Products was lowest at 0·7 (sd 0·2). On the other hand, mean scores for Candy and Snacks and SSB were 0·04 (sd 0·2) and 0·41 (sd 0·4). Table 3 shows the mean g/d intake of each food group by quartiles of the DQI-C score. There was higher consumption of all healthy food groups and lower consumption of less healthy food groups by each quartile increment of the diet score. The most striking difference between those in the highest and lowest DQI-C quartiles was in SSB intake where the mean daily consumption of children in the lowest DQI-C quartile was 193 g/d v. 17 g/d of those in the highest quartile.
Consumption of food groups (g/d) and proportion of children meeting the CFG recommendations by quartiles of diet quality index score
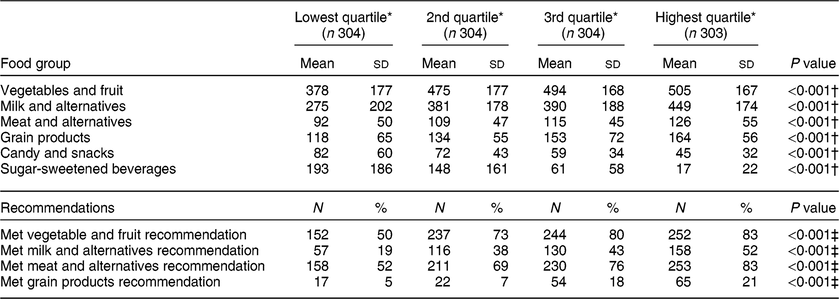
* DQI-C score quartile cut points: Lowest quartile < 3·27, 2nd quartile > 3·27 < 3·68, 3rd quartile > 3·68 < 4·17, Highest quartile > 4·17.
† P value from linear regression model of food group (g/d) as the outcome variable and diet quality score in quartiles as the independent variable.
‡ P value from Chi squared test for difference between categories.
DQI-C score and adherence with Canada’s Food Guide
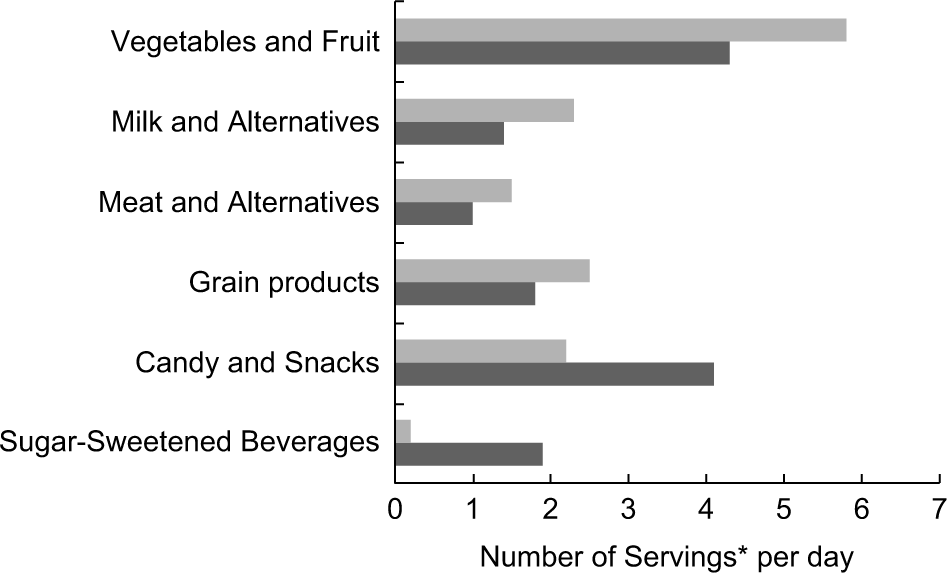
Most children met the CFG recommendations for Vegetables and Fruit (73 %) and Meat and Alternatives (70 %) intakes. However, 38 % and 13 % of children met recommendations for Milk and Alternatives, and Grain Products, respectively. Furthermore, 90 % of children consumed more than 20 g of candy or snacks per day and 35 % consumed more than 100 g of SSB per day. Table 3 shows the proportion of children meeting the recommendations from CFG differs according to quartiles of the DQI score. Fewer children in the lowest quartile met the recommendations compared to those in higher quartiles. Of those in the lowest quartile, 50 %, 19 %, 52 % and 5 % met the recommendations for Vegetables and Fruit, Milk and Alternatives, Meat and Alternatives, and Grain Products, respectively. In comparison, of those in the highest quartile, 83 %, 52 %, 83 % and 21 % met the recommendations for Vegetables and Fruit, Milk and Alternatives, Meat and Alternatives, and Grain Products, respectively. Figure 1 shows servings/d of each of the components in the diet score of children in the highest compared with the lowest quartile of the DQI-C score. Children in the lowest quartile consumed ∼1·5 fewer servings of Vegetables and Fruit and ∼2 more servings of Candy and Snacks and SSB per day compared with children in the highest quartile.
Daily frequency of consumption between children in the lowest (dark grey) and highest (light grey) quartiles of DQI-C score. *One serving as defined by Canada’s Food Guide for the food groups ‘Vegetables and Fruit’, ‘Milk and Alternatives’, ‘Meat and Alternatives’, and ‘Grain Products’. One serving was defined as the upper-limit allowed in the DQI-C score for the groups ‘Candy and Snacks’ (20 g), and ‘Sugar-sweetened beverages’ (100 g).
DQI-C score and sociodemographic characteristics
Linear regression models were used to assess associations between sociodemographic characteristics and diet quality scores. In univariate analyses, higher household incomes (β = 0·14, P = 0·001) and higher maternal education (β = 0·24, P < 0·001) were associated with higher children’s DQI-C scores. Having a mother who was single/divorced (β = −0·25, P = 0·034), from a non-Caucasian ethnicity (β = −0·14, P = 0·01), or who was obese prior to pregnancy (β = −0·21, P = 0·001), and children having older siblings (β = −0·10, P < 0·001) were associated with lower DQI-C scores. Table 4 shows the results from a multivariate model that included the variables that were associated in the univariate analysis. This shows that the mother’s level of education (β = 0·18, P < 0·001), ethnicity (β = −0·013, P = 0·02) and being obese prior to pregnancy (β = −0·17, P = 0·005) and child’s birth order (β = 0·11, P < 0·001) had independent effects on children’s DQI-C score. The F-value for the model was 8·89, significance <0·001, suggesting that the collective contribution of the variables was significant. The R 2 of the final model was 0·057 showing that just ∼6% of the variation in DQI-C score was explained by SES characteristics. Maternal age and child gender were not associated with DQI-C scores.
Multivariate linear regression model showing associations between sociodemographic and children’s Diet Quality Index (DQI-C) score
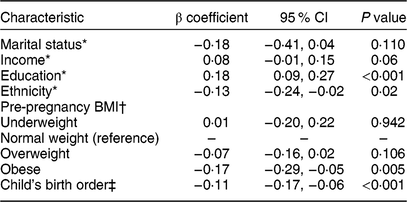
F (8,1171) = 8·89; P < 0·001; R 2 = 0·0537.
* Marital status in two groups: 1 = Married/Cohabiting; 2 = Single/Divorced/Widowed. Education in two groups: 1 = Less than university; 2 = University level. Income in two groups: 1 < $CAN100 000; 2 ≥ $CAN100,000. Ethnicity in two groups: 1 = Caucasian; 2 = Non-Caucasian.
† Pre-pregnancy BMI reference group = normal weight.
‡ Birth order = 1–5.
Discussion
We have shown that a DQI score developed to assess the diet quality of Canadian preschool children in Alberta is useful for ranking children according to adherence to CFG recommendations whilst taking account of consumption of less healthy foods.
Children in our study were reported to have a high consumption of vegetables and fruit. This result differs from reports of lower fruit consumption and inadequate vegetable consumption in other studies of preschool children in Western countries( Reference Manios, Kourlaba and Kondaki 33 - Reference Welker, Jacquier and Catellier 35 ). In particular, a recent (2018) US study of nationally representative 2- to 3-year old children reported that although the majority of children (73 %) consumed at least one vegetable in a day, the most commonly consumed vegetable was fried potato( Reference Welker, Jacquier and Catellier 35 ). However, this study used data from a single 24-h recall, which whilst useful for gathering detail on food intake, is not as accurate for collecting information on usual intakes( Reference Serdula, Alexander and Scanlon 36 ). In our study, unhealthy versions of food items were excluded from the overall score (e.g. fried chicken did not contribute to the Meat and Alternatives score), in accordance with Canada’s Food Guide recommendations, and therefore fried potato did not contribute to the high consumption of fruit and vegetables. It is likely that the higher vegetable and fruit consumption reported in our study results from a combination of factors including the FFQ having many items from this food group (n 24 of 100 items), over-reporting due to social-desirability bias by mothers, or differences in actual consumption. FFQ are known to overestimate at the food group level( Reference Serdula, Alexander and Scanlon 36 ).
We also observed a low adherence (13 %) to the Grain Products recommendation. Further analyses showed that breakfast cereals were the most commonly consumed grain product with 87 % of mothers reporting that their child consumed it each day. Interestingly, little is known about the nutritional quality of the cereal that children were consuming, i.e. high-fibre, low-sugar cereals (e.g. muesli) or high-sugar, nutrient-poor cereals. Currently, CFG does not discriminate on the type of cereal that contributes to meeting the recommendations for grain products, which is of concern as the difference in the nutrition profiles among cereals varies widely( Reference Schwartz, Vartanian and Wharton 37 ). Perhaps more worryingly was that most (87 %) children were not meeting the recommendation for daily Grain consumption, indicating that children of this age are unlikely to consume grain products that would be considered healthy, i.e. rice, pasta or wholemeal bread, whereas the consumption of savoury snacks was particularly common in our cohort and children may be consuming less healthy foods that contain grain but are also higher in fat, salt and/or sugar.
Most children were reported to consume meat and alternatives daily and, overall, 70 % of children met the recommendation. However, as with other food groups, this differed by DQI-C score with fewer children in the lowest quartile meeting this recommendation (52 %). Further analysis showed that nearly a quarter (23 %) of children were consuming processed meats daily and that this proportion was higher in those with lower DQI-C scores compared with higher scores (30 % v. 13 %, respectively Chi2 P < 0·001) (data not shown). As processed meats are not included in CFG, they were also excluded from our score. Processed meats frequently contain higher levels of sodium and saturated fat compared with non-processed meats( Reference Welker, Jacquier and Catellier 35 ) and therefore would not be recommended as a good source of protein. Other studies have found that young children consume processed meats as part of their usual diet( Reference O’Halloran, Grimes and Lacy 38 ). In a study of preschool children in Australia, 56 % consumed processed meat and, within the Meat and Alternatives component, processed meat contributed the most to children’s sodium intakes( Reference O’Halloran, Grimes and Lacy 38 ). It is unknown whether parents are aware that the recommendation for 3-year-old children to consume one portion of meat or alternatives a day excludes processed meat such as chicken nuggets, cold cuts and wieners. Therefore, public health messages in Canada may need to highlight the exclusion of processed meat as counting towards meeting the target intake for meat and alternatives.
Only 38 % of children in our study were reported to meet the CFG recommendation for Milk and Alternatives, which is 2 servings/d( 10 ). However, further analyses showed that 78 % were consuming at least one portion a day (data not shown). The finding that most children were consuming at least some food from this group daily is similar to that of a recent Feeding Infants and Toddlers study of food intakes of 2–3-year-old children in the US. They found that 84 % consumed at least some form of liquid milk on the day of reporting( Reference Welker, Jacquier and Catellier 35 ). Similarly, an analysis of 8390 4–18-year-old children in the US found that milk and alternative scores on the Healthy Eating Index (HEI) were higher in the age group 4–8 years than in older children and adolescents( Reference Banfield, Liu and Davis 39 ) but that dairy consumption still showed room for improvement. The inclusion of reduced-fat milk and alternatives is an important component of the diet as they provide calcium and protein. This is vital in childhood and adolescence, especially for bone health as peak bone mass is reached in early adulthood (between 20 and 30 years depending on sex and skeletal site( Reference Baxter-Jones, Faulkner and Forwood 40 )) and cannot be improved upon after this time. In our study, high-sugar milk products, including milkshake and flavoured milk alternatives, were included in the Sugar-Sweetened Beverages category as these beverages are not included in the Milk and Alternatives group in CFG. Therefore, increasing the consumption of reduced-fat milk and alternatives may be an important recommendation for young children in Canada.
We showed that intakes of foods in the Candy and Snacks component were common in this cohort. The mean amount of candy and snacks consumed was 65 (sd 46) g/d which was more than triple the amount used as a cut off in the DQI developed by Voortman et al. ( Reference Voortman, Jong and Geelen 19 ). Further analyses showed that the most commonly consumed candy or snack items were popcorn/pretzels and cookies, with reported consumption in 86 % and 68 % of children, respectively (data not shown). Regular intake of snack foods and candy by young children is common as studies of diet quality of children in Brazil and Europe also reported that preschool children exceeded recommendations for candies and snacks( Reference Voortman, Jong and Geelen 19 , Reference Leal, Schneider and França 34 ). Others have identified that the main sources of energy intake in preschool children were high-fat desserts (ice cream, cookies), fruit drinks, salty snacks, and sweet biscuits( Reference Leal, Schneider and França 34 , Reference Welker, Jacquier and Catellier 35 , Reference Johnson, Bell and Zarnowiecki 41 ). Frequent intakes of snack foods such as these are associated with high sedentary behaviour and high weight status of young children( Reference Gubbles, van-Assema and Kremers 42 ). Interventions to improve the diet quality of preschool children in Canada should target sustainable and feasible means to promote reductions in the amount and frequency of consumption of these snack foods.
The greatest difference between the diet quality of those in the lowest versus highest quartiles of DQI-C scores was seen in the consumption of SSB. Intake of SSB is strongly associated with high rates of obesity and overweight in young children( Reference Woodward-Lopez, Kao and Richie 43 , Reference Ludwig, Peterson and Gortmaker 44 ). For example, Ludwig et al. studied 548 school children prospectively over a 2-year period and found an association between BMI increase and intake of sugar-sweetened drinks from baseline to follow-up( Reference Ludwig, Peterson and Gortmaker 44 ). In the UK, the recent government policy aimed at reducing the childhood obesity rate has targeted the reduction of added sugar intake to <5 % of total energy intakes( 8 ). Therefore, policies to reduce overweight and obesity in Canadian children may also benefit from focusing on a reduction of SSB consumption. The inclusion of specific guidance on unhealthy foods is currently lacking in Canadian nutrition guidelines. For example, CFG gives a general statement to limit ‘other’ foods that are high in calories, fat, sugar or salt( 10 ) but provides no further information on these foods. Similar to the decision taken in our study, when Leal et al. adapted the HEI to preschool children in Brazil, the cut-off for consuming candy, chocolate or snacks was <1 serving per day( Reference Leal, Schneider and França 34 ). However, other DQIs developed for children have opted to have no scoring criteria for less healthy components due to the absence of unhealthy foods in their national nutrition guidelines( Reference Wong, Parnell and Howe 45 , Reference Marshall, Watson and Burrows 46 ). It is apparent that DQI scores often consider different dietary components that are usually context specific to the population being studied, therefore caution should be taken when comparing scores across studies and using scores to justify intervention.
There were differences in maternal sociodemographic characteristics across DQI-C quartiles. Mothers who were more highly educated (to university level) tended to have children with better DQI-C scores. This finding is consistent with many other studies of preschool children’s quality of diet( Reference Fisk, Crozier and Inskip 23 , Reference Jarman, Fisk and Ntani 24 , Reference Northstone and Emmett 47 , Reference Birch and Davison 48 ). In contrast, we observed that children whose mothers were obese prior to pregnancy and/or were not of Caucasian ethnicity tended to have lower DQI-C scores. An association between maternal weight status and children’s quality of diet has been reported previously( Reference Fisk, Crozier and Inskip 23 ). In a study of 1640 mother–child pairs that included assessments of both maternal pre-pregnancy BMI and maternal quality of diet, it was found that maternal diet quality explained the greatest variation in young children’s diets and the association between maternal pre-pregnancy BMI and children’s quality of diet was attenuated (but remained significant) when maternal diet was included in the model. Therefore, it is possible that the association between mothers’ pre-pregnancy BMI and children’s diet quality in our study is also due, in part, to the quality of the mother’s diet. Future studies should explore these relationships more fully.
In our study, most mothers identified as having a Caucasian ethnicity and, due to much smaller sample sizes in the other groups, it was necessary to dichotomize the variable, as has been done in other studies( Reference Fisk, Crozier and Inskip 23 ). Therefore, it is difficult to interpret the association between non-Caucasian mothers and lower DQI-C scores in children in our study. Future studies should include more participants from a broad range of ethnicities to elucidate this further. Finally, we found that children who had older siblings tended to have lower DQI-C scores than children who were first born. This is consistent with other studies( Reference Fisk, Crozier and Inskip 23 , Reference Northstone and Emmett 47 ). Researchers suggest that one reason for this may be the effect that older siblings have on the food environment( Reference Birch and Davison 48 ) and that less healthy foods, snacks, may be brought into the household for older siblings, which leads younger ones to consume them more frequently than if only one child was in the house( Reference Fisk, Crozier and Inskip 23 ).
Strengths and limitations
One limitation of this study was the lack of detail on some of the food items when using the FFQ to assess dietary data. With minimal details, certain food items were excluded from the DQI-C and this may have impacted results, e.g. mixed dishes. This highlights the importance of considering how the data will be analysed before the assessment tool is developed. Whilst FFQ are useful to assess usual intakes and were the appropriate assessment method for this study, it would be important to compare scores obtained from FFQ data against data from a more detailed dietary assessment method, such as a 3-d food record, as has been carried out in other validation studies( Reference Jarman, Fisk and Ntani 24 ). In addition, FFQ tend to overestimate intake( Reference Serdula, Alexander and Scanlon 36 ), as seen in this study with vegetable and fruit consumption, but we truncated component scores at 1 to try to account for this. As strengths, FFQ capture usual food intake and are preferred for ranking, rather than quantifying intakes( Reference Jarman, Fisk and Ntani 24 ). Also, FFQ are quick and inexpensive to administer( Reference Serdula, Alexander and Scanlon 36 ). Another limitation of this study was that most mothers were well-educated and had high incomes, so the results may not be generalizable to the wider Canadian population. As better-quality diets are often observed in higher socio-economic status families( Reference Jarman, Inskip and Ntani 49 ), it is likely that our results are a ‘best-case scenario’ and underestimate the effects in the wider population. Strengths of our study included a large sample size and being the first to adapt a diet quality index to assess adherence to CFG in a preschool-age sample.
Conclusions
This is the first study to develop a DQI for Canadian preschool children according to CFG. Despite some challenges of assessing dietary intake of children using an FFQ, we found that the DQI-C was able to rank children according to adherence to national dietary guidelines and consumption of less healthy foods, and may therefore be a useful tool to track diet quality of this population. Our results showed that candy and snack foods and SSB make up a considerable part of children’s diets and represent a specific target by policy makers and in the revision of Canadian dietary guidelines.
Acknowledgements
Acknowledgements: The authors would like to thank the participants of the APrON study and acknowledge Sarah Loehr, Dayna-Lynn Dymianiw, Anne Gilbert, Ala Qabaja, Andrea Deane, Lubna Anis and Yan Yuan for their assistance with data collection, preparation and database development. Financial support: M. J. is supported by a postdoctoral fellowship from Alberta Innovates. APrON was funded by Alberta Innovates. This work was also supported by the Alberta Children’s Hospital Foundation and the Canadian Institutes of Health Research Analyses reported in this manuscript were also funded through a Collaborative Research Innovation Opportunities Program Grant awarded to the ENRICH study team by Alberta Innovates – Health Solutions. Conflict of interest: The authors declare no conflict of interest. Authorship: M.J., N.V. and A.A. designed the study, developed the diet quality index and completed the analysis under the supervision of R.B. and G.G. G.G. and R.B. are co-investigators of the APrON study. M.J. wrote the manuscript with assistance from N.V. and A.A. All authors read, commented on and approved the manuscript prior to submission. Ethics of human subject participation: This study was conducted according to the guidelines laid down in the Declaration of Helsinki and all procedures involving human subjects/patients were approved by the University of Alberta and University of Calgary health research ethics boards. Written informed consent was obtained from all subjects/patients.


