

Palmer amaranth is one of the most problematic weed species for economically important crops such as corn, cotton, peanut, and soybean [Glycine max (L.) Merr.] (Webster Reference Webster2009). This species is an annual dioecious weed native to the Sonoran Desert that has spread and invaded areas in the southern half of the United States and more recently in the Midwest (Jhala et al. Reference Jhala, Sandell, Rana, Kruger and Knezevic2014; Ward et al. Reference Ward, Webster and Steckel2013).
The troublesome nature of Palmer amaranth in multiple cropping systems is mainly attributed to its ability to compete highly for resources such as water, nutrients, and light (Berger et al. Reference Berger, Ferrell, Rowland and Webster2015b; Massinga et al. Reference Massinga, Currie and Trooien2003; Ruf-Pachta et al. Reference Ruf-Pachta, Rule and Dille2013). Furthermore, characteristics such as diaheliotropism and a C4 photosynthetic pathway allow Palmer amaranth to quickly accumulate biomass compared with non–solar tracking weed species (Ehleringer Reference Ehleringer1983; Gibson Reference Gibson1998).
During the last two decades, Palmer amaranth control in several cropping systems has relied heavily on glyphosate, which eventually led to the evolution of resistant populations. The first confirmed case of glyphosate-resistant (GR) Palmer amaranth was reported in Georgia in 2004 (Culpepper et al. Reference Culpepper, Grey, Vencill, Kichler, Webster, Brown, York, Davis and Hanna2006). Since then, GR Palmer amaranth populations have been identified throughout the United States, most recently in Florida (Berger et al. Reference Berger, Ferrell, Dittmar and Leon2015a; Heap Reference Heap2016). As other herbicides have been used to manage GR populations, Palmer amaranth resistance has continued to increase and currently encompasses six different mechanisms of action (Heap Reference Heap2016).
Previous studies documenting growth differences between Palmer amaranth accessions (Bond and Oliver Reference Bond and Oliver2006; Horak and Peterson Reference Horak and Peterson1995) noted that selection can occur in response to human manipulation of the local environment, whether in response to consistent use of the same herbicide mechanisms of action or other management practices within the cropping system that ultimately favor Palmer amaranth growth and reproduction potential. However, few studies focused on adaptations in traits other than herbicide resistance. The importance of evolutionary adaptations to cropping systems as a component of weediness has been proposed previously, but the emphasis has been on obligate or predominantly selfing species, which are typically more likely to differentiate populations due to genetic drift and selection (Cardina and Brecke Reference Cardina and Brecke1989; Clements et al. Reference Clements, DiTommaso, Jordan, Booth, Cardina, Doohan, Mohler, Murphy and Swanton2004; Jordan Reference Jordan1989a, Reference Jordan1989b; Jordan and Jannink Reference Jordan and Jannink1997).
A common assumption about dioecious species such as Palmer amaranth is that they tend to exhibit little genetic differentiation among populations, due to obligate outcrossing and a large gene pool (Hamrick and Godt Reference Hamrick and Godt1996; Lambertini et al. Reference Lambertini, Riis, Olesen, Clayton, Sorrell and Brix2010). Moreover, there are multiple reports documenting higher genetic differentiation in monoecious than dioecious species (Cronberg Reference Cronberg1998; Dorken and Barrett Reference Dorken and Barrett2004; Obbard et al. Reference Obbard, Harris and Pannell2006; Shaw Reference Shaw1999). Using amplified fragment-length polymorphism markers, Chandi et al. (Reference Chandi, Milla-Lewis, Jordan, York, Burton, Zuleta, Whitaker and Culpepper2013) determined from the overall high genetic variability among Palmer amaranth populations from North Carolina and Georgia, that 77% of the variability was found within populations and only 19% was across populations, suggesting little genetic differentiation across populations that are geographically separated. However, neutral genomic markers are generally not under the influence of selection forces, so relying solely on them without considering phenotypic variability could limit our ability to identify evolutionary changes in weediness (Holderegger et al. Reference Holderegger, Kamm and Gugerli2006). Intraspecific variation in life-history traits has been documented in other Amaranthus species. For example, previous studies demonstrated that populations of tall waterhemp [Amaranthus tuberculatus (Moq.) Sauer], a dioecious weed species, have evolved different mechanisms to control seed dormancy and germination (Leon et al. Reference Leon, Bassham and Owen2006a, Reference Leon, Bassham and Owen2006b), and these differences affected seedling emergence patterns depending on tillage system (Leon and Owen Reference Leon and Owen2006). Furthermore, Bond and Oliver (Reference Bond and Oliver2006) found differences in leaf traits among Palmer amaranth accessions collected throughout the southern United States and proposed that these might be ecotypes, but their research did not address the causes of those differences. Therefore, despite the high genetic diversity and low differentiation among populations (measured with neutral markers), Palmer amaranth might be evolving life-history traits in response to selection forces in cropping systems.
At initial stages of GR evolution in a population, there can be a decrease of genetic diversity, and individuals carrying the trait that maximizes survival and reproduction (i.e., GR trait) will increase in frequency within the population. This might cause a “bottleneck” effect in the gene pool in GR populations, decreasing their ability to adapt to other environmental factors (Nei et al. Reference Nei, Maruyama and Chakraborty1975). However, in populations with high levels of outcrossing, such as Palmer amaranth, this reduction in genetic diversity could be quickly overcome by gene flow mediated by pollen movement from nearby populations. This opens up the possibility that GR populations might be able to rapidly acquire and fix alleles that are beneficial under high selection pressure.
We hypothesized that Palmer amaranth populations are adapting to specific cropping systems and consequently differentiating for specific life-history traits. Furthermore, we hypothesized that due to a relative higher frequency of individuals surviving and competing within the crop, GR populations could acquire mutations that will facilitate adaptation to cropping systems in positive ways that could lead to improved growth and reproduction compared with glyphosate-susceptible (GS) populations. Therefore, the objectives of the present study were to (1) characterize growth and morphological differences among Palmer amaranth populations collected in the southern United States, (2) determine the relationship between life-history trait differentiation among Palmer amaranth populations and glyphosate sensitivity, and (3) determine the relationship between life-history trait differentiation among Palmer amaranth populations and the characteristics of their cropping systems.
Materials and Methods
Seed Collection
Ten Palmer amaranth populations (as defined by Silvertown and Charlesworth Reference Silvertown and Charlesworth2001) were collected in northern Florida and central and southern Georgia in collaboration with local growers and extension agents who provided field management histories (Table 1). The cropping system locations were selected considering agronomic differences such as crop rotation, canopy characteristics, and management history. For example, we selected cropping systems with short-statured crops such as peanut and vegetables, with intermediate-statured crops (soybean), with taller canopies such as corn and cotton, and combinations of these. Also, the locations were selected to include populations differing in glyphosate use history (i.e., with and without glyphosate use during at least 8 yr).
Location and crop history of 10 Palmer amaranth populations.
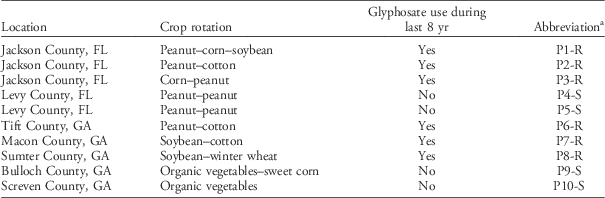
a Abbreviations: R, glyphosate resistant; S, glyphosate susceptible.
For each population, seeds were collected from plants located within the crop in the first 25 m from the border of the field. Seeds were collected from six to eight female plants (i.e., families) within a 3-m radius, keeping seeds from each female plant separated. Across locations, the populations were separated at least 2.5 km.
Growth and Morphology Study
Seeds were germinated in trays with potting mix and transplanted once they reached the 3-leaf stage to 10.7-L pots filled with the Ap horizon of a Red Bay sandy loam soil (Fine-loamy, kaolinite, thermic Rhodic Kandiudult) containing 1.6% organic matter, 69% sand, 16% silt, and 15% clay with pH 6. Pots were placed outdoors to maximize solar radiation, and plants were watered regularly with a drip-irrigation system to maintain a non–water limiting environment throughout the duration of the study. Pots were hand weeded when necessary to avoid any confounding effects due to emergence from the natural weed seedbank, although Palmer amaranth was absent from the soil-collection site. The experiment was arranged as a completely randomized design with 12 replications per population, and it was conducted twice. Each population comprised six families and two plants per family (n=12). This sampling strategy was done to avoid biases that can artificially increase the likelihood of finding differences across populations by ignoring intrapopulation variability.
Plants were grown until they reached anthesis. At this point, multiple traits were measured: days to flowering, plant height, and greenness measured using a SPAD 502 Plus Chlorophyll Meter (Spectrum Technologies, Lincoln, NE) on the second, third, and fourth leaves (Wood et al. Reference Wood, Reeves, Duffield and Edmisten1992) and averaging the results per plant. In order to assess allometric variability for leaf and canopy components, the second and third fully developed leaves were measured for petiole and leaf-blade length and for width at three equidistant sections along the leaf blade (tip, middle, and basal section). A similar procedure was followed for plant canopy before harvest, measuring plant height and dividing it into three equidistant sections along the main stem and measuring canopy width in these sections (Table 2). Shoots were clipped at the soil level, and fresh weight was determined. Furthermore, leaves were clipped and counted to determine total number of primary leaves and total number of axillary leaves. Foliar area was measured using a LI-3100 Leaf Area Meter (LI-COR Biosciences, Lincoln, NE). The apical inflorescence was clipped, and its length and dry weight were determined. Also, axillary inflorescences were removed from the plant, dried, and weighed separately.
Statistical significance of differences in morphological and growth traits among 10 Palmer amaranth populations determined with ANOVA.
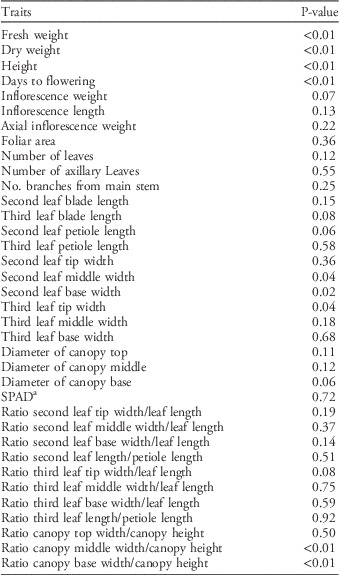
a SPAD, SPAD 502 Plus Chlorophyll Meter (Spectrum Technologies, Lincoln, NE).
Progeny Comparison Study
A progeny study was conducted to determine whether differences across populations in the growth and morphology study were mainly due to genetic differentiation and not maternal effects. Therefore, seeds from populations differing in several traits were produced under the same controlled environmental conditions (i.e., the same maternal environment). These seeds were then germinated, and plants were grown under controlled conditions. The premise of this study was that if the differences in the morphology study were due to maternal effects, the following generation should exhibit no differences among populations. Conversely, if the differences were determined by genetic variation, the progeny from the different populations should also differ. Thus, 10 plants (4 males and 6 females) of P1-R (Table 1) and 10 plants (4 males and 6 females) of P9-S were grown together in a growth chamber (Conviron S10H, Controlled Environments, Pembina, ND) with 28/25 C and 16/8-h day/night periods, and they were allowed to freely outcross and produce seed. The same procedure was conducted with P4-S and P5-S in a separate growth chamber. Seeds were collected at physiological maturity and dried at room temperature for 2 wk. Then, seeds were placed in petri dishes with distilled water and stored in the dark at 4 C for 3 wk. Following this stratification period, seeds of the progeny of each pair of populations (P1-R+P9-S and P4-S+P5-S) were randomly selected and were planted in 10.7-L pots with potting mix and grown in growth chambers under the previously described conditions. When seedlings reached the 2-leaf stage, they were thinned to leave a single plant per pot. Plants were grown for 35 d, and then growth and morphological parameters were determined as previously described in the growth and morphology study, with the exception of inflorescence variables. Harvest time was set to avoid competition between plants within the growth chamber based on preliminary studies. The experiment was a completely randomized design with four replications, and it was conducted twice.
Glyphosate Dose–Response
A dose–response experiment was conducted to characterize the sensitivity to glyphosate and determine the GR50 (glyphosate rate required to reduce plant dry weight 50%) for each population. The experiment was arranged as a completely randomized design with six replications (each population was tested, and each replication represented a family within that population) and was conducted twice. Glyphosate (Roundup PowerMax®, 540gaeL−1, Monsanto, St. Louis, MO) rates were 0, 210, 420, 840, 1,680, 3,360, 6,720, 13,440, and 26,880gaeha−1 (corresponding to 0X, 0.25X, 0.5X, 1X, 2X, 4X, 8X, 16X, and 32X times the label rate, respectively).
All plants were treated when they were 13-cm tall (4- to 5-leaf stage) and placed under greenhouse conditions and irrigated twice a day. At 3 wk after treatment shoots were harvested and dried for 72 h at 65 C to determine dry weight. Depending on the response to glyphosate, populations were categorized as either resistant (GR) or susceptible (GS) if they survived or died at 1X the label rate, respectively.
Statistical Analysis
Results were analyzed with ANOVA using R v. 0.98.1103 (R Core Team 2014). Data normality and homoscedasticity were evaluated, and values were square-root transformed for fresh weight, dry weight, and width of the second leaf base and log transformed for ratio of canopy base/height to meet ANOVA assumptions. Nevertheless, nontransformed means are presented. Mean separation was done using Tukey’s honestly significant difference (HSD; α=0.05). Since some of the evaluated variables were highly correlated, canonical discriminant analysis was conducted (Hair et al. Reference Hair, Anderson and Tatham1987) with SAS v. 9.4 (SAS Institute, Cary, NC) to determine the level of similarity among populations based on the multiple growth and morphological traits evaluated. For the progeny comparison study, a t-test (α=0.05) was conducted to compare progenies from the two crosses for each variable.
For each population, GR50 was determined with the ‘drc’ package (Ritz and Streibig Reference Ritz and Streibig2005) of the R Project statistical software (R Core Team 2014). A t-test (α=0.05) was performed to assess for a linear correlation between GR50 and the significant variables obtained from the morphology analysis. Also, t-tests (α=0.05) were conducted to compare traits between GR and GS populations.
Results and Discussion
No interactions between experimental run and any other factor were detected (P≥0.67), so data were pooled over the two experimental runs for the three studies. No differences for any of the variables were detected when comparing male vs. female plants (P≥0.38), and male:female ratio was 1:1 for all populations, so plant gender was not included in the analysis.
Differences in life-history traits among populations were detected (P<0.01) in the growth and morphology study. The traits with the most pronounced and consistent differences were days to flowering, height, dry and fresh weight, and variables related to leaf shape and canopy architecture (Table 2).
Differences in height between populations with the most extreme phenotypes were dramatic. The tallest Palmer amaranth populations (P1-R and P9-S) were 61% to 86% taller at anthesis than the shortest populations (Table 3). Interestingly, both P1-R and P9-S were collected from crop rotations including a tall crop such as corn, while the shortest plants originated from short-statured cropping systems such as peanut monoculture (Table 1). Differences were not only for plant height but also for dry weight (Table 3). The shortest populations, P4-S and P5-S, together with the population from organic vegetables (P10-S) exhibited the lowest values for both fresh and dry weight. In contrast, populations from conventional rotations that included crops with taller canopies (e.g., corn and cotton), such as P1-R and P2-R, almost doubled fresh and dry weight when compared with P4-S and P5-S.
Differences in morphology and growth traits among 10 Palmer amaranth populations.Footnote a
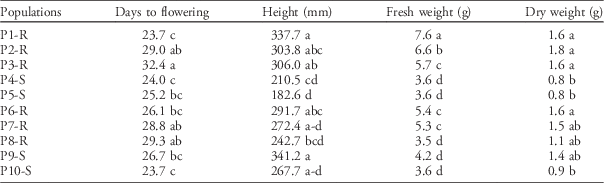
a Means within columns with the same letter were not statistically different based on Tukey’s HSD (α=0.05). Means are based on n=24 per population.
These results should be considered with caution, because the plants did not develop their full growth potential, likely being limited by the size of the pots. The fact that we documented differences between populations strongly suggests that the populations might be differentiating genetically, but we acknowledge that the magnitude of the differences might differ under favorable field conditions without constraints to root growth. It is also possible that the differences observed among populations might be the result of maternal effects during seed production. To confirm that the differences were due primarily to a genetic component, we produced progeny seed under controlled conditions from open-pollinated crosses of P1-R×P9-S (populations with large individuals) and of P4-S×P5-S (populations with small individuals). We allowed the outcrossing between two populations for each phenotype to determine whether even under conditions favoring genetic variability (i.e., outcrossing with a different population), the differences in growth and morphological parameters would still be present in the progeny, confirming the genetic control of the traits. This experiment demonstrated that plant dry weight and height of the progeny of populations with large individuals were 80% and 220% higher, respectively, than the progeny of the populations with small individuals (Figure 1). These results confirmed that although maternal effects might be present in the morphology study, it is very likely that the differences among populations detected in the growth and morphology study were mainly due to genetic factors. We also acknowledge that it is possible that phenotypic plasticity might be partially responsible for the differences observed among populations. However, by growing the plants under a single environment, our study better characterized genetically determined differences than variation in phenotypic plasticity (Colautti et al. Reference Colautti, Maron and Barrett2009; Sultan Reference Sultan2000; Valladares et al. Reference Valladares, Sanchez-Gomez and Zavala2006).
Plant height and dry weight of the progeny of Palmer amaranth populations P1-R×P9-S (large individuals) and of P4-S×P5-S (small individuals) grown in growth chambers for 35 d. Error bars indicate SE of the mean. n=8 for each group. P-values indicate the statistical significance of the difference between groups based on a t-test (α=0.05).

Differentiation in the number of days to reach flowering were also observed depending on the cropping system. Populations P1-R and P10-S flowered 36% sooner in comparison to P3-R, which flowered 32 d after transplanting (Table 3). Therefore, not only overall growth but also reproductive strategy varied among populations. Although we did not find any evident trend that might explain these differences, changes in flowering time have implications for weed–crop competition dynamics and reproductive success. Early flowering limits the production of photosynthetic tissue, thus reducing seed output (Bolmgren and Cowan Reference Bolmgren and Cowan2008; Shitaka and Hirose Reference Shitaka and Hirose1998), but this strategy might be advantageous if the weed will be outcompeted by the crop later in the season, consequently increasing mortality rate (Franks et al. Reference Franks, Sim and Weis2007). Conversely, delaying flowering could benefit seed production in populations that can outcompete a crop by giving more time to the weed to produce photosynthetic tissue and taller stems, thus ensuring access to light (Bolmgren and Cowan Reference Bolmgren and Cowan2008).
Populations also differed in sensitivity to glyphosate. Six populations were identified as GR and four populations as GS (Table 4). Susceptible plants died at rates ≤0.5X the label rate, having an average GR50 of 274gaeha−1 or 0.32X the label rate. Conversely, resistant populations exhibited low to no injury, even at 4X the label rate, with population P2-R exhibiting the highest GR50 of 5,162gaeha−1 or 6X the label rate (Table 4).
Glyphosate dose reducing dry weight 50% (GR50) based on nontreated control and resistance factor for 10 Palmer amaranth populations 21 d after treatment.
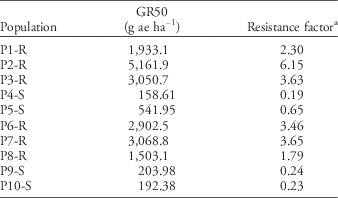
a Based on glyphosate label rate of 840gaeha−1.
Populations were grouped as GR and GS, and then the groups were compared for all the evaluated life-history traits to determine whether glyphosate resistance was related to differentiation among populations for life-history traits. Overall, GR populations took on average 3 more days to flower compared with GS populations (Table 5). Additionally, GR populations were 15% taller and had 50% more fresh and dry weight than GS populations. Palmer amaranth populations differed not only in size but also in morphological traits. For example, GR populations had 36% more branches and a more conical canopy (i.e., more elongated canopy and wider at the base) in contrast to the more spherical-shaped canopy of the GS populations, which were all from short-canopy crops (Table 5). These differences in canopy architecture are mainly under genetic control and are unlikely a maternal effect, since canopy architecture differences were maintained in the following generation produced under controlled environmental conditions (Figure 2). Thus, the progeny of P1-R×P9-S exhibited elongated triangular canopies, with the top section being narrower than the middle and base of the plant and with canopy width/height ratios smaller than 1 (Figure 2). In contrast, the progeny of P4-S×P5-S were more spherical (i.e., no differences in canopy width/height ratios along the stem). The results indicate that GR Palmer amaranth populations have differentiated from GS populations and are capable of producing individuals that grow bigger and faster, perhaps increasing their success in cropping systems.
Section width/total plant height ratio at the top, middle, and base of the canopy of the progeny of Palmer amaranth populations P1-R×P9-S (large individuals) and of P4-S×P5-S (small individuals) grown in growth chambers for 35 d. Error bars indicate SE of the mean. n=8 for each group. P-values indicate the statistical significance of the difference between groups based on a t-test (α=0.05).

Differences in traits between glyphosate-resistant (GR) and glyphosate-susceptible (GS) populations of Palmer amaranth.
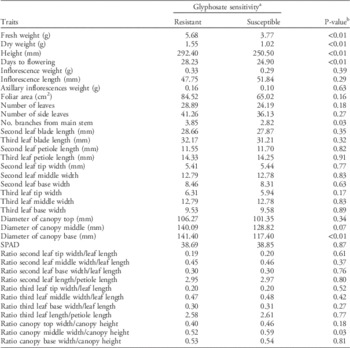
a Analysis was conducted based on n=144 for GR and n=96 for GS.
b Statistical significance of the differences between GR and GS populations based on a t-test (α=0.05).
A canonical discriminant analysis (CDA) was conducted to assess the relationship among Palmer amaranth populations. The analysis accounted for 69% of the total observed variance between correlated variables, successfully explaining the relationship between populations based on morphological and physiological traits (Khattree and Naik Reference Khattree and Naik2000) (Figure 3). However, populations were not grouped based on glyphosate resistance. For example, the susceptible population P10-S was far apart from other susceptible populations in the CDA, and the susceptible population P9-S was more closely associated with the resistant population P6-R (Figure 3). GS populations were also located at longer vectors than GR populations, showing a greater differentiation between them. No relationships were found between GR50 values and the life-history traits that differed among populations using linear regression (P≥0.67). Furthermore, geographical distribution only partially explains similarities among populations. For example, populations P7-R and P8-R grouped together and both came from adjacent counties. Conversely, population P6-R from Tift County, GA, which was geographically closer to P7-R and P8-R, was more closely associated with P9-S and P2-R, which originated from Bulloch County, GA, and Jackson County, FL, respectively (Figure 1; Table 1).
Canonical discriminant analysis based on morphological traits for 10 Palmer amaranth populations. The first two canonical axes (CAN 1 and CAN 2) accounted for 69% of the total observed variance.

The low correlation between differentiation in life-history traits among populations and glyphosate resistance or geographic distribution suggests that other forces, such as cropping systems, are responsible for Palmer amaranth population differentiation. In particular, our results indicate that crop canopy height is an important driver of differences in Palmer amaranth plant height, regardless of location and/or glyphosate resistance. For instance, the tallest populations came from cropping systems including corn (P1-R, P9-S, and P3-R), which has a tall canopy, while populations that had the shortest individuals came from cropping systems with crops with short canopies, such as peanut and vegetables (e.g., P4-S, P5-S, and P10-S) (Table 3; Figure 1).
Despite the fact that other studies determined little genetic differentiation among Palmer amaranth populations using neutral genomic markers (Chandi et al. Reference Chandi, Milla-Lewis, Jordan, York, Burton, Zuleta, Whitaker and Culpepper2013), our findings and those of Bond and Oliver (Reference Bond and Oliver2006) show that Palmer amaranth populations differ in key traits, and these differences might be related to cropping history. It is important to note that despite the fact that there was no direct relationship between glyphosate sensitivity and population differentiation based on the CDA, GR populations were able to adapt better to their cropping systems by producing taller stature, more biomass per plant, and a more elongated canopy architecture than GS populations. Giacomini et al. (Reference Giacomini, Westra and Ward2014) found no fitness penalties associated with GR in Palmer amaranth, although they observed high variability in fitness-related measurements even among full-sib plants. Therefore, it is necessary to consider how herbicide resistance traits interact with other life-history traits at the population level to properly understand fitness of resistant populations. Our data suggest that Palmer amaranth populations containing the GR trait could be modifying life-history traits in response to selection pressures in the cropping system, further increasing their growth and reproduction potential in comparison with GS populations.
We propose that these adaptations are likely not a pleiotropic effect of the GR trait (i.e., a single gene could be conferring all the phenotypic differentiation observed) but that selection of life-history traits is closely related to the GR trait, because coevolutionary processes favored by cropping systems with GR crops. Jordan (Reference Jordan1989b), using heritability estimates of growth traits based on experimental competition studies, predicted that non-weedy coastal populations of poorjoe (Diodia teres Walt.), a selfing annual species (Hereford Reference Hereford2009), can evolve growth rates similar to and potentially higher than weedy populations in response to soybean competition. For Palmer amaranth GR individuals, glyphosate is no longer the most limiting factor for survival, and other selection forces become critical after the GR trait has become predominant in a population. Therefore, the ability to tolerate or outcompete the crop is a more important selection force for individuals that survive herbicide applications. Furthermore, because of the likely initial decrease in the gene pool when the population becomes GR (i.e., bottleneck effect; Nei et al. Reference Nei, Maruyama and Chakraborty1975) plus the high potential for gene flow due to obligate outcrossing, GR Palmer amaranth populations are more likely to evolve genetic structures that favor their success in the specific cropping systems in which they are located than species that are mainly self-pollinated or that have higher effective population sizes (Morran et al. Reference Morran, Parmenter and Phillips2009). This process could also explain why one might expect a more rapid selection in GR populations than GS populations. Thus, a GR population with a small effective population size will be able to more rapidly fix a new beneficial mutation acquired by gene flow because this mutation will have a high relative frequency. Conversely, in a GS population with a larger effective population size, the new beneficial mutation will have a relatively lower frequency and could be lost due to genetic drift or it will take more selection cycles to reach a frequency that changes the fitness of the population. In general, this high capacity for adaptation could explain the recent expansion of Palmer amaranth in multiple cropping systems throughout the United States (Davis et al. Reference Davis, Schutte, Hager and Young2015; Ward et al. Reference Ward, Webster and Steckel2013), despite its being a native species from the desert region of the Southwest (Norsworthy et al. Reference Norsworthy, Griffith, Scott, Smith and Oliver2008; Sosnoskie and Culpepper Reference Sosnoskie and Culpepper2014).
Traditionally, the use of crop rotation has been a fundamental tool for the control of troublesome weed species. Rotating a short canopy crop with a taller and more competitive one (i.e., soybean−corn rotation) can help maintain weed seedbanks at manageable levels (Ball Reference Ball1992; Liebman and Dyck Reference Liebman and Dyck1993; Swanton and Weise Reference Swanton and Weise1991; Westerman et al. Reference Westerman, Liebman, Menalled, Heggenstaller, Hartzler and Dixon2005). However, we cannot ignore evolutionary changes resulting from selection pressure exerted by highly competitive crops on weeds, particularly for species with high levels of outcrossing and high genetic variability. Our results highlight the necessity to consider whether the use of highly competitive crops (e.g., tall and dense canopies) can eventually promote the selection of more aggressive weed biotypes and how rotations and weed management strategies should be designed to avoid this undesirable outcome. The principle of using crop rotations with diverse control practices and varying patterns of resource availability for weed suppression (Liebman and Dyck Reference Liebman and Dyck1993; Westerman et al. Reference Westerman, Liebman, Menalled, Heggenstaller, Hartzler and Dixon2005) not only can help manage weed populations from a demographic perspective, but also might prevent evolutionary processes favoring weediness. For example, adding a 2-yr phase of bahiagrass (Paspalum notatum Fluegg) to a cotton–peanut rotation enabled managing Palmer amaranth seedbanks with fewer herbicide applications than in a conventional rotation (Leon et al. Reference Leon, Wright and Marois2015). This was due to the asynchrony between the growth cycles of bahiagrass and Palmer amaranth and the frequent mowing of the crop during the 2 yr (Leon et al. Reference Leon, Wright and Marois2015). A Palmer amaranth population that is becoming taller and producing more biomass because it is adapting to a tall competitive crop can be in a disadvantageous situation if a row crop phase is replaced by a pasture/forage where mowing is conducted regularly. In this case, gains in plant height and weight will be detrimental, and a negative selection of these traits will occur during the pasture/forage phase. Identifying life-history traits under selection in our current cropping systems using population genetics and multivariate analyses will make it possible to design crop rotations and choose specific weed control tools that will prevent the fixation of these traits in the population and compensate for situations in which populations have diverged and exhibit different behaviors (Cardina and Brecke Reference Cardina and Brecke1989; Clements et al. Reference Clements, DiTommaso, Jordan, Booth, Cardina, Doohan, Mohler, Murphy and Swanton2004; Jordan Reference Jordan1989b; Jordan and Jannink Reference Jordan and Jannink1997). Palmer amaranth seems to be a useful model to explore evolutionary consequences of crop rotation structure and cropping system components on weediness.
Acknowledgments
We greatly appreciate the help of Ted Webster, Carroll Johnson, Josh Thompson, and William Starr for their guidance and advice during seed collection. We also thank Sharon Howell, Michael Dozier, and Rocio van der Laat for technical support; Edzar van Santen for statistical advice; and two anonymous reviewers for their valuable suggestions. This research was partially funded by a New Investigator Award to RGL from the Institute of Food and Agricultural Sciences, University of Florida.


