


1. Introduction
Capillary rise describes the spontaneous and natural flow of wetting liquids in narrow spaces with characteristic length scales smaller than the capillary length. It is a long-standing fluid flow phenomenon that has gained momentum with emerging fields such as miniaturisation and microfluidics. The ability of the liquid to flow without external intervention is now at the heart of many practical applications, such as capillary pumps and biochip-integrated systems for drug delivery and testing, with recent developments in the capillary rise of liquids in sharp corners (Wu, Duprat & Stone Reference Wu, Duprat and Stone2024), liquid–liquid displacement in glass capillaries (André & Okumura Reference André and Okumura2020; Patrascu & Rasuceanu Reference Patrascu and Rasuceanu2022), the flow of shear-thinning fluids (Steinik et al. Reference Steinik, Picchi, Lavalle and Poesio2024; Wang et al. Reference Wang, Yuan, Chen, Yao, Yu and Wang2024), capillary rise in partially saturated porous media (Siddique & Anderson Reference Siddique and Anderson2024), peristome-like micro-structured capillary tubes that actuate larger amounts of liquid (Li et al. Reference Li, Dai, Gao, Wang, Dong and Jiang2019; Liu et al. Reference Liu, Gao, Li, Liu, Chong, Gu and Zhou2024), and rough capillary rise (Panter et al. Reference Panter, Konicek, King, Jusufi, Yeganeh and Kusumaatmaja2023).
In a typical capillary rise experiment, a narrow tube is placed in contact with the free surface of a liquid. The liquid will naturally flow into the tube due to the negative capillary pressure supported by the liquid meniscus. To describe the flow dynamics, one tries to predict the position of the meniscus in time as the level of the liquid rises. Flows in submerged capillary tubes represent a distinct subclass of capillary rise phenomena.
Previous studies have shown that superhydrophobic capillary tubes immersed in water are invaded by air, a phenomenon known as capillary descent, which represents an inverted capillary rise problem with distinct dynamical features (Delannoy et al. Reference Delannoy, de Maleprade, Clanet and Quéré2018). Mullins & Braddock (Reference Mullins and Braddock2012) have discussed the capillary rise of a liquid within a partially immersed moving tube. The authors developed a model for the capillary rise in tubes continuously immersed into or removed from a liquid reservoir.
Walls, Dequidt & Bird (Reference Walls, Dequidt and Bird2016) have studied submerged capillary tubes filled with the surrounding liquid. Their study discusses the capillary flow of a two-liquid system in a vertical, submerged, capillary tube, emphasising how viscosity and gravity modify the dynamics of spontaneous displacement in the early and late viscous regimes.
Immersed capillaries are also at the core of bubble formation processes. Chuang & Goldschmidt (Reference Chuang and Goldschmidt1970) studied the bubble formation process from an immersed capillary tube in quiescent and coflowing streams by actively controlling the gas flow rate. Blanchard & Syzdek (Reference Blanchard and Syzdek1977) have proposed a relation between the size of the bubbles and the capillary tube’s inner radius. Oguz & Prosperetti (Reference Oguz and Prosperetti1993) have shown the existence of different growth regimes determined by a critical value of the gas flow rate, and studied the degree of control on bubble size that can be gained by immersing the capillary in a parallel upward flow. The immersed capillary method has been considered in the study of the bubble formation process at specific pressures, and also to establish the role of surface tension on bubble growth (Vazquez, Leifer & Sánchez Reference Vazquez, Leifer and Sánchez2010, Boubendir, Chikh & Tadrist Reference Boubendir, Chikh and Tadrist2020).
Most previous studies within the research area involving immersed capillary tubes explore the displacement of another immiscible liquid by capillary action or the bubble formation process by controlling the gas flow rate. We have found no reference to the natural filling process of a vertical capillary tube immersed in water. The present study extends the domain of capillary flows to underwater capillaries, with contributions to the development of potential applications in the absorption kinetics of underwater recycled aggregates (Liang et al. Reference Liang, Hou, Sun, Li, Bai, Tian and Liu2021), submersible capillary sensors and analysers (Drevinskas et al. Reference Drevinskas, Mora, Santos, Mauro, Noell and Willis2023), water-based energy devices and capillary pumps (Huang et al. Reference Huang2016), and underwater capillary adhesion strategies (Zheng et al. Reference Zheng2022).
We examine the natural filling process of a submerged, empty, capillary tube in water. We perform experiments describing the spontaneous flow dynamics in underwater capillaries, and present a theoretical model that captures the relevant features of the filling process. The paper is structured as follows. Section 2 describes in detail the natural filling process of a submerged capillary tube, § 3 shows the derivation of the theoretical model, and § 4 presents a comparison between the experimental data and the predictions, also highlighting the limitations of the theoretical model.
2. The natural filling process of a submerged capillary tube
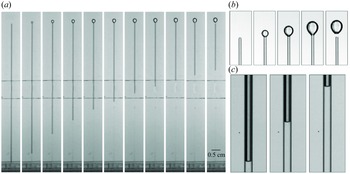
Consider a vertical capillary tube submerged in water, with its lower end in contact with a flat solid material that blocks water from entering the tube before its complete immersion. If we slightly move the capillary tube away from the solid material, then water will invade and eventually fill the entire tube. As water invades the capillary tube, the air exits at the other end and forms a bubble. A typical filling process is shown in figure 1, with a detail of the bubble that forms and detaches at the other end of the capillary.
(a) Images showing a submerged capillary tube and its natural filling process, with a bubble forming at the other end (39 ms between each frame). (b) As water enters the capillary, the air is removed as a bubble that detaches from the tube when buoyancy exceeds the surface tension forces. (c) Images showing a typical water–air meniscus that contributes to the filling process of a capillary tube ( $0.42$
mm in diameter).
$0.42$
mm in diameter).

The filling process is driven by capillarity and the hydrostatic pressure difference between the two ends. The convex liquid meniscus that forms inside the tube (shown in figure 1 c) sustains a capillary pressure that forces the liquid to rise and fill the tube. Depending on the tube’s radius and length, the hydrostatic pressure difference can also significantly contribute to the initial stages of the filling process. As water rises in the capillary, the process is resisted by a combination of gravitational, viscous and inertial effects.
The movement of water in capillary tubes has been a long-standing problem since the early works of Bell & Cameron (Reference Bell and Cameron1906), Lucas (Reference Lucas1918) and Washburn (Reference Washburn1921), where the derivation of the equation of motion assumes capillary action, a fully developed Poiseuille flow, and a constant contact angle. Later studies by Blake & Haynes (Reference Blake and Haynes1969), Hoffman (Reference Hoffman1975), Voinov (Reference Voinov1976), Cox (Reference Cox1986) and Bracke, De Voeght & Joos (Reference Bracke, De Voeght and Joos1989) have emphasised the dynamic nature of the contact angle. The flow depicted in figure 1 is also a function of the dynamic contact angle of the meniscus, a characteristic feature of all capillary rise phenomena. The description of such flows always requires the coupling of the governing equations with a model that considers the velocity dependence of the contact angle.
A distinct feature of underwater capillary rise is the airflow at the outlet. Compared with the classical case of capillary rise where the end tip is practically surrounded by the same fluid that exits the tube, for an immersed capillary tube, the air is removed underwater. The flow expels air from the capillary tube in the form of bubbles at the other end. In the process, the bubble also displaces the liquid in which it grows, adding to the resistive forces that shape the capillary flow. This aspect requires the coupling with a bubble-growth model that gives the phenomenon its distinct dynamical trait.
Depending on the tube’s length, several bubbles may detach during the filling process. The bubble’s detachment may also significantly change the general flow dynamics due to the high capillary pressures that characterise the pitch-off regime, a detail that will be discussed in § 4.3.
Schematic of the capillary rise process, showing the relevant physical parameters.

3. Theoretical model
3.1. Momentum balance
We consider an empty capillary tube of length $L$
and radius
$L$
and radius $R$
submerged in water at distance
$R$
submerged in water at distance $h_0$
from the free surface. A representation of the phenomenon and the relevant parameters are given in figure 2.
$h_0$
from the free surface. A representation of the phenomenon and the relevant parameters are given in figure 2.
When both ends are open, the outer liquid (water) will invade the capillary tube because of the combined forces of hydrostatic pressure and capillarity, forcing the air out of the tube as bubbles. We aim to describe the position of the meniscus $z(t)$
as a function of time. The rate of change of the liquid’s momentum as it flows into the capillary tube is given by
$z(t)$
as a function of time. The rate of change of the liquid’s momentum as it flows into the capillary tube is given by
 \begin{align} \nonumber\\[-24pt]\frac {{\rm d}}{{\rm d}t}\left .\left [\left (m_l+m_g\right )\dot {z}\right )\right ]=\unicode{x03C0} R^2 p_0-\unicode{x03C0} R^2 p_1+2 \unicode{x03C0} R z \sigma - m_l g, \end{align}
where $m_l=\unicode{x03C0} R^2 z \rho$
is the mass of the liquid,
$m_l=\unicode{x03C0} R^2 z \rho$
is the mass of the liquid, $\rho$
is the density of water,
$\rho$
is the density of water, $m_g=\unicode{x03C0} R^2 (L-z) \rho _g$
is the mass of the gas,
$m_g=\unicode{x03C0} R^2 (L-z) \rho _g$
is the mass of the gas, $\rho _g$
is the gas density, and
$\rho _g$
is the gas density, and $\sigma$
represents viscous stresses discussed in more detail below. The first term on the right-hand side represents the force exerted at the entrance with
$\sigma$
represents viscous stresses discussed in more detail below. The first term on the right-hand side represents the force exerted at the entrance with
 \begin{equation} p_0=p_{at}+\rho g (h_0+L)-\tfrac {1}{2}\rho \dot {z}^2, \end{equation}
where $\dot {z}$
denotes the velocity of the liquid.
$\dot {z}$
denotes the velocity of the liquid.
The second term on the right-hand side can be obtained by considering the pressure jump at the liquid–gas interface via Laplace pressure,
 \begin{equation} p_1=p_{gi}-\frac {2\gamma }{R}\cos \theta , \end{equation}
where $p_{gi}$
is the gas pressure at the interface,
$p_{gi}$
is the gas pressure at the interface, $\gamma$
is the surface tension, and
$\gamma$
is the surface tension, and $\theta$
is the dynamic (apparent) contact angle.
$\theta$
is the dynamic (apparent) contact angle.
We neglect the viscous resistance of the gaseous phase, $8\unicode{x03C0} \eta _g(L-z)\dot {z}$
, knowing that
$8\unicode{x03C0} \eta _g(L-z)\dot {z}$
, knowing that $L-z$
and
$L-z$
and $\dot {z}$
decrease rapidly. Also, Hultmark, Aristoff & Stone (Reference Hultmark, Aristoff and Stone2011) proposed that the viscous contribution of the gaseous phase should be considered when
$\dot {z}$
decrease rapidly. Also, Hultmark, Aristoff & Stone (Reference Hultmark, Aristoff and Stone2011) proposed that the viscous contribution of the gaseous phase should be considered when $\eta _g L/(\eta R) \gg 1$
. In our case, for the
$\eta _g L/(\eta R) \gg 1$
. In our case, for the $80$
mm long capillaries with inner diameters
$80$
mm long capillaries with inner diameters $0.42$
mm and
$0.42$
mm and $1.15$
mm, we find that the ratios are approximately
$1.15$
mm, we find that the ratios are approximately $8$
and
$8$
and $3$
, respectively, values that are below the required order of magnitude. The same values for this characteristic ratio have been found in several published studies in capillarity where the viscosity of the gaseous phase is neglected (Quéré et al. Reference Quéré, Raphaël and Ollitrault1999; Wu et al. Reference Wu, Nikolov and Wasan2017b
; Hamraoui et al. Reference Hamraoui, Thuresson, Nylander and Yaminsky2000; Ruiz-Gutiérrez et al. Reference Ruiz-Gutiérrez, Armstrong, Lévêque, Michel, Pagonabarraga, Wells, Hernández-Machado and Ledesma-Aguilar2022).
$3$
, respectively, values that are below the required order of magnitude. The same values for this characteristic ratio have been found in several published studies in capillarity where the viscosity of the gaseous phase is neglected (Quéré et al. Reference Quéré, Raphaël and Ollitrault1999; Wu et al. Reference Wu, Nikolov and Wasan2017b
; Hamraoui et al. Reference Hamraoui, Thuresson, Nylander and Yaminsky2000; Ruiz-Gutiérrez et al. Reference Ruiz-Gutiérrez, Armstrong, Lévêque, Michel, Pagonabarraga, Wells, Hernández-Machado and Ledesma-Aguilar2022).
As the liquid rises into the capillary tube, a bubble forms and grows at the other end. We denote by $p_g$
the air pressure in the bubble. Assuming negligible viscosity for the gas, we write the unsteady Bernoulli equation on a streamline between the interface and the bubble’s centre for an inviscid fluid, and obtain
$p_g$
the air pressure in the bubble. Assuming negligible viscosity for the gas, we write the unsteady Bernoulli equation on a streamline between the interface and the bubble’s centre for an inviscid fluid, and obtain $p_{gi}+\rho _g \dot {z}^2/2=p_g+\rho _g g(L-z+R_b)+\int _{A}^B \rho _g ({\partial v}/{\partial t})\,{\rm d}l$
, where the last term can be approximated as
$p_{gi}+\rho _g \dot {z}^2/2=p_g+\rho _g g(L-z+R_b)+\int _{A}^B \rho _g ({\partial v}/{\partial t})\,{\rm d}l$
, where the last term can be approximated as $\rho _g\ddot {z}(L-z+R_b)$
, with
$\rho _g\ddot {z}(L-z+R_b)$
, with $R_b$
the bubble radius.
$R_b$
the bubble radius.
We aim to derive an equation for the acceleration of the interface $\ddot {z}$
, and numerically solve in Matlab the resulting differential equation. The procedure requires us to divide all terms by
$\ddot {z}$
, and numerically solve in Matlab the resulting differential equation. The procedure requires us to divide all terms by $\unicode{x03C0} R^2\rho z$
. Since
$\unicode{x03C0} R^2\rho z$
. Since $\rho _g/\rho \sim 10^{-3}$
, and knowing that the velocity of the liquid decreases in time as water enters the capillary tube, we can discard all terms dependent on
$\rho _g/\rho \sim 10^{-3}$
, and knowing that the velocity of the liquid decreases in time as water enters the capillary tube, we can discard all terms dependent on $\rho _g$
, therefore
$\rho _g$
, therefore $p_{gi}\approx p_g$
. It is important to mention that one can also opt for keeping all terms dependent on
$p_{gi}\approx p_g$
. It is important to mention that one can also opt for keeping all terms dependent on $\rho _g$
in the final equation, but the predictions will not differ substantially (an aspect that has been verified) since the density ratio is three orders smaller than unity.
$\rho _g$
in the final equation, but the predictions will not differ substantially (an aspect that has been verified) since the density ratio is three orders smaller than unity.
As the liquid enters the capillary tube, the air exits at the other end of the tube and forms a bubble. We consider the growth of a spherical bubble in a surrounding Newtonian liquid. The bubble’s surface moves with velocity $\dot {R}_b$
, displacing the surrounding liquid (Elshereef, Vlachopoulos & Elkamel Reference Elshereef, Vlachopoulos and Elkamel2010). Except in extreme conditions, gas viscosity, gas inertia and compressibility effects can be safely neglected (Scriven Reference Scriven1995). The pressure difference at the bubble’s surface is then given by
$\dot {R}_b$
, displacing the surrounding liquid (Elshereef, Vlachopoulos & Elkamel Reference Elshereef, Vlachopoulos and Elkamel2010). Except in extreme conditions, gas viscosity, gas inertia and compressibility effects can be safely neglected (Scriven Reference Scriven1995). The pressure difference at the bubble’s surface is then given by
 \begin{equation} p_g-p_e=4\eta \frac {\dot {R}_b}{R_b}+\frac {2\gamma }{R_b}+\rho \left (R_b\ddot {R}_b+\frac {3}{2}\dot {R}_b^2\right ), \end{equation}
where $\eta$
is the viscosity of the liquid,
$\eta$
is the viscosity of the liquid, $p_e=p_{at}+\rho g (h_0-R_b)$
is the hydrostatic pressure far away from the bubble, and
$p_e=p_{at}+\rho g (h_0-R_b)$
is the hydrostatic pressure far away from the bubble, and $R_b$
is the bubble radius. The equation is also known as the extended Rayleigh equation (Plesset Reference Plesset1949; Scriven Reference Scriven1995). The terms on the right-hand side represent viscous stresses, capillary pressure and liquid inertia. By considering mass conservation, one can relate the position of the liquid in the tube
$R_b$
is the bubble radius. The equation is also known as the extended Rayleigh equation (Plesset Reference Plesset1949; Scriven Reference Scriven1995). The terms on the right-hand side represent viscous stresses, capillary pressure and liquid inertia. By considering mass conservation, one can relate the position of the liquid in the tube $z(t)$
with the bubble radius
$z(t)$
with the bubble radius $R_b(t)$
. We find that the time variation of the bubble’s volume is equal to the flow rate of air that enters the bubble,
$R_b(t)$
. We find that the time variation of the bubble’s volume is equal to the flow rate of air that enters the bubble,
 \begin{equation} \frac {{\rm d}\mathcal{V}_b}{{\rm d}t}=\dot {z}\unicode{x03C0} R^2\ \rightarrow\ 4\unicode{x03C0} R_b^2 \frac {{\rm d}R_b}{{\rm d}t}= \frac {{\rm d}z}{{\rm d}t} \unicode{x03C0} R^2\ \rightarrow\ \int _0^{R_b} 4 \unicode{x03C0} R_b^2\, {\rm d}R_b= \int _{z_0} ^z \unicode{x03C0} R^2\, {\rm d}z, \end{equation}
which yields
 \begin{equation} R_b=\tfrac {1}{2}(6R^2)^{1/3}(z-z_0)^{1/3}, \end{equation}
where we have considered the general case when initially the tube is filled up to $z_0$
with water. This would correspond to cases when multiple bubbles form and detach during the filling process of the capillary tube. For an empty capillary tube,
$z_0$
with water. This would correspond to cases when multiple bubbles form and detach during the filling process of the capillary tube. For an empty capillary tube, $z_0=0$
. Combining (3.6) and (3.4), we obtain
$z_0=0$
. Combining (3.6) and (3.4), we obtain
 \begin{equation} p_g=p_e+\frac {4 \eta \dot {z}}{3(z-z_0)}+\frac {4\gamma }{(6R^2)^{1/3}(z-z_0)^{1/3}}+\frac {\rho (6R^2)^{2/3} \ddot {z}}{12(z-z_0)^{1/3}}- \frac {\rho (6R^2)^{2/3} \dot {z}^2}{72 (z-z_0)^{4/3}}. \end{equation}
The third term on the right-hand side of (3.1) represents viscous friction, where $\sigma =-4\eta \dot {z}/R$
are the viscous stresses assuming a local Poiseuille flow, and the fourth term represents the weight of the liquid column.
$\sigma =-4\eta \dot {z}/R$
are the viscous stresses assuming a local Poiseuille flow, and the fourth term represents the weight of the liquid column.
After replacing $p_0$
,
$p_0$
, $p_1$
and
$p_1$
and $\sigma$
, we divide (3.1) by
$\sigma$
, we divide (3.1) by $\rho \unicode{x03C0} R^2 z$
and obtain the acceleration
$\rho \unicode{x03C0} R^2 z$
and obtain the acceleration
 \begin{align} \ddot {z}&=\left [\frac {g L}{z}-\frac {3 \dot {z}^2}{2 z}-\frac {8\eta \dot {z}}{\rho R^2}-g +\frac {2 \gamma }{\rho R z}\cos {\theta }+\frac {g (6R^2)^{1/3}(z-z_0)^{1/3}}{2 z}\right . \nonumber \\[6pt] &\quad - \left . \frac {4\eta \dot {z}}{3\rho z (z-z_0)}- \frac {4\gamma (z-z_0)^{-1/3}}{\rho z (6R^2)^{1/3}}+\frac {(6R^2)^{2/3} \dot {z}^2}{72\, z (z-z_0)^{4/3}}\right ]/\left (1+\frac {(6R^2)^{2/3}}{12\, z (z-z_0)^{1/3}}\right ). \end{align}
3.2. Dynamic contact angle model
The dynamic contact angle $\theta$
is considered via the molecular-kinetic theory (Blake Reference Blake2006; Wu et al. Reference Wu, Nikolov and Wasan2017b
), which considers the adsorption and desorption dynamics of liquid molecules on a solid surface near the three-phase contact line. The velocity-dependent contact angle can be written in the form
$\theta$
is considered via the molecular-kinetic theory (Blake Reference Blake2006; Wu et al. Reference Wu, Nikolov and Wasan2017b
), which considers the adsorption and desorption dynamics of liquid molecules on a solid surface near the three-phase contact line. The velocity-dependent contact angle can be written in the form
 \begin{align}\nonumber\\[-22pt]\cos \theta =\cos \theta _e-\zeta \frac {\eta \dot {z}}{\gamma }, \end{align}
where $\theta _e$
is the equilibrium contact angle, and
$\theta _e$
is the equilibrium contact angle, and
 \begin{equation} \zeta =\frac {\mathcal{V}_m}{\lambda ^3}\exp {\left [\frac {\lambda ^2 \gamma (1+\cos {\theta _e})}{k_BT}\right ]}, \end{equation}
where $\mathcal{V}_m$
is the molecular volume,
$\mathcal{V}_m$
is the molecular volume, $\lambda$
is the distance between the adsorption sites on a solid surface,
$\lambda$
is the distance between the adsorption sites on a solid surface, $\gamma (1+\cos {\theta _e})$
is the work of adhesion,
$\gamma (1+\cos {\theta _e})$
is the work of adhesion, $k_B$
is the Boltzmann constant, and
$k_B$
is the Boltzmann constant, and $T$
is the absolute temperature (Wu et al. Reference Wu, Nikolov and Wasan2017b
).
$T$
is the absolute temperature (Wu et al. Reference Wu, Nikolov and Wasan2017b
).
We numerically solve (3.8) and (3.9) in Matlab, with $\zeta$
as a fitting parameter for one set of experimental data (the capillary rise of water in a tube of
$\zeta$
as a fitting parameter for one set of experimental data (the capillary rise of water in a tube of $0.42$
mm diameter during the first bubble formation process), then use it to predict the position of the liquid–air interface inside another capillary tube with a larger diameter during multiple bubble formation processes. We then compute
$0.42$
mm diameter during the first bubble formation process), then use it to predict the position of the liquid–air interface inside another capillary tube with a larger diameter during multiple bubble formation processes. We then compute $\lambda$
using (3.10), and find it to be extremely close to previously reported values (Wu et al. Reference Wu, Nikolov and Wasan2017b
). Experimental data and comparisons with predictions are given below.
$\lambda$
using (3.10), and find it to be extremely close to previously reported values (Wu et al. Reference Wu, Nikolov and Wasan2017b
). Experimental data and comparisons with predictions are given below.
4. Experiments
4.1. Experimental details
The experiment requires the immersion of a glass capillary tube in water. First, we vertically position a capillary tube in an empty container, then we gently put the lower end in contact with a flexible, flat, silicone material (PDMS) to prevent water from entering the tube during the filling process of the container. When the water level exceeds the upper end of the capillary tube, we gently lift the capillary and let water naturally enter the tube.
We used soda-lime glass capillary tubes with inner diameters $0.42$
and
$0.42$
and $1.15$
mm, both 80 mm long. The working liquid is water with
$1.15$
mm, both 80 mm long. The working liquid is water with $\rho =998$
kg m–
$\rho =998$
kg m– $^3$
,
$^3$
, $\eta =0.85$
mPa s,
$\eta =0.85$
mPa s, $\gamma =71.7$
mN m–1, and capillary length
$\gamma =71.7$
mN m–1, and capillary length $l_c=(\gamma /\rho g)^{0.5}=2.7$
mm at
$l_c=(\gamma /\rho g)^{0.5}=2.7$
mm at $27\,^{\circ}$
C. The position of the meniscus in the capillary tube during the filling process was recorded using a high-speed camera (Photron FASTCAM UX 100) working at 4000 fps.
$27\,^{\circ}$
C. The position of the meniscus in the capillary tube during the filling process was recorded using a high-speed camera (Photron FASTCAM UX 100) working at 4000 fps.
The equilibrium contact angle $\theta _e$
was determined by placing the glass capillary tubes in contact with water. By measuring the equilibrium height
$\theta _e$
was determined by placing the glass capillary tubes in contact with water. By measuring the equilibrium height $H_{eq}$
in several capillary tubes, and using Jurin’s law
$H_{eq}$
in several capillary tubes, and using Jurin’s law $H_{eq}=2\gamma \cos {\theta _e}/(\rho g R)$
, we obtain the equilibrium contact angles for glass capillary tubes that are (i)
$H_{eq}=2\gamma \cos {\theta _e}/(\rho g R)$
, we obtain the equilibrium contact angles for glass capillary tubes that are (i) $0.42$
mm in diameter,
$0.42$
mm in diameter, $\theta _e= 42.5\pm 0.3^{\circ}$
, and (ii)
$\theta _e= 42.5\pm 0.3^{\circ}$
, and (ii) $1.15$
mm in diameter,
$1.15$
mm in diameter, $\theta _e= 25.5\pm 5.6^{\circ}$
. We considered that equilibrium was reached after waiting 160 min from the contact with the liquid bath, after which we observed no capillary rise. This procedure for determining the equilibrium contact angle corresponds to previously published papers that have reported greater equilibrium heights due to pinning forces attributed to the imperfections of real surfaces (Schäffer & Wong Reference Schäffer and Wong2000; Zhao et al. Reference Zhao, Hossain, Colosqui and Roché2023).
$\theta _e= 25.5\pm 5.6^{\circ}$
. We considered that equilibrium was reached after waiting 160 min from the contact with the liquid bath, after which we observed no capillary rise. This procedure for determining the equilibrium contact angle corresponds to previously published papers that have reported greater equilibrium heights due to pinning forces attributed to the imperfections of real surfaces (Schäffer & Wong Reference Schäffer and Wong2000; Zhao et al. Reference Zhao, Hossain, Colosqui and Roché2023).
The fitting parameter $\zeta$
, needed to compute the velocity-dependent contact angle, was obtained by generating trial numerical solutions of (3.8) and (3.9). We use an error function similar to that defined by Ruiz-Gutiérrez et al. (Reference Ruiz-Gutiérrez, Armstrong, Lévêque, Michel, Pagonabarraga, Wells, Hernández-Machado and Ledesma-Aguilar2022). For each trial, we compute
$\zeta$
, needed to compute the velocity-dependent contact angle, was obtained by generating trial numerical solutions of (3.8) and (3.9). We use an error function similar to that defined by Ruiz-Gutiérrez et al. (Reference Ruiz-Gutiérrez, Armstrong, Lévêque, Michel, Pagonabarraga, Wells, Hernández-Machado and Ledesma-Aguilar2022). For each trial, we compute
 \begin{equation} \epsilon =\frac {1}{N}\sum _{i=1}^N |z^{\textit{exp}}_i(t_i)-z(t_i)|, \end{equation}
where $N$
is the number of data points,
$N$
is the number of data points, $z^{{exp}}_i(t_i)$
is the position of the interface inside the capillary tube at time
$z^{{exp}}_i(t_i)$
is the position of the interface inside the capillary tube at time $t_i$
, and
$t_i$
, and $z(t_i)$
is the corresponding prediction. We search for the minimum of
$z(t_i)$
is the corresponding prediction. We search for the minimum of $\epsilon$
by incremental variation of
$\epsilon$
by incremental variation of $\zeta$
, then numerically solve (3.10) for
$\zeta$
, then numerically solve (3.10) for $\lambda$
in the range of nanometres. The fitting is done for the capillary rise of water in a tube of diameter
$\lambda$
in the range of nanometres. The fitting is done for the capillary rise of water in a tube of diameter $0.42$
mm during the first bubble formation process. The value was then used to predict the position of the liquid–air interface inside the capillary tube with a larger diameter during multiple bubble formation processes. The values of the error function
$0.42$
mm during the first bubble formation process. The value was then used to predict the position of the liquid–air interface inside the capillary tube with a larger diameter during multiple bubble formation processes. The values of the error function $ \epsilon$
were found to be lower than
$ \epsilon$
were found to be lower than $0.55$
mm.
$0.55$
mm.
4.2. Experimental data and model predictions
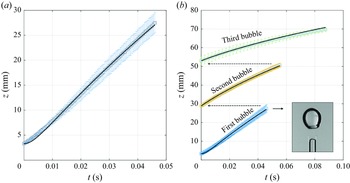
The experiments target the filling process of a capillary tube submerged in water. Figure 3(a) shows two sets of repeated experiments and corresponding data for the meniscus position as a function of time for two capillary tubes with different diameters. As water rises in the capillary tube, the air exits at the other end as a bubble. Buoyancy increases as the air accumulates into the bubble, initiating the detachment process. For the smaller capillary tube ( $D=0.42$
mm), the first bubble detaches after the liquid moves more than 50 mm from the lower end. The bubble’s detachment process induces significant changes to the dynamics of the advancing water column due to higher capillary pressures created by the necking process. The capillary tube’s length (80 mm) does not allow the formation of multiple successive bubbles since over 50 mm is needed for the natural detachment process. The last bubble can detach or remain pinned at the upper end of the capillary tube, depending on the glass surface roughness and the contact line that forms during the bubble formation process.
$D=0.42$
mm), the first bubble detaches after the liquid moves more than 50 mm from the lower end. The bubble’s detachment process induces significant changes to the dynamics of the advancing water column due to higher capillary pressures created by the necking process. The capillary tube’s length (80 mm) does not allow the formation of multiple successive bubbles since over 50 mm is needed for the natural detachment process. The last bubble can detach or remain pinned at the upper end of the capillary tube, depending on the glass surface roughness and the contact line that forms during the bubble formation process.
(a) Experimental data of the position $z$
as a function of time for several capillary filling processes. The data represent two experiments for two capillary tubes with different inner diameters. (b) Three sets of experimental data showing the meniscus position in time until the first bubble detaches from the other end of the capillary tube.
$z$
as a function of time for several capillary filling processes. The data represent two experiments for two capillary tubes with different inner diameters. (b) Three sets of experimental data showing the meniscus position in time until the first bubble detaches from the other end of the capillary tube.

The larger capillary tube ( $D=1.15$
mm) gives three complete, consecutive bubbles during the filling process. Each detachment process has less impact on the overall dynamics due to lower capillary pressures during the necking of the bubble, and higher inertia due to larger masses of liquid contained by the tube. The last bubble (the fourth) may not detach from the capillary due to contact line pinning. Also, we observed that the contact line settles inside the capillary tube at approximately one millimetre below its tip.
$D=1.15$
mm) gives three complete, consecutive bubbles during the filling process. Each detachment process has less impact on the overall dynamics due to lower capillary pressures during the necking of the bubble, and higher inertia due to larger masses of liquid contained by the tube. The last bubble (the fourth) may not detach from the capillary due to contact line pinning. Also, we observed that the contact line settles inside the capillary tube at approximately one millimetre below its tip.
The model described by (3.8) and (3.9) was used to describe the observed dynamics of the capillary rise of water for an immersed capillary tube. Figure 3(b) shows three sets of experimental data depicting the position of the liquid meniscus inside the capillary tube during the formation of the first bubble. The figure shows data for both capillary tubes (0.42 and 1.15 mm in diameter). The data were used to compute the average value of $z$
at each instant in time, and the corresponding standard deviation.
$z$
at each instant in time, and the corresponding standard deviation.
To test the model, we fit the prediction by varying $\zeta$
until we obtain the minimum value of the error function
$\zeta$
until we obtain the minimum value of the error function $\epsilon$
. The fit was done on one set of experimental data for the capillary rise in a tube of
$\epsilon$
. The fit was done on one set of experimental data for the capillary rise in a tube of $0.42$
mm diameter during the formation process of the first bubble (initial conditions
$0.42$
mm diameter during the formation process of the first bubble (initial conditions $z_0=z(0)=0$
and
$z_0=z(0)=0$
and $\dot {z}(0)=0$
). We find
$\dot {z}(0)=0$
). We find $\zeta =105$
with error
$\zeta =105$
with error $\epsilon =0.55$
mm.
$\epsilon =0.55$
mm.
Figure 4(a) shows the model’s predictions compared to experimental data representing a typical filling process. We observe that a constant contact angle approach overestimates the data, emphasising the importance of the variation of the contact angle with respect to velocity. In figure 4(b), we also plot the model’s prediction considering a static contact angle model ( $D=0.42$
mm,
$D=0.42$
mm, $\zeta =0$
). We incrementally vary the equilibrium contact angle from the measured value
$\zeta =0$
). We incrementally vary the equilibrium contact angle from the measured value $42.5^{\circ}$
to
$42.5^{\circ}$
to $72.5^{\circ}$
. The predictions show large deviations compared to the measured values of the liquid’s position in the capillary tube. Even if in some cases the prediction seems to gradually enter the margin of error, the overall trend does not capture the proper dynamics of the system (which is well captured only by the dynamic contact angle model – the continuous black curve).
$72.5^{\circ}$
. The predictions show large deviations compared to the measured values of the liquid’s position in the capillary tube. Even if in some cases the prediction seems to gradually enter the margin of error, the overall trend does not capture the proper dynamics of the system (which is well captured only by the dynamic contact angle model – the continuous black curve).
(a) Model predictions (dashed line indicates constant contact angle, solid line indicates dynamic contact angle) and experimental data for the capillary rise of water in a completely submerged tube of $0.42$
mm diameter during the formation of the first bubble. The relevant parameters are given in table 1. The images on the right show a typical filling process. (b) Sensitivity of the predictions to a change in the equilibrium contact angle when a static contact angle model is assumed.
$0.42$
mm diameter during the formation of the first bubble. The relevant parameters are given in table 1. The images on the right show a typical filling process. (b) Sensitivity of the predictions to a change in the equilibrium contact angle when a static contact angle model is assumed.

The analysis shows that the model needs to include a dissipation that occurs at the moving contact line. The motion induces a deformation of the meniscus, which is only captured by the dynamic contact angle models. Without taking into account the dynamic nature of the contact angle, one cannot capture the proper capillary rise dynamics as shown by the data and also represent the actual physical picture of the moving contact line, which shows a variation in the contact angle.
We emphasise that the standard deviation of the experimental data is below one capillary length, and the model offers a good prediction for the underwater capillary rise problem when $\zeta =105$
.
$\zeta =105$
.
Using the definition of $\zeta$
in the molecular-kinetic theory, here shown by (3.10), we can calculate the value of
$\zeta$
in the molecular-kinetic theory, here shown by (3.10), we can calculate the value of $\lambda$
, the distance between adsorption and desorption sites. Knowing that
$\lambda$
, the distance between adsorption and desorption sites. Knowing that $\mathcal{V}_m=2.989\times 10^{-29}$
m
$\mathcal{V}_m=2.989\times 10^{-29}$
m $^3$
,
$^3$
, $\gamma =71.7$
mN m–1,
$\gamma =71.7$
mN m–1, $\theta _e=42.5^{\circ}$
,
$\theta _e=42.5^{\circ}$
, $k_B=1.38064 \times 10^{-23}$
J K–1 and
$k_B=1.38064 \times 10^{-23}$
J K–1 and $T=300.15$
K, we find
$T=300.15$
K, we find $\lambda =0.43$
nm, which is extremely close to previously reported values (0.44–0.56 nm) in studies involving the capillary rise of several other liquids (Wu et al. Reference Wu, Nikolov and Wasan2017b
).
$\lambda =0.43$
nm, which is extremely close to previously reported values (0.44–0.56 nm) in studies involving the capillary rise of several other liquids (Wu et al. Reference Wu, Nikolov and Wasan2017b
).
The model was then used to predict the filling process of a larger capillary tube ( $D=1.15$
mm) during which several complete bubble formation processes occur. Table 1 gives all the relevant parameters to compute the predictions. The initial velocity of the water column for the second, third and fourth bubbles is determined by the linear fit of the last five data points
$D=1.15$
mm) during which several complete bubble formation processes occur. Table 1 gives all the relevant parameters to compute the predictions. The initial velocity of the water column for the second, third and fourth bubbles is determined by the linear fit of the last five data points $(t_i,z_i)$
measured before the new bubble formation process begins. Also, for each new bubble formation process, we reset the time to zero, and aim to predict the position of the liquid inside the capillary tube as a function of time using (3.8) and (3.9).
$(t_i,z_i)$
measured before the new bubble formation process begins. Also, for each new bubble formation process, we reset the time to zero, and aim to predict the position of the liquid inside the capillary tube as a function of time using (3.8) and (3.9).
The set of parameters for the model predictions. The parameters are given for each successive bubble formation process. The liquid is water at $27\,^{\circ}$
C, with
$27\,^{\circ}$
C, with $\eta =0.85$
mPa s,
$\eta =0.85$
mPa s, $\rho =998$
kg m–
$\rho =998$
kg m– $^3$
and
$^3$
and $\gamma =71.7$
mN m–1.
$\gamma =71.7$
mN m–1.

Model predictions (continuous line) and experimental data for the capillary rise of water in a tube of $1.15$
mm diameter during the formation of (a) the first bubble, and (b) three consecutive bubbles. The parameters for the predictions are given in table 1.
$1.15$
mm diameter during the formation of (a) the first bubble, and (b) three consecutive bubbles. The parameters for the predictions are given in table 1.

Figure 5 shows the position of the liquid as a function of time, and the corresponding prediction (continuous line) during the filling process of a capillary tube of 1.15 mm diameter. The predictions agree well with the data, the error functions being lower than $0.36$
mm (as shown in table 1) with
$0.36$
mm (as shown in table 1) with $\zeta =105$
as obtained earlier. We emphasise that the predictions were not obtained in this case via fitting, the approach aiming at testing the model’s predictive power. The parameter
$\zeta =105$
as obtained earlier. We emphasise that the predictions were not obtained in this case via fitting, the approach aiming at testing the model’s predictive power. The parameter $\zeta$
was calculated by fitting the experimental data obtained in the experiments where we used the capillary tube with a smaller diameter (0.42 mm).
$\zeta$
was calculated by fitting the experimental data obtained in the experiments where we used the capillary tube with a smaller diameter (0.42 mm).
Conversely, we can also use the model to fit the data from figure 5 and determine $\lambda$
, using
$\lambda$
, using $\zeta$
as the fitting parameter, ensuring a minimum for the error function, for each of the three capillary rise processes that correspond to the three consecutive bubbles. Using this approach, we find that the average value is
$\zeta$
as the fitting parameter, ensuring a minimum for the error function, for each of the three capillary rise processes that correspond to the three consecutive bubbles. Using this approach, we find that the average value is $\lambda =0.417\pm 0.013$
nm. The analysis shows that
$\lambda =0.417\pm 0.013$
nm. The analysis shows that $\lambda$
is approximately the same for all experiments conducted in the same type of glass capillaries.
$\lambda$
is approximately the same for all experiments conducted in the same type of glass capillaries.
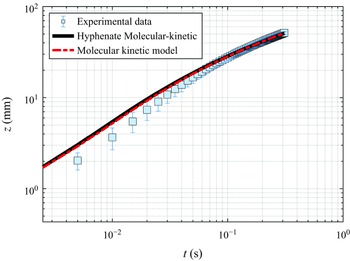
We also tested the model’s predictions under the assumption that the dynamic contact angle is described by the hydrodynamic model (Cox Reference Cox1986), $\theta ^3=\theta _e^3+9\chi \eta \dot {z}/{\gamma }$
. The predictions overlap with the molecular-kinetic theory model when
$\theta ^3=\theta _e^3+9\chi \eta \dot {z}/{\gamma }$
. The predictions overlap with the molecular-kinetic theory model when $\chi =38$
, as shown in figure 6. In the literature, the parameter ranges from 8 to 30 for several other tested liquids (Katoh et al. Reference Katoh, Wakimoto, Yamamoto and Ito2015; Wu et al. Reference Wu, Nikolov and Wasan2017b
). For the range of capillary numbers that correspond to the filling process (
$\chi =38$
, as shown in figure 6. In the literature, the parameter ranges from 8 to 30 for several other tested liquids (Katoh et al. Reference Katoh, Wakimoto, Yamamoto and Ito2015; Wu et al. Reference Wu, Nikolov and Wasan2017b
). For the range of capillary numbers that correspond to the filling process ( ${Ca}=\eta\, \dot {z}(t)/\gamma \lt 0.0057$
), both models predict approximately the same variation for the contact angle. Another model for the dynamic contact angle is the self-layering model,
${Ca}=\eta\, \dot {z}(t)/\gamma \lt 0.0057$
), both models predict approximately the same variation for the contact angle. Another model for the dynamic contact angle is the self-layering model, $\cos \theta =\cos \theta _e-\beta \eta \dot {z}/{\gamma },$
with
$\cos \theta =\cos \theta _e-\beta \eta \dot {z}/{\gamma },$
with $\beta =\exp {[2\gamma /W(0)]}$
, and
$\beta =\exp {[2\gamma /W(0)]}$
, and $W(0)$
as the entropic solvation energy extrapolated to zero distance from the solid surface (Wu et al. Reference Wu, Nikolov and Wasan2017a
,
Reference Wu, Nikolov and Wasanb
). Compared with the model given by (3.9), the model is equivalent (only in written form) to the molecular-kinetic theory model, meaning that we can use the previous fit to determine
$W(0)$
as the entropic solvation energy extrapolated to zero distance from the solid surface (Wu et al. Reference Wu, Nikolov and Wasan2017a
,
Reference Wu, Nikolov and Wasanb
). Compared with the model given by (3.9), the model is equivalent (only in written form) to the molecular-kinetic theory model, meaning that we can use the previous fit to determine $\beta$
. Writing
$\beta$
. Writing $\beta =\zeta =105$
, this gives
$\beta =\zeta =105$
, this gives $W(0)=2\gamma /\text{ln}(105)\approx 30.8$
mN m–1 for the entropic solvation energy extrapolated to zero distance from the solid surface. Considering that the dynamics of the contact angle is not fully understood, the interpretation of the numerical values of both parameters is still a matter of scientific debate, especially when considering the role of inertia in the description of the contact line flow for fluids with low viscosity (Bonn et al. Reference Bonn, Eggers, Indekeu, Meunier and Rolley2009) or the local temperature change in the vicinity of the dynamic contact line (Kusudo et al. Reference Kusudo, Omori, Joly and Yamaguchi2023).
$W(0)=2\gamma /\text{ln}(105)\approx 30.8$
mN m–1 for the entropic solvation energy extrapolated to zero distance from the solid surface. Considering that the dynamics of the contact angle is not fully understood, the interpretation of the numerical values of both parameters is still a matter of scientific debate, especially when considering the role of inertia in the description of the contact line flow for fluids with low viscosity (Bonn et al. Reference Bonn, Eggers, Indekeu, Meunier and Rolley2009) or the local temperature change in the vicinity of the dynamic contact line (Kusudo et al. Reference Kusudo, Omori, Joly and Yamaguchi2023).
Model predictions for a dynamic contact angle described by the hydrodynamic model versus molecular-kinetic theory compared to experimental data. The data are given for the capillary rise of water in a tube of diameter $0.42$
mm.
$0.42$
mm.

4.3. Limitations and interpretations of the model
The model can describe the filling process only until the bubble detaches at the other end. We can approximate beforehand the height of the water column inside the capillary tube that will result in the formation and detachment of a bubble if we assume that detachment occurs when the buoyancy force is approximately equal to the surface tension force, $\rho g \mathcal{V}\sim \unicode{x03C0} D \gamma$
. The air that forms the bubble is displaced by the advancing water column of length
$\rho g \mathcal{V}\sim \unicode{x03C0} D \gamma$
. The air that forms the bubble is displaced by the advancing water column of length $z_c$
, which implies
$z_c$
, which implies $\mathcal{V}=z_c\unicode{x03C0} D^2/4$
. We obtain
$\mathcal{V}=z_c\unicode{x03C0} D^2/4$
. We obtain $z_c=4l_c^2/D$
, where
$z_c=4l_c^2/D$
, where $l_c$
is the capillary length. In the last equation, we emphasise an interesting aspect: the resemblance to Jurin’s law for the equilibrium height in the case of a liquid that completely wets the tube. Tubes with a length greater than
$l_c$
is the capillary length. In the last equation, we emphasise an interesting aspect: the resemblance to Jurin’s law for the equilibrium height in the case of a liquid that completely wets the tube. Tubes with a length greater than $4l_c^2/D$
will generate two or more bubbles. Since, in practice, it is difficult to manufacture capillary tubes of a specific length, one is forced to use standard lengths provided by the manufacturer. In our study, the capillary tubes are 80 mm long, giving two bubbles when
$4l_c^2/D$
will generate two or more bubbles. Since, in practice, it is difficult to manufacture capillary tubes of a specific length, one is forced to use standard lengths provided by the manufacturer. In our study, the capillary tubes are 80 mm long, giving two bubbles when $D=0.42$
mm, and four bubbles when
$D=0.42$
mm, and four bubbles when $D=1.15$
mm. To avoid bubble detachment, one would need capillaries smaller than
$D=1.15$
mm. To avoid bubble detachment, one would need capillaries smaller than $4l_c^2/D$
. Even if the option of manufacturing capillary tubes of a specific length were commercially available, the detachment of the bubble does not take place exactly when the liquid reaches the calculated critical height because the detachment process of the bubble is dependent on the irregularities of the capillary tube’s tip, which are an artefact of the manufacturing process. Even with these limitations, the model can be used to accurately predict the filling process when multiple bubbles form by changing the model’s initial conditions concerning the position of the interface inside the capillary and the initial velocity (as depicted in figure 5
b).
$4l_c^2/D$
. Even if the option of manufacturing capillary tubes of a specific length were commercially available, the detachment of the bubble does not take place exactly when the liquid reaches the calculated critical height because the detachment process of the bubble is dependent on the irregularities of the capillary tube’s tip, which are an artefact of the manufacturing process. Even with these limitations, the model can be used to accurately predict the filling process when multiple bubbles form by changing the model’s initial conditions concerning the position of the interface inside the capillary and the initial velocity (as depicted in figure 5
b).
The prediction fits the data quite well during the first process of bubble formation, even though when water enters the capillary, one observes a highly irregular shape of the water–air interface. The phenomenon is more pronounced in capillary tubes with larger diameters, as shown in figure 7(a). This is due to the hydrostatic pressure that forces water into the tube. The contact line pins to local surface irregularities and suffers major deviations from the convex meniscus seen in capillary rise. Since this phenomenon adds to the dissipative forces that accompany the early times of the filling process, the model slightly overestimates the data, as depicted in figure 6. Although the interface starts with a highly irregular shape, it rapidly takes the shape of a convex meniscus that advances into the capillary tube, and the process takes place without major shape alterations until the capillary tube is filled.
(a) Images showing the water–air interface in the first $24$
ms as water invades a capillary tube of
$24$
ms as water invades a capillary tube of $1.15$
mm diameter. (b) The water–air interface at the other end of the capillary tube at the beginning of the filling process (the image on the left) and after bubble detachment. (c) The model predictions and experimental data that correspond to the final stage of the filling process for which bubble detachment was observed. The relevant parameters are given in table 1.
$1.15$
mm diameter. (b) The water–air interface at the other end of the capillary tube at the beginning of the filling process (the image on the left) and after bubble detachment. (c) The model predictions and experimental data that correspond to the final stage of the filling process for which bubble detachment was observed. The relevant parameters are given in table 1.

It is important to mention that the added mass effect may contribute to the capillary filling process at early times. To incorporate the added mass effect, one has to add $m_a\ddot {z}$
on the left-hand side of (3.1), with
$m_a\ddot {z}$
on the left-hand side of (3.1), with $m_a=7\unicode{x03C0} \rho R^3/6$
as the added mass (Ruiz-Gutiérrez et al. Reference Ruiz-Gutiérrez, Armstrong, Lévêque, Michel, Pagonabarraga, Wells, Hernández-Machado and Ledesma-Aguilar2022). Considering the procedure for obtaining the final differential equation, this corresponds to the addition of
$m_a=7\unicode{x03C0} \rho R^3/6$
as the added mass (Ruiz-Gutiérrez et al. Reference Ruiz-Gutiérrez, Armstrong, Lévêque, Michel, Pagonabarraga, Wells, Hernández-Machado and Ledesma-Aguilar2022). Considering the procedure for obtaining the final differential equation, this corresponds to the addition of $7R/(6z)$
in the denominator of (3.8). The term shows that the influence of the added mass decreases rapidly as
$7R/(6z)$
in the denominator of (3.8). The term shows that the influence of the added mass decreases rapidly as $z$
increases. We have found that the predictions do not change when considering the added mass term (the corresponding error function remains unchanged at the reported calculated value with two digits after the decimal), which implies that with this particular phenomenon, the effect can be considered as having a minor influence.
$z$
increases. We have found that the predictions do not change when considering the added mass term (the corresponding error function remains unchanged at the reported calculated value with two digits after the decimal), which implies that with this particular phenomenon, the effect can be considered as having a minor influence.
Another limitation is related to the bubble detachment process, which induces an adverse pressure that increases due to the capillary pressure exerted by the necking regime during detachment. Figure 7(b) shows the water–air interface for an empty capillary tube before the filling process starts and after two bubble detachment processes. We observe that the interface settles inside the capillary tube, at approximately 1 mm below the end tip. Furthermore, the last image in figure 7(b) also shows a case of an asymmetric meniscus due to contact line pinning immediately after bubble detachment. The bubble detachment process primarily affects smaller capillary tubes (as clearly visible in figure 3 a) because the necking process implies larger capillary pressures. Although bubble break-up affects the capillary rise of the liquid in larger tubes, the effect is not as pronounced as in the latter case.
In figure 7(c), we compare the prediction with the experimental data for the position of the liquid inside the capillary tube, $z(t)$
, during the last bubble formation process ending with the bubble’s detachment and with it the complete filling of the tube. We also emphasise that the last bubble may not detach due to the contact line or bubble pinning at the tip of the capillary, with a small amount of air remaining inside. We observe large deviations, especially when the last 5 mm is to be filled, which corresponds to approximately two capillary lengths. In this final stage, the advancing meniscus merges with the contact line that supports the bubble, their interaction not being described by the model. The model overpredicts the position of the liquid in this region, the data showing possible extra resistive forces occurring in the last stage of the capillary filling.
$z(t)$
, during the last bubble formation process ending with the bubble’s detachment and with it the complete filling of the tube. We also emphasise that the last bubble may not detach due to the contact line or bubble pinning at the tip of the capillary, with a small amount of air remaining inside. We observe large deviations, especially when the last 5 mm is to be filled, which corresponds to approximately two capillary lengths. In this final stage, the advancing meniscus merges with the contact line that supports the bubble, their interaction not being described by the model. The model overpredicts the position of the liquid in this region, the data showing possible extra resistive forces occurring in the last stage of the capillary filling.
One also needs to highlight that the molecular-kinetic approach of the contact line dynamics, which has been incorporated into the present model, has intrinsic limitations that have been highlighted and discussed by Sedev (Reference Sedev2015).
(a) Comparative view of the position of the liquid as a function of time for two immersed capillaries, with one having the end tip in contact with the atmosphere. The predictions are given by (4.2) as a dashed line, and (3.8) as a continuous line. (b) Rise height as a function of time for immersed capillaries of different lengths. The basic configuration for the predictions is given in the text. (c) Model prediction and experimental data for the bubble diameter $D_b$
as a function of time for the first bubble formation process at the end of a capillary tube with diameter
$D_b$
as a function of time for the first bubble formation process at the end of a capillary tube with diameter $0.42$
mm.
$0.42$
mm.

The model can also be used to quantify the influence of various characteristic features. To show this, we start with a basic configuration of parameters (for simplicity, $D=1$
mm,
$D=1$
mm, $L=30$
mm,
$L=30$
mm, $\theta =0$
,
$\theta =0$
, $\zeta =0$
,
$\zeta =0$
, $z_0=0$
,
$z_0=0$
, $z(0)=10\,\%\,l_c$
,
$z(0)=10\,\%\,l_c$
, $\dot {z}(0)=0$
,
$\dot {z}(0)=0$
, $\eta =0.85$
mPa s,
$\eta =0.85$
mPa s, $\rho =998$
kg m–
$\rho =998$
kg m– $^3$
,
$^3$
, $\gamma =71.7$
mN m–1), and consider a comparison with the flow in a submerged capillary tube having one end at the free surface. In this situation, no bubble would form at the tip, the air flowing directly into the atmosphere. Considering the basic configuration given above, the capillary flow is described by the differential equation
$\gamma =71.7$
mN m–1), and consider a comparison with the flow in a submerged capillary tube having one end at the free surface. In this situation, no bubble would form at the tip, the air flowing directly into the atmosphere. Considering the basic configuration given above, the capillary flow is described by the differential equation
 \begin{equation} \ddot {z}=\frac {g L}{z}-\frac {3 \dot {z}^2}{2 z}-\frac {8\eta \dot {z}}{\rho R^2}-g +\frac {2 \gamma }{\rho R z}, \end{equation}
which represents the limiting case of (3.8) when the end of the capillary tube is in contact with the atmosphere. Figure 8(a) shows that in the absence of the bubble, the filling process is faster. As expected, the combined resistive forces associated with bubble growth, introduced via capillary pressure, viscous stresses and inertia, considerably delay the filling process, with longer tubes favouring the observed delay. Compared to flows solely driven by the capillary pressure, the flow in immersed tubes is also driven by the hydrostatic pressure difference between the two ends. In figure 8(b), we compare the flow dynamics of three capillary tubes with different lengths, where we observe that the hydrostatic pressure difference increases the velocity of liquid intake. For example, considering the rise height of 10 mm, longer tubes, which correspond to greater hydrostatic pressure differences $\sim \rho g L$
, favour the increase of liquid uptake.
$\sim \rho g L$
, favour the increase of liquid uptake.
One can also plot the time variation of the gas bubble’s diameter as the liquid fills the capillary tube using (3.6), which yields $D_b=(6R^2)^{1/3}(z-z_0)^{1/3}$
. We measure the time variation of the bubble’s diameter, and compare it to the model’s predictions for a capillary tube with diameter
$D_b=(6R^2)^{1/3}(z-z_0)^{1/3}$
. We measure the time variation of the bubble’s diameter, and compare it to the model’s predictions for a capillary tube with diameter $0.42$
mm, as depicted in figure 8(c). We obtained good quantitative agreement despite the fact that close to detachment, the bubble deviates from the assumed spherical shape, the effect being more pronounced when using larger capillaries.
$0.42$
mm, as depicted in figure 8(c). We obtained good quantitative agreement despite the fact that close to detachment, the bubble deviates from the assumed spherical shape, the effect being more pronounced when using larger capillaries.
5. Conclusions
The study shows how underwater capillary tubes naturally fill with the surrounding liquid. As the fluid flows into the tube, the air is removed as bubbles at the other end. The physical description of the flow in an underwater capillary tube includes the coupling of distinct, yet interconnected phenomena, such as capillary rise, contact line dynamics and bubble growth. When these phenomena are coupled, the resulting model provides a good approximation for the filling process of the submerged capillary tube, as shown by comparison with the experimental data.
We present experimental data concerning the capillary rise of water in a submerged empty capillary tube, and derive a theoretical model that also takes into consideration the bubble formation process that takes place at the other of the capillary. The proposed theoretical model captures the advance of the water column as it slows down during the filling process. The last stages of the capillary rise, which also include the merging of the two contact lines, prove to be more difficult to predict with the same accuracy as the earlier filling stages. However, this final regime covers only approximately $7\,\,\%$
of the total rise height, spanning approximately two capillary lengths.
$7\,\,\%$
of the total rise height, spanning approximately two capillary lengths.
These spontaneous flows provide a fruitful ground for future development, with implications in fundamental and applied sciences. The study can also be extended to describe the natural displacement process of another immiscible liquid that initially occupies the submerged capillary tube for which the flow will now generate a droplet at the other end, a situation that is less encountered in Nature but of great importance in engineering.
Funding
This work was supported by a grant of the Ministry of Research, Innovation and Digitization, CNCS-UEFISCDI, project number PN-IV-P2-2.1-TE-2023-0288, within PNCDI IV.
Declaration of interests
The authors report no conflict of interest.
Data availability statement
The data that support the findings of this study are available upon reasonable request from the corresponding author.
Author contributions
C.P. devised the research, secured funding and developed the theoretical model. C.P., V.-E.P. and I.R. designed and carried out the experiments. V.-E.P. and I.R. ensured data acquisition and analysis. C.P. wrote the manuscript with input from all authors.


 Open access