


Introduction
Urban centres in most regions of the ancient world, including Southwest Asia, are characterised by relatively high population densities and the presence of inhabitants who do not engage in subsistence activities, such as officials, craftspeople and soldiers. Provisioning for these individuals presented a particular challenge. As political, religious and economic centres, the cities of Southwest Asia illustrate strategies in the control of production and the ‘pulling in’ of food and other resources from a wider area to sustain their large, specialised populations (Johnson Reference Johnson1973; Wright & Johnson Reference Wright and Johnson1975; Adams Reference Adams1981; Zeder Reference Zeder1991; Algaze Reference Algaze2008; Smith Reference Smith2020. Unequivocally urban settlements in ancient Southwest Asia are known from at least 4000 BC (Lawrence et al. Reference Lawrence, Philip and de Gruchy2022) and would have been reliant upon well-organised systems of food production and distribution. Breakdowns in these provisioning systems could cause unrest and jeopardise the continued functioning of both urban centres and related rural communities, and even entire social and political systems.
Definitions of urbanism have shifted from a focus on specific attributes (such as size or the presence of walls) to the consideration of settlement function (e.g. Greenberg Reference Greenberg2002; Cowgill Reference Cowgill2004; Ur Reference Ur2010; Chesson Reference Chesson2015; Paz & Greenberg Reference Paz and Greenberg2016). Cities may be seen as centres for activities that are not performed in their rural hinterlands; for example, political control, economic organisation (such as markets) or ritual and religious practices (Smith Reference Smith and Smith1976). Defining cities on the basis of their function can, however, create difficulties when dealing with the archaeological record. Many large sites have been identified only through survey or remote sensing and, even where excavation has occurred, information on settlement size, internal layout or the presence of features such as lower towns, walls or public buildings (e.g. palaces, administrative buildings or temple complexes), which signify function, may not be available (Algaze Reference Algaze2018).
One area of research often employed to identify differences in the distribution and consumption of resources is zooarchaeology. Through the examination of faunal remains, urban centres have been shown to contain divergent faunal profiles from contemporaneous rural settlements (e.g. Mudar Reference Mudar1982; Stein Reference Stein1988; Crabtree Reference Crabtree1990; Zeder Reference Zeder1991, Reference Zeder1998, Reference Zeder and Smith2003; DeFrance Reference DeFrance2009; Greenfield Reference Greenfield2014; Sapir-Hen et al. Reference Sapir-Hen, Sasson, Kleiman and Finkelstein2016; Gaastra et al. Reference Gaastra, Greenfield and Greenfield2021a). Such research has led to greater awareness of the zooarchaeological distinction between urban settlements, as food ‘consumer’ sites and their rural satellite ‘producer’ sites (Mudar Reference Mudar1982; Stein Reference Stein1988). Within this model differences in the proportions of taxa are assumed to be caused by rural sites contributing a share of the animals raised within their herds (production) towards the maintenance of (and consumption by) urban populations. While this model is largely derived from epigraphic evidence for the provisioning of urban sites, urban-rural differences in zooarchaeological profiles have been observed in multiple studies (see above). These comparisons have rarely been systematic across time and space, however, with studies tending rather to examine a limited number of sites across a particular region and/or period. Such studies also rarely take differences in local land use into account and hence cannot discriminate between local affordance or site category as drivers in the patterns of livestock production and consumption identified. We have previously demonstrated that the productive capacity of landscapes impacts the patterns of animal production in ancient Southwest Asia (Gaastra et al. Reference Gaastra, Welton, de Gruchy and Lawrence2021b) but we have not systematically examined relations between urban and rural sites. Two critical and inter-related questions remain to be addressed with our dataset to better understand how urbanism functioned in the region. Firstly, were urban and rural differences in food provisioning inherent to the development and maintenance of urban centres; and, secondly, did these differences vary between time periods and between landscapes? The research aims to establish if urban provisioning in ancient Southwest Asia was a set process or something much more varied.
This article compares zooarchaeological data from across the Levant and Mesopotamia c. 5000–1 cal BC to determine whether, where and when urban sites can be differentiated from rural sites on the basis of the animals consumed there. The aim is to understand whether urban-rural patterns of provisioning were an innate feature in the functioning of urban settlements. We also investigate whether these patterns developed alongside the first urban sites, how far they were universal across urban sites of Southwest Asia and the degree to which specific patterns may have varied between regions, periods and landscapes.
Methods
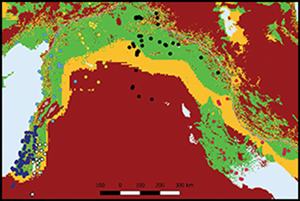
This study compares the proportion of zooarchaeological material that can be identified as belonging to four faunal groups: ovicaprines (sheep and goats), bovids (cattle), equids (donkeys, horses and onagers) and suids (pigs). Published zooarchaeological data, including a wide range of variables (see the online supplementary material (OSM) 1) were collected from sites across the Levant and Mesopotamia dating between c. 5000 and 1 cal BC (Figure 1). Over this timeframe the climate of Southwest Asia became increasingly arid, with three shorter rapid climate change events of increased aridity (c. 3200, 2200 and 1200 cal BP, Staubwasser & Weiss Reference Staubwasser and Weiss2006; Bar-Matthews & Ayalon Reference Bar-Matthews and Ayalon2011; Bini et al. Reference Bini2019; Gaastra et al. Reference Gaastra, Welton, de Gruchy and Lawrence2021b). Previous studies of animal exploitation patterns across Southwest Asia during these millennia have demonstrated that these events had little impact upon the relative proportions of animal domesticates managed and consumed at the majority of sites (Gaastra et al. Reference Gaastra, Welton, de Gruchy and Lawrence2021b). Some decrease in the proportion of pigs maintained within certain regions and landscapes is, however, observable, particularly at rural sites (Gaastra et al. Reference Gaastra, Welton, de Gruchy and Lawrence2021b).

Figure 1. Distribution of sites that contributed zooarchaeological samples for comparison. Land-use groups shown in this map are: good = green; moderate = orange; and poor = red. Regions, as defined within this article, are indicated by the colours of site dots: dark blue = Southern Levant West; white = Southern Levant East; light blue = Northern Levant; yellow = Northern Mesopotamia; black = Central Mesopotamia; and pink = Southern Mesopotamia (figure by Jane Gaastra).
The timeframe selected for this study allows the provisioning of livestock to be compared across sites from the initial development of urbanism within each region, as well as across successive waves of urban development and social change. The dataset comprises 577 assemblages from 245 sites totalling 786 353 identified macromammal remains classified according to the number of identifiable specimens or the total number of fragments. Zooarchaeological samples were grouped into 500-year bands for chronological comparison. These bands were chosen to provide the narrowest timeframe while retaining comparative samples from both urban and rural sites from the same landscape type and temporal phase across regions. The 500-year groupings also encompass the major cultural phases of Southwest Asia without dividing currently identifiable cultural developments (e.g. Late Uruk and Akkadian expansions) between multiple bands. In one case, where two distinct cultural developments (the Early Dynastic and the Akkadian of Southern Mesopotamia) occurred within a single 500-year band (2500–2000 BC), dates were adjusted slightly to place each in a different band. Details of the samples used in this study are available in OSM1. Where sufficient data on the dental age distributions of animals were available—here, only possible with ovicaprines—these were grouped into Payne (Reference Payne1973) age groups and compared via ternary diagrams following Greenfield (Reference Greenfield1988).
Differences in recovery techniques employed during the excavation of sites are considered to have had little impact on the proportions of the four taxa included in this study. The majority of samples (493 out of 577, or 85%) come from sites which primarily or entirely used hand-collection methods. While taxonomic proportions can be skewed by hand collection, this is most apparent in small taxa such as birds and fish, which are outside the purview of this study (e.g. Orton et al. Reference Orton, Gaastra and Vander Linden2016). Insufficient well-sieved samples are available to allow for direct comparisons of sieved versus hand-collected samples from all regions, phases, land-use zones and settlement types, although where such comparisons were possible they demonstrated no significant difference in taxonomic proportions (see OSM2).
To aid inter-site comparison, donkeys, horses and onager are classified together as equids. It would have been preferable to separate equids into wild and domestic categories but individual equid elements/fragments are notoriously difficult to classify taxonomically (Clutton-Brock Reference Clutton-Brock, Meadow and Uerpmann1986; Twiss et al. Reference Twiss2017) and species identification for equid elements was not always possible or attempted for the zooarchaeological samples included in this study (see OSM2). Given the economic importance of domestic equids to archaeological civilisations within Southwest Asia (Postgate Reference Postgate, Meadow and Uerpmann1986; Recht Reference Recht2022), we felt that it was better to include a combined equids taxonomic category as a means—albeit imperfect—of comparing the frequency of equids between sites, than to exclude their remains from the analysis.
Site samples are grouped according to region, land use, chronological phase and settlement type. The Levant and Mesopotamia are divided into zones of land-use potentiality following Morrison and colleagues (Reference Morrison2021). Division is based on a consideration of physical features, including elevation, slope and aspect, soil quality and water availability—through estimates of precipitation (Hewett et al. Reference Hewett, de Gruchy, Hill and Lawrence2022) and including evidence for irrigation in Southern Mesopotamia. Zones represent the maximum productive potential of a landscape rather than a specific determination of use during the time period in question (see Gaastra et al. Reference Gaastra, Welton, de Gruchy and Lawrence2021b for more information) and individual sites are assigned to zones based upon the dominant land use within a 12km radius. These zones may fall into one of three groups—good, moderate and poor—based upon the productive capacity of each landscape (Figure 1, Table 1).
Table 1. The grouping of landscapes according to the land-use zones of sites. Land-use zones follow Gaastra et al. (Reference Gaastra, Welton, de Gruchy and Lawrence2021b). Further details regarding land-use zones and their designation are available in OSM1 and Gaastra et al. (Reference Gaastra, Welton, de Gruchy and Lawrence2021b).

This study uses a combination of traits to identify urban sites, which allows for flexibility to accommodate some indeterminacy in classification. This system is devised specifically for settlements of Southwest Asia, rather than as a more general system for all regions. Sites in this study are classified on a spectrum of five categories from confidently-rural to confidently-urban (Table 2). The identification of settlements along a rural-urban spectrum is made on the basis of site size (relative to the local settlement size hierarchy), the presence of fortifications, the presence of public buildings and the internal planning of settlements. Settlements that are considered ‘urban’ in this study are those which lie within the top tier of settlement size within their region and time period, with evidence of fortifications (e.g. walls), public buildings and some suggestion of a planned layout. Settlements that meet all but one of these criteria are classified as probably urban (?urban). Settlements that contain only some of these features, such as the presence of walls and internal planning, but where the size or presence of public buildings is unknown, are classified as ‘indeterminate’. Settlements that contain only one or two of these criteria (e.g. walls or planning but without public buildings apart from temples, or a large size) are classified as rural towns (?rural). Settlements that contain none of these features (or only walls) are classified as ‘rural’ (Table 2).
Table 2. Example criteria for the classification of sites according to identified functional characteristics. An x indicates a characteristic that must be present for a certain classification, while a ? shows where classifications may be made despite uncertain characteristics.

The magnitude of difference in urban versus rural animal production is a useful measure of the scale to which animal resources were pulled into urban settlements from their rural hinterlands, but this is also dependent on the variation within animal production systems of rural and urban sites in each region and land-use group. To assess such variation, the proportion of faunal remains belonging to each livestock taxa are compared between urban and rural sites grouped for land use and for 500-year temporal bands. Temporal trends are assessed through the comparison of the mean proportion of a given taxon, as well as the range of variation in proportions, across all sites from the same settlement category and land-use group for a given band. To ensure sample sizes were large enough for a useful comparison, urban and ?urban and rural and ?rural categories were combined for this analysis.
Results
Taxonomic proportions
Comparison of zooarchaeological samples between sites grouped by settlement category and land use confirms taxonomic differences between urban and rural sites across all regions studied (Figures 2–5). Differences in the proportion of livestock remains are most apparent between sites of different land-use groups, in particular between sites located in ‘good’ zones versus other groups. This is clearest in the decreased proportions of ovicaprines (Figure 2) and correspondingly increased proportions of cattle (Figure 3) and/or pigs (Figure 4) at sites in ‘good’ versus other land-use groups. When sites from the same land-use group are compared, it is evident that urban (and ?urban) sites differ from rural (and ?rural) ones also with higher proportions of cattle and/or pigs (Figures 3 & 4), though the proportions and urban/rural difference varies between regions. Proportions of equids (Figure 5) also vary, both between sites of different regions (e.g. Northern and Central Mesopotamia) as well as between urban and rural sites of the same region (e.g. Southern Mesopotamia). Sites of indeterminate status maintain the same general trends seen across land-use zones but proportions vary when compared with urban and rural sites of the same zone and region.

Figure 2. Proportion of ovicaprines within the faunal remains of sites presented by settlement type, region and land-use group. Land-use groups are colour coded as: good = green; moderate = orange; and poor = red (figure by Jane Gaastra).

Figure 3. Proportion of cattle within the faunal remains of sites presented by settlement type, region and land-use group. Land-use groups are colour coded as: good = green; moderate = orange; and poor = red (figure by Jane Gaastra).

Figure 4. Proportion of pigs within the faunal remains of sites presented by settlement type, region and land-use group. Land-use groups are colour coded as: good = green; moderate = orange; and poor = red. Note that the y-axis scale is different from the one used in Figures 2 and 3 (figure by Jane Gaastra).

Figure 5. Proportion of equids within the faunal remains of sites presented by settlement type, region and land-use group. Land-use groups are colour coded as: good = green; moderate = orange; and poor = red. Note that the y-axis scale is different from the one used in Figures 2 and 3 (figure by Jane Gaastra).
Differences in the proportions of livestock taxa between urban and rural sites are also apparent through time (Figures 6–9), particularly for ovicaprines (Figure 6). Across regions, urban sites from ‘good’ land-use zones demonstrate lower proportions of ovicaprines compared with rural sites from the same zones. Urban sites from other land-use groups are more variable. In Southern and Central Mesopotamia, ‘moderate’ and ‘poor’ groups mirror the urban-rural differences found between sites in ‘good’ groups. In Northern Mesopotamia and the Southern Levant East this is not always the case. A relative decrease in the proportion of ovicaprines can be seen to result from higher proportions of cattle (Figure 7) or pigs (Figure 8) at urban compared with rural sites in these regions.

Figure 6. Proportion of ovicaprines at urban and rural sites through time presented by region and land-use group. Land-use groups are colour coded (good = green; moderate = orange; and poor = red) and settlement type is represented by symbols (circles (![]() ) = rural/?rural sites; triangles (
) = rural/?rural sites; triangles (![]() ) = urban/?urban sites) (figure by Jane Gaastra).
) = urban/?urban sites) (figure by Jane Gaastra).

Figure 7. Proportion of cattle at urban and rural sites through time presented by region and land use. Land-use groups are colour coded (good = green; moderate = orange; and poor = red) and settlement type is represented by symbols (circles (![]() ) = rural/?rural sites; triangles (
) = rural/?rural sites; triangles (![]() ) = urban/?urban sites) (figure by Jane Gaastra).
) = urban/?urban sites) (figure by Jane Gaastra).

Figure 8. Proportion of pigs at urban and rural sites through time presented by region and land use. Land-use groups are colour coded (good = green; moderate = orange; and poor = red) and settlement type is represented by symbols (circles (![]() ) = rural/?rural sites; triangles (
) = rural/?rural sites; triangles (![]() ) = urban/?urban sites) (figure by Jane Gaastra).
) = urban/?urban sites) (figure by Jane Gaastra).
While taxonomic differences remain between urban and rural sites within each region, these are not always consistent across time nor between urban sites of different land-use zones. Within each region, the over-represented taxa at urban compared with rural sites are either constant through time (e.g. cattle in the Northern Levant and Southern Levant West) or vary through time (e.g. cattle and pigs of Southern Mesopotamia, Central Mesopotamia and Northern Mesopotamia) or between urban-rural sites of different land-use groups (e.g. the Southern Levant East and some phases of Northern and Southern Mesopotamia). These comparisons also demonstrate that divergent patterns of urban-rural provisioning are present at the earliest urban settlements within each region for which zooarchaeological data are available. These divergent patterns remain in each region through time whenever urban settlements are present.
Some regions are broadly consistent over time, such as the Northern Levant, where cattle, pigs and equids remain slightly more abundant at urban than rural sites. Higher proportions of cattle are similarly evident at urban sites in the Southern Levant. In the Southern Levant West this is seen at sites of both ‘good’ and ‘moderate’ land-use groups, while in the Southern Levant East this is the case only for sites from ‘good’ zones. Urban sites of the Southern Levant East also demonstrate higher proportions of equids in all land-use groups, compared to other regions.
Variation in taxonomic proportions is reduced at urban versus rural sites across Mesopotamia, particularly after c. 2500 cal BC. The greatest magnitude of urban-rural provisioning difference is seen over c. 3500–2000 cal BC. This is also the time during which those taxa over-represented at urban sites vary most between phases. Provisioning patterns can thus be seen to change over time, with the development after c. 2500 cal BC of differential provisioning systems within the same region between urban sites occupying different land-use zones. In Southern Mesopotamia, the abundance of pigs traditionally associated with urbanism in this region (e.g. Mudar Reference Mudar1982) does not appear until the Early Dynastic period (here c. 3000–2500 BC, Figure 8). Prior to this, urban sites demonstrate an abundance of cattle (Figure 7). Less variation is evident in high equid proportions across urban sites in many (but not all) periods. Such high proportions of equids at urban sites are not generally seen in either Central or Northern Mesopotamia (excepting Central Mesopotamia c. 2500–1500 cal BC, Figure 9). Urban sites of Central Mesopotamia demonstrate an abundance of pigs prior to c. 1500 cal BC and of cattle c. 2500–1500 cal BC. Subsequently an abundance of ovicaprines is seen in this region, with increased proportions of cattle only at sites with ‘moderate’ and ‘poor’ landscape productive capacity. Urban sites of Northern Mesopotamia also exhibit an abundance of ovicaprines at ‘moderate’ sites in most periods, with ‘good’ urban sites demonstrating an over-representation of cattle (in comparison with rural sites) and only occasional over-representation of pigs.

Figure 9. Proportion of equids at urban and rural sites through time presented by region and land use. Land-use groups are colour coded (good = green; moderate = orange; and poor = red) and settlement type is represented by symbols (circles (![]() ) = rural/?rural sites; triangles (
) = rural/?rural sites; triangles (![]() ) = urban/?urban sites) (figure by Jane Gaastra).
) = urban/?urban sites) (figure by Jane Gaastra).
Age profiles of ovicaprines
If animals were moved from rural ‘producer’ to urban ‘consumer’ sites as part of urban provisioning patterns, we might expect an over-abundance of animals from a restricted age range at urban sites and a corresponding dearth of this age at rural sites (Mudar Reference Mudar1982). Dental-age data from zooarchaeological samples were compared by region, land-use group and through time. Insufficient dental-age profiles from cattle and pigs were available for comparison. Comparison of ovicaprine age profiles demonstrates that these do vary between urban and rural sites across all regions and periods (Figure 10). While the specific proportions of juvenile and subadult animals differ between urban sites in different regions—and often between urban sites of different land-use groups within the same region—all regions demonstrate an over-abundance of these age groups at urban compared with rural sites. In some cases, the over-represented age groups vary over time (see OSM1 Figure S1) but may still be differentiated from the age group distributions of contemporaneous rural sites across all periods.

Figure 10. Percentage representation of ovicaprines by age group in rural and urban sites, data presented by region and land-use group. Settlement type is represented by symbol and land-use zones are indicated by colour (figure by Jane Gaastra).
Discussion
Our findings demonstrate that animal-provisioning differences between urban and rural sites were, indeed, systematically present across the Levant and Mesopotamia between 5000 and 1 cal BC. Broad consistency in these differences, together with their presence at the earliest urban settlement samples available in each studied region, strongly suggests that differential provisioning patterns were inherent to the functioning of urbanism across ancient Southwest Asia. Regional and chronological variations in differences between urban and rural sites indicate that these patterns were not static or rigidly defined. Urban sites in the Northern and Southern Levant, for example, maintain set patterns through time, with variation only in the magnitude of the difference between rural and urban zooarchaeological profiles. Livestock proportions at urban sites in Central and Southern Mesopotamia, however, change markedly between phases, both in the taxa that are over-represented and the magnitude of urban/rural difference. This suggests that the provisioning of urban sites in each region adapted to the cultural and economic demands of animals used for food or labour within each particular period, as well as the productive constraints of landscapes. The impact of landscape productive potential on urban sites across Southwest Asia can be seen in the different taxonomic patterns of urban provisioning and the decreased magnitude of urban/rural difference across sites of less fertile land-use zones. This indicates that the economic structures of urban sites in less fertile landscapes were either less divergent than those in more productive landscapes or focused on different taxa to accommodate local productive limitations. Across these variations, the animals present in higher proportions at urban sites were almost universally those requiring greater investment in time and resources to produce (cattle and equids) or those that could most rapidly produce high volumes of meat for urban consumption (pigs).
A prime example is the increased proportions of more mobile taxa among both rural and urban sites in less fertile zones of Central and Northern Mesopotamia (as well as across the Levant), which holds across most of the study period. Maximisation of ovicaprine production across both rural and urban sites, and a focus on the consumption of cattle rather than pigs at urban sites—especially those from less productive zones—suggests a more multifunctional role for animals pulled into urban sites from their rural hinterlands than simply fulfilling the desire for rapid meat production (a hallmark of pig husbandry). Instead, a focus on ovicaprines and cattle indicates a preference for animals useful for transportation and secondary products in addition to meat. In some cases, this preference may have strained the productive capacity of landscapes around urban sites or required the systematic stripping of livestock produced at rural satellite settlements and, indeed, further afield (see below).
These exceptions to the apparent productive limitations of less-fertile zones indicate that the a priori limitations of these land-use groups were not fixed and could be ‘worked around’ if cultural or economic demands required. Where we do see such examples of high proportions of less drought-tolerant taxa within ‘moderate’ or ‘poor’ zones, they are generally of short duration at any given urban site and correspond with a sharp deficit of animals at rural sites within the same zone. The sporadic nature of such high proportions suggests the ‘working around’ of landscape limitations was not necessarily sustainable in the long term. A key example of this is the elevated proportions of equids at urban sites of Early and Middle Bronze Age (2500–1500 BC) Central Mesopotamia, where high proportions of equids were maintained at urban sites in ‘moderate’ and ‘poor’ groups not suited to such specialised production (Figure 9). Such increased urban equid proportions are also evident at urban sites of Southern Mesopotamia which, over c. 2500–2000 cal BC, also included increased proportions of equids at urban sites in the ‘moderate’ zone and stripped equid proportions at rural sites. This is also the case for Early Bronze Age ‘moderate’ urban sites in the Southern Levant East. These not only maintained high proportions of equids but maintained higher proportions than urban sites in ‘good’ landscape groups of the same region and period. In all three regions, the high proportions of equids at urban sites appear to have been stripped from rural sites—driving equid proportions at rural sites down to essentially zero. Such high proportions of equids in less suitable land-use groups appear to have been unsustainable, with equids decreasing markedly at both rural and urban sites in subsequent periods, excepting only urban sites in the most productive areas of Southern Mesopotamia.
While it is plausible that differences in taxonomic proportions between urban and rural sites may arise from local production practices rather than the movement of livestock in some areas, examination of ovicaprine age profiles suggests a more general pattern of rural to urban provisioning. Where sufficient data are available, it is evident that the ages of animals consumed in urban and rural sites are also routinely distinct across both time and space in Southwest Asia. High proportions of subadult ovicaprines in zooarchaeological assemblages from urban sites (Figure 10) indicate the routine slaughter and consumption of animals prior to the attainment of reproductive age. A regular influx of livestock from rural hinterlands would therefore have been necessary to maintain viable ovicaprine population levels (Algaze Reference Algaze2008). The frequency with which urban sites can be seen to consume ovicaprines of a different age structure from those recovered from rural settlements indicates that the proposed provisioning dichotomy of urban-producer and rural-consumer was indeed an inherent component of urban provisioning across Southwest Asia (Mudar Reference Mudar1982; Stein Reference Stein1988). While the influx of animals into urban settlements may have been beneficial for the consumptive desires (or transportation demands) of urban residents, this ability to draw from the wider landscape also benefited cities more fundamentally. It provided them with multiple production sources in addition to the immediate urban vicinity, enabling demands to be met outside the scale of the local productive capacity. How this process functioned, and which social and political mechanisms were involved in the pulling of animals into urban settlements, however, remains to be determined.
Conclusions
This study has demonstrated that divergent animal provisioning was not restricted to specific regions or civilisations but was a key, long-term component of Southwest Asian urbanism. Across six regions, three land-use groups and five millennia, it is unsurprising that the processes changed and were constructed in each region according to the productive capacities of landscapes and the demands and desires of the time. What the variable patterns of urban provisioning demonstrate is that Southwest Asian urban settlements organised food production as part of the mechanism by which they sustained themselves—drawing from their wider hinterlands. In most cases, this accommodated the variable productive capacity of the landscapes around urban settlements by adjusting the proportions of taxa both produced in the hinterland and consumed at the centre. However, urban settlements occasionally drew more heavily from their hinterlands. In some regions, the taxa over-represented at urban sites remained relatively consistent across millennia; in others, the animals required by urban sites and their inhabitants changed over time.
The ability to draw upon the productive capacity of multiple settlements ensured that urban sites were able to meet their needs even when these exceeded the productive capacity of their immediate landscape. This meant that animals of lower fecundity and higher water requirements were available in sufficient numbers even within less fertile landscapes, and that tender young animals could be consumed with a regularity outside the capacity of on-site production. The ability to draw animals from a range of rural settlements also provided urban sites with a form of productive insurance. Loss of productivity at a rural site could be disastrous for its inhabitants but urban centres could draw upon multiple rural satellites to manage and maintain capacity. Fewer animals may have been available for urban consumption, but the remaining rural satellites would have buffered the urban impact. Thus, we may think of urban production systems less as a delicate house of cards than as a house of stone. Rather than each settlement (rural or urban) forming a critical support to the entire construction of civilisations (as in a house of cards), each can be viewed as a separate block. If one block is removed from a wall—with the productive failure of a single rural site—the strain is simply redistributed across the remainder. If many blocks are removed, the strain may become too great and one wall may collapse (with the collapse of an urban centre). Only when many blocks are removed from many walls will the entire house (urbanism across a region) crumble to the ground.
Acknowledgements
We thank Katleen Deckers, Michelle W. de Gruchy and the rest of the CLaSS project team for useful discussions in the development of this article.
Funding statement
This research was supported by the European Research Council under the European Union's Horizon 2020 research and innovation programme for the project ‘CLaSS – Climate, Landscape, Settlement and Society: Exploring Human Environment Interaction in the Ancient Near East’ (grant number 802424, award holder: Dan Lawrence). After October 2022, Tumolo was also funded by European Union funding under the Horizon Europe grant HORIZON-MSCA-2021-PF-01 for the project ‘Food- Store’ (grant number 101066771).
Supplementary material
To view supplementary material for this article, please visit https://doi.org/10.15184/aqy.2024.24.


 Open access