


LEARNING OBJECTIVES
After reading this article you will be able to:
• explain some basic epidemiological terminology
• consider the epidemiology of common mental health problems that occur in older people
• reflect on determinants of mental ill health and well-being in old age.
Epidemiology is the study of disease and its determinants in populations. Epidemiological studies investigate what the patterns of diseases are and why they develop in particular populations (Woodward Reference Woodward2014: pp. 1–2) (Box 1).
The five Ws of epidemiology
Descriptive epidemiology, comprising:
What = Disease
Who = Person
Where = Place
When = Time
Analytical epidemiology, comprising:
Why = Cause, risk factors
(Kobayashi Reference Kobayashi2009)
Epidemiology is important in improving our understanding of what causes disease. Similarly, understanding epidemiology and how to interpret observational data is crucial to avoid inaccurate causal inferences. Unfortunately, critically evaluating all of the data on mental health problems in old age was outside the scope of this article, but we try to highlight some important limitations and gaps in the literature. There are exciting developments in epidemiology that will guide our knowledge about the determinants of psychiatric disease. For example, genomic-wide association studies (GWAS) are increasing our understanding of genetic associations with psychiatric diseases. In Alzheimer's disease, epidemiology has revealed genetic susceptibilities and identified modifiable environmental risk factors, as well as leading to improved diagnostic criteria through the use of biomarkers. It has been estimated that modifying risk factors could ‘delay or prevent a third of dementia cases’ (Livingstone Reference Livingstone, Sommerland and Orgeta2017), which has enormous implications for the information that clinicians give to their patients, as well as for public health policies.
Definitions
Descriptive epidemiology describes the spread of diseases and their severity in populations. In descriptive epidemiology the disease pattern is established with regard to time, place and person. Thus, for example, we might consider the population affected, the characteristics of the disease and how it changes over time.
Analytical epidemiology seeks to explain why people get the disease. In analytical epidemiology, the association between the exposure and the outcome is studied to try to establish whether certain exposures are risk factors for the development of disease.
Observational studies allow associations to be derived from observing populations, rather than from performing experiments. This means that it is harder to establish whether associations are causal. One of the most significant difficulties in interpreting observational data is determining whether the exposure (A) caused the outcome (B). Without experimental conditions, it is difficult to reach this conclusion, since B may have caused A (reverse causation), or C may have caused A and/or B (confounding).
Basic measurements in epidemiology include prevalence and incidence rates (Box 2).
Prevalence and incidence rates
Prevalence rates ‘define the proportion of people in a population who are affected by a disease at one particular time’.
Incidence rates ‘express the rate of occurrence of new cases of a disease and may be defined as the frequency of some event related to a disease (e.g. onset of symptoms, hospital admission) related to the size of the population and a specified time period’.
(Barker Reference Barker and Rose1976: pp. 47, 48)
The gold-standard experimental design to try to establish causality is a randomised controlled trial (RCT). However, this is not always practical or ethical. You cannot randomise people to a treatment thought to increase the risk of disease. Therefore, careful observational studies with appreciation of their limitations are an important source for understanding diseases and their determinants.
Observational study designs
There are different types of observational study, which we shall briefly discuss here. The main designs are: descriptive studies of population prevalence, cross-sectional surveys, case–control studies and cohort studies.
Descriptive studies
Prevalence is the proportion of a population who have a specific disease. The point prevalence is the prevalence of the disease measured at a particular time point. The period prevalence is the prevalence during a time interval. The prevalence of dementia increases significantly with age, therefore prevalence for this condition is often expressed for age brackets. Prevalence of dementia according to 5-year age groups can be reviewed in Table 1. Roughly, the prevalence of dementia doubles every 5 years after 65 years of age (Prince Reference Prince, Bryce and Albanese2013).
The prevalence of late-onset dementia according to 5-year age groups

Source: Prince et al (Reference Prince, Bryce and Albanese2013).
The prevalence is approximately the same as the incidence (Box 2) multiplied by the disease duration; therefore, diseases with short durations have similar prevalence and incidence rates. For dementia, a chronic condition, the prevalence is far greater than the incidence. Incidence is not always a useful way to describe mental illnesses. Most mental illnesses, for example schizophrenia and bipolar affective disorder, have relapsing and remitting courses, which can be hard to capture in a single incidence study. In any case, both prevalence and incidence figures depend on the definition of a case and its operational criteria (Minett Reference Minett, Stephan, Brayne, Dening and Thomas2013).
Cross-sectional surveys
A cross-sectional survey is a type of observational study that measures relevant data on a sample population at a specific time point (Woodward Reference Woodward2014: p. 19). In a cross-sectional study a sample population is chosen and then a survey is conducted to determine whether the population has the disease or the risk factor of interest.
Cross-sectional surveys are quick and cheap to perform. However, they may be prone to selection bias if those responding to the survey are not representative of the general public. They are an inefficient method of determining prevalence of rare diseases and it is extremely difficult to establish cause and effect. The sample population that is surveyed must be considered carefully, because certain diseases will be over-represented in certain populations. For example, the prevalence of late-onset schizophrenia is higher in in-patient settings and nursing homes than in the community (Castle Reference Castle and Murray1993).
Case–control studies
Case–control studies are more useful than cross-sectional surveys in studying rare diseases. Rather than studying a whole representative population, cases are chosen as individuals who have the disease of interest. Controls are then chosen as individuals who are disease free. The risk factors between the cases and controls are then examined to determine whether a particular risk factor is associated with developing the disease. In this way an odds ratio can be calculated. An odds ratio determines the odds of the outcome developing in the exposure group, as compared with the odds of the outcome developing in the control group (Box 3).
Relative risk and odds ratios
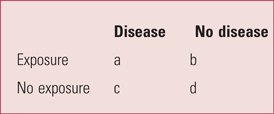
Relative risk is the ratio of the probability of developing the disease in the exposure group, compared with the non-exposure group:
 $${\rm RR} = \lpar {{\rm a}/\lpar {{\rm a} + {\rm b}} \rpar } \rpar /\lpar {{\rm c}/{\rm c} + {\rm d}} \rpar )$$
The odds ratio is the ratio of the odds of the disease in the exposure group compared with the odds of the disease in the control group:
 $${\rm OR} = \lpar {{\rm a}/{\rm b}} \rpar /\lpar {{\rm c}/{\rm d}} \rpar $$
(Woodward Reference Woodward2014)
In old age psychiatry, case–control studies have been most commonly used to investigate risk factors for the development of dementia. There are disadvantages to this type of study, for example they are prone to biases. Individuals in the case group may have been more extensively investigated or they may be more likely to recall exposures to risk factors than those in the control group. In addition, reverse causality can be problematic. For example, depression has been identified as a risk factor for dementia; contrariwise, perhaps dementia causes depression; or there may be a common pathophysiological pathway (for example, cerebrovascular disease or inflammation) to cause both (Jorm Reference Jorm2001; Singh-Manoux Reference Singh-Manoux, Dugravot and Fournier2017). Given these limitations, cohort studies where participants are followed up over time may be used to help ascertain causality.
Cohort studies
Cohort studies are a form of longitudinal study in which individuals are chosen on the basis of whether they have had exposure to a risk factor of interest, and then followed up to ascertain whether they develop the disease (Woodward Reference Woodward2014: p. 165). The ratio of the probability of developing the outcome in the exposure group compared with the non-exposure group is expressed as the relative risk (RR) (Box 3): RR = 1 suggests no difference in risk between the two groups; RR >1 suggests an increased risk in the exposed group, whereas RR < 1 suggests a reduced risk in the exposed group.
Cohort studies are more helpful in determining causality than other types of observational study. The individuals chosen are disease free to begin with, which makes it more likely that the exposure caused the outcome. However, cohort studies are costly because they require a large number of individuals and long follow-up periods (Woodward Reference Woodward2014: p. 167).
Epidemiology of dementia
Dementia is a broad term for a range of diseases that cause progressive cognitive decline, severe enough to affect functioning (Sosa-Ortiz Reference Sosa-Ortiz, Acosta-Castillo and Prince2012). There are many different causes of dementia. In this article, we shall only discuss the epidemiology of the three leading causes of dementia: Alzheimer's disease, vascular dementia and dementia with Lewy bodies (DLB).
Although there are some forms of dementia that affect younger people, dementia is in general a disease of older people, with age being the biggest risk factor. Consequently, with an ageing global population, the prevalence of dementia worldwide has been increasing. However, a review of world literature by Wu et al (Reference Wu, Beiser and Breteler2017) found stable or decreasing incidence and prevalence for dementia in high-income countries. In the UK, for instance, two consecutive Cognitive Function and Ageing Studies (CFAS I and CFAS II) showed that over the course of two decades there was a 23% reduction in the prevalence of dementia in three areas of England (Cambridgeshire, Newcastle and Nottingham): on the basis of the data from CFAS I, the researchers would have expected 8.3% (884 000 people) to have dementia, whereas the figure was 6.5% (670 000 people), representing a decrease of 1.8% (Matthews Reference Matthews, Arthur and Barnes2013).
The CFAS, the results of which have been replicated in other countries (Wu Reference Wu, Beiser and Breteler2017), provide a rich source of further information. For example, first, when combined with neuropathological findings, the CFAS raise fundamental questions about the basis of cognitive impairment. Wharton et al (Reference Wharton, Brayne and Savva2011) have shown: a high prevalence of mixed Alzheimer's and vascular pathology; a significant population of people who die with dementia, but whose brains show less of the pathology associated with dementia; and a group with a lot of pathology, but little dementia. This reflects the earlier findings of the Nun Study (Snowdon Reference Snowdon2003), which focused on nuns in the Order of Notre Dame in the USA.
Second, the studies have been used to show that people living with dementia are now relying much more on unpaid care than are people with other long-term conditions (Bennett Reference Bennett, Norton and Bunn2018).
Third, there has been much speculation on the reasons for the decrease in the prevalence of dementia in higher-income countries. They probably reflect changes in lifestyle. For instance, there is evidence that decreased salt intake has led to decreases in blood pressure, which may have contributed to decreases in mortality from stroke and ischaemic heart disease (He Reference He, Pombo-Rodrigues and MacGregor2014). Such changes would presumably have an impact on dementia pathology too. Meanwhile, the CFAS have shown that higher educational attainment, a more complex mid-life occupation and late-life social engagement are all ways in which cognitive function might be preserved in later life (Marioni Reference Marioni, Valenzuela and van den Hout2012).
There is a lack of epidemiological data from low- and middle-income countries, but it is likely that, with their populations ageing, the prevalence of dementia is increasing. There are an estimated 47 million people living with dementia worldwide and Prince et al (Reference Prince, Bryce and Albanese2013) estimate that this will rise to 48.1 million people by 2020 and to 90.3 million by 2040. For some years the 10/66 Dementia Research Group have looked at ageing in low- and middle-income countries (Prince Reference Prince, Ferri and Acosta2007). In the regions covered by the 10/66 investigators, the prevalence of dementia has been estimated to be between 5.6 and 11.7%. Their research shows great variation in prevalence rates, especially in comparison with European studies (Minett Reference Minett, Stephan, Brayne, Dening and Thomas2013).
Alzheimer's disease
The leading cause of dementia is Alzheimer's disease. Alois Alzheimer first described the pathological hallmarks of plaques and neurofibrillary tangles in 1907, but even then there were vascular components too (Stelzmann Reference Stelzmann, Norman Schnitzlein and Murtagh1995). There is an overlap between the risk factors for Alzheimer's disease and other forms of dementia, and these are laid out in Table 2.
Risk factors for dementia and Alzheimer's disease

Identifying these risk factors has led to recommendations to delay and prevent the development of dementia. These include active treatment of hypertension and diabetes, alongside proactive smoking cessation advice and management of hearing loss (Livingstone Reference Livingstone, Sommerland and Orgeta2017).
Vascular dementia
Vascular dementia is a form of dementia caused by diminished cerebral blood flow. Vascular dementia often presents as cognitive impairment following a stroke, although it can present as cognitive impairment with established cerebrovascular disease and no history of stroke (Smith Reference Smith2017). The classification of dementia is debated – how helpful are such classifications? – and we know that often we are not describing discrete entities (Hughes Reference Hughes2011). Generally, people presenting with cognitive impairment in their 60s and 70s are more likely to have a single aetiology underlying their dementia. Older people, however, as we have already seen, are more likely to have mixed pictures (Wharton Reference Wharton, Brayne and Savva2011).
Vascular dementia is the second most common cause of dementia after Alzheimer's disease. Some degree of cerebrovascular disease is seen in 80% of dementias (Smith Reference Smith2017). Summing up a variety of studies, Kalaria (Reference Kalaria, Ames, O'Brien and Burns2017: p. 645) suggested that ‘the worldwide frequency of [vascular dementia] in autopsy-verified cases is determined to be 10–15%, being marginally less than when clinical criteria alone are used’. Again, the prevalence of vascular dementia rises with age: across 11 cohorts in Europe the prevalence is 1.6% among people 65 years and over; but it rises from 0.1% in females and 0.5% in males between 65 and 69 years to 5.8% in females and 3.6% in males who are 90 years old or above (Lobo Reference Lobo, Launer and Fratiglioni2000).
Lewy body dementia
Dementia with Lewy bodies (DLB) is the most common cause of dementia after Alzheimer's disease and vascular dementia. Lewy bodies are neuronal inclusion bodies and the location in the brain where they aggregate determines the clinical syndrome that predominates. Lewy bodies largely located in the basal ganglia lead to Parkinson's disease. Cerebral Lewy bodies are associated with DLB, although they are not specific to it and are also found at autopsy in patients with Alzheimer's disease (Hamilton Reference Hamilton2000).
Like other dementias, the prevalence of DLB increases with age. The average age at presentation is 75 years old (Barber Reference Barber, Panikkar and McKeith2001). Lewy body pathology is identified more commonly than Lewy body disease is diagnosed clinically. In one systematic review where dementia classification was in accordance with DSM-IV and DLB subtype was diagnosed using the original (1996) or revised (2005) International Consensus Criteria, DLB accounted for 4.2% of all diagnosed dementias in the community, a figure that rose to 7.5% in secondary care (Vann Jones Reference Vann Jones and O'Brien2014). The incidence of DLB was 3.8% of new dementia cases (Vann Jones Reference Vann Jones and O'Brien2014). The exact prevalence of DLB is debated. Elsewhere it has been estimated to be 10–22% of the dementias in people 65 years or over, suggesting that 1% of this population have DLB (Rongve Reference Rongve, Aarsland, Dening and Thomas2013). But the diagnostic rate depends on the diagnostic criteria used (Vann Jones Reference Vann Jones and O'Brien2014). Men have a higher prevalence of DLB than women, with one study showing a male-to-female preponderance in the ratio of 4:1 (Savica Reference Savica, Grossardt and Bower2013).
Behavioural and psychological symptoms of dementia
Behavioural and psychological symptoms of dementia (BPSD) include irritability, apathy, psychotic symptoms, agitation, wandering and depression. A systematic review of longitudinal studies of BPSD, the majority from the USA, Canada and Europe, showed a high prevalence of apathy, depression, agitation and wandering and a low prevalence of anxiety and hallucinations (van der Linde Reference van der Linde, Dening and Stephan2016). Affective symptoms such as apathy and depression tend to persist rather than occur episodically. Included studies used a variety of assessment measures. For example, studies that used the informant-based Behavioural Pathology in Alzheimer's Disease (BEHAVE-AD) rating scale to measure BPSD demonstrated a higher prevalence than studies using the Neuropsychiatric Inventory (NPI) (van der Linde Reference van der Linde, Dening and Stephan2016).
Comorbid disease
Of course, dementia tends not to come alone. Older people are prone to a variety of comorbid physical diseases. In the Newcastle 85+ cohort study, people aged 85 years or older had on average five diseases, the most prevalent being hypertension (57.5%) and osteoarthritis (51.8%), with moderate to severe cognitive impairment featuring in 11.7% (Collerton Reference Collerton, Davies and Jagger2009). Data from CFAS I and CFAS II, mentioned above, demonstrated that in the 10 years between the two studies the prevalence of diabetes and visual impairment in diabetes increased, which provides evidence that can be correlated with other possible comorbidities (Bennett Reference Bennett, Norton and Bunn2018).
But it is also possible that more than one mental illness might be present at one time. This is a complicated area because of difficulties ensuring that the same diagnostic criteria have been applied across studies and because of the possibility that one condition leads to or is part of the other. In one systematic review and meta-analysis of comorbid mental illnesses in people with dementia compared with their healthy peers, the mean prevalence of depression ranged from 20% in Alzheimer's disease, to 37% in frontotemporal degeneration and to 13% in healthy controls (Kuring Reference Kuring, Mathias and Ward2018). When all the different types of dementia were combined the prevalence of depression increased to 25%, whereas in the controls it was 13%. In the same study, the prevalence of anxiety in all types of dementia was 14%, but this was not statistically different from the rate in the healthy controls (3%), albeit the anxiety analyses were thought to be underpowered (i.e. the sample sizes were not sufficient to show statistical differences). The review's authors also considered the literature on post-traumatic stress disorder (PTSD) and dementia. They did not find enough (only two studies) to perform a meaningful statistical analysis, but the overall prevalence of PTSD in dementia was 4.4% (Kuring Reference Kuring, Mathias and Ward2018).
Dementia and dying
The majority of people with dementia in the UK die in the community. In a study in the north of England looking at people who had been diagnosed with early-onset dementia (called ‘pre-senile dementia’ in the paper, which referred to people between the ages of 45 and 64 years identified from records between 1985 and 1989) who had died by the end of 1998, 19.3% died at home, 24.5% in nursing or residential homes and 56.3% in hospital (Kay Reference Kay, Forster and Newens2000). In the over-65s dementia is one of the leading causes of death, and for those who have died from another cause with dementia as a contributory factor, stroke, Parkinson's disease and ischaemic heart disease are the most common causes (Public Health England 2016). Indeed, cognitive impairment is strongly associated with an increased mortality; a UK population study gives a median survival time from diagnosis of dementia to death as 4.1 years (Xie Reference Xie, Brayne and Matthews2008).
A large cohort study of nursing-home residents in the USA revealed that, compared with residents with terminal cancer, residents with advanced dementia received more active and non-palliative interventions, less advanced care planning and palliative symptoms were not as well controlled (Mitchell Reference Mitchell, Kiely and Hamel2004). Similar patterns are seen in the UK. For example, in a study in London between 2012 and 2014, of 85 people living with advanced dementia in nursing homes or their own homes, pain (11% at rest, 61% on movement) and significant agitation (54%) were common and persistent (Sampson Reference Sampson, Candy and Davis2018). Aspiration, dyspnoea, septicaemia and pneumonia were more frequent in those who had died by the end of the study (mortality at 9 months was 37%). The researchers found that 76% had ‘do not resuscitate’ orders, 30% had an advance care plan, 40% a documented preferred place of death and 40% a lasting power of attorney (Sampson Reference Sampson, Candy and Davis2018).
The epidemiology of functional illnesses and suicide in the elderly
Depression
Depression is one of the most common mental health conditions to affect older people, although it is not a normal part of ageing. Depression in older people is associated with impaired functioning (Ormel Reference Ormel, VonKorff and Ustun1994), increased use of healthcare services (Beekman Reference Beekman, Copeland and Prince1999) and an increase in mortality (Djernes Reference Djernes, Gulmann and Foldager2011). Given that depression is a readily treatable disorder, this is a potential target for a significant improvement in morbidity and mortality in older people (Beekman Reference Beekman, Copeland and Prince1999).
Older people suffer bereavements and social role transitions such as retirement or loss of independent living. Despite this, major depression is not common in older people, with a review of the literature by Fiske et al (Reference Fiske, Wetherell and Gatz2009) finding a prevalence of 1–5% (most studies report prevalence figures closer to 1%) in large studies in the USA of community-dwelling older adults. These studies tended to use DSM-IV criteria to define major depressive disorder. Minor depression, however, is common. The prevalence of depression was 8.7% (95% CI 7.3–10.2) in those living in the community in England and Wales (McDougall Reference McDougall, Kvaal and Matthews2007a), and it was as high as 27.1% in a large UK-based cohort study of those living in institutions (McDougall Reference McDougall, Matthews and Kvaal2007b).
The definition of minor depression varies between studies. In some it refers to clinically significant depression that does not meet criteria for major depressive disorder. In others, however, it denotes subclinical depressive symptoms. Which of these definitions is adopted will have a significant effect on prevalence and highlights the importance of the diagnostic criteria adopted by any particular study. Similarly, studies that use depression symptom checklists rather than diagnostic criteria can overestimate rates of depression in older people because positive responses can relate to physical symptoms or bereavement rather than depression (Fiske Reference Fiske, Wetherell and Gatz2009). Data from 47 studies of older adults in acute hospitals show that the prevalence of depression is 29% (RCPsych 2005).
Bipolar affective disorder
Similar to the prevalence of unipolar depression in older people, the prevalence of bipolar affective disorder varies according to the setting in which it is being studied. In the USA, the prevalence of bipolar disorder in the community is 0.1% (Koenig Reference Koenig and Blazer1992), but is higher in nursing homes – between 3% (Tariot Reference Tariot, Podgorski and Blazina1993) and 10% (Koenig Reference Koenig and Blazer1992). A more recent study, albeit less rigorous in its definition of bipolar affective disorder, found a prevalence of 0.5% in those over 65 years in the community in the USA (Hirschfeld Reference Hirschfeld, Calabrese and Weisman2003). Bipolar disorder usually starts in younger adults, with a mean age at onset between 20 and 30 years (Rowland Reference Rowland and Marwaha2018). It has been estimated that 90% of individuals with bipolar disorder will have developed their illness before the age of 50 (Oostervink Reference Oostervink, Boomsma and Nolen2009), which is supported by an Australian study which found that only 8% of patients with bipolar disorder presented for the first time to mental health services once they were over the age of 65 years (Almeida Reference Almeida and Fenner2002). Interestingly, whereas the prevalence for bipolar disorder among men and women is similar in younger adults, in older people a systematic review found a preponderance of women: 69% of individuals presenting with bipolar disorder over the age of 65 are reported to be women (Depp Reference Depp and Jeste2004).
Depp & Jeste (Reference Depp and Jeste2004) also provide a critical review of epidemiological studies of bipolar disorder in older people. They comment that the majority of the studies included used convenience sampling of psychiatric in-patients who were mostly in a manic phase of their illness, whereas the vast majority of people with bipolar disorder live in the community. We know less about those living in the community between episodes or during depressive periods. In addition, a range of different diagnostic classifications were used, including DSM-III, DSM-IV and ICD revisions 8–10.
Late-onset schizophrenia
Individuals with late-onset schizophrenia (Box 4) are more likely to suffer from sensory impairment (Pearlson Reference Pearlson and Rabins1988), particularly hearing loss (Harris Reference Harris and Jeste1988).
Schizophrenia onset in middle and old age: terminology
In 1911, Eugen Bleuler was the first to publish the observation that a small number of people with schizophrenia seemed to develop the disease in their middle to old age. There has typically been confusion concerning nomenclature in this field and the tendency is for psychosis in old age to be thought of as organic. The International Late-Onset Schizophrenia Group has established accepted terminology for these conditions to try to improve diagnosis of functional psychosis in older people, the consensus being that schizophrenia developing between the ages of 40 and 60 is named late-onset schizophrenia, and after the age of 60 is very-late-onset schizophrenia.
The prevalence of late-onset schizophrenia is higher in individuals with a positive family history of schizophrenia, although this association is not as strong as in those with early-onset schizophrenia (Harris Reference Harris and Jeste1988). Similarly to bipolar disorder in older people, there is a female preponderance for late-onset schizophrenia. A systematic review of literature published between 1960 and 2016 found that the pooled incidence of schizophrenia in those over 65 was 7.5 per 100 000 person-years at risk, with an increased risk in women (OR = 1.6, 95% CI 1.0–2.5) (Stafford Reference Stafford, Howard and Kirkbride2018). Included studies used a range of different diagnostic classifications (ICD revisions 8–10, DSM-III and DSM-IV) and organic causes were excluded. One review reported that 23.5% of patients with schizophrenia had symptom onset after the age of 40 years (Harris Reference Harris and Jeste1988).
Delirium
Delirium is the most common psychiatric condition among general hospital in-patients. The prevalence on medical wards is 20–30% in the UK, and this rises to nearly 50% of patients who have surgery (National Institute for Health and Care Excellence 2010: p. 5). In the community, understandably, the prevalence is lower, at 1–2%. Individuals who develop delirium have more comorbidities and greater polypharmacy (Folstein Reference Folstein, Bassett and Romanoski1991).
One limitation with epidemiological data on delirium is that a diagnosis of delirium relies on a retrospective account of premorbid functioning and this can often be subject to recall bias. This can make it difficult to distinguish between delirium and pre-existing dementia. In addition, studies often exclude participants who have delirium on top of pre-existing cognitive impairment, which leaves a paucity of information on the clinical presentation of delirium in those with dementia (Davis Reference Davis, Kreisei and Terrera2013).
A large population-based cohort study in Finland showed that delirium was strongly associated with a future risk of developing dementia (OR = 8.7, 95% CI 2.1–35) (Davis Reference Davis, Muniz Terrera and Keage2012). The study relied on retrospective recall of episodes of delirium, and it should be noted that hyperactive delirium is more likely to be remembered than hypoactive delirium.
Anxiety-related disorders
The prevalence of new presentations of anxiety-related illnesses reduces with age. This may in part reflect a reduction in care-seeking behaviour by older people, or a reduced rate of detection by clinicians, or it might be that older people with anxiety are inappropriately referred to medical or surgical services for treatment of somatisation (Blazer Reference Blazer, George, Hughes, Salzman and Lebowitz1991). Table 3 summarises the 1-month prevalence of different anxiety-related disorders in people over the age of 65 from the US Epidemiologic Catchment Area (ECA) study (Regier Reference Regier, Boyd and Burke1988). The ECA sampled community residents and those in institutions and used personal interviews in line with the Diagnostic Interview Schedule. Diagnoses were made according to DSM-III.
Prevalence of anxiety-related disorders in the 65+ age group

Source: Regier et al (Reference Regier, Boyd and Burke1988).
There are few epidemiological studies looking at the prevalence of anxiety-related conditions in older people and The Epidemiological Catchment Area (ECA) study remains one of the most widely used sources for determining how common anxiety disorders are in older people living in the community. A more recent study, the MentDis_ICF65+, is a cross-sectional multicentre survey based on a selection of European countries. Diagnoses were made with an adapted version of the Composite International Diagnostic Interview (CIDI), the CIDI65+. According to this study the overall 12-month prevalence of anxiety disorders were higher than in previous epidemiological studies, with a 12 month prevalence of 3.8% for panic disorder, 4.9% for agoraphobia, 1.4% for post-traumatic stress disorder and 9.2% for phobic disorders (Andreas et al. Reference Andreas, Schulz and Volkert2017).
Eating disorders
Although young women are most at risk of developing eating disorders, eating disorders do affect men and women of all ages. There are very few incidence studies of eating disorders among older people. A review found a prevalence of eating disorders according to DSM-5 of 3–4% in women and 1–2% in men over the age of 40 years (Mangweth-Matzek Reference Mangweth-Matzek and Hoek2017). In women, childhood sexual abuse has been associated with binge eating disorder. In men, excessive exercise is associated with binge eating disorder, which often masks symptoms and makes diagnosis more difficult (Mangweth-Matzek Reference Mangweth-Matzek and Hoek2017).
Personality disorders
There are numerous methodological concerns and a poverty of information regarding the epidemiology of personality disorders in old age. One common criticism is that the diagnostic criteria for personality disorders are focused on diagnosis for younger people and may not be valid in an older age group, where biological and psychological factors of ageing will affect the behaviour necessary for a diagnosis (van Alphen Reference van Alphen and Engelen2006).
The prevalence varies in different meta-analyses, but is reported to be between 2.8 and 13% of older people living in the community and 5 and 33% of patients in secondary psychiatric settings (van Alphen Reference van Alphen, Derksen and Sadavoy2012). The idea that personality disorders ‘burn out’ in later life may not hold true. A cross-sectional study in The Netherlands showed that the prevalence of personality disorders is similar in old age; however, the prevalence of specific personality disorders changes (Engels Reference Engels, Duijsens and Haringsma2003). This study used the self-report Questionnaire of Personality Traits, which is based on DSM-III and ICD-10. Older people were found to display more schizoid and anankastic personality traits and fewer emotionally unstable and paranoid personality traits (Engels Reference Engels, Duijsens and Haringsma2003).
Substance misuse
Substance misuse among older people is a growing area of concern. Harmful drinking is falling in most age groups in most countries, yet in ‘baby boomers’ (people born between 1946 and 1964) harmful drinking has been increasing (Rao Reference Rao and Roche2017). Alcohol is the most common substance misused, but drug misuse, mainly of prescription drugs, is also increasing in older people (Rao Reference Rao and Roche2017).
Prevalence studies of alcohol misuse in older people are likely to give an underestimate owing to (a) reluctance of older people to disclose this information, (b) less suspicion from clinicians and (c) fewer well-validated screening tools for this age group (Khan Reference Khan, Davis and Wilkinson2002). The prevalence of alcohol misuse in individuals over the age of 65 in the USA as diagnosed by DSM-IV is 1.2%, and is estimated at 0.24% for alcohol dependence (Kuerbis Reference Kuerbis, Sacco and Blazer2014). If this is extended to individuals over the age of 50, the prevalence of alcohol use disorders is 2.98% (Kuerbis Reference Kuerbis, Sacco and Blazer2014).
Older people take more prescribed and over-the-counter medications and, although often taken appropriately, these medications are prone to misuse. One review (Curkovic Reference Curkovic, Dogic-Curkovic and Eric2016) found that psychotropic medications are commonly prescribed to older adults worldwide, particularly benzodiazepines, antipsychotics and antidepressants, namely SSRIs. Polypharmacy is frequent in older people and adverse drug reactions are much more likely when four or more drugs are prescribed (Cadieux Reference Cadieux1989).
The prevalence of illicit drug dependence decreases with age, although rates do vary according to the cohort, with baby boomers using more illicit drugs than previous generations (Rao Reference Rao and Roche2017). In the USA, the prevalence of illicit drug dependence in older people is less than 1%, compared with 17% in 18- to 29-year-olds (Hinkin Reference Hinkin, Castellon and Dickinson-Fuhrman2001).
Suicide
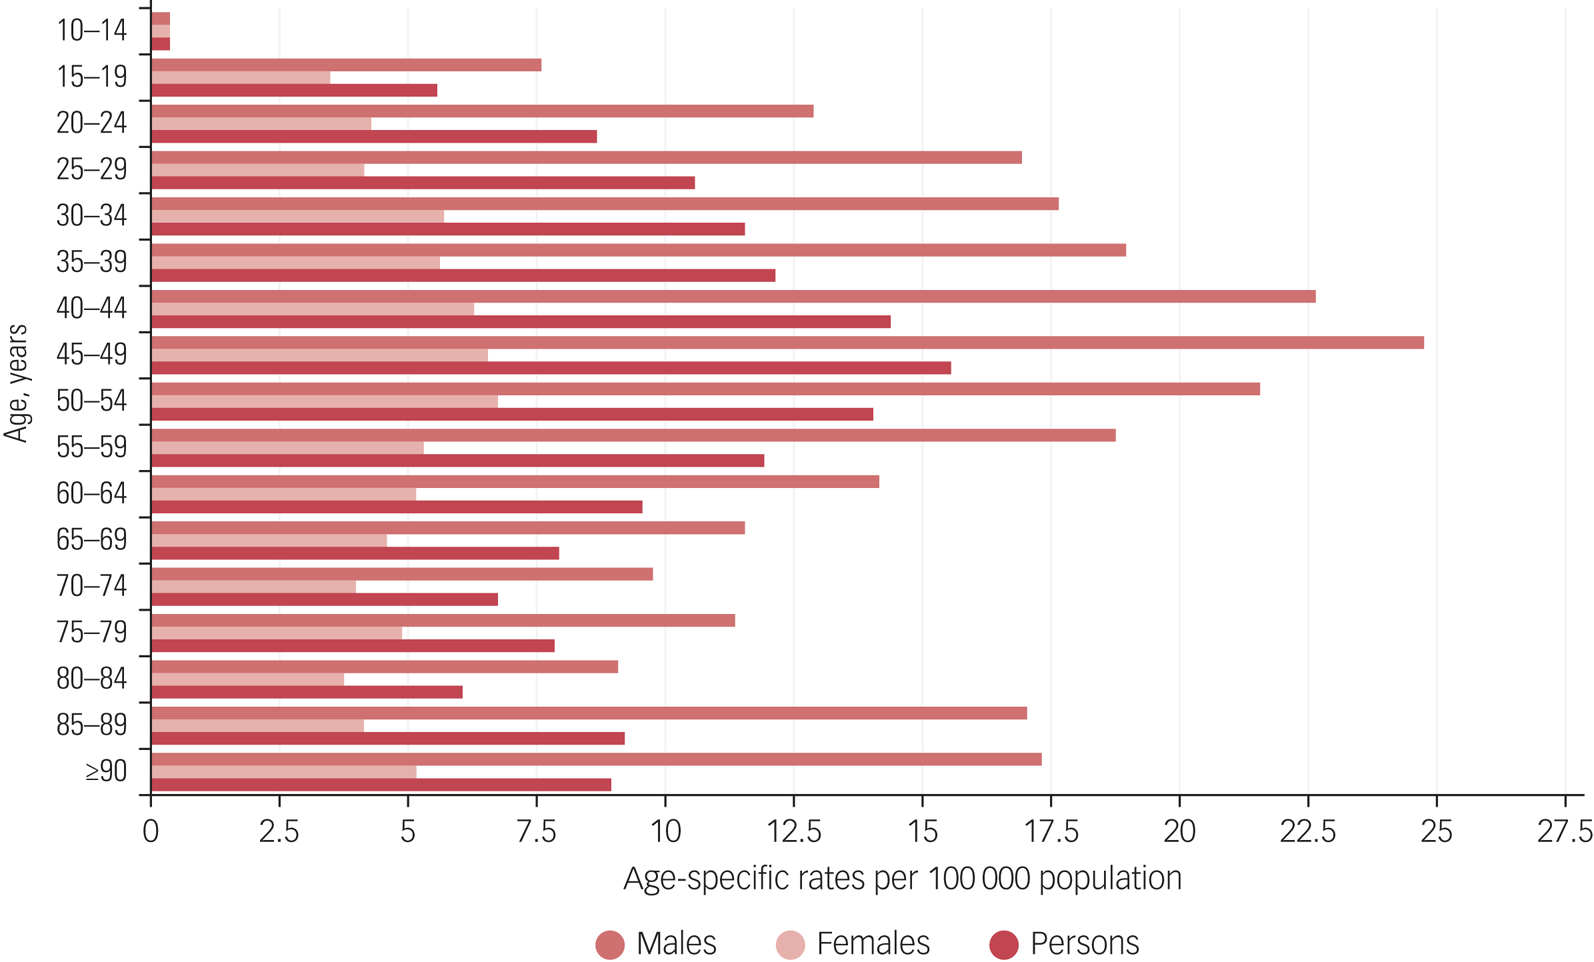
Suicide rates vary according to country and in the UK suicide has been decreasing among older people since the 1950s (Gunnell Reference Gunnell, Middleton and Whitley2003). Recent figures from the Office for National Statistics (2017) show that suicide rates increase with age up to the highest rates among 45- to 49-year-olds. The rates then decrease until the age of 80, when they begin to rise again (Fig. 1); suicide rates in the very old have stayed relatively static over time. Reduction in suicide rates among older people in the UK has been associated with a reduction in access to lethal means and a rise in gross domestic product (GDP) (Gunnell Reference Gunnell, Middleton and Whitley2003).
Age-specific suicide rates per 100 000 population in the UK by gender and 5-year age groups, registered in 2017 (Office for National Statistics 2017: p. 10). Reproduced under the Open Government Licence v3.0.
As the baby boomer generation moves into old age, however, the general fall in suicides in the UK could change. This cohort is associated with higher rates of suicide than other generations and have higher rates of substance misuse than other age groups (Rao Reference Rao and Roche2017), which may predispose to suicide.
Conclusions: mental illness and mental health in old age
The epidemiological evidence shows a high burden of mental illness in the population of older people. Mental illness in older people can often present differently (for example, anxiety-related disorders may present as physical illnesses) or go undiagnosed. Identifying and treating mental illness is one aspect of improving the lives of older people, but another aspect is maximising mental health in general and improving quality of life.
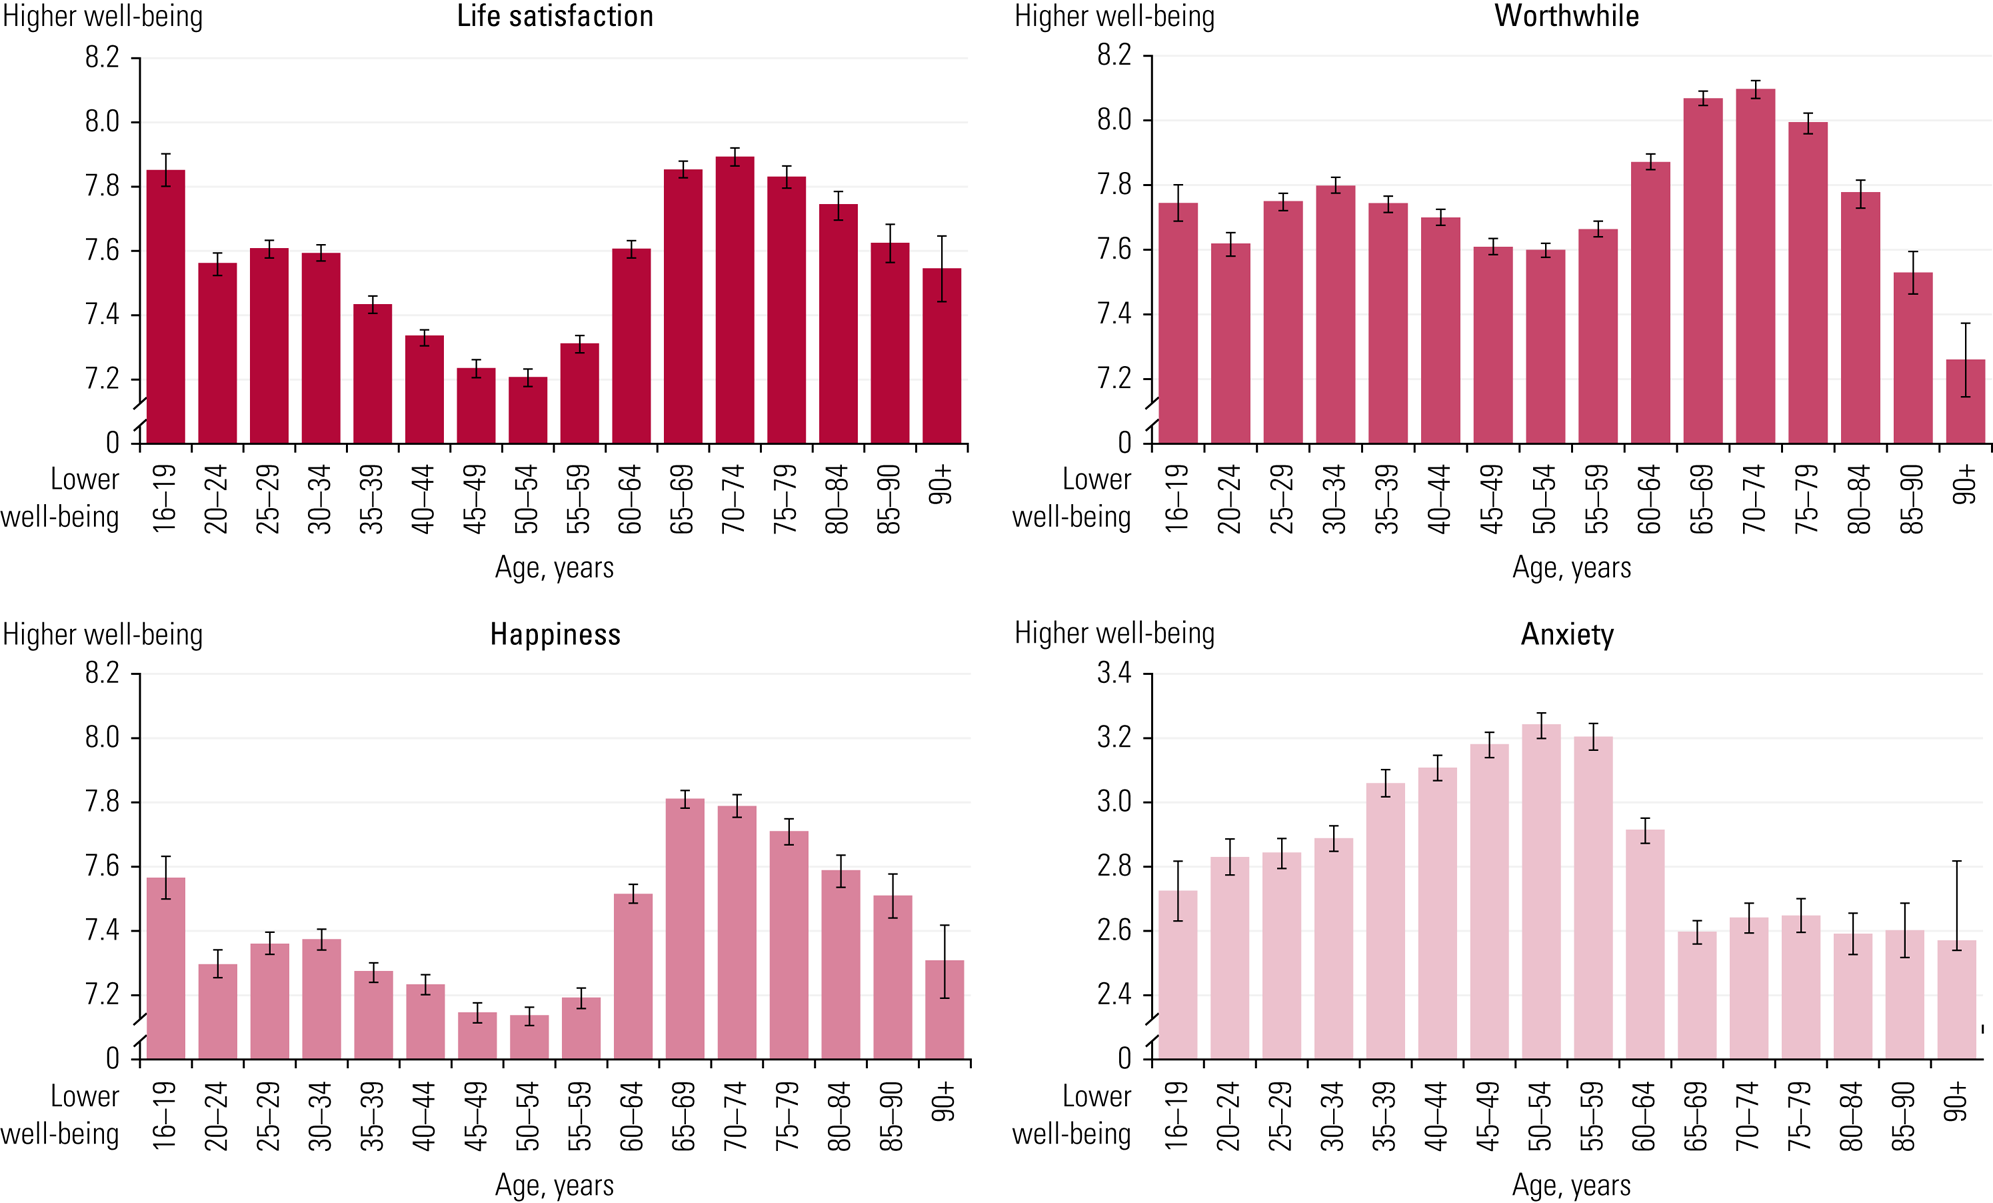
Quality of life in old age in the UK has improved over time. There are fewer older people living in poverty; household incomes and the physical health of older people have improved. The Office for National Statistics (2016) has found that life satisfaction actually rises after age 59, peaks in those aged 70–74 and begins to fall in those over 75, but in people over 90 there are higher levels of life satisfaction than people in their middle age (Fig. 2). People over 90, however, did show falling levels of feeling worthwhile and falling levels of happiness. Poor health, loneliness and isolation may all contribute to this, and are important targets of polices aiming to improve the overall mental health of older people (Office for National Statistics 2016).
Average UK personal well-being ratings by age for 2012–2015, measured by self-rating scales scored 0–10 (Office for National Statistics 2016: p. 3). Reproduced under the Open Government Licence v3.0.
We have shown, therefore, in this brief overview that older people have significant psychiatric morbidity, may present differently from younger people, but present opportunities for both curative and palliative care. Epidemiology and public health research generally help to focus our attention on what matters and on what might be done to alleviate morbidity and associated mortality.
Acknowledgements
We are very grateful for the advice and comments we received from three anonymous reviewers. Their input has improved the article; its deficiencies remain our responsibility.
MCQs
Select the single best option for each question stem
1 In a chronic disease such as dementia:
a incidence and prevalence eventually amount to the same thing
b incidence is greater than prevalence
c prevalence and incidence rates can be stated independently of case definition
d prevalence is greater than incidence
e the incidence rate is the best measure by which to describe the disease.
2 Which of the following is not true in dementia?
a the prevalence rises with age
b the prevalence seems likely to rise in low- and middle-income countries
c the prevalence is inevitably rising
d the degree of the person's cognitive impairment and the quantity of pathology does not always corelate
e men have a higher prevalence of dementia with Lewy bodies than women.
3 Which of the following is true of depression?
a it is incurable in older people
b the prevalence of minor depression in older people living at home is higher than in those living in institutions
c it is associated with dementia and may share common aetiological factors
d the prevalence of depression in older people in the community is higher than in those in general hospitals
e major depression has a very high prevalence in older people.
4 Which of the following prevalence rates for mental disease in older people is not true?
a bipolar disorder in the community: about 10%
b late-onset schizophrenia: about 0.6%
c delirium on medical wards: 20–30%
d generalised anxiety disorder: about 2%
e personality disorders in the community: 2–13%.
5 Which of the following statements best sums up the situation for older people in the UK?
a quality of life has improved
b those over 85 years of age are likely to have an average of five diseases
c life satisfaction is higher than it is for those in middle age
d psychiatric morbidity is not uncommon
e all of the above.
MCQ answers
1 d 2 c 3 c 4 a 5 e


eLetters
No eLetters have been published for this article.