


Children who consume diets high in calories and sodium have an increased risk for nutrition-related health conditions, including obesity, hypertension and diabetes, and poor dietary patterns in adulthood(Reference Semnani-Azad, Scourboutakos and L’Abbe1–Reference Ambrosini5). A large evidence base shows a positive association between frequency of eating out and higher overall calorie and sodium intakes; however, a major limitation is that this evidence largely focuses on eating out in fast-food restaurants and excludes full-service restaurants, particularly studies specific to children(Reference Roberts, Das and Suen6). In the United States, between 7–15 % and 24–36 % of children aged 2–11 years consume food from full-service or fast-food restaurants each day, respectively(Reference Powell and Nguyen7). Compared to eating foods prepared at home, daily calorie intake was significantly higher among children who ate at full-service (+160 calories) or fast-food restaurants (+120 calories), and daily sodium intake was higher among those who ate at full-service restaurants (+225 mg)(Reference Powell and Nguyen7). International evidence also indicates that meals served at full-service restaurants contain significantly more calories than fast-food restaurants(Reference Roberts, Das and Suen6). Given the popularity of and excessive calorie and sodium content of meals at full-service restaurants, this is a key food environment for diet-related health interventions among children.
Food and beverage items on children’s menus, often bundled into ‘kids’ meals’, are high in calories and sodium in both fast-food and full-service restaurants in Canada(Reference Semnani-Azad, Scourboutakos and L’Abbe1,Reference Scourboutakos and L’Abbe9) and the United States(Reference Young, Coppinger and Reeves8,Reference Sliwa, Anzman-Frasca and Lynskey10) . In Canada, kids’ meals at full-service restaurants offer larger portions (by weight) than those at fast-food restaurants, and contain a median of 818 calories and 1185 mg of sodium, exceeding daily sodium recommendations for 4–8 and 9–13-year-olds 50 % and 27 % of the time, respectively(Reference Semnani-Azad, Scourboutakos and L’Abbe1). In the United States, 62 % of kids’ meals in full-service restaurants exceed the daily recommended limit for sodium in 9–13-year-olds(Reference Semnani-Azad, Scourboutakos and L’Abbe1). However, there is substantial variability in the mean calorie and sodium content of similar menu items offered across restaurants, making it challenging to choose lower calorie and sodium items in the absence of uniform menu labelling(Reference Hobin, Lillico and Zuo11).
Menu labelling, the disclosure of calories and other nutrition information for food and beverages on restaurant menus and menu boards at the point of purchase(Reference Sinclair, Cooper and Mansfield12), is an increasingly popular public health strategy for promoting healthier items through product reformulation and by encouraging consumers to make healthier choices when eating outside the home(Reference Wellard, Glasson and Chapman13). Children’s menus may be a particularly apt target for menu labelling interventions to better control the nutritional quality of foods being sold and marketed to children in restaurants. A study evaluating the food environment of 174 unique fast-food and full-service restaurants with children’s menus across the Canadian province of Ontario found only 5 % contain some nutrition information and/or a symbol identifying healthy options(Reference DuBreck, Sadler and Arku14). Subsequent to this study, legislation has been introduced in Ontario mandating chain restaurants with ≥20 outlets to display numeric calorie information on menus(15). The United States and jurisdictions in Australia have also recently implemented legislation mandating chain restaurants to post calories on menus(16–19), including some children’s menus. Further, the United States’ cities of New York(20) and Philadelphia(21) require restaurants to display a warning symbol adjacent to menu items with sodium levels that exceed daily recommendations.
Review evidence indicates that menu labelling may modestly reduce the amount of calories and sodium in the foods purchased at restaurants by adults as well as in the foods purchased for or by children(Reference Sacco, Lillico and Chen22–Reference Cantu-Jungles, McCormack and Slaven24). For example, posting numeric calorie information on menus has been shown to reduce the calories ordered in controlled lab studies and, to a lesser extent, in real-world restaurant settings(Reference Sacco, Lillico and Chen22–Reference Cantu-Jungles, McCormack and Slaven24). In contrast, other reviews concluded that calorie labelling is more effective in real-world settings(Reference Crockett, King and Marteau25,Reference Littlewood, Lourenço and Iversen26) or have found limited(Reference Kiszko, Martinez and Abrams27–Reference Harnack and French29) or mixed outcomes(Reference Bleich, Economos and Spiker30,Reference Fernandes, Oliveira and Proenca31) across different types of food establishments, such as fast-food restaurants, full-service restaurants and cafeterias(Reference Bleich, Economos and Spiker30–Reference Morley, Scully and Martin33). Additionally, recent hypothetical food purchasing studies found that posting both numeric calorie and sodium information on menus may help encourage consumers to choose menu items significantly lower in sodium(Reference Scourboutakos, Corey and Mendoza32,Reference Byrd, Almanza and Ghiselli34) .
Alternative menu labelling formats, such as single-icon summary symbols (e.g. check marks, caution signs, stop signs) and contextual statements (e.g. a short sentence explaining the significance of numerical or interpretive information: ‘2000 calories a day is used for general nutrition advice, but calorie needs vary’(35)), have been proposed as promising methods of delivering nutrition information on labels(Reference Sinclair, Cooper and Mansfield12,Reference Fernandes, Oliveira and Proenca31) . Studies, including one meta-analysis, examining alternative menu labelling formats on calories ordered or consumed have found positive(Reference Sinclair, Cooper and Mansfield12) and mixed outcomes(Reference Littlewood, Lourenço and Iversen26,Reference Bleich, Economos and Spiker30,Reference Fernandes, Oliveira and Proenca31) . Intuitive heuristic symbols, such as traffic light colours signalling the nutritional levels of menu items, may facilitate understanding of numeric nutrition information, especially among consumers with limited numeracy and health literacy skills(Reference Morley, Scully and Martin33,Reference Yepes36–Reference Levy, Riis and Sonnenberg42) . Yet, when measuring the amount of calories ordered or consumed, recent review evidence suggests that traffic light labels tested in various types of food outlets may not have a greater impact than numeric calorie labelling(Reference Littlewood, Lourenço and Iversen26,Reference Bleich, Economos and Spiker30) . The mixed results suggest that effects of menu labelling on calories ordered and consumed may depend on a number of consumer and contextual factors(Reference Boles, Maher and Moore43,Reference Sorenson, Van den Broucke and Fullam44) . The influence of nutrition labels on food selection largely depends on consumers noticing, understanding and applying the information when making their decision. Studies examining front-of-package food labels have suggested that the extent to which consumers notice and apply nutrition label information is related to the label’s size, location, colour, credibility and use of images or pictures(Reference Hammond and Acton45,Reference van Kleef, van Trijp and Paeps46) . Compared to fast-food restaurants, full-service restaurants may be relatively more suitable for menu labelling interventions since their patrons have more time to notice, process and use nutrition information when making meal decisions(Reference Ellison, Lusk and Davis38).
The majority of menu labelling studies to date have tested numeric calorie information adjacent to each menu item. More research examining the influence of posting calories plus other nutrition information on menus is needed to determine optimal label design for informing and influencing consumer food decisions when eating outside the home, particularly in full-service restaurants and on children’s menus(Reference Sinclair, Cooper and Mansfield12,Reference Sacco, Lillico and Chen22–Reference Crockett, King and Marteau25,Reference Kiszko, Martinez and Abrams27–Reference Fernandes, Oliveira and Proenca31) . Few studies have assessed the impact of menu labelling interventions on children’s menus in restaurants and parents’ food choices for their children(Reference Ahn, Park and Lee47–Reference Tandon, Wright and Zhou52), despite parents’ significant influence on and involvement in children’s food choices(Reference Ahn, Park and Lee47,Reference Drichoutis, Lazaridis and Nayga53) . This study sought to use an online experiment to test the efficacy and perceived effectiveness of different formats for displaying calorie and sodium information on children’s menus by assessing parents’ hypothetical purchases for their children from a popular chain full-service restaurant. This study also examined the extent to which parents noticed and understood the nutrition information on menus by differing menu labelling conditions.
Methods
An online study conducted in April and May 2015 included two experiments assessing various menu labelling formats on: (i) a fast-food restaurant (counter-served meal eaten on- or off-premises) menu and (ii) a full-service restaurant (sit-down meal served by waitperson) menu; the former has been published previously(Reference Hobin, Lillico and Zuo11). This paper reports on the experiment testing the full-service restaurant menu.
Sample and recruitment
The online study was conducted with 998 adults (≥18 years) residing in Ontario, Canada. To be eligible to participate, adults must have understood English, had at least one child aged 3–12 years and consumed food prepared outside the home at least once in the past year. To reflect the age and gender distribution of the adult population in Ontario based on the 2011 Statistics Canada Census, a stratified random sample was recruited from an online panel consisting of over 400 000 consumers, maintained by Leger (http://leger360.com/en-ca/legerwebpanel.asp). The recruitment process monitored accrual to include 50 % female adult participants and an equal distribution of participants with children across ages 3–12 years. If a participant reported having more than one child between the ages of 3–12, quotas were used to select a child the participant would consider when completing this survey. More specifically, participants were given a specific age in years, determined by quotas, for which they were instructed to answer the survey questions (e.g. ‘Please imagine that you are at a Boston Pizza® restaurant for dinner with your child that is 11 years old’). Panellists received an email invitation to complete a 20-min survey, but the nature of the study was not disclosed. Each participant received $3 from the survey firm in appreciation for their participation.
Study design and experimental conditions
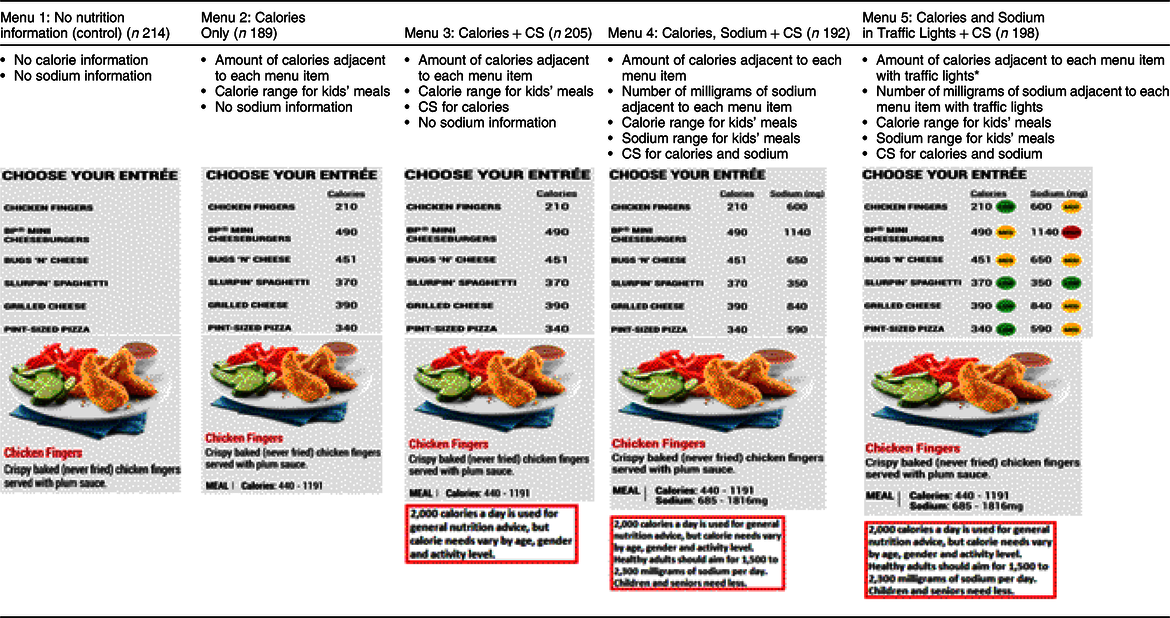
A between-groups randomised controlled trial (RCT) was used to test the efficacy and perceived effectiveness of five different menu labelling conditions using an online experiment with two tasks. Actual children’s menus from Boston Pizza® restaurants in Canada were replicated and altered according to one of the following five nutrition labelling conditions:
(1) No Nutrition Information (control)
(2) Calories Only
(3) Calories + Contextual Statement (CS)
(4) Calories, Sodium + CS; or
(5) Calories and Sodium in Traffic Lights + CS
Actual menus from Boston Pizza® were used instead of generic fictitious menus to improve the study’s relevancy, as Boston Pizza® is one of the top ten chain restaurants in Canada(Reference Elliot54) and is, therefore, familiar to and recognisable among participants. Consistent with actual Boston Pizza® restaurants in Canada, the meal options offered on the children’s menu included an entrée, side, beverage and dessert. The calorie and sodium content of menu items were the actual values obtained from the nutrition information publicly accessible on the Boston Pizza® Canada website(55) as of March 2014. The contextual statement included in menu labelling conditions 3, 4 and 5 stated: ‘2000 calories a day is used for general nutrition advice, but calorie needs vary by age, gender and activity level’. Conditions 4 and 5 that labelled sodium content also included the statement: ‘Healthy adults should aim for 1500 to 2300 milligrams of sodium per day. Children and seniors need less.’ These menu labelling formats and contextual statements were informed by proposed menu labelling legislation in Ontario at the time of the study(56), expert health organisations in Canada (Dietitians of Canada) and the United States (US Food and Drug Administration), and previous research(Reference Scourboutakos and L’Abbe9). Table 1 provides details on the key menu labelling elements plus sample images of the menus in each experimental condition. Images of full menus used in each condition (see Supplementary Fig. A), and the calorie and sodium cut-offs for traffic light labels (see Supplementary Table 1) are provided in the online supplementary materials.
Key menu labelling design features by experimental condition
CS, contextual statement.
* Cut-offs were defined based on the criteria of the UK Food Standards Agency(70) guidelines for traffic light labelling on pre-packaged foods and previous research(Reference Hammond, Goodman and Hanning40,Reference Hammond and Acton45) for low, medium and high levels of calories(Reference Hammond, Goodman and Hanning40) per portion, and of sodium(70) per 100 g of food or 100 ml of beverages.
Procedures and measures
Task 1: Hypothetical purchase scenario
The first task was a hypothetical purchase situation where participants were randomly assigned to view one of five nutrition labelling conditions. While viewing the children’s menu adapted to their assigned experimental condition, participants were instructed to select up to one entrée, one side, one beverage and one dessert for their child as though they were visiting a Boston Pizza® restaurant for dinner.
After selecting menu items, the extent to which parents noticed and understood nutrition information on the menu was assessed. To assess ‘noticing’, the menu disappeared from the screen and participants were asked ‘What type of nutrition information did you notice?’ with the following response options: calories, fat, carbohydrates, sodium, healthy symbol or logo, health statement, organic, allergen/gluten information, don’t know, and refused. Participants were considered to have ‘noticed’ the calorie and/or sodium information on the menu if they selected ‘calories’ and/or ‘sodium’, depending on their assigned menu labelling condition. All other responses were coded as ‘did not notice’.
Understanding nutrition information was assessed by asking participants to estimate the amount of calories and sodium in their overall selection (entrée + side +dessert + beverage) while the menu and images of the selected items were visible on screen. Participants were also asked to separately estimate the amount of calories in the beverage they selected and the amount of sodium in the side they selected. If participants understood the nutrition information on menus, it was expected that they could accurately report the calorie and sodium information within ±10 % of the amounts disclosed on the menus. Responses were coded as underestimation, correct estimation within ±10 %, and overestimation, based on the absolute % error calculated as: (|Participants’ response – true value|/true value)*100.
Task 2: Perceived effectiveness of menu conditions
The second task asked participants to rate and rank all five nutrition labelling conditions based on the perceived effectiveness of each condition. Participants viewed menus from each of the five labelling conditions one at a time in random order and, for each condition, were asked: ‘On a scale of 1–10, where 1 is “not at all” and 10 is “extremely”, please indicate whether this menu: (i) grabs your attention, (ii) is easy to understand, (iii) allows you to compare across menu options, (iv) helps you to choose food items with fewer calories, (v) helps you to choose food items with less sodium and (vi) is effective for informing you about the nutritional content of food’. These measures were adapted from previous research evaluating health warning labels for tobacco products(Reference Brewer, Parada and Hall57–Reference Hammond and Reid60). Then, all menus were viewed at once and participants ranked the menus relative to one another from the most to the least effective at informing them about the nutritional content of food. Rankings were calculated as the percentage of participants ranking each of the five nutrition labelling conditions as the most effective.
Analyses
Sociodemographic variables included participants’ characteristics (gender, age, education, BMI status, ethnicity, household income) and perceptions (perceived diet quality, perceptions of child’s weight, perceived role in child’s meal selection, factors that influence their food choice for their children), as well as child factors (gender, age) and the eating behaviours of participants and their children (frequency of eating out). All variables were analysed categorically except the frequency of eating out. Chi-square tests were used to test for differences in the sample profile between nutrition labelling conditions for categorical variables. One-way ANOVA was conducted to compare frequency of eating out, a continuous variable, across labelling conditions.
Task 1: Hypothetical purchase scenario
The amount of calories and sodium in the menu items parents selected for their child were calculated for each item individually and summed for the ‘meal’ (entrée + side +dessert) and ‘overall’ (meal + beverage). Separate linear regression models were conducted to examine the calorie and sodium content for menu items selected by parents for their children, including the ‘meal’, ‘overall’ and for the entrée, beverage, side and dessert individually, unadjusted for covariates.
Logistic regression models were conducted to examine the distribution of whether calorie or sodium information was ‘noticed’ v. ‘did not notice’ across nutrition labelling conditions. Separate multinomial logistic regression models were conducted to assess participants’ understanding of the calorie and sodium amounts in their overall selection (entrée + side + dessert + beverage) with three levels of responses: underestimation, correct estimation (within ±10 %) and overestimation. Underestimation served as the reference category. Experimental condition was entered as an indicator variable in all models.
Pairwise comparisons for parents’ estimation of calorie and sodium content, and noticing and understanding nutrition labels, were conducted for all experimental conditions after adjusting for multiple comparisons using Tukey–Kramer adjustment.
Task 2: Perceived effectiveness
Linear mixed-effects models were used to examine the main effects for the association between nutrition labelling conditions and mean perceived ratings for each of the six attributes, adjusting for sociodemographic characteristics and eating behaviours, and multiple comparisons using Tukey–Kramer adjustment. Level 1 and 2 variables were related to the participants’ characteristics and nutrition labelling conditions, respectively. Fixed effects were used for participants’ characteristics, while random effects were used for each participant in the model to account for individual differences.
All statistical analyses were conducted in SAS version 9.3 software (SAS Institute, Inc.) with P < 0·05 indicating statistical significance.
Results
Sample characteristics
Sample characteristics are summarised in Table 2. No significant differences in sociodemographic factors and eating behaviours were observed across menu labelling conditions.
Sample characteristics (n 998)

† Less than 5 % of sample reported missing values and were omitted in this table.
‡ May include Aboriginal, Arab, Black, Chinese, Filipino, Japanese, Korean, Latin American, South Asian, Southeast Asian, West Asian or other (specified).
Task 1: Hypothetical purchase scenario
Parents exposed to any of the three nutrition labelling conditions with contextual statements selected entrées with significantly fewer calories relative to the control menu (P < 0·05 for all three; Table 3). The calorie content of selected ‘meals’ (entrée + side + dessert) was significantly lower among parents exposed to the two nutrition labelling conditions disclosing sodium information – ‘Calories, Sodium + CS’ (−46·0 calories) and ‘Calories and Sodium in Traffic Lights + CS’ (−42·2 calories) – compared to the control condition without nutrition information (P < 0·05 for both). As shown in Table 3, the mean total calories of parents’ ‘overall’ selection (entrée + side + dessert + beverage) was lower among those exposed to any of the four nutrition labelling conditions disclosing calorie information relative to the control menu, but these differences were not statistically significant, with the exception of ‘Calories, Sodium + CS’ (−53·1 calories, P < 0·05). No significant differences in calories ordered for other individual items (sides, desserts, beverages) were detected across nutrition labelling conditions.
Mean calories and sodium content in selected items by nutrition labelling condition in the hypothetical purchase task (n 998)

CS, contextual statement.
* Overall includes entrée, beverage, side and dessert.
† Statistical significance compared to the control condition at P < 0·05 using a separate linear regression model for each outcome unadjusted for covariates but adjusted for multiple comparisons using the Tukey–Kramer adjustment.
‡ Meal includes entrée, side and dessert. Δ denotes difference in calories and sodium content between experimental and control conditions.
Parents exposed to nutrition labelling conditions disclosing calories plus sodium information ordered entrées with significantly less sodium compared to the control menu (−56·1 mg of sodium for ‘Calories, Sodium + CS’, P < 0·05; −58·6 mg of sodium for ‘Calories and Sodium in Traffic Lights + CS’, P < 0·05) (Table 3). No significant differences in sodium ordered were detected between conditions for menu items ordered overall, or for meals, sides, desserts or beverages separately.
Noticing and understanding nutrition information
The proportion of parents who noticed and understood calorie and sodium information by nutrition labelling condition is summarised in Fig. 1.
Proportion of parents who noticed and understood calorie and sodium information when selecting items by nutrition labelling condition. A logistic regression model was conducted to compare the distribution of whether nutrition information was ‘noticed’ across experimental conditions, unadjusted for covariates. Each identical superscript letter denotes a pairwise comparison in which no significant differences were detected at P < 0·05. All remaining pairwise comparisons were statistically significant at P < 0·05. To test understanding, a multinomial logistic regression was conducted to compare the distribution of correct estimates of calories and sodium in participants’ overall selection (entrée + side + dessert + beverage) after adjusting for multiple comparisons using the Tukey–Kramer adjustment. The referent group is percentage of underestimation. Conditions with identical superscripts indicate a pairwise comparison that is not significantly different at P < 0·05. All remaining pairwise comparisons were statistically significant at P < 0·05 ( , No nutrition information - control;
  , calories only;
  , calories + contextual statement;
  , calories, sodium + contextual statement;
  , calories and sodium in traffic lights + contextual statement)

Noticing nutrition information
Overall, when calorie labels were on menus, significantly more parents noticed calories than when no calorie information was provided on menus (P < 0·05 for all) (Fig. 1). Similarly, when exposed to a condition with sodium labels, significantly more parents noticed sodium than when no sodium information was provided on menus (P < 0·05 for all). Participants exposed to the nutrition labelling condition with ‘Calories and Sodium in Traffic Lights + CS’ were significantly more likely to notice calorie and sodium information than when exposed to the menus with ‘Calories + CS’, ‘Calories Only’, and the control condition (P < 0·05 for all three), but not statistically different from the nutrition labelling condition with ‘Calories, Sodium + CS’.
Understanding nutrition information
To assess the extent to which parents understood the nutrition labels, parents viewed a menu according to their assigned labelling condition and were asked to report the total amount of calories and sodium in their overall selection (entrée + side + dessert + beverage). In the control condition, the majority of parents underestimated calories (75·0 % of parents) and the amount of sodium (94·0 % of parents) in their overall selection. When calorie and/or sodium labels were provided on menus, significantly fewer participants incorrectly estimated (either under- or overestimated) the calories and/or sodium content of their overall selection than when exposed to menus without this information (P < 0·05) (Fig. 1). See online supplementary material (Supplemental Table 2) for full results of understanding by nutrition labelling condition for items selected overall, beverages (calories only) and side (sodium only).
Task 2: Perceived effectiveness of nutrition labels
Parents’ perceived effectiveness ratings were significantly higher across experimental conditions with nutrition labels than the control condition after adjusting for covariates (Table 4). Pairwise comparisons found that participants rated the menu with ‘Calories and Sodium in Traffic Lights + CS’ higher than all other nutrition labelling conditions for all six attributes (Table 4). Furthermore, the menu with ‘Calories, Sodium + CS’ was rated significantly higher than menus with ‘Calories + CS’ and ‘Calories Only’, which were not rated differently from one another but were rated higher than the control menu (Table 4). Consistent with the ratings, the ‘Calories, Sodium in Traffic Lights + CS’ menu was ranked the most effective by two-thirds of participants (Table 4).
Perceived effectiveness ratings and ranking by menu labelling condition (n 998)

CS, contextual statement.
* Separate linear mixed-effects models were conducted after adjusting for covariates and multiple comparisons using the Tukey–Kramer adjustment. Menus with identical superscripts denote a pairwise comparison in which no significant differences were detected at P < 0·05. All remaining pairwise comparisons were statistically significant at P < 0·05.
† Proportion of respondents identifying the nutrition labelling condition as the most effective at informing them about the nutritional content of food when comparing all menu conditions.
Discussion
Nutrition labelling on menus offers a relatively low-cost, population-level approach to providing consumers with information about the nutritional content of foods sold in restaurants and other settings outside the home. The presentation and format of information can impact the effectiveness of labels to communicate accurate information to and encourage more nutritious choices among consumers. To our knowledge, this is the first study in Canada, and one of the few conducted internationally, to examine the efficacy and perceived effectiveness of different formats for displaying calorie and sodium information on a full-service restaurant’s children’s menu through an online study. This study is novel in its attempt to differentiate the influence of various nutrition labelling elements on consumer choice, and the results indicate promising menu design features, such as labelling both calorie and sodium amounts, providing a contextual statement, and using colour and symbols. In general, providing calories, sodium, contextual and interpretive information increased the proportion of parents who noticed and understood the nutrition labels on children’s menus, and resulted in parents selecting entrées for their children that were lower in calories and sodium in the hypothetical purchase task.
Generally, providing calorie labels on menus modestly influenced parents to select lower calorie items for their children. Interestingly, adding sodium labels alongside calories and a contextual statement on menus strengthened the influence of nutrition information for reducing calories in selected menu items. Parents selected significantly fewer calories overall when exposed to menus with ‘Calories, Sodium + CS’ and significantly fewer calories in meals when exposed to menus with ‘Calories, Sodium + CS’ and ‘Calories and Sodium in Traffic Lights + CS’ compared to menus with no nutrition information. These results are consistent with a repeated-measures RCT, based on an online hypothetical purchase task, assessing calories selected by adults first exposed to a menu with no nutrition information and then one of three nutrition labelling conditions (calories; calories and sodium; calories, sodium and serving size)(Reference Scourboutakos, Corey and Mendoza32). Participants who changed their selection after being exposed to menus with both calorie and sodium labels selected fewer calorie-dense menu item(s) (−20 to −44 calories) than those who were exposed to menus with calorie labels only(Reference Scourboutakos, Corey and Mendoza32). More research is needed to confirm the added influence of including sodium and calorie labels plus a contextual statement on restaurant menus on the calorie content of selected foods.
Overall, parents exposed to both labelling conditions that included sodium information also selected menu items lower in sodium; however, the reduction in sodium was not statistically significant, with the exception of entrées. Other research has found that sodium labels on menus is associated with ordering items lower in sodium (Reference Scourboutakos, Corey and Mendoza32,Reference Vanderlee and Hammond61,Reference Pulos and Leng62) , especially entrées, but the change is not always statistically significant(Reference Ambrosini5). Previous studies(Reference Hobin, Lillico and Zuo11,Reference Pulos and Leng62,Reference Burton, Creyer and Kees63) have demonstrated a decrease in demand or purchase intentions of high-sodium food items when sodium labels were displayed on menus, though one study showed this effect was specific to participants with hypertension(Reference Burton, Creyer and Kees63). The particular impact of sodium labels on food decisions may, in part, be explained by the high sodium content of foods on children’s menus(Reference Semnani-Azad, Scourboutakos and L’Abbe1), as experts argue that nutrition labels on menus have the strongest effect on purchase intentions when consumers are confronted with surprising nutrition information that does not align with expectations(Reference Burton, Creyer and Kees63).
Despite significant reductions in the calorie and/or sodium content observed for entrées ordered in this study, differences in the calories and/or sodium of selected beverages, sides or desserts were observed less frequently and sometimes even increased. A study by Ellison et al.(Reference Ellison, Lusk and Davis38) also found menu labelling is more likely to impact entrée choices than beverage and dessert selection. The differential impact across food items may be due to greater variations in the calorie and sodium content of entrées relative to other menu items, making it easier for consumers to make alternative choices that differ in calorie and sodium content(Reference Hobin, Bollinger and Sacco64). Slight increases in mean calorie and/or sodium contents of beverages, sides and/or desserts observed may be a result of an unintended compensatory effect where choosing an entrée lower in calories led to a subsequent sense of liberty or deservingness to indulge in higher-calorie side items(Reference Wisdom, Downs and Loewenstein65). Menu labelling conditions that included sodium information generally appeared to mitigate this effect.
This study found that, in the absence of nutrition labelling on menus, most parents underestimated the calories and sodium content of a meal (entrée + side + dessert). The prevalent underestimation of calories, and even more substantive underestimation of sodium in restaurant foods, has been documented by previous studies(Reference Ambrosini5,Reference Burton, Tangari and Howlett66) . This is concerning as limited knowledge of calories and sodium content, especially underestimation, of meals on children’s menus may lead to children consuming excess calories and sodium(Reference Wei and Miao67). In addition to the value of disclosing both calorie and sodium information on menus, results of the current study also indicate that including a contextual statement and colour or symbols may further support parents in noticing and understanding nutrition information when ordering menu items. As shown in Table 3, the amount of calories in the entrées ordered significantly decreased as additional nutrition labelling elements were included in the design. This is consistent with a recent review concluding that consumers exposed to menus with calorie labels and a contextual statement or interpretative information purchased and consumed significantly fewer calories, but not when exposed to menus with calorie information alone(Reference Sinclair, Cooper and Mansfield12). However, further research is required to confirm the optimal design for communicating nutrition information on menus.
Lastly, parents consistently rated and ranked the menu with ‘Calories and Sodium in Traffic Lights + CS’ as the most effective. Colour-coded labelling systems on the front of food packages have been extensively studied and are often positively viewed by consumers(Reference Kelly, Hughes and Chapman68). Although the findings of a recent review suggest perceived effectiveness measures can predict the actual effectiveness of health communication campaigns(Reference Noar, Barker and Bell69), the preference for traffic lights in this study in a hypothetical purchase task is some what surprising since coloured symbols did not significantly reduce the calories and sodium content of chosen menu items beyond the impact of menus displaying numeric calorie and sodium information plus a contextual statement. The incongruence between outcomes in performance and preference tasks may, in part, be because, in the hypothetical purchase task, participants were directed to view the menus on a screen in a controlled situation, potentially obscuring the differential impact of traffic light colours and symbols in attracting consumers’ attention in crowded real-world settings. It is also possible that the use of interpretative symbols, such as traffic lights, on menus may be less helpful when there is relatively little variability in nutrient content (e.g. many restaurant foods are high in sodium, thus most items earn red symbols).
This study has some limitations to consider. First, it was conducted online and examined hypothetical purchases, which may have minimised the influence of other salient factors that influence real-world food purchases by parents for their children, such as price, children’s personal preference and time constraints. Additionally, as only immediate purchase intentions were measured, potential longer-term health impacts were not captured, including learning effects and changes in food consumption behaviours or frequency of dining out. Finally, exposure to a previous experimental condition was not adjusted for in the models in Task 2, which may have influenced respondents’ preference for certain menu labelling formats.
Despite these limitations, this study contributes to the existing literature by providing insights on the relative efficacy of various nutrition labelling formats on a children’s menu at a popular full-service restaurant. These findings can be used to improve nutrition labels on menus by including both calorie and sodium information, providing a contextual statement and using colours and symbols. Furthermore, this study included a sample of parents with children aged 3–12 years, which is an understudied but important population in this literature. Future research should examine the differential effects of various nutrition labelling formats on parents’ food purchase decisions and children’s consumption patterns in real-world full-service restaurants.
Acknowledgements
Acknowledgements: The authors would like to acknowledge Heather Lillico, Jocelyn Sacco, Steven Jovanasky and Claude Martel from Public Health Ontario, as well as Lynn Roblin from the Ontario Nutritional Resource Centre, for their help in developing and adapting menu images. Financial support: This work was supported by the Public Health Ontario Project Initiation Fund. Conflict of Interest: None. Authorship: E.H. and D.H. formulated the research question, designed and conducted the study, and led the preparation of the manuscript. K.L., E.C. and R.P. interpreted data and helped write the manuscript. F.Z. analysed the data and reviewed drafts of the manuscript. Ethics of human subject participation: This study was conducted according to the guidelines laid down in the Declaration of Helsinki, and all procedures involving human subjects were approved by the Public Health Ontario Ethics Review Board. In the consent process, participants were informed that by completing and submitting the questionnaire their free and informed consent is implied.
Supplementary material
For supplementary material accompanying this paper visit https://doi.org/10.1017/S1368980019004488.


