


A 58-year-old woman presented with a 10-month history of progressive upper and lower extremity sensory loss, gait difficulties, and left eye vision loss. Past medical history was remarkable for a J-pouch for ulcerative colitis, and right amblyopia with baseline vision of 20/400 in the right eye. She was being treated with metronidazole 500 mg PO TID for pouchitis prophylaxis over the last 2 years. Neurological examination was remarkable for a visual acuity of 20/400 in each eye and mild bilateral optic disc edema indicative of optic neuropathy, as well as findings consistent with cerebellar ataxia and sensory neuropathy. A subtle right relative afferent pupillary defect was noted on neuro-ophthalmological assessment, felt to be related to her dense amblyopia. Visual field testing was limited to the left eye due to patient preference and revealed a left central scotoma consistent with optic neuropathy. Intravenous fluorescein angiogram confirmed true optic disc edema (Figure 1). Nerve conduction studies showed evidence of length-dependent sensory axonal polyneuropathy involving the hands and lower extremities. Brain magnetic resonance imaging (MRI) revealed cerebellar dentate nuclei, inferior colliculi and corpus callosum T2-hyperintensities, concerning for metronidazole-induced neurotoxicity. Reference Roy, Panwar, Pandit, Das and Joshi1–Reference Lee, Cha, Lee and Song3 No signal abnormality of the optic nerves was observed, but further examination of the visual pathways identified striking, symmetric optic tract T2-hyperintensity (Figure 2). Metronidazole was discontinued, and at 3-month follow-up, her symptoms had all nearly resolved. Left eye visual acuity improved to 20/25 and was subjectively normal, while findings of cerebellar ataxia and sensory neuropathy had markedly reduced. Repeat MRI showed resolution of optic tract T2-hyperintensity and near-resolution of other brain lesions, including the cerebellar dentate nuclei, corpus callosum, and inferior colliculi.
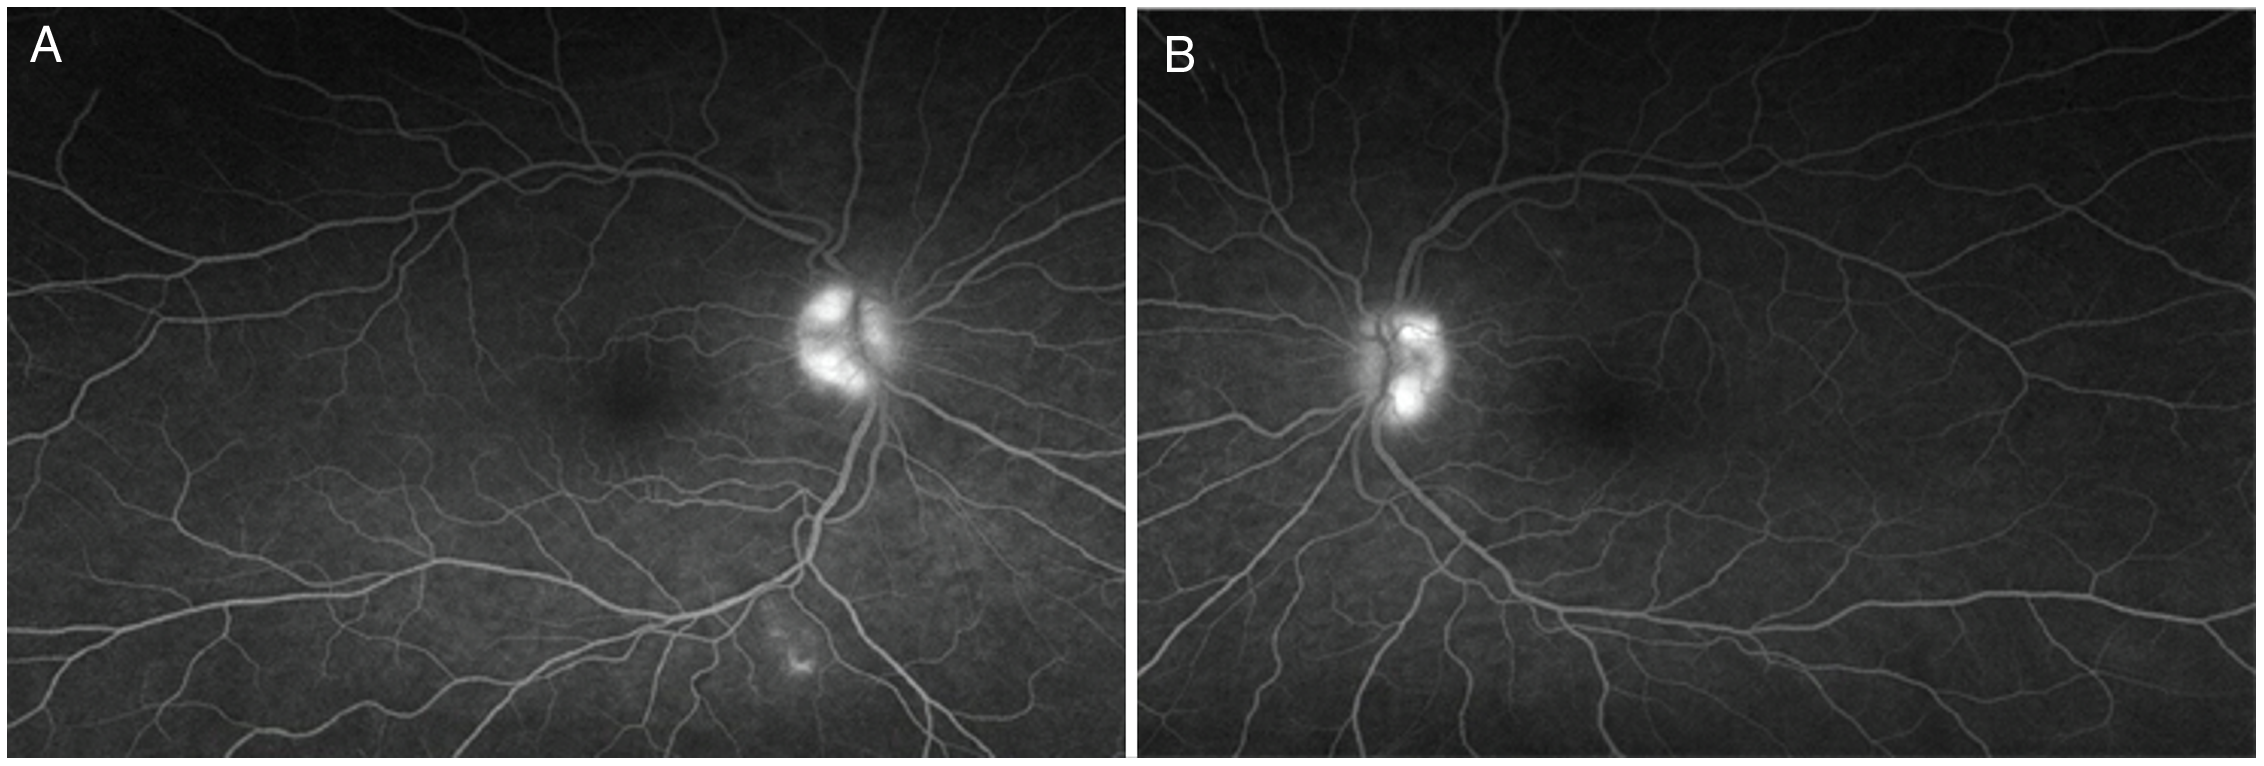
Intravenous fluorescein angiogram confirming true optic disc edema in metronidazole-induced neurotoxicity. Late-phase intravenous fluorescein angiogram demonstrates hyperfluorescence of the right (A) and left (B) optic discs.
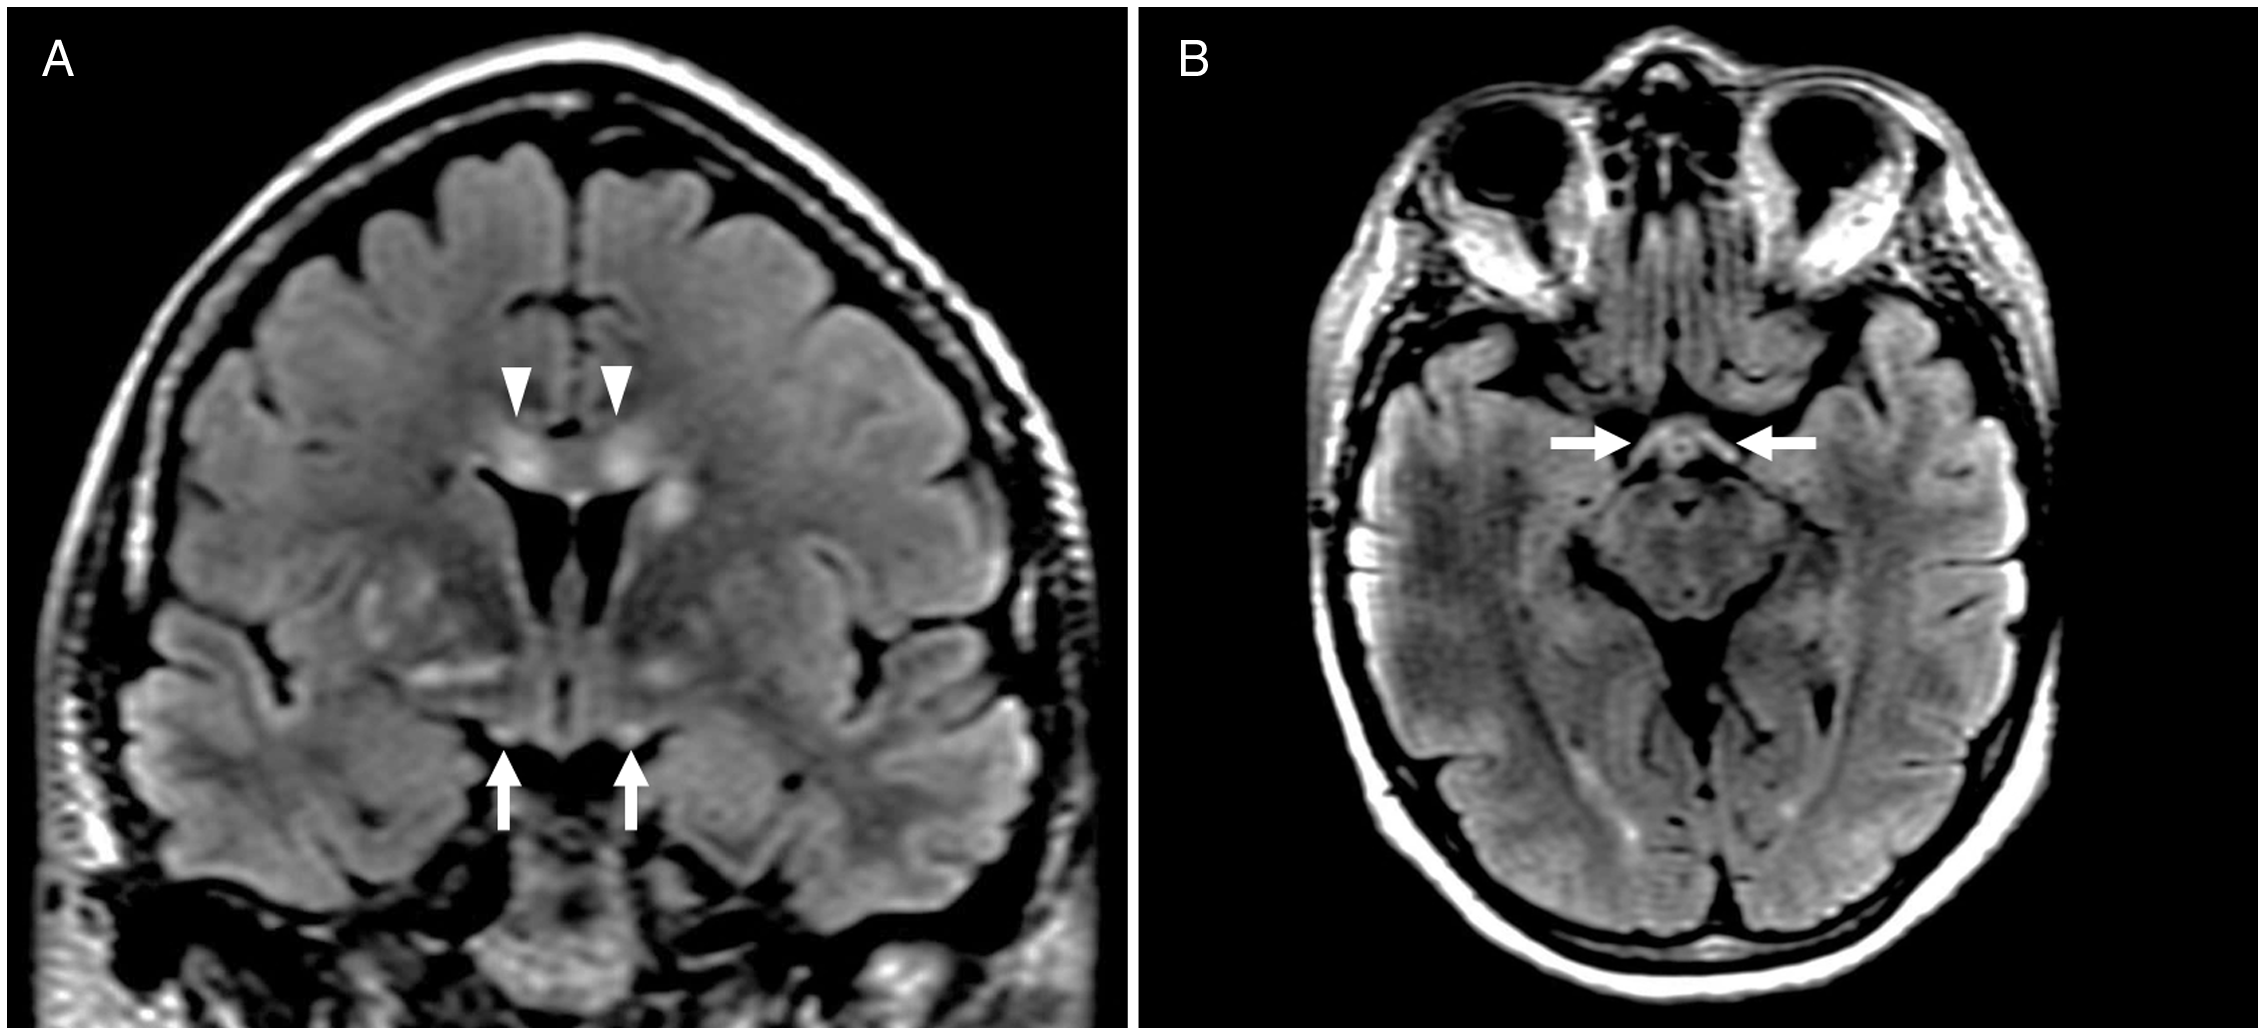
Brain MRI depicting optic tract involvement in metronidazole-induced neurotoxicity. Coronal and axial T2-FLAIR imaging shows symmetric optic tract hyperintensity (A, B, arrows). Hyperintensities in other regions characteristically involved in metronidazole-induced neurotoxicity, including the corpus callosum (A, arrowheads), are also present.
Metronidazole is an antimicrobial agent used in the treatment of several protozoal and anaerobic infections. It is selectively absorbed and then activated by microbial proteins. Reference Hernández Ceruelos, Romero-Quezada, Ruvalcaba Ledezma and López Contreras4 Once activated, the reduction product of the drug oxidizes DNA causing loss of helical DNA structure and strand breakage resulting in protein synthesis inhibition and subsequent cell death. Reference Hernández Ceruelos, Romero-Quezada, Ruvalcaba Ledezma and López Contreras4 Although generally safe, adverse nervous system effects have been reported at varying dose ranges and serum levels. In particular, metronidazole-induced neurotoxicity causing cerebellar and peripheral nerve dysfunction is well described. Vision loss, however, is a rarer and potentially under-recognized phenomenon. Reference Anwyll, Gerry and Gormley5–Reference Peng, Wu and Lin8 There are sparse reports of metronidazole-induced optic neuropathy, and a single previous case reporting neuroimaging evidence of optic tract involvement. That case described a patient with acute metronidazole-induced neurotoxicity and altered sensorium, with no information provided regarding visual symptoms or neuro-ophthalmological examination. Reference Sudan, Garg, Gupta and Bansal9 To our knowledge, this is the first report of optic tract involvement in a patient with more chronic symptoms of metronidazole-induced neurotoxicity and vision loss. Neuroimaging abnormality of the optic tracts coupled with clinical findings of optic neuropathy in our patient suggests the potential for more diffuse dysfunction of the visual pathways in metronidazole-induced neurotoxicity. Recognizing this unique involvement of the optic tracts on neuroimaging may be a major clue to metronidazole-induced neurotoxicity in the appropriate clinical context and help to diagnose a potentially reversible cause of vision loss. Our patient experienced symptom resolution upon discontinuation of metronidazole even after ongoing exposure for months, highlighting the importance of making this diagnosis.
Acknowledgements
None.
Funding
No funding was received for this manuscript.
Conflicts of Interest
The author has no disclosures relevant to the manuscript.
Statement of Authorship
EN contributed substantially to study concept and design, data acquisition and analysis, and drafting of the manuscript and figures. LB contributed substantially to data acquisition and analysis and reviewed the manuscript for important intellectual content. DAM contributed substantially to data acquisition and analysis and reviewed the manuscript for important intellectual content. DMP contributed substantially to data acquisition and analysis and reviewed the manuscript for important intellectual content. AB contributed substantially to study concept and design, data acquisition and analysis, and drafting of the manuscript and figures.


