

Type 2 diabetes mellitus (T2DM) is a polygenic and multifactorial disorder caused by insulin resistance and inadequate β-cell response to insulin secretion( 1 ). Genetic polymorphisms in the human genome may contribute to phenotypic variation and genetic susceptibility to several diseases, with transcription factor 7-like 2 (TCF7L2) being one of the genes that is most consistently associated with T2DM across different studies and populations( Reference Florez, Jablonski and Bayley 2 – Reference Cauchi, El Achhab and Choquet 4 ).
TCF7L2 encodes a transcription factor involved in the Wnt signalling pathway that regulates gene expression of proglucagon, which synthesises the hormone glucagon-like peptide-1 (GLP-1) in the intestine that in turn stimulates insulin secretion( Reference Yi, Brubaker and Jin 5 ). However, the way in which variations in the TCF7L2 gene contribute to T2DM susceptibility is not fully understood. Recent data showing that multiple TCF7L2 copies and overexpression lead to a glucose-intolerant phenotype suggest that TCF7L2 plays a role in regulating glucose tolerance. Moreover, TCF7L2 overexpression may be associated with an increased risk for T2DM, and supports findings that variations in cis-regulatory elements may influence the genetic predisposition to T2DM( Reference Savic, Ye and Aneas 6 ). Diet is a modifiable environmental T2DM risk factor, and evidence for an association between diet and T2DM risk has been steadily increasing( Reference Salas-Salvado, Martinez-Gonzalez and Bullo 7 ).
Nopal (Opuntia sp.) is a Mexican variety of cactus that is a traditional food in Mexico and is widely used to treat T2DM. In T2DM patients, nopal consumption produces anti-hyperglycaemic and anti-hyperinsulinaemic effects through a mechanism that may involve the release of several intestinal peptides that decrease insulin secretion and could affect sensations of hunger( Reference López, Ordaz and Tovar 8 ). The hypoglycaemic activity of nopal may be because of its soluble fibre (mucopolysaccharide) content. Some reports show that, relative to patients who consumed water and broiled zucchini squash, T2DM patients had decreased levels of postprandial glucose 60, 120 and 180 min after consuming 500 g of fresh, broiled nopal( Reference Frati-Munari, Gordillo and Altamirano 9 , Reference Najm and Lie 10 ). In the case of cereal fibre, several studies have shown that consumption of wholegrains is inversely associated with the risk of T2DM( Reference de Munter, Hu and Spiegelman 11 – Reference Wirström, Hilding and Gu 13 ). Moreover, a multicentric study of obese European individuals reported an interaction between the TCF7L2 genetic variant rs7903146 and a 10-week consumption of two hypoenergetic diets (high fat, low carbohydrate: 40–45 % of energy from fat, compared with low fat, high carbohydrate with 20–25 % of energy from fat). The results showed significant interactions between genotype and diet that influenced body weight and waist circumference. The rs7903146TT carriers who consumed a diet high in fat (40–45 % energy) had the smallest decrease in weight and waist circumference, and exhibited an increase in insulin resistance (homoeostasis model assessment for insulin resistance (HOMA-IR)) after the dietary treatment( Reference Grau, Cauchi and Holst 14 ). In T2DM patients, significant gene–diet interactions were identified for the rs7903146 TCF7L2 variant and adherence to a Mediterranean diet, with TT genotype carriers who had low adherence showing higher concentrations of fasting glucose (P=0·004). In contrast, when diet adherence was high, this increase was not observed. Furthermore, a similar gene–diet interaction that influenced total cholesterol, LDL-cholesterol and TAG levels was observed in these subjects( Reference Corella, Carrasco and Sorlí 15 ).
A recent study reported some gene–diet interactions in subjects who had a high dessert intake (e.g. sweet dishes including pastries, custards, pudding, sorbets, etc. ≥once a day) or milk intake (≥twice/day). The carriers of the rs7903146 risk allele had a higher risk for T2DM (OR 2·61; 95 % CI 1·51, 4·52, P=0·0006 for desserts; OR 2·46; 95 % CI 1·47, 4·12, P=0·0006 for milk), and the T allele was also associated with higher fasting plasma glucose concentrations (P=0·03), but only in non-T2MD subjects who consumed at least one dessert daily( Reference Ouhaibi-Djellouli, Mediene-Benchekor and Lardjam-Hetraf 16 ).
Some reports indicate that low glycaemic index (GI) diets, as opposed to the amount of carbohydrates consumed, have a reduced T2DM risk conferred by TCF7L2 ( Reference Cornelis, Qi and Kraft 17 , Reference Fisher, Boeing and Fritsche 18 ). A previous study that analysed the interaction between genetic variants of TCF7L2 and wholegrain intake showed that the wild-type rs7903146CC and rs12255372GG genotypes may modify the effect of wholegrain consumption on glucose metabolism, and that rs7903146CC homozygosity coupled with wholegrain intake can have a protective effect on diabetes risk( Reference Fisher, Boeing and Fritsche 18 ).
We hypothesised that there are hormonal and metabolic differences in T2DM patients who carry different rs7903146 and rs12255372 TCF7L2 genotypes and consume diets containing either nopal or wholegrain fibre. The aim of this study was to evaluate the possible interaction of rs7903146 and rs12255372 TCF7L2 genetic variants with intake of fibre from two different sources (nopal tortillas and wholegrain bread) for 8 weeks by measuring the effects on hormonal and metabolic parameters in T2DM patients.
Methods
Study population
Participants were recruited between January 2011 and June 2012 at health centres in León Guanajuato, Mexico. This study was conducted according to Declaration of Helsinki guidelines, and all procedures involving patients were approved by the institutional ethics committee. All participants provided verbal and written informed consent before enrolment. We included T2DM patients according to the following criteria: (i) age 35–60 years; (ii) ≤7 years since T2DM diagnosis; (iii) treated with diet and/or oral hypoglycaemic agents; (iv) HbA1c≤9 %; and (v) absence of renal failure or evidence of other chronic degenerative or infectious diseases. Elimination criteria were initiation of treatment with insulin or <80 % compliance with the prescribed diet for metabolic control of glucose. Compliance was assessed by estimating the percentage of adequacy between ingested and prescribed energy content according to 24-h recall dietary questionnaires.
We describe a prospective, longitudinal study. The patients were genotyped for the rs7903146 polymorphism and assigned the CC genotype (wild type) or CT and TT genotypes, with each group having an equal number of patients. For the rs12255372 variant, one group had the GG genotype (wild type) and the other group had either GT or TT genotypes. All subjects started with Diet 1 (nopal tortilla) for 8 weeks, followed by a washout period of 8 weeks, wherein subjects consumed a controlled diet, and then the subjects continued with Diet 2 (wholegrain fibre bread) for 8 weeks.
Dietary intervention
The T2DM patients received an individualised isoenergetic diet based on the 2004 American Diabetes Association (ADA) dietary recommendations( Reference Franz, Bantle and Beebe 19 ). The macronutrient composition of the diets is presented in Table 1. In both diets, intake of fibre from nopal tortillas (circular and flat food preparation made from 55 % nopal and 45 % corn nixtamal) or wheat bread represented 25 % of the daily requirement for fibre (25 g/d). The other 75 % of fibre requirements was provided by the participant diet that included a variety of fibre-rich foods such as wholegrain cereals, legumes, fruits and vegetables. In Diet 1, patients consumed two nopal tortillas (equivalent to 6·2 g of fibre) daily without consumption of whole-wheat bread. In Diet 2, patients consumed three slices of wheat bread (equivalent to 5·5 g of fibre) without any nopal tortillas, for a total daily intake of 24 g for both diets. During the washout period, patients continued with the standard control diet (an individualised isoenergetic diet based on ADA dietary recommendations without nopal or wholegrain bread intake). The participants received training before the beginning of the study. The patients received their supply of nopal tortillas or integral wheat bread every 2 weeks. A dietary assessment was conducted using a 24-h recall survey to follow diet compliance. The quantification of total dietary, soluble and insoluble fibre in the nopal tortillas and whole-wheat bread was determined by the enzymatic-gravimetric method (phosphate buffer), method number 991.43 (Association of Analytical Communities (AOAC)-Official Methods of Analysis)( Reference Horwitz 20 ).
Nutrient composition of the diets

Anthropometric and dietary assessments
Anthropometric measures were developed according to standard techniques( Reference Lohman, Roche and Martorell 21 ). We collected basal and final data for each treatment that included height, body weight, and waist and hip circumferences. BMI and waist:hip ratio were also calculated. Dietary evaluations were carried out using 24-h recall questionnaires and 3-d dietary records, and these were applied to evaluate 2 weekdays and 1 weekend day using standardised measures of food portions; the information was collected by direct interview. Nutrient content estimates were quantified using the Mexican Food Equivalent System( Reference Pérez Lizaur, Palacios González and Castro Becerra 22 ). These measurements were performed before and after each treatment.
Blood sampling and analyses
Venous blood was collected from participants after overnight fasting to measure serum glucose concentration and lipid profiles using enzymatic methods with a chemistry analyser (Auto KEM II; Kontrollab). Glycosylated Hb (HbA1c) was quantified by column chromatography with cation-exchange resin (Eagle Diagnostics). For plasma collection, the inhibitor Di-Peptidyl Peptidase-IV (Millipore) was used to avoid proteolytic degradation of GLP-1 with a ratio of 1:10 (v/v) according to the manufacturer’s instructions. Serum insulin and plasma GLP-1 were measured by RIA using a commercial kit (Millipore) with intra-assay variation coefficients of 3·9 % for insulin. HOMA-IR and HOMA β-cell function (HOMA-β) were estimated using the HOMA( Reference Matthews, Hosker and Rudenski 23 ). All metabolic measurements were made before and after each treatment.
Genotyping for rs7903146 and rs12255372 transcription factor 7-like 2 polymorphisms
Peripheral blood leucocytes were separated for DNA extraction using a commercial DNA purification kit (Wizard Genomic; Promega). PCR were carried out using 50 ng of DNA, 2·0 mm-MgCl2, 0·5 mm-dNTP (Invitrogen), 2-U Taq polymerase (Platinum, Invitrogen) and 10-μm primers for both polymorphisms. The region was amplified using the following primers: for rs7903146, PR 5′-TTA GAG AGC TAA GCA CTT TTT AGG TA-3′ (forward) and PR 5′-ACT AAG TTA CTT GCC TTC CCT G-3′ (reverse) (Integrated DNA Technologies (IDT)); and for rs12255372, PR 5′-CCC AGG AAT ATC CAG GCA AGG AT-3′ (forward) and PR 5′-CAA ATG GAG GCT GAA TCT GGC A-3′ (reverse) (IDT). The amplification programme consisted of one cycle at 94°C for 3 min, thirty-five cycles at 94°C for 30 s, 60°C for 30 s, 72°C for 30 s and one extension cycle at 72°C for 10 min. For rs7903146 and for rs12255372, we used the same programme except that the annealing temperature was 64°C. A thermal cycler GeneAmp PCR System 2700 (Applied Biosystems, Life Technologies Corporation) was used for the amplifications. For rs7903146 genotyping, the PCR products were digested with RsaI restriction enzyme (New England Biolabs) to generate two fragments of 91 and 22 bp for the C allele and one 113-bp fragment for the T allele( Reference Szepietowska, Moczulski and Wawrusiewicz-Kurylonek 24 ). The FokI restriction enzyme (New England Biolabs) was used to genotype rs12255372 variants and generated two fragments of 94 and 24 bp for the G allele and one fragment of 118 bp for the T allele( Reference Parra, Cameron and Simmonds 25 ). We carried out genotype replications in 25 % of the DNA samples to obtain a 99 % rate of coincidence for both SNP.
Statistical analysis
Descriptive statistics were calculated for the analysed variables. Data were expressed as mean values and standard deviations, as medians and 25–75 quartiles or as mean values with their standard errors. Continuous variables were tested for normal distribution. For TAG, insulin, GLP-1 concentrations, HOMA-β and HOMA-IR, logarithmic transformation was performed for the application of parametric tests. We used t tests for independent samples to compare groups, and paired sample t tests were used to examine within-group differences; size effect was estimated by Cohen’s d effect. A carry-over effect was estimated to determine the influence of the previous dietary treatment. We compared changes in end points across genotype groups according to diet groups at 8 weeks. To assess the effects of genotype, dietary treatment and their interaction, we used a general linear model (GLM) repeated-measures analysis, and age was included in the model as a covariate. A Bonferroni correction was applied to all P values. P=0·05 was considered statistical significant. IBM SPSS Statistics 19.0 software was used for all statistical analyses.
Results
Of the eighty-one T2DM patients who were initially enrolled, seventy-four completed Diet 1, and of these sixty-three patients completed Diet 2. Of those participants who withdrew from the study, some withdrew during the 2nd week of Diet 1 because they did not like the taste of the nopal tortilla, whereas other participants dropped out during the washout period. The mean age of the participants was 51 (sd 7) years, and the time since diagnosis of T2DM was 3·6 (sd 2) years. The study included sixty-five (88 %) women and nine (12 %) men. The pharmacological treatment of the seventy-four patients at the time of the study was metformin (28/74, 37·8 %), glibenclamide (2/74, 2·7 %) or metformin and glibenclamide (36/74, 48·6 %); eight patients (10·8 %) did not indicate intake of any hypoglycaemic medication.
At baseline, the anthropometric characteristics of the study participants did not differ by genotype for the two analysed polymorphisms. TAG and cholesterol concentrations were lower in patients who carried one or two T alleles of rs79043146 (P=0·04 and P=0·05, respectively). In contrast, carriers of the rs12255372 T allele had lower basal fasting serum insulin levels (P=0·03) and HOMA-IR (P=0·02) compared with rs12255372GG (wild type) genotype carriers.
Anthropometric, metabolic and hormonal characteristics at baseline and at the end of the study period by genotype and diet are presented in Tables 2 and 3. After 8 weeks of Diet 1, weight, BMI, and waist and hip circumferences decreased (P=0·00015) for both polymorphisms, except for rs12255372GT/TT genotypes. In these genotypes, weight, waist circumference and hip circumference were least significant, and BMI showed no changes (Table 2).
Characteristics of transcription factor 7-like 2 genotype at baseline and at the end of the study in the nopal tortilla diet groupFootnote * (Mean values and standard deviations; medians and interquartile ranges (IQR))
HOMA-β, homoeostasis model assessment for β-cell function; HOMA-IR, homoeostasis model assessment for insulin resistance; GLP-1, glucagon-like peptide-1.
* P value for independent samples t test for difference between groups was not statistically significant (NS). A Bonferroni correction was applied to all P values.
† P value was obtained for dependent samples t test.
‡ Log transformation for analysis.
Characteristics of transcription factor 7-like 2 genotype at baseline and at the end of the study in the wheat integral bread diet groupFootnote * (Mean values and standard deviations; medians and interquartile ranges (IQR))

HOMA-β, homoeostasis model assessment for β-cell function; HOMA-IR, homoeostasis model assessment for insulin resistance; GLP-1, glucagon-like peptide-1.
* P value for independent samples t test for difference between groups was not statistically significant (NS). A Bonferroni correction was applied to all P values.
† P value was obtained for dependent samples t test.
‡ Log transformation for analysis.
At completion of Diet 2 (wheat integral bread) weight, BMI, and waist and hip circumferences decreased (P=0·00015) in carriers of the rs7903146CC (wild type) genotype. In contrast, in carriers of the rs7903146CT/TT genotype decreased weight, BMI and total cholesterol were found (Table 3). Significant changes in weight, BMI, waist circumference and HbA1c (P=0·01) in carriers of the rs12255372GG genotype were observed. In addition, least significant changes in weight and waist and hip circumferences in carriers of the rs12255372GT/TT genotype were observed (Table 3).
We observed a large and significant effect in all measured anthropometrics after the wheat integral bread diet, including total cholesterol for the rs12255372GT/TT carriers (d=0·8) (Table 4). Only BMI showed a smaller effect in rs7903146CT/TT (d=0·62) and rs12255372GT/TT carriers (d=0·46) on the nopal tortilla diet. However, patients with the rs7903146CT/TT genotype showed a large effect in weight and waist circumference (d=0·95) and (d=0·93), respectively, when they consumed the nopal tortilla diet (Table 4).
Size effect analysis according to genotype and type of dietFootnote *

TCF7L2, transcription factor 7-like 2; HOMA-β, homoeostasis model assessment for β-cell function; HOMA-IR, homoeostasis model assessment for insulin resistance; GLP-1, glucagon-like peptide-1.
* Cohen’s d test. Large size effect with d≥0·7.
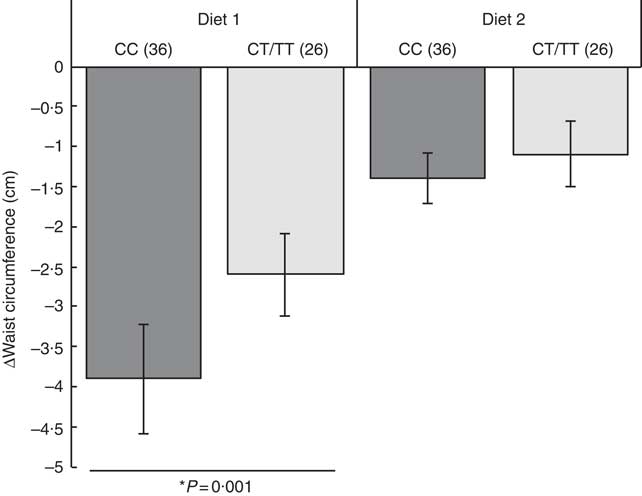
We used GLM repeated-measures analysis to assess the main effects of diet interactions with the rs7903146 (CC v. CT/TT) and rs12255372 (GG v. GT/TT) genotypes. According to the methodology of the model (paired groups), participants who did not complete the second treatment were eliminated from the comparisons. At 8 weeks, the effect of Diet 1 was associated with changes in waist circumference (β −1·54 (se 0·72), P=0·001) and hip circumference (β −3·01 (se 0·83), P=0·006) (Table 5). In rs7903146CC (wild type) carriers who consumed Diet 1, we observed a reduction in waist circumference of more than 2·5 cm compared with Diet 2 (P=0·001) (Fig. 1). The carry-over effect between Diets 1 and 2 was not significant (P=0·27). GLM analysis showed a significant Diet 1 effect on changes of total cholesterol (β 19·5 (se 6·68), P=0·02). The carry-over effect analysis showed a significant effect only for HDL-cholesterol (P=0·0001).
Effect of the interaction between rs7903146 TCF7L2 and two types of fibre on waist circumference during an 8-week individualised isoenergetic diet. Values are mean changes (Δ) with standard errors per genotype for a nopal tortilla diet (Diet 1) v. a wheat integral bread diet (Diet 2). CC and CT/TT refer to wild-type and mutated rs7903146, respectively, and the numbers in parentheses indicate the number of patients evaluated. * Effect of diet from general linear model repeated-measures analysis. Adjusted model for age.
Adjusted phenotype baseline values and changes during the 8-week intervention according to genotype at transcription factor 7-like 2 rs7903146 and type of dietFootnote * (Mean values and standard deviations)
HOMA-β, homoeostasis model assessment for β-cell function; HOMA-IR, homoeostasis model assessment for insulin resistance; GLP-1, glucagon-like peptide-1.
Bonferroni correction: a P=0·001, b P=0·006, c P=0·03.
* Adjusted model for age.
† P value General linear model (GLM) repeated-measures for main effect of rs7903146 (CC v. CT/TT).
‡ P value GLM repeated-measures for diet effect.
§ P value GLM repeated-measures for gene–diet interaction.
|| Log transformation Diet 1: nopal tortilla. Diet 2: wheat integral bread.
We observed no significant main effect of rs12255372 TCF7L2 on anthropometric and metabolic indicators. The diet effect was marginally associated with waist circumference (β −0·88 (se 0·83), P=0·09), hip circumference (β −1·80 (se 0·95), P=0·09) and total cholesterol (β 17·7 (se 7·56), P=0·06) (Table 6).
Adjusted phenotype baseline values and changes during the 8-week intervention according to genotype at transcription factor 7-like 2 rs12255372 and type of dietFootnote * (Mean values and standard deviations)

HOMA-β, homoeostasis model assessment for β-cell function; HOMA-IR, homoeostasis model assessment for insulin resistance; GLP-1, glucagon-like peptide-1.
Bonferroni correction: a P=0·09, b P=0·09, c P=0·06.
* Adjusted model for age.
† P value General linear model (GLM) repeated measures for main effect of rs7903146 (CC v. CT/TT).
‡ P value GLM repeated measures for diet effect.
§ P value GLM repeated measures for gene–diet interaction.
|| Log transformation Diet 1: nopal tortilla. Diet 2: wheat integral bread.
Meanwhile, no significant interaction between rs7903146 or rs12255372 TCF7L2 and diet was seen in this study.
Discussion
In this study, we examined the effect of a dietary intervention with two types of fibre: nopal and wheat grain. The results showed different, genotype-specific responses for the two diets.
At baseline, we found that the TAG and cholesterol concentrations were lower in patients who carried one or two T alleles of rs79043146. Wang et al.( Reference Wang, Song and Srivastava 26 ) reported in a meta-analysis that the minor allele (T) was associated with lower risk for hypertriacylglycerolaemia in subjects with type 2 diabetes, but no association was found between the minor (T) allele and plasma TC, LDL-cholesterol or HDL-cholesterol levels in subjects with type 2 diabetes or the metabolic syndrome. Ouhaibi-Djellouli et al.( Reference Ouhaibi-Djellouli, Mediene-Benchekor and Lardjam-Hetraf 16 ) reported in a cross-sectional study with the InSulino-résistance à ORan (ISOR) population (non-T2DM subjects) that the T allele of the rs7903146 was associated with lower body weight (P=0·02), lower BMI (P=0·009), lower waist circumference (P=0·01) and a lower waist:hip ratio (P=0·02).
The two high-fibre diets used in this study modified anthropometric indicators in T2DM patients. When subjects consumed the nopal tortilla diet, in carriers of the rs7903146CC genotype, elevated GLP-1 levels were observed (a non-significant tendency). The GLP-1 increases insulin and favours satiety, which may in turn contribute to weight loss. Indeed, previous studies have reported a positive effect of GLP-1 receptor agonists that led to weight loss in obese or overweight T2DM patients( Reference Vilsbøll, Christensen and Junker 27 , Reference Potts, Gray and Brady 28 ).
In the wheat integral bread diet, in addition to the observed anthropometric changes, HbA1c levels decreased in patients with the rs12255372GG genotype, and total cholesterol levels decreased in patients with the rs7903146CT/TT genotype.
With size of effect analysis, we could demonstrate a greater effect for individuals with rs1255372GT or TT genotypes when they consumed the wheat integral bread diet. This effect was more homogeneous among the anthropometric indicators and total cholesterol levels, which have not been previously documented. Mattei et al.( Reference Mattei, Qi and Hu 29 ) reported that individuals with the rs12255372TT genotype showed a greater reduction in weight, waist circumference, BMI and total fat mass when they consumed a low-fat diet (20 % from total energy) compared with individuals who had the same genotype but who consumed a high-fat diet. However, none of these differences were significant after a multiple comparison adjustment.
We did not perform a Hardy–Weinberg equilibrium analysis in this study because the subjects had been previously genotyped and assigned to wild-type genotype or genotypes with one or two mutated alleles. Nonetheless, the population from the sample patients is in accordance with the Hardy–Weinberg equilibrium for rs7903146 and rs12255372 TCF7L2 polymorphisms. The minor allele frequency of rs7903146T was 0·27 and for rs12255372T it was 0·13.
A few studies have examined the interaction between metabolic and hormonal responses to dietetic interventions in the presence of TCF7L2 genetic variants( Reference Ouhaibi-Djellouli, Mediene-Benchekor and Lardjam-Hetraf 16 – Reference Fisher, Boeing and Fritsche 18 ). We carried out this intervention study that focused on intake of two types of fibre in a high-fibre diet that had a low GI and low amounts of refined grains to determine whether such diets can help lower plasma glucose and improve insulin response( Reference Hu, van Dam and Liu 30 ). Our results suggested that consumption of nopal in tortillas (dehydrated nopal) had no hypoglycaemic effect in T2DM patients, although earlier studies found that either fresh or cooked nopal has hypoglycaemic effects( Reference Frati-Munari, Gordillo and Altamirano 9 , Reference Najm and Lie 10 ), probably because of its soluble fibre content (mucoplysaccharides: pectin and mucilage). In this study, the main effects after consumption of nopal tortillas were changes in anthropometric indicators such as decreases in weight, BMI, and waist and hip circumferences, although these results could be explained by alterations in hunger sensations. Nopal tortillas have both soluble and insoluble fibre, and such high-fibre foods are thought to require more time and effort for mastication, which could allow sufficient time for signals that mediate satiety sensations to be generated and delivered to the brain( Reference Blundell and Halford 31 ). Soluble fibre can also absorb water that may in turn increase stomach distention, which could trigger afferent vagal signals of fullness and a feeling of satiety( Reference de Graaf, Blom and Smeets 32 ).
In the univariate analysis, patients who consumed a wholegrain fibre diet showed decreases in anthropometric indicators and total cholesterol. Several studies have reported that intake of wholegrains and cereal fibre is inversely associated with diabetes risk among homozygous carriers of rs7903146CC, whereas for T allele carriers the effect seemed to offset the protective effect of the grains consumed, and therefore the beneficial effect of consuming wholegrains for preventing T2DM may be mitigated in the presence of rs7903146TT TCF7L2, as suggested by previous reports( Reference López, Ordaz and Tovar 8 , Reference Frati-Munari, Gordillo and Altamirano 9 , Reference Hindy, Sonestedt and Ericson 33 ), indicating that the risk associated with this genetic variant may be modified by the quality and quantity of dietary carbohydrates. However, we found a better response to Diet 1 for waist circumference in carriers of the rs7903146CC and for hip circumference in carriers of the rs7903146CT/TT. After Diet 2, total cholesterol levels decreased more significantly in rs7903146CT/TT genotypes.
After completion of the nopal tortilla diet, anthropometric indicators such as weight and waist and hip circumferences had the largest decrease compared with the wholegrain fibre diet, and it is important to note that homozygous and heterozygous carriers of the T allele in rs7903146 exhibited the smallest change in BMI and waist circumference compared with the homozygous C allele carriers. In the literature, there is only one similar study( Reference Grau, Cauchi and Holst 14 ) regarding obese patients that showed a significant interaction between genotype and diet relative to changes in body weight and waist circumference, where rs7903146TT carriers who consumed a high-fat diet had the least weight loss and smallest reduction in waist circumference.
A limitation of the present study was the relatively small sample size used to test the effects of two dietary interventions and genotypes. This may also have affected the loss of significance of some effects after correction for multiple tests. This study analysed a single sequence of treatments, which precludes the analysis of the effects of the two treatments under the same baseline conditions. Another limitation of the study was the short-term follow-up period that could be increased to 10 or 12 weeks.
This intervention study showed that the risk genotypes of the studied polymorphisms may have different effects on anthropometrics, when the overall diet is the same but the fibre type differs. Individuals with a mutated genotype for rs12255372 TCF7L2 showed a larger decrease in total cholesterol when they consumed a diet with wholegrain fibre for 8 weeks, and carriers of the rs7903146CC genotype showed higher GLP-1 levels when they consumed a diet with nopal tortilla fibre for 8 weeks. This result suggests the importance of considering patient genetic patterns when suggesting therapeutic diets. As such, differences in anthropometric, metabolic and hormonal responses should be considered when adapting and individualising diets of patients to better control T2DM.
Acknowledgements
The authors thank the Health Centers of the Secretary of Health of Guanajuato State.
The authors thank the Direccion de Apoyo a la Investigación y al Posgrado, University of Guanajuato, México, for financial support and Consejo Nacional de Ciencia y Tecnología (CONACYT) for doctoral studentship.
All authors directly participated in carrying out the study. M. M. L.-O. and E. L. P.-L. designed the study and wrote the manuscript; M. E. G.-S. designed the experimental protocols; M. M. L.-O., M. E. T and E. L. P.-L. conducted statistical analyses and critically reviewed and wrote the paper. All the authors read and approved the final manuscript.
All authors state that they have no direct or indirect conflicts of interest.


