

During the Age of Mass Migration (1850–1913), 55 million Europeans left their countries of origin and moved to the New World. After the United States, Argentina was the second largest destination country in the period, receiving 6.2 million immigrants. By 1914, 30 percent of Argentina's population was foreign-born.
The conventional view on this migration episode is that Argentina constituted a “land of opportunity,” offering European immigrants a good chance to experience upward economic mobility.Footnote 1 Although this view has been pervasive in the historical literature,Footnote 2 there is little quantitative evidence to support it. Moreover, the quantitative evidence that does exist is based on the published tabulations of the census. While these tabulations provide useful information on the economic performance of immigrants at one point in time, they offer little insight into how immigrants progressed as they spent time in the country. In addition, the published census data contain no information on parental place of birth, which prevents a systematic study of second-generation immigrants’ economic performance.
I study the mobility and economic outcomes of European immigrants and their children in nineteenth-century Argentina. To do so, I use newly collected data linking males across the 1869 and 1895 national censuses of population and passenger ship lists of immigrant arrivals to the city of Buenos Aires (Pérez Reference Pérez2017). These data enable me to follow a large group of immigrants and their children and to track their progress while in the country. To the best of my knowledge, this article is the first to use longitudinal data following individuals over time and across places to provide evidence on the economic performance of immigrants in late nineteenth-century Argentina.
The first part of my analysis looks at the occupational mobility of first-generation immigrants. I ask whether immigrants started in lower paying occupations than natives but converged to them as they spent time in the country. I find that, upon arrival, European immigrants held on average slightly lower paying occupations than natives. Yet, consistent with assimilation into the labor market of Argentina, my findings suggest that immigrants from most of the major sending countries outpaced natives in terms of occupational upgrading. These results contrast with recent evidence on the Age of Mass Migration in the United States (Abramitzky, Boustan, and Eriksson Reference Abramitzky, Leah and Eriksson2014), where immigrants appear to have experienced similar rates of occupational upgrading as natives.
Once I have characterized the occupational progress of immigrants after their arrival to Argentina, I study the extent to which immigrants who stayed in Argentina experienced progress relative to their pre-migration occupations. I find that immigrants were very likely to upgrade their occupations: About 75 percent of those who declared an unskilled occupation upon arrival experienced occupational upgrading in less than 15 years. Moreover, relatively skilled immigrants experienced little occupational downgrading. Comparing my results to evidence from similarly constructed data for the United States (Ferrie Reference Ferrie1997), my findings suggest that European immigrants in Argentina were better able to exploit their pre-migration human capital than those migrating to the United States.
My data only enable me to characterize the occupational trajectories of immigrants who migrated permanently to Argentina. These immigrants are of special interest from a historical point of view, since they participated in the labor market of Argentina for many years and were also likely to raise children in the country. However, in interpreting the results described earlier, it is useful to bear in mind that the experience of the average immigrant might have been different from the experience of those who settled permanently.
The second part of my analysis focuses on the children of European immigrants: the “second generation.” I find that the sons of European immigrants experienced substantially better economic outcomes than the sons of natives: They were more likely to be literate, held higher paying occupations and were more likely to own property as adults. The relative advantage of the second generation was not confined to any single sending country. Rather, the sons of immigrants from every major sending country outperformed the sons of natives. In explaining these results, I provide suggestive evidence that the higher “ethnic capital” (Borjas Reference Borjas1992) of the children of European immigrants might have contributed to their advantages in adulthood.
Finally, I contrast the intergenerational mobility of second-generation immigrants to that of the children of natives. I find a relatively similar persistence of occupational status among second-generation immigrants compared to children of natives. On the one hand, the children of unskilled European immigrants were more likely to exit those occupations than the children of unskilled natives. However, the sons of white-collar immigrants were more likely to work in white-collar occupations in adulthood than the sons of white-collar natives. As a result, occupational persistence was on average similar across the two groups.
A number of features make Argentina in the Age of Mass Migration an interesting case study of the economic performance of international immigrants. First, the magnitude of the migration flow relative to the native population was substantial by both historical and contemporary standards. Second, in contrast to immigrants entering the United States during this time period and to many immigrants today, immigrants entering Argentina exhibited higher levels of human capital than natives and came from countries that resembled Argentina in terms of average living standards.Footnote 3 Hence, this migration episode can shed light on what immigrant assimilation might look like in a setting where immigrants had high human capital and were a fairly numerous group relative to natives. Finally, the opportunity to construct longitudinal data that follow a large number of immigrants and their children enables me to deal with some of the methodological challenges faced by researchers studying immigrant assimilation (Borjas Reference Borjas1985; Abramitzky, Boustan, and Eriksson Reference Abramitzky, Leah and Eriksson2014).
HISTORICAL CONTEXT AND RELATED LITERATURE: ARGENTINA IN THE AGE OF MASS MIGRATION
The 1853 Constitution made it a national priority to attract European immigrants to help populate the vast and sparsely populated Argentine territory. In the mind of the elites governing the country, immigrants from Europe—especially those from the north of the continent—were needed to provide a “civilizing influence” that would enable Argentina to grow as a prosperous and free nation (Alberdi Reference Alberdi1852).Footnote 4
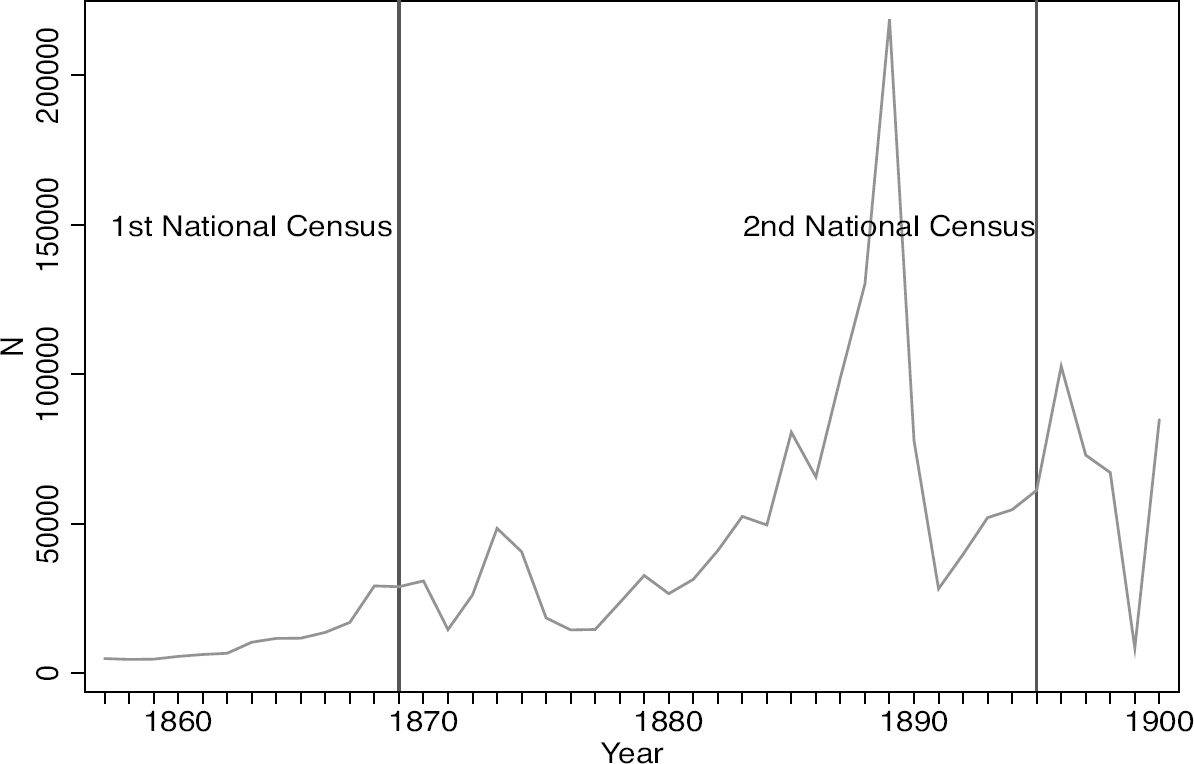
From 1857 to 1930, Argentina received 6.2 million immigrants from Europe, becoming the second largest receiving country in the period (after the United States) and the largest in per-capita terms (Germani Reference Germani1966). Figure 1 shows the number of yearly arrivals of overseas immigrants to Argentina. Until 1862, the number of yearly arrivals was below 10,000, but started to increase rapidly thereafter. This increase coincided with the unification of the different provincial governments into a single national authority following the Battle of Pavón in 1861. By 1914, the year of the third national census, Argentina's population had grown from less than two million in 1869 to more than eight million, of which 30 percent were foreign born.
NUMBER OF NEW IMMIGRANT ARRIVALS, 1857–1900
Despite the Argentine elites' desire to attract immigrants from the north of Europe, nearly half of the immigrants were of Italian origin. In 1895, Italian immigrants accounted for 11 percent of the population of Argentina. Spain was the second most numerous sending country, representing around a third of the total immigration. Although immigrants from France were not as numerous overall, they accounted for a relatively large fraction of the early-arriving immigrants that are the main focus of this article.
Conventional accounts of the period describe Argentina as a country where “hard working” immigrants had an easy path to upward economic mobility (Alsina Reference Alsina1898). Although this view is also popular among early scholars (Diaz-Alejandro Reference Diaz-Alejandro1970; Conde Reference Conde1979; Baily Reference Baily1983), there is little quantitative evidence supporting it. In a series of widely debated studies, Gino Germani (Reference Germani1966) uses the published census tabulations to study the extent of occupational mobility in nineteenth-century Argentina. His study finds that immigrants moved up the occupational ladder at a faster pace than natives. However, a concern with inferring mobility from aggregate data is that the pool of immigrants changes from census to census, either because new immigrants arrive to the country or because some return to their countries of origin. Hence, it is not possible to disentangle changes in the social standing of immigrants from changes in the composition of the immigrant pool. In the case of Argentina, an added difficulty is the lack of information on year of arrival to the country in the nineteenth-century censuses.
A more recent study by María Liliana Da Orden (Reference Da Orden2005) also offers some support for the optimistic view of immigrant social mobility. The author studies the occupational mobility of Spanish immigrants in Mar del Plata, a coastal city in the Province of Buenos Aires. By linking birth and marriage records of the children of immigrants, she is able to observe immigrants’ occupation at two different points in time. She documents that, after an average of 26 years, 51 percent of the immigrants in her sample had moved up in the occupational ladder.
Other studies present a more negative outlook on the possibilities for social progress in nineteenth-century Argentina. Mark Szuchman (Reference Szuchman1981) links census records from 1869 to 1895 for immigrants and natives residing in the city of Córdoba. He finds that upward mobility was rare among immigrants, although the author is only able to follow individuals who had stayed in the city of Córdoba until 1895. Eugene F. Sofer (Reference Sofer1982) examines the occupational mobility of Eastern European Jewish immigrants in the city of Buenos Aires at the late nineteenth-century. The author links individuals from the 1895 census to the records of the Chevrah Kedyscha Ashkenazi, the main Jewish association in Buenos Aires. He documents little upward mobility, with most immigrants remaining trapped in unskilled jobs or even experiencing downward mobility.
Existing studies that use individual level data to assess the economic mobility of immigrants suffer from two main limitations.Footnote 5 First, these studies focus on either specific immigrant groups or on immigrants living in specific places within Argentina. Second, because economic and geographical mobility are probably associated, limiting the analysis to immigrants who did not change their place of residence is likely to underestimate the economic mobility experienced by the typical immigrant. Later, I show that failing to track internal migrants indeed results in lower estimated rates of occupational mobility among first-generation immigrants.
From a methodological point of view, this article is closely related to Joseph P. Ferrie (Reference Ferrie1997) and Ran Abramitzky, Leah Platt Boustan, and Katherine Eriksson (Reference Abramitzky, Leah and Eriksson2014). Ferrie (Reference Ferrie1997) links records of ship arrivals of immigrants to U.S. censuses in the Antebellum period to look at the occupational mobility of immigrants relative to Europe. The author finds that immigrants, in particular those from Britain and Germany, experienced relatively high rates of upward occupational mobility during this time period. Abramitzky, Boustan, and Eriksson (Reference Abramitzky, Leah and Eriksson2014) use linked census data to study the labor market assimilation of immigrants in the United States at the early twentieth-century. The authors find that immigrants exhibited similar rates of occupational upgrading as natives.
This article is also related to a growing body of literature in economic history that uses linked data to study historical migration episodes. In addition to the two articles described earlier, some other examples include Abramitzky, Boustan, and Eriksson (Reference Abramitzky, Leah and Eriksson2012, Reference Abramitzky, Leah and Eriksson2013), Boustan, Matthew E. Kahn, and Paul W. Rhode (Reference Abramitzky, Leah and Eriksson2012); William J. Collins and Marianne H. Wanamaker (Reference Collins and Wanamaker2014, Reference Collins and Wanamaker2015); Jason Long and Ferrie (Reference Long and Ferrie2013), Long (Reference Long2005), Edward Kosack and Zachary Ward (Reference Kosack and Ward2014), and Laura Salisbury (Reference Salisbury2014). In contrast to this article, the focus of this literature has been to study either internal migrations within the United States or the United Kingdom or international migrations to the United States.
DATA
Linking the 1869 and 1895 Censuses
I constructed a new sample following natives and immigrants across Argentina's national censuses of 1869 and 1895. To do so, I took advantage of the fact that both censuses' handwritten manuscripts are indexed and can be searched through the genealogy website FamilySearch.org.Footnote 6 The sample includes males—natives and immigrants—who were of working-age in both census years and males—sons of natives and native-born sons of immigrants—who were observed in their childhood household in 1869 and as adults in 1895.
To construct this sample, I identified two groups of individuals in the 1869 census full count: (1) males 18 to 35 years old, born in either Argentina or one of the six largest European sending countries (England, France, Germany, Italy, Spain, and Switzerland), and (2) males 0 to 17 years old, born in Argentina, with father present in the household and father born in Argentina or one of the European countries listed earlier. These six European countries were the only sending countries with more than 1,000 residents in the relevant age cohort in 1869 Argentina, accounting for more than 95 percent of all European immigrants at that time.Footnote 7 These two groups included a total of 448,201 individuals, of which 58,755 were born in one of the European sending countries included in the analysis and 22,932 were native-born sons of immigrants from these countries.
I then searched the 1895 census full count for a set of potential matches for each of these individuals. Based on the similarity in reported names and (estimated) years of birth, I calculated a linking score ranging from 0 to 1 for each pair of potential matches: Higher scores represented pairs of records that were more similar to each other. Full details on the procedure used to compute the linking scores are provided in the Online Appendix.
I used these linking scores to inform my decision rule on which records to incorporate into the analysis. To be considered a unique match for an individual in the 1869 census, a record in the 1895 census had to satisfy three conditions: (1) be the record with the highest linking score among all the potential matches for that individual, (2) have a linking score earlier a minimum threshold ![]() , and (3) have a linking score sufficiently higher than the second-best linking score
, and (3) have a linking score sufficiently higher than the second-best linking score  .Footnote
8
.Footnote
8
Because the linking is based on potentially noisy information, there is a trade-off in choosing the cutoff values p_ and l. On the one hand, higher values of p_ and l imply that a larger fraction of true matches will be discarded from the analysis. In addition, individuals who report their identifying information with high accuracy and have more uncommon names—within their place and year of birth—are more likely to be uniquely matched under a more stringent rule. On the other hand, lower values of p_ and l will lead to a larger sample but to a higher share of incorrect matches. With this trade-off in mind, my baseline results are based on a sample created using a relatively conservative choice of the parameters p_ and l. As a result, my matching rates are lower than those typically found in recent economic history papers using U.S. census data.
The matching rate was 11.6 percent for sons of natives and 13.6 percent for sons of immigrants. I was able to uniquely link approximately 9.5 percent of working-age natives and 10 percent of working-age immigrants. Table A.1 in the Online Appendix shows the matching rates that resulted from this linking process, disaggregated by country of origin and by age group. I provide a detailed discussion on matching rates and additional sources of match failure in Online Appendix Table A.2.Footnote 9 Once I had completed the linking procedure, I manually digitized the economic outcomes variables using the handwritten census manuscripts available online at FamilySearch.org. In the case of working-age immigrants, children of immigrants and children of natives, I digitized the economic outcome variables for every individual in the linked sample. In the case of working-age natives, I digitized the economic outcomes only for a random sample of the linked individuals. The final sample includes about 6,000 working-age natives, 5,000 working-age immigrants, 18,000 sons of natives and 2,500 native-born sons of immigrants.
Linking Passenger Lists to the 1895 Census
To assess the extent to which immigrants experienced occupational progress relative to Europe, I complement the earlier data with a sample linking male immigrants arriving to the city of Buenos Aires to the 1895 census. To construct this sample, I started with a sample of 54,036 working-ageFootnote 10 immigrants who appeared in ship arrival records between 1882 and 1894.Footnote 11 These records were originally collected by the National Migration Office and have been digitized by CEMLA (Centro de Estudios Migratorios Latinoamericanos), a research center in Buenos Aires. Each record contains the name, occupation, date of arrival, port of origin and entry, civil status, and age of each passenger on the ship. In this time period, about 75 percent of immigrants entered Argentina through the port of Buenos Aires (Dirección General de Inmigración 1925).
I then linked these immigrants to the 1895 census using a method analogous to the one described earlier. I was able to link 3,157 immigrants, which represents approximately a 6 percent matching rate. Linking these data is more challenging than linking the censuses because immigrants typically declared their original first name upon arrival but adopted a Spanish version of it while in Argentina.Footnote 12 Table A.3 in the Online Appendix shows the number of individuals and linked individuals in this sample, by country of birth.
Comparing the Linked Samples to the Population
Given the absence of numerical identifiers in the data, names provide the most important source of information in the linking procedure. The dependence on names could lead to a biased sample if having a name that is both uncommon and accurately recorded is correlated with social and economic characteristics. In this subsection, I compare individuals in the linked samples to individuals in the cross-sectional data. I provide further details on this comparison in the Online Appendix.
The Online Appendix Tables A.4 to A.7 show the results of these comparisons. In these tables, I compare natives and immigrants in the linked sample to natives and immigrants in the 1869 and 1895 census cross-sections, based on the nationally representative census samples compiled by Jorge L. Somoza (Reference Somoza1967). Overall, the evidence suggests some degree of positive selection of individuals into the linked census sample. First, the white-collar occupational category tends to be overrepresented in the linked sample, with the fraction of white-collar workers being 2 percentage points higher than in the cross-section among native-born working-age individuals in the 1895 census. Second, individuals in the linked sample were 10 percentage points more likely to own property and 9 percentage points more likely be literate.
In Table A.8 in the Online Appendix, I compare immigrants in the passenger lists who were matched to an observation in the 1895 census to immigrants who were not, as well as immigrants in the linked sample in 1895 to immigrants in the 1895 cross-section. The main difference between the linked sample and the cross-section is that immigrants from Spain are overrepresented in the linked sample. For instance, while only 20 percent of immigrants in the passenger lists were from Spain, 35 percent of immigrants in the linked sample were from this country. This overrepresentation likely reflects the fact that immigrants from Spain did not change their names upon arrival to Argentina, making it easier to find them in the 1895 census.
Occupations and Earnings Data
Similar to U.S. national censuses of the period, nineteenth-century Argentine censuses lack information on individual-level earnings or income. I dealt with this feature of the data using two standard approaches in the literature. First, following Abramitzky, Boustan, and Eriksson (Reference Abramitzky, Leah and Eriksson2012, Reference Abramitzky, Leah and Eriksson2014) and Collins and Wanamaker (Reference Collins and Wanamaker2014), I constructed a measure of typical earnings by occupation.Footnote 13 Second, I classified the occupational titles into occupational categories.
To create the occupational earnings measure, I employed information from a variety of historical sources. First, I used information on daily wages in blue-collar occupations in the city of Buenos Aires from William I. Buchanan (Reference Buchanan1998). Second, I used the published census volumes to construct estimates of earnings in the commercial and industrial sectors. Third, I used the congressional reports of Antonio M. Correa and Emilio Lahitte (Reference Correa and Lahitte1898) to estimate earnings in the farming sector. Table A.9 in the Online Appendix shows the sources of income data used in the analysis. Further details on the construction of this earnings measure, including more information on the sources and assumptions are provided in the Online Appendix.
It is worth emphasizing that constructing a measure of typical earnings is challenging, especially for self-employed individuals. As a result, I conducted a number of sensitivity checks to assess the robustness of the results that rely on the occupational score. In particular, I paid special attention to the issue of assigning earnings to farmers.
I also classified the more than 100 occupational titles in my sample into broad occupational categories.Footnote 14 To do so, I first assigned each occupation a code from the Historical International Classification of Occupations (HISCO). This classification is based on the International Standard Classification of Occupations (ISCO) and has been adapted to deal with historical data. I then mapped each HISCO code to an occupational category using the Historical International Social Class Scheme (HISCLASS), developed by Ineke Maas, Andrew Miles and Marco H.D. Van Leeuwen (Reference Maas, Miles and Van Leeuwen2002). Finally, I collapsed the HISCLASS scheme into four broad categories following Long and Ferrie (Reference Long and Ferrie2013): white-collar (HISCLASS 1–5), farmer (HISCLASS 8), skilled/semi-skilled (HISCLASS 6–7, 9) and unskilled (HISCLASS 10–12). Table 1 shows the ten most common occupations for working-age individuals in 1895 and their corresponding occupational category, reported separately for natives and immigrants in the linked census sample.
FREQUENT OCCUPATIONS, 1895 CENSUS
Notes: This table shows the ten most frequent occupations in 1895 among working-age natives and immigrants in the sample linking the 1869 and 1895 national censuses.
Sources: Linked sample created by following working-age individuals through the 1869 and 1895 population censuses of Argentina. The text and Online Appendix described sample construction in detail.
There are three limitations associated with using occupations rather than earnings to measure labor market assimilation. First, I am not able to capture changes in an individual's social standing that stem from changes in their economic status within a given occupation. Second, the occupational earnings measure explicitly fixes the ranking of occupations in its 1895 level. As a result, the measure is unable to capture changes in economic status that occur due to changes in the distribution of income across occupations over time.Footnote 15 Third, because the censuses lack a question on employment status, I cannot distinguish employed from unemployed individuals.
THE FIRST GENERATION
Occupational Mobility of Natives and Immigrants
Panel (a) in Table 2 shows a transition matrix for natives, while Panel (b) shows this same matrix for immigrants. Each element of these matrices represents the fraction (number) of individuals working in occupational category i in 1869 that worked in occupational category j in 1895. The last row in both matrices shows the distribution of individuals across occupational categories in 1895.
OCCUPATIONAL MOBILITY OF NATIVES AND IMMIGRANTS, 1869 (ROWS) AND 1895 (COLUMNS)

Notes: Panel (a) presents an occupational transition matrix for native-born males. Each cell in this matrix shows the percentage and number (between brackets) of individuals in the linked sample in each occupational category in 1869 (rows) and 1895 (columns). Panel (b) presents the same matrix for foreign-born individuals. Occupations were classified based on the HISCLASS scheme. White-collar (HISCLASS 1–5), farmer (HISCLASS 8), skilled/semi-skilled (HISCLASS 6–7, 9) and unskilled (HISCLASS 10–12). Panel (c) reports summary measures of mobility. M (Column 1) corresponds to the fraction of individuals o↩ the main diagonal of the matrix. d(P, J) and d(Q, J) (Columns 2 and 3) correspond to the distance between matrices P and Q and a matrix representing full independence, respectively. d(P, Q) (Column 4) represents the distance between matrices P and Q and d(P, Q)i (Column 5) represents this same distance after excluding the elements of the main diagonal from each matrix. For each of these distances, I performed a test of the hypothesis that d(i, j) = 0. Significance levels are indicated by ∗∗∗p < 0.01, ∗∗p < 0.05, ∗p < 0.1.
Sources: Data are from the sample of linked census records, as described in the text and Online Appendix.
The first noticeable difference is that immigrants and natives were concentrated in different occupational groups. Farming was considerably more prevalent among natives than among immigrants, both in 1869 and in 1895. This difference is consistent with the different propensities of natives and immigrants to locate in urban areas. In 1869, 63 percent of the foreign-born resided in urban locations, whereas this proportion was only 28 percent among natives.
In Panel (c) of Table 2, I present a number of summary measures of mobility based on the transition matrices. The simplest measure of mobility is the fraction of individuals who switched occupational categories across years; that is the fraction of individuals off the main diagonal of the matrix. This statistic suggests that there was more occupational mobility among immigrants than among natives, with 59 percent of immigrants and 51 percent of natives switching occupational categories from 1869 to 1895.
Immigrants also appear to exhibit more mobility out of the unskilled category: 72 percent of those initially in unskilled occupations had moved out of this category by 1895, compared to 64 percent among natives. The typical path out of the unskilled category was different for the two groups. Natives usually left the unskilled category by switching into farming, whereas immigrants moved into more urban occupations such as white-collar and skilled/semi-skilled jobs. While only 8 percent of natives in unskilled occupations in 1869 worked in white-collar jobs by 1895, this fraction is considerably higher (23 percent) among immigrants.
As discussed in Long and Ferrie (Reference Long and Ferrie2013), a key shortcoming of using this simple measure to compare mobility across two matrices is that the measure does not distinguish whether differences in mobility are due to: (1) differences in the distribution of occupations across the two matrices or (2) differences in the strength of the association of the rows and columns in each of the two matrices. This distinction is important in this setting because, as discussed earlier, the distribution of occupations among natives differed markedly from the distribution among immigrants.
To establish whether the row-column association was stronger (i.e., there was less occupational mobility) among natives or among immigrants, I followed Long and Ferrie (Reference Long and Ferrie2013) in completing the following steps. First, I computed the Altham (Reference Altham1970) statistic d(P,Q), which measures the difference in the strength of the row-column association in matrices P—the mobility matrix of natives and Q—the mobility matrix of immigrants.Footnote 16 Higher values of d(P,Q) imply greater differences in this association, but are not informative regarding which of the two matrices exhibit more mobility. Next, I calculated d(P,J) and d(Q,J), which measure this same difference but relative to a matrix J representing full independence (a matrix of ones). Higher values of d(P,J) or d(Q,J) imply greater departures from independence, or less mobility.
Panel (c) of Table 2 shows that d(P,Q) is significantly different from zero, suggesting that the strength of the row-column association is different in the two matrices. In addition, the departure from independence is larger for natives than for immigrants, d(P,J) > d(Q,J). Taken together, these results suggest that there was higher occupational mobility among immigrants than among natives.Footnote 17
One key limitation of the existing studies of immigrant mobility in Argentina is the inability to track internal migrants. Table B.1 in the Online Appendix shows that this inability leads to lower rates of estimated occupational mobility among immigrants. In this table, I divide the sample of immigrants into “movers” and “stayers.” Individuals are classified as “movers” if by 1895 they lived outside of their 1869 department of residence. Panels (a) and (b) show an occupational mobility matrix computed separately for stayers and movers, respectively. Panel (c) of this table shows that stayers were less likely to switch occupational categories than movers (48 percent versus 65 percent). Similarly, the Altham statistic described earlier indicates that the mobility matrix for stayers exhibits a greater departure from independence that the mobility matrix for movers.
Occupational Earnings Regressions
Next, I use the occupational earnings data to compare the rates at which natives and immigrants moved into higher paying occupations. In particular, I estimate the following model of occupational earnings:
where Occupational Earnings it is the daily occupational earnings of individual i in year t, Immigrant i is an indicator variable of whether the individual was foreign-born, Year1895 t is an indicator of whether the observation belongs to the 1895 census X it and is a vector of individual-level characteristics. In the baseline specification, X it is limited to a quartic in age. I restrict the sample to working-age individuals, defined as those being at least 18 years old and at most 35 years old in 1869, and to those with a reported occupation in both census years. Because matching rates are not constant across sending countries, in the baseline specification each observation is weighted to reflect the country of birth distribution in 1895 Argentina.
There are two main coefficients of interest in equation (1): b 1, which captures baseline differences in the occupational earnings of natives and immigrants, and b 3, which captures differences in their occupational earnings growth.
This specification differs from the standard in the immigrant assimilation literature, which uses years since migration as the independent variable of interest (Abramitzky, Boustan, and Eriksson Reference Abramitzky, Leah and Eriksson2014; Borjas Reference Borjas1985; Chiswick Reference Chiswick1978; Lubotsky Reference Lubotsky2007). It is not possible to estimate the standard specification in this context because the censuses lack information on year of arrival to Argentina. This lack of information also prevents me from following cohorts of immigrants over time, as in George J. Borjas (Reference Borjas1985) and Chris Minns (Reference Minns2000). Note, however, that estimating this regression on the panel data enables me to keep the composition of the sample constant across census years. In doing so, I am able to disentangle changes in the social standing of immigrants from changes in the composition of the immigrant pool.Footnote 18
The first column of Table 3 presents the results of the baseline specification. This specification suggests that natives had relatively higher occupational earnings in 1869, but that immigrants upgraded their occupations faster. In particular, the growth in occupational earnings among immigrants was 6 percent faster than among natives. This evidence is consistent with the finding of immigrants’ higher rates of movements out of the unskilled category documented in the previous subsection.
OCCUPATIONAL EARNINGS REGRESSIONS
Notes: ∗∗∗p < 0.01, ∗∗p < 0.05, ∗p < 0.1. Robust standard errors in parentheses. All the regressions control for a fourth order polynomial on age and are weighted by the country of birth distribution in 1895. See the Online Appendix for details on how the income measure was computed. Column 1 reports the baseline specification. In Column 2, I restrict the sample to individuals residing in the provinces of Buenos Aires (including the city of Buenos Aires), Entre R´íos and Santa Fe in 1869. In Column 3, I include department of residence fixed effects and the interaction between these fixed effects and a 1895 census year indicator. In Column 4, I control for literacy and an interaction between literacy and a 1895 census year indicator. In Column 5, I control both for department fixed effects and their interaction with the 1895 indicator, and for literacy and its interaction with the 1895 indicator.
Sources: Data are from the sample of linked census records, as described in the text and Online Appendix.
Explaining the Differences Between Immigrants and Natives
I explore two main alternative hypotheses; other than labor market assimilation, that could explain the faster growth in occupational earnings among immigrants. First, I test whether this finding could be attributed to the greater propensity of immigrants to locate in areas of Argentina that were experiencing faster progress, particularly urban areas. Second, I test whether the finding is driven by an overall increase in returns to skill that disproportionately benefited immigrants, who had on average higher human capital levels than natives.
To explore the first possibility, I perform two different exercises. First, in Column 2 of Table 3, I restrict the sample to individuals who in 1869 resided in the provinces of Buenos Aires (including the city of Buenos Aires), Entre Ríos and Santa Fe. These three provinces hosted more than 95 percent of the European immigrants in 1869. When restricted to this set of provinces, I find that European immigrants performed worse than natives in the baseline year, but still exhibited higher relative occupational earnings growth. Second, in Column 3, I include department of residence fixed effects and an interaction between department of residence fixed effects and a 1895 census year indicator. That is, I compare immigrants residing in the same departments and allow the department of residence effects to differ based on the census year. The results are similar to the ones that I obtain in the previous specification.Footnote 19 Finally, the results (not reported) are similar if I restrict the sample to: (1) individuals residing in urban locations in 1869 or (2) individuals residing in urban locations both in 1869 and in 1895. Hence, the evidence suggests that immigrants experienced faster growth in occupational earnings also within urban areas.
As noted in the introduction, European immigrants had higher human capital levels than natives, as captured by literacy rates. Accordingly, the higher growth in occupational earnings among immigrants might reflect a general increase in the returns to skill from 1869 to 1895 rather than assimilation. To test this possibility, in Column 4 of Table 3 I estimate a version of equation (1) in which I include two additional controls: a literacy indicator and an interaction between a literacy indicator and a 1895 census year indicator. Again, I find faster occupational earnings growth among immigrants than among natives.
In the last column of Table 3, I test whether the earlier explanations combined could account for immigrants' relatively faster growth in occupational earnings. To do so, I include both the interaction between literacy and the 1895 census year indicator and the department of residence fixed effects interacted with the 1895 census indicator, as well as the main effects of both groups of variables. The evidence still suggests faster occupational upgrading among immigrants than among natives.
Heterogeneity by Sending Country
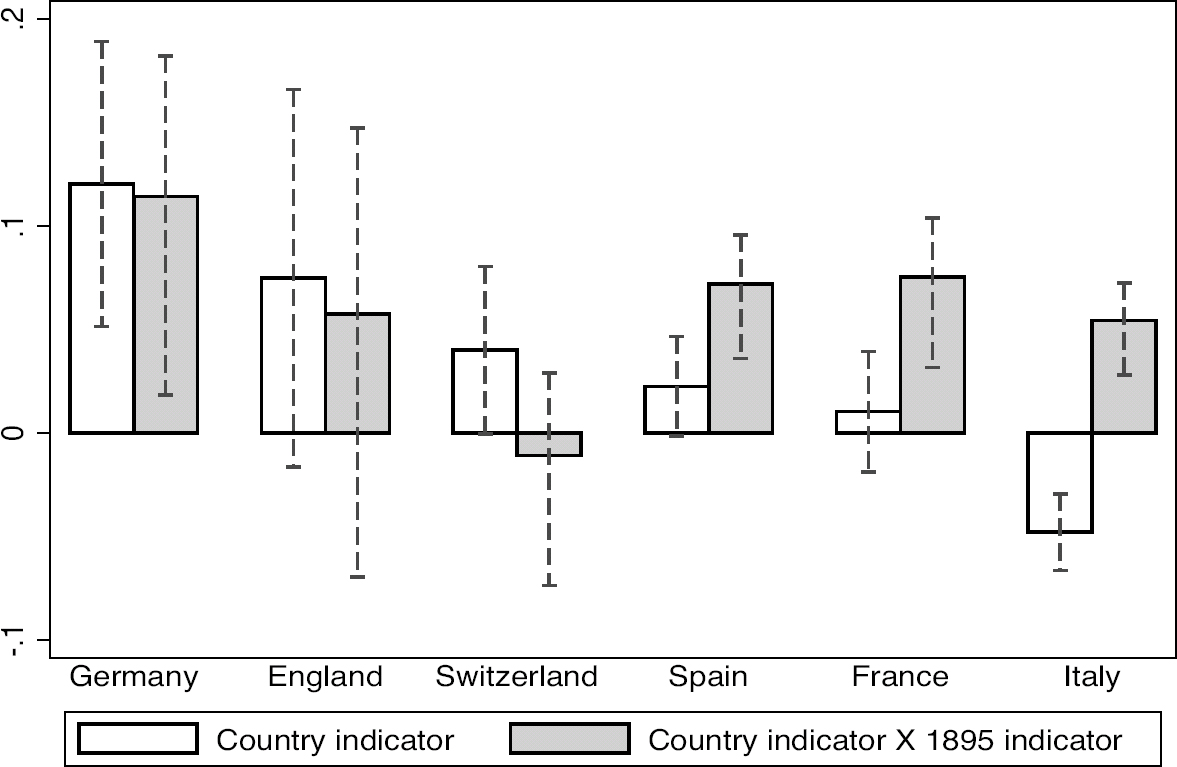
Immigrants from different sending countries differed both in terms of their human capital levels and in terms of their cultural and linguistic similarity to natives. Hence, the assimilation experience of the average immigrant might mask differences across sending countries. To explore this possibility, I estimate a version of equation (1) in which I include an indicator variable for each of the sending countries included in my sample, as well as an interaction of each of these country indicators with an 1895 census indicator. This specification captures differences both in country-specific baseline occupational earnings and in country-specific occupational earnings growth.
In Figure 2, I plot the coefficients corresponding to each of the countries around a 95 percent confidence interval. Upon arrival, immigrants from every major sending country (with the exception of Italy) appear to do better than natives, although the difference with respect to natives is not statistically significant for French immigrants. The evidence is broadly consistent with immigrants from countries with higher levels of average human capital doing better upon arrival. In particular, the ranking of countries based on average occupational earnings mostly matches the ranking of countries based on the average literacy of immigrants in Argentina. In addition, the evidence suggests that immigrants from every major sending country (with the exception of Switzerland) experienced faster occupational upgrading than natives. Note, however, that the interaction between the country of origin indicator and the 1895 census indicator is not statistically significant for the English or the German immigrants.
OCCUPATIONAL EARNINGS REGRESSION, BY COUNTRY OF ORIGIN
Alternative Specifications and Robustness
In this subsection, I show that the finding of immigrants' higher occupational earnings growth relative to natives is robust to: (1) how earnings are assigned to farmers, (2) using an alternative measure of occupational status based on access to property as the dependent variable, and (3) the procedure used to create the linked sample.
Assigning an earnings measure to farmers is challenging for a variety of reasons. First, it is hard to distinguish in the census between owners and operators of farms and farm employees. Although the 1895 census contains a question on whether the person holds real estate property, which could be useful for distinguishing the two, this question is not available in the 1869 census. In addition, the farming sector encompasses a wide range of economic realities, ranging from small farms to large-scale production. Hence, relying on typical earnings is more challenging than in other occupations where within-occupation earnings dispersion is likely to be less prominent. While my baseline measure of occupational earnings introduces a distinction based on the reported occupational title between small (who I estimate to be close to the median in terms of occupational earnings) and large farmers (who are at the top of the income distribution) and also incorporates farm laborers as a separate category, this distinction is most likely not sufficiently rich to capture the different realities within the farming sector.
In Column 1 of Table 4, I exclude individuals who were employed as farmers in either 1869 or 1895 from the sample. The table shows that the finding of higher occupational upgrading for immigrants remains unchanged in this case. However, I now find that immigrants outperform natives even upon arrival. Despite the challenges in measuring occupational earnings for farmers, excluding them could introduce biases if immigrants and natives exhibit differential rates of movement into and out of farming. In the context of Argentina, immigrants’ occupational upgrading relative to natives is exaggerated once farmers are excluded, as moving into farming was a more frequent avenue for upward mobility for natives than for immigrants, as shown earlier.
OCCUPATIONAL EARNINGS REGRESSIONS, ROBUSTNESS
Notes: ∗∗∗p < 0.01, ∗∗p < 0.05, ∗p < 0.1. Robust standard errors in parentheses. All the regressions control for a fourth order polynomial on age and are weighted by the country of birth distribution in 1895 (with exception of Columns 3 and 4). In Column 1, I exclude individuals employed as farmers in either 1869 or 1895 from the sample. In Column 2, I report the results of estimating the baseline equation using an alternative dependent variable based on access to property. In Column 3, I reweight the sample to account for differences in observable characteristics between the linked sample and the population. In Column 4, I report the results without reweighting the sample by the country of birth distribution in 1895. In column 5, I exclude immigrants with common first names (frequency higher than median within country of birth) from the sample. In Column 6, I drop all the immigrants from the sample who are not perfect matches.
Sources: Data are from the sample of linked census records, as described in the text and Online Appendix.
Another concern with the finding of faster occupational earnings growth among immigrants is that it might be sensitive to how the earnings measure was constructed. If my measure systematically overestimated earnings in occupations to which immigrants were more likely to transition, I would find that immigrants exhibited faster occupational upgrading than natives. As an alternative approach, I computed a measure of occupational status based on access to property. The 1895 census includes the question “¿Posee propiedad raíz?” (“Do you own real estate property?).”Footnote 20 I used this information to compute an alternative measure of occupational status: the fraction of individuals within a given occupation that owned real estate property in 1895. For instance, this measure takes a value of 0.2 for jornaleros (day laborers) and a value of 0.7 for comerciantes (storekeepers), which means that 20 percent of jornaleros and 70 percent of comerciantes in my sample held real estate property in 1895.Footnote 21 Column 2 in Table 4 shows that the finding of faster occupational upgrading among immigrants is robust to using the log of this measure as the dependent variable.
Finally, I assess the robustness of the results to the linking procedure used to create the sample. There are two main concerns related to the linking procedure. First, the linked samples are not fully representative of the population. Second, the fraction of false positives might be higher among immigrants than among natives.
To alleviate the first concern, in Column 3 of Table 4 I show that my results are similar when I reweight the sample to account for differences in observable characteristics (in addition to country of birth) with respect to the census cross-section.Footnote 22 This evidence suggests that selection into the linked sample, at least based on observable characteristics, is unlikely to drive the results. In addition, Column 4 shows that the results are also similar when I do not reweight the sample to account for differences in matching rates across sending countries.
The second concern is that the fraction of false positives in the linked sample might be higher among immigrants than among natives. If that were the case, relying on a linked sample would mechanically overestimate the extent of mobility among immigrants; although not necessarily the extent of upward mobility. While this possibility cannot be fully ruled out, I can replicate my analysis in a sample where this issue is likely to be less prevalent: immigrants with infrequent names. In particular, I re-estimate equation 1using immigrants with whose names fall later the median in the first name frequency distribution within their country of birth, while keeping the full sample of natives. Column 5 shows that the finding of faster occupational upgrading is robust to excluding this group of immigrants from the sample.
Finally, in Column 6 I replicate the analysis but focusing on the sample of immigrants whose identifying information matches perfectly, while again keeping the full sample of natives.Footnote 23 Overall, this evidence suggests that the result of faster occupational upgrading is unlikely to be driven by features of the linking procedure.Footnote 24 Note, however, that restricting the sample to immigrants with uncommon names (which likely exacerbates positive selection of immigrants into the linked sample) causes immigrants to perform better than natives in the baseline year.
Occupational Mobility from Arrival to 1895
In the previous subsection, I documented the extent to which immigrants moved up in the occupational ladder as they spent time in Argentina. Yet, another question is whether immigrants were able to progress relative to their pre-migration occupations. To answer this question, I use the sample following immigrants from their arrival to the city of Buenos Aires to the 1895 census. In this sample, I observe an individual's occupation in Europe as declared upon arrival and his occupation in 1895.Footnote 25
Table 5 shows a transition matrix in which rows represent occupations in Europe and columns represent occupations in the 1895 census. Overall, about 80 percent of immigrants who entered Argentina from 1882 to 1894 switched their occupational category by 1895. Yet, the data strongly reject independence between an occupation upon arrival and an occupation in 1895 (p-value< 0.01).
OCCUPATIONAL MOBILITY OF IMMIGRANTS, DECLARED UPON ARRIVAL (ROWS) AND IN 1895 CENSUS (COLUMNS)

Notes: Each cell in the table shows the percentage and the number (between brackets) of individuals in the linked sample in each occupational category upon arrival to Argentina (rows) and in 1895 (columns). Occupations were classified based on the HISCLASS scheme. White-collar (HISCLASS 1–5), farmer (HISCLASS 8), skilled/semi-skilled (HISCLASS 6–7, 9) and unskilled (HISCLASS10–12).
Sources: Data are from the sample of linked census records, as described in the text and Online Appendix.
Given the absence of a comparable full ranking of occupations in Argentina and each of the sending countries, it is not possible to assess the fraction of immigrants that downgraded or upgraded their occupations relative to Europe. However, under the assumption that the unskilled category is the least desirable, the data show that occupational upgrading occurred for a large fraction of those who had held unskilled occupations in Europe; less than 25 percent of those who entered the country as unskilled workers were still in those occupations by 1895. The fraction of immigrants moving out of unskilled occupations is substantially higher than documented by Ferrie (Reference Ferrie1997) in the Antebellum United States. Ferrie (Reference Ferrie1997) finds that about half of the immigrants arriving to the United States in the 1840–1850 period were still working as unskilled workers by 1860. Indeed, even when excluding Irish immigrants, who had the worst outcomes among all immigrant groups, from the U.S. data, the evidence suggests higher rates of upward occupational mobility in Argentina.Footnote 26
Another contrast relative to the findings of Ferrie (Reference Ferrie1997) is that immigrants who declared skilled/semi-skilled occupations were quite unlikely to experience occupational downgrading; only 14 percent of those initially in the skilled/semi-skilled category were working in unskilled occupations in 1895. In the U.S. case, the fraction experiencing downgrading was considerably higher; as high as 30 percent among skilled workers. Overall, this evidence suggests that immigrants entering Argentina benefited from relatively better opportunities for occupational upgrading than those entering the United States.Footnote 27
Similar to Ferrie (Reference Ferrie1997) and consistent with historical accounts of the period (Germani Reference Germani1966), I find that those who declared farming occupations upon arrival were fairly unlikely to work as farmers in Argentina, at least in the short run. Indeed, about 66 percent of these immigrants resided in urban locations by 1895 (35 percent in the city of Buenos Aires) compared to 72 percent and 40 percent among all immigrants in the sample. This finding confirms that, for many European immigrants, the Transatlantic move was accompanied by a shift from rural to urban occupations (Sánchez-Alonso Reference Sánchez-Alonso2007).
THE SECOND GENERATION
Intergenerational Occupational Mobility
In this section, I compare the intergenerational occupational mobility of the native-born sons of immigrants—the “second generation”—and the sons of natives. Panels (a) and (b) of Table 6 show an intergenerational mobility matrix for sons of natives and for sons of immigrants, respectively. Rows in each of these matrices represent a father's occupation in 1869 and columns show the occupation of his son in 1895. Each element of these matrices represents the fraction (number) of fathers in occupational category i in 1869 whose sons worked in occupational category j in 1895.
INTERGENERATIONAL MOBILITY OF CHILDREN OF NATIVES AND IMMIGRANTS, FATHERS IN 1869 (ROWS) AND SONS IN 1895 (COLUMNS)
Notes: Panel (a) presents a transition matrix for sons of natives. Each cell in this matrix shows the percentage and the number (between brackets) of fathers in occupation i in 1869 with sons in occupation j in 1895. Panel (b) presents the same matrix for native-born sons of immigrants. Panel (c) presents the counterfactual occupational distribution for sons of natives had they been exposed to the transition matrix of sons of immigrants. Occupations were classified based on the HISCLASS scheme. White-collar (HISCLASS 1–5), farmer (HISCLASS 8), skilled/semi-skilled (HISCLASS 6–7, 9) and unskilled (HISCLASS 10–12). Panel (d) reports summary measures of mobility. M (Column 1) corresponds to the fraction of individuals o↩ the main diagonal of the matrix. d(P, J) and d(Q, J) (Columns 2 and 3) correspond to the distance between matrices P and Q and a matrix representing full independence, respectively. d(P,Q) (Column 4) represents the distance between matrices P and Q and d(P, Q)i (Column 5) represents this same distance after excluding the elements of the main diagonal from each matrix. For each of these distances, I performed a test of the hypothesis that d(i, j) = 0. Significance levels are indicated by ∗∗∗p < 0.01, ∗∗ p < 0.05, ∗p < 0.1.
Sources: Data are from the sample of linked census records, as described in the text and Online Appendix.
The first noticeable difference between the two groups is that movements out of unskilled occupations were considerably more frequent among the children of immigrants. About half of the sons of natives whose father worked in unskilled occupations themselves worked in these occupations, compared to only 25 percent among the children of immigrants. The opposite pattern occurs in the white-collar category, where persistence was much prominent among sons of immigrants than among sons of natives.
In Panel (c) of Table 6, I follow Collins and Wanamaker (Reference Collins and Wanamaker2017) in reporting a counterfactual exercise simulating the distribution of sons of natives across occupational categories had they been exposed to the transition matrix of the sons of immigrants. This exercise reveals two main findings. First, the fraction of sons of natives in unskilled occupations would have been substantially lower under this counterfactual: 17 percent versus 28 percent. Second, the fraction in white-collar occupations would have been almost twice as high: 33 percent versus 17 percent.Footnote 28 Taken together, these results suggest that the children of European immigrants faced better prospects for mobility out of unskilled jobs than the children of natives.Footnote 29
Panel (d) of Table 6 provides summary measures of mobility analogous to the ones presented earlier. The table shows that the fraction of sons switching occupational categories is almost identical in both groups: About 55 percent of sons are in a different occupational category relative to their father. Yet, using the Altham measure of mobility reveals slightly higher mobility among sons of natives than among sons of immigrants.
The Economic Performance of the Second Generation
Next, I compare the economic outcomes of the native-born sons of immigrants and the sons of natives. I begin by estimating the following model:
where Son Outcome i is an economic outcome of the son in father-son pair i, Second Generation i is an indicator variable that takes a value of one for native-born individuals whose father was an immigrant, X i is a vector of household characteristics (limited to a quartic in son's and father's age in the baseline specification), and e i is an error term, clustered at the level of the father to account for the presence of siblings in the data.
The key difficulty in estimating the earlier equation is that the censuses do not include a question on parental place of birth. I therefore infer this information by linking males from the 1895 census to their childhood household in 1869, where they were observed living with their parents. The sample is restricted to native-born males 26 to 44 years old in the 1895 census, that is, those who had already been born and that were young enough to still be living in their childhood household in 1869.
I first compare the literacy rate of second-generation immigrants to that of the children of natives. A son is defined as being literate if in 1895 he answered affirmatively to the question: “Do you know how to read and write?” The question does not specify whether the individual was literate in Spanish or in another language. In Column 1 of Table 7, X i includes only a quartic in father's and son's age. This specification shows that the sons of immigrants were substantially more likely to be literate as adults than the sons of natives, an advantage above 35 percentage points relative to a mean literacy rate of about 50 percent among natives.
ECONOMIC OUTCOMES OF THE SECOND GENERATION
Notes: ∗∗∗p < 0.01, ∗∗ p < 0.05, ∗p < 0.1. Robust standard errors clustered at the level of the father in parentheses. This table shows the estimated coefficients in a regression comparing the children of immigrants and the children of natives in the 1895 census. The dependent variable is an indicator for literacy in Columns 1 to 3, log occupational earnings in Columns 4 to 6 and an indicator of access to property in Columns 7 to 9. Parental place of birth is inferred by linking individuals from the 1895 census to their childhood households in 1869. All regressions control for a quartic in son's and father's age. Household characteristics include the literacy of the father and a full set of dummies corresponding to occupational classes of the father. Enumeration district fixed effects are based on a family place of residence in 1869.
Sources: Data are from the sample of linked census records, as described in the text and Online Appendix.
As first-generation immigrants themselves were more likely to be literate than natives, one simple explanation for the earlier finding is the transmission of human capital from parents to their children. I test this hypothesis in Column 2, where I control for parental literacy and also include indicators corresponding to the occupational category of the father in 1869.Footnote 30 The point estimate goes down by about a third, suggesting that differences in parental background—beyond place of birth—play a role in explaining the advantage of the second generation. However, the difference remains large (about 23 percentage points) and statistically significant.
An alternative explanation for the observed difference in literacy rates is that, as discussed earlier, immigrants were more likely to reside in urban locations than natives. If, for instance, urban locations were better served by schools, then the children of immigrants would have been more likely to acquire formal education and thus be literate as adults. Moreover, the children of immigrants were disproportionately located in the relatively more prosperous areas of Argentina, the Littoral region. To explore this possibility, I estimate equation (2) adding a full set of enumeration district fixed effects, based on the family place of residence in 1869. In addition to controlling for the urban/rural status of the family's place of residence, these fixed effects control for other observable and unobservable factors that vary at the enumeration district level and that might have influenced literacy rates in adulthood.Footnote 31 The results in Column 3 again show that second-generation immigrants did better in terms of literacy, an advantage of about 15 percentage points, even when compared to sons of natives who grew up in similar locations.
Columns 4 to 6 in Table 7 repeat the earlier analysis using the log of occupational earnings as the outcome variable. The evidence also suggests a substantial advantage of the children of immigrants relative to the sons of natives. This difference is robust to controlling for father's literacy and occupational status in 1869 (in Column 5), as well as for observable and unobservable enumeration district characteristics (in Column 6).
In Columns 7 to 9, the dependent variable is an indicator that takes a value of one if the individual held real estate property in 1895. Interestingly, I do not observe an advantage of the sons of immigrants in terms of access to property as adults in the baseline specification (Column 7) or when controlling for father's literacy and occupational category (Column 8). However, second-generation immigrants also do better in terms of access to property, an advantage of 3.2 percentage points relative to a mean of 33 percent among sons of natives, when I include enumeration district fixed effects (Column 9). This pattern is consistent with the fact that property was more difficult to access in the relatively more urban and prosperous locations where European immigrant families resided in Argentina.
I next explore how the children of immigrants from different sending countries fared as adults. Figure 3 shows the results of estimating equation (2), now using separate country of origin indicators instead of a single second-generation indicator. In each of the figures, I plot the coefficient corresponding to each of the countries around a 95 percent confidence interval. Panel (a) shows the results for literacy, Panel (b) for log occupational earnings, and Panel (c) for access to property. In the three cases, I control for father's literacy and occupational category in 1869, as well as for enumeration district fixed effects as determined by the family place of residence in 1869. The figures show that the children of immigrants from every major sending country fared on average better as adults than the children of natives. The differences relative to the sons of natives are especially prominent with respect to literacy and occupational earnings. Overall, these results suggest that the advantage of second-generation immigrants was not confined to any particular sending country.
ECONOMIC OUTCOMES OF THE SECOND GENERATION, BY FATHER'S COUNTRY OF ORIGIN

How can we account for the advantages of second-generation immigrants? One possible interpretation is that the children of immigrants benefited from higher “ethnic capital” than the children of natives (Borjas Reference Borjas1992). According to the “ethnic capital” hypothesis, the human capital of a child is influenced not only by the human capital of her own parents, but also by the average human capital of the ethnic group to which the child belongs. As immigrants had on average higher human capital than natives, their children might have been able to take advantage of the higher human capital within their ethnic network. In Table B.4 in the Online Appendix, I formally test this possibility by re-estimating equation (2) including the average literacy rate of a child's father's country of birth, as measured among immigrants from that country in Argentina in 1869—as an additional variable. The table shows that, conditional on father's background characteristics, there is a positive association between the average literacy of the ethnic group in the father's generation and literacy rates and occupational earnings of the second-generation. Note that this evidence should be interpreted as only suggestive because of the well-known “reflection problem” (Manski Reference Manski1993) in measuring social interactions.
CONCLUSIONS
I provided evidence on the mobility and economic outcomes of European immigrants and their children in nineteenth-century Argentina. To do so, I constructed longitudinal data linking males across the two national censuses of population of the period and passenger ship lists of immigrant arrivals to the city of Buenos Aires.
I first looked at the labor market assimilation of first-generation immigrants. I found that immigrants exhibited faster occupational upgrading than natives. This finding does not seem to be driven by immigrants from any particular origin. Rather, I documented that immigrants from most of the main European sending countries outpaced natives in terms of occupational upgrading. Immigrants also appear to have in many cases upgraded their pre-migration occupations: Most of those entering the country as unskilled workers upgraded their occupation after a relatively short period of time. A comparison with similarly constructed U.S. data suggests that European immigrants in Argentina experienced relatively higher rates of upward occupational mobility.
Focusing on second-generation immigrants, I documented that the sons of European immigrants from every major sending country outperformed the sons of natives along a number of important economic outcomes. In addition, the majority of the sons of unskilled immigrant workers were able to upgrade their occupations, in many cases to white-collar jobs.
Overall, my findings give further support to an optimistic view of the economic performance of European immigrants in nineteenth-century Argentina. Furthermore, I showed that this optimism also largely extends to the second generation. These findings provide an economic rationale of why some Europeans chose to migrate to Argentina instead of to the United States. While real wages were likely lower in Argentina (Williamson Reference Williamson1995), the prospects for upward economic mobility might have been better.
In comparing the experiences of Italians in Argentina and in the United States, Herbert S. Klein (Reference Klein1983) argues that “The sharp differences in the Italian immigrant experience within Argentina and the United States were fully perceived by both the immigrants themselves and virtually all contemporary observers.” But why did these differences exist? My article cannot offer a definite answer to this question. One plausible interpretation points to differences in the social structure of the two countries at the onset of Mass Migration. When the Age of Mass Migration started, Argentina had a relatively small population and no significant skilled working class. In contrast, the United States featured a larger and more skilled workforce (Baily Reference Baily1983). Hence, immigrants moving to Argentina were in a better position to become a dominant force of the economy than those going to the United States.


