Argentina has been characterised as a «food rich» export economy which, after 1930, entered a period of industrialisation that brought about profound social, political and cultural changes. A country that generated rapid economic progress between 1880 and 1914, started to diverge in growth and economic potential from the developed North Atlantic economies after 1950. By the 1970s Argentina had become a country of profound economic inequalities, intense social and political conflict and recurrent political and economic crises. Despite its specialisation in the production of food for export, Argentina remained a middle-income country with unresolved problems of poverty, social exclusion and moderate malnutrition until 2000. Scholars have dealt with various dimensions of this «Argentine riddle» contributing various explanations about changes in institutions, economic ideologies and the influence of domestic forces and external shocks. Yet few have considered the issue of food security and nutrition inequality as crucial components of the country's welfare. This paper attempts to contribute to the debate on economic growth and inequality in Argentina, focusing on long-run net nutrition inequality.
We contribute new findings about net nutrition inequality and place these findings in relation to an old debate in Argentine economic history: the welfare consequences of shift in the growth regime that occurred around the 1930s. Between 1870 and 1929, the Argentine economy experienced export-led growth; while after the great crisis 1930–32, there ensued a period of industrialisation via import substitution that lasted at least until the mid-1970s. A more open economy, energised by the forces of foreign investment, frontier expansion and immigration flows, was then followed by a period characterised by a more closed economy, producing industrial goods for the domestic market. The two growth regimes (export-led growth and import-substituting industrialisation) supposedly led to two different outcomes in terms of income distributionFootnote 1.
While export-led growth generated much social and economic inequality, industrialisation after 1930 is supposed to have produced a more egalitarian income distribution. Williamson (Reference Williamson1999, Reference Williamson2002) found that the period of export-led growth and globalisation increased income inequality, as measured by the fall of the wage/rental index and of the wage/pc.GDP ratio. Bértola reached the same conclusion, estimating Gini indices for the Southern Cone; inequality rose significantly between 1870 and 1920, especially in Argentina (Bertola et al. Reference Bértola, Castelnovo, Rodriguez and Willebald2010). Based on estimates of Gini coefficients for four different social groups, Astorga (Reference Astorga2015) concluded that there was no clear trend in the period 1900–1930 regarding the functional distribution of incomeFootnote 2. Estimates of income concentration based on tax statistics show increasing income inequality after the early 1930s. Between 1932 and 1942, the earnings of the top 1 per cent increased rapidly, while between 1943 and 1953 there followed a period of declining income inequality (Alvaredo et al. Reference Alvaredo, Cruces and Gasparini2018). Following the pioneer work of anthropometric historians, I attempt to use reliable measures of «biological welfare» to evaluate food security and nutrition inequality during this periodFootnote 3.
How did the transition between two regimes of economic growth translate into the biological well-being of Argentines? Did nutrition and health conditions become more unequal during the period of export-led growth? Did the opposite occur during the period of import-substituting industrialisation? Income inequality represented by Gini coefficients does not translate easily into health and nutrition conditions in early infancy (Deaton Reference Deaton2008). Factors such as the nature of the economy, the proximity and relative price of food, transportation infrastructure, public health policies and dietary habits mediate the relation between income inequality and the inter-personal and regional distribution of nutrients and health. The anthropometric literature has recently developed a great interest in the question of inequality; yet, to my knowledge, questions of uneven regional development and the change of strategy from export-led growth to import-substitution industrialisation have not received enough attention in these studiesFootnote 4.
In this paper, I contribute some evidence and present some conjectures to understand the evolution of Argentina's biological inequality in the long run. While the statistical evidence is quite solid, the explanations offered should be taken as mere conjectures subject to critical examination and further research. To this extent, this is a preliminary inquiry that compiles evidence from different databases. To measure the evolution of inequality in net nutrition, I estimate two indicators: (a) the coefficient of variation (CV) of heights and (b) the difference between the top 20 per cent and the bottom 20 per cent of the height distribution. This new evidence presents interesting findings that cast some doubt on our certainties about the social and welfare implications of both export-led growth and import-substituting industrialisation.
To perform these estimates, I use the statures of soldiers and prisoners taken from previous studies (Salvatore Reference Salvatore2004, 2019), as well as new estimates for recruits by Argentine regions for the period 1916–1951 and for recruit-citizens for the period 1875–1910 in both Pampa and Interior. Estimates indicate that both the period of export-led growth (1875–1930) and the period characterised by import-substituting industrialisation (1930–1950) generated improvements in average heights. Yet, while the former period tended to reduce or maintain nutritional inequality, the process of industrialisation brought about an unprecedented rise in inequality. This is an important finding that may stimulate further discussions about the changes in growth regimes in other countries of Latin America.
During the first globalisation (1870–1913) J. G. Williamson (Reference Williamson2002) found a reduction of the wage dispersal between countries, and a rise in income inequality among resource-rich, labour-scarce countries, such as Argentina. How did Argentina manage to maintain the level of net nutrition inequality while income-distribution was worsening? From the late 1920s to the late 1930s, when quotas were imposed in immigrating countries, capital markets collapsed and trade barriers rose, there was greater wage dispersion between countries, but the connection between income inequality and the forces of globalisation was broken. «Inequality rose more sharply in poorer countries than in richer countries» (Williamson Reference Williamson1997, p. 130). In Argentina, the wage-rent ratio, which had fallen dramatically between 1880 and 1914, remained rather stable between 1915 and 1939 (Williamson Reference Williamson2002; Table 3, p. 73). How, then, was it possible for net nutrition inequality to increase?
At the end of the essay, I provide some reasonable conjectures that attempt to account for these changes in net nutrition inequality and its regional differences, following the argument pioneered by Jeffrey Williamson (Reference Williamson1985). In his attempt to explain why income inequality worsened during the industrial revolution in Great Britain, Williamson suggested that the chief factor for this outcome was the uneven increase in productivity which resulted in a widening of wage differentials. I call this the «Williamson intuition» and use it to attempt to explain the evolution of biological well-being in Argentina for the period 1875–1950Footnote 5. Where there was industrial growth and urbanisation, we should expect a greater dispersal of earnings and, in the absence of countervailing forces, greater inequality of health-nutrition conditions in early infancy. By contrast, the relative backwardness of peripheral regions would be accompanied by lower levels of inequality or stability in the distribution of income and nutrients.
We define nutritional inequality as the differences in the stature of young males; this, in turn, may reflect differences in access to nutrients, medical treatment, sanitation and work effort during infancy and adolescence. Mean stature at adult age measures, however imperfectly, the aggression to children's bodies produced by poor nutrition, the disease environment, poverty and infant labour. The height distribution of a nation and its component regions changes over time due to various factors, among them: changes in food availability and proximity, changes in the wage structure, internal migrations, the agglomeration of population in urban centres, sanitary policies and other determinants. This paper presents evidence about long-run changes in net nutrition inequality and some conjectures about these findings, but it is not concerned with testing the determinants of this evolution. Though preliminary, this essay contributes towards our understanding of Argentina's net nutrition inequality in the long term, including the dating of important internal regional divergences.
THE INDICATORS USED
The use of the CV of heights to examine changes in the evolution of net nutrition inequality is by now common practice in anthropometric historyFootnote 6. To the extent that samples are homogeneous, its use is preferable to the standard deviation (SD). We know that sample CVs tend to be smaller than population CVs, yet for large samples the difference tends to be small.
CV measurements are sensitive to changes in the distribution of nutrients and health over time. In fact, to the extent that health is a public good, height CVs tend to be more precise and inclusive than income Gini indicators (Baltzer and Baten Reference Baltzer and Baten2008, p. 194). The CV is defined as the SD standardised by the mean. An increase in the value of the height CV should be interpreted as a rise in average inter-personal inequality; that is, as an increase in the personal distribution of nutrients and health. In our case, the height CV for recruits and prisoners falls within the range 3.3 to 3.8 per cent of mean heightsFootnote 7.
Other measurements, such as the stature of the lower and upper deciles, could also be used to evaluate changes in nutritional inequality. In the second section of the essay, we present estimates of the difference in stature between the top 20 per cent and the bottom 20 per cent of each distribution. We claim that this indicator can adequately represent the changes in net nutrition inequality. In the long run we expect this indicator to behave in a similar way to height CVs.
TWO LONG-TERM SAMPLES
To examine the long-term evolution of height inequality, we use information from two large samples: one includes recruits of the «Patricios Battalion» in the city of Buenos Aires, born between 1901 and 1943; the other includes inmates of Buenos Aires provincial prisons, born between 1885 and 1959Footnote 8. We complement this with estimates drawn from two other samples. One of them stems from the national electoral registration of 1927; these data reflect the biological welfare of recruits in both the Pampa region and in the interior provinces for the period 1875–1910. A second estimate comes from a large sample of recruits from different Argentine regions north of the Colorado River (without Patagonia), for the period 1916–1951. Recruits and prisoners are all native-born Argentines, regardless of whether their parents are native-born or immigrants.
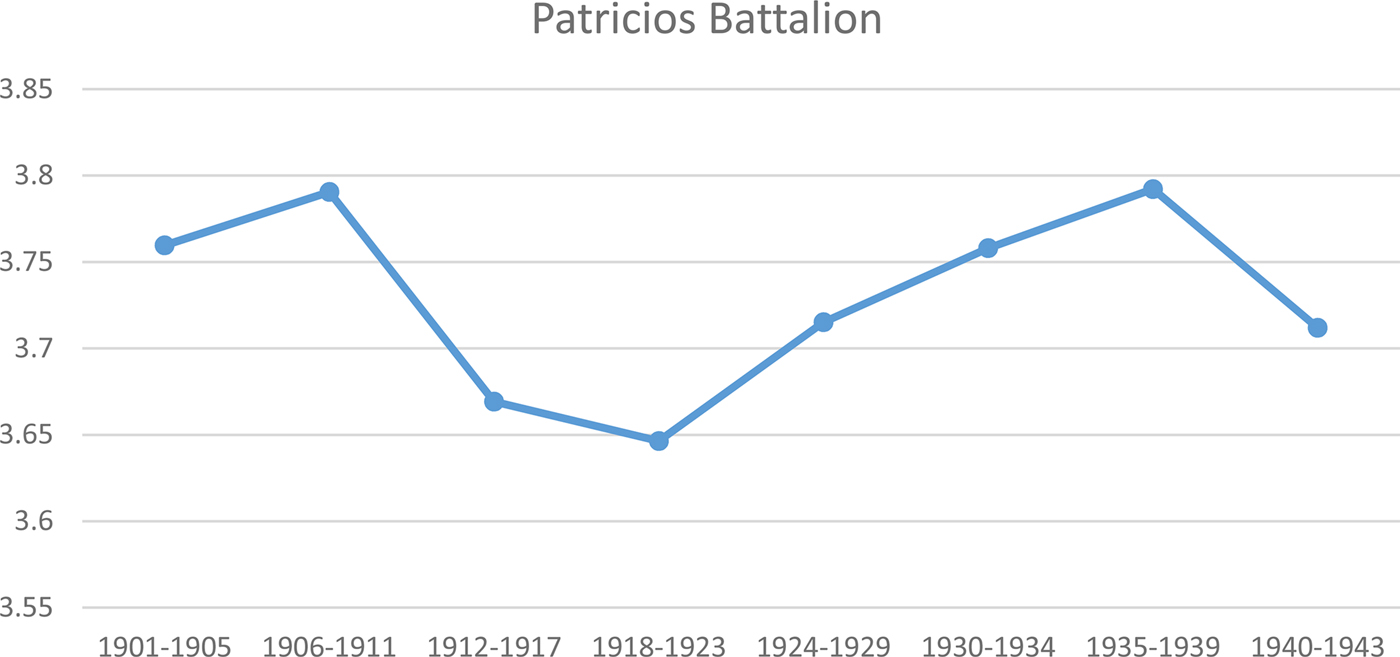
The «Patricios Battalion» sample includes 18-year-old recruits, who reached age 3 between 1904 and 1946. These were young men born all over the country who, at the time of their compulsory registration, were residing in the surroundings of the city of Buenos Aires (see Appendix A). According to this evidence, during the first decade of the 20th century, nutrition inequality rose. Between 1906–11 and 1918–23, nutritional inequality fell, rising again between 1924–24 and 1935–40. By the latter period, the height CV was at the same level as in 1906–11. In the following period (1940–43) there was a short-term decline in inequality.
As we can see in Figure 1, the decline in inequality coincided with the second phase of export-led growth. According to this evidence, the years from 1912 to 1923 were the most egalitarian years in the whole period 1901–1943. By contrast, the late 1930s appear as the most unequal period in this sample. At this peak, nutritional inequality similar to that of 1906–1911, years of nutrition stress for the export economy (Salvatore Reference Salvatore2004).
COEFFICIENT OF VARIATION OF MEAN HEIGHTS. RECRUITS FROM PATRICIOS BATTALION. CV × 100.
Do the data of this sample represent the situation of the whole country? Not exactly. The «Patricios Battalion» sample includes recruits from all provinces: 60 per cent of them come from the interior provinces, 30 per cent from the Pampa region and less than 10 per cent were born in the capital city and its surroundings. Though internal migrants constituted a majority within this sample, we cannot claim that this sample proportionally represents the whole nation. The city of Buenos Aires and the Pampa region are under-represented, while the interior provinces are over-representedFootnote 9. In addition, it is to be expected that children whose parents had migrated to the city of Buenos Aires would have encountered better conditions in terms of health, sanitation and food prices, and consequently, would have been taller than children born and raised in the interior provinces. Yet, the large size of the sample and its consistent sampling method over time makes it a reliable source.
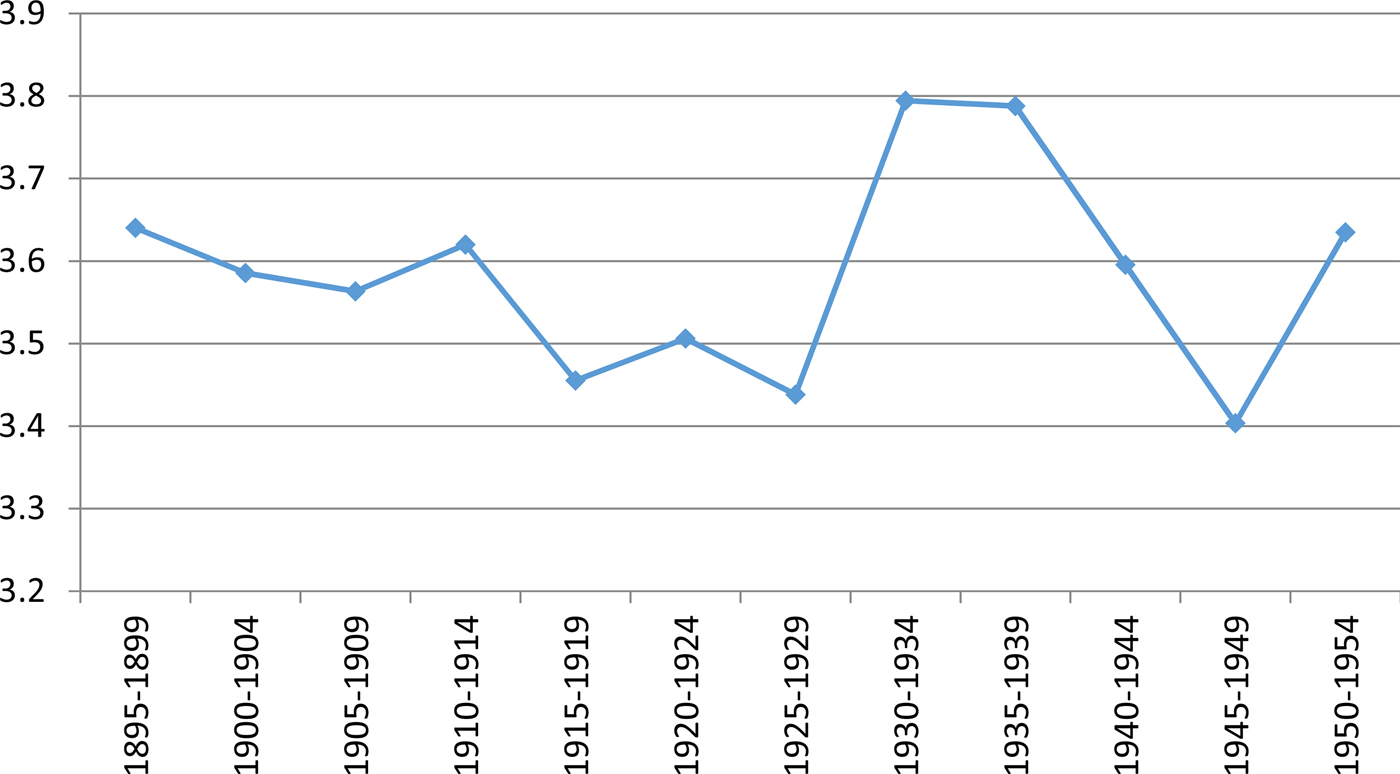
The second sample refers to inmates of the prisons of the Buenos Aires province. These are individuals aged 21 to 55, the vast majority of whom belonged to the working classes. Having reached adult height, these individuals were taller than 18-year-old recruits. Many of them had been born in the province of Buenos Aires (see Appendix A). Figure 2 shows that there was a long-term decline in inequality between the late 1890s and 1925–1929Footnote 10. This was followed by a period of increasing net nutrition inequality in the 1930s, and, in the following decade, inequality fell significantly. In the early 1950s, the CV of heights increased again. In the long term, comparing the 1950s with the 1890s, inequality seems to have remained stable. In this sample we observe a trend similar to that shown by the recruits of the «Patricios Battalion»: declining net nutrition inequality during some phases of the period of export-led growth and rising net nutrition inequality during the first two decades of the period of import-substituting industrialisation. They also show some differences: the recruit data indicate that the increase of inequality started in the mid-1920s, while the data for prisoners show that nutrition inequality rose between the late 1920s and the early 1930s. For the observations of the 1940s both series provide the same result: a decline in nutrition inequality.
CV, HEIGHTS OF PRISONERS FROM BUENOS AIRES PROVINCE. CV × 100.
How representative is this sample of prisoners? As noted above, we computed averages and CVs for prisoners who had reached their adult height (aged 21 and over) and, for this reason, prisoners were always taller on average than recruits (by around 0.8 cm)Footnote 11. In addition, most were born in Buenos Aires province, the city of Buenos Aires, or the rest of the Pampa regionFootnote 12; very few (6 per cent) came from the interior provinces. Being at least 21 years old and having been born in towns or cities in the Pampa region meant that they were taller than what would be expected of Argentina's total prison population. The condition of being workers serving penal sentences may indicate that they had endured worse early childhood conditions than the sons of the middle sectors of Argentine societyFootnote 13. Prison data are perhaps not the most representative of the biological conditions of the whole nation, yet they do provide some information regarding the biological conditions of the working poor (Salvatore, Reference Salvatore2019).
These results differ from the traditional interpretation of Argentine economic history. This interpretation affirms that, due to a greater concentration in the property of resources (land, in particular), the period of export-led growth generated increasing income inequality and, supposedly, higher poverty rates. If this was so, nutritional inequality should have increased. Conversely, it is believed that, during the process of industrialisation, there was a significant expansion of employment and real wages, and to that extent, one might expect a reduction of poverty and declining inequality in nutrition and health conditions. Nutritional inequality behaved contrary to the expectations of traditional economic historians. Inequality tended to decline during the period of export-led growth and tended to increase during the early phase of import-substituting industrialisationFootnote 14.
THE EXPORT ECONOMY 1875–1910, PAMPA AND INTERIOR
A third source of data on heights comes from the Electoral Registration of 1927. We present here new results that include data from the Pampa region, as well as data from the country's interior provincesFootnote 15. The Pampa region sample includes data for recruits born between 1875 and 1910 in twenty-one rural districts from Buenos Aires, Santa Fe, Entre Ríos and southern Córdoba (N = 12,859). All selected districts were dedicated to farming and livestock-raising. Not only are these recruits chiefly from rural origins, but for those born in the 1880s and 1890s, it is clear that their parents settled on lands recently taken from the Indians. For comparative purposes, we added a sample of 18-year-old recruits born in 1916 (Salvatore Reference Salvatore2010).
Table 1 presents the relevant descriptive statistics. According to this, the crude mean height increased by 1.4 cm between 1874–75 and 1904–05, then decreased until 1909–10 (−0.9 cm), before increasing once again by 0.7 cm until 1916. Thus, average stature grew 1.2 cm during the period 1875–1916, a non-trivial improvement in biological well-being. The early 1890s and then the years 1906–1912 were particularly difficult for children living in rural districts of the Pampa region.
CITIZENS’ HEIGHTS. NATIONAL ELECTORAL REGISTER (PAMPA REGION 1874–19161)

1 Includes twenty-one rural partidos of Buenos Aires province.
Source: Salvatore (Reference Salvatore2010).
According to this evidence, for the early phase of export-led growth (1875–1905), we must reject the hypothesis of a deterioration of biological well-being in the Pampa region—at least in the rural districts. What happened with nutritional inequality? Figure 3 shows the evolution of the height CV of those listed in the electoral-military registry. According to these estimates, nutritional inequality declined in the first decade (1875–1885), rose in the following decade (1885–1895), yet afterwards it decreased continuously until the 1916 cohort. Had the crisis of 1890–93 not occurred, the fall in nutrition inequality would have been continuous from 1874 to 1816. This evidence clearly indicates a reduction of inequality during the period of export-led growth. This decline in net nutrition inequality took place during the cereal boom (1895–1905) as well in the following decadeFootnote 16.
CV OF HEIGHTS, PAMPA REGION 1874–1916. CV × 100.
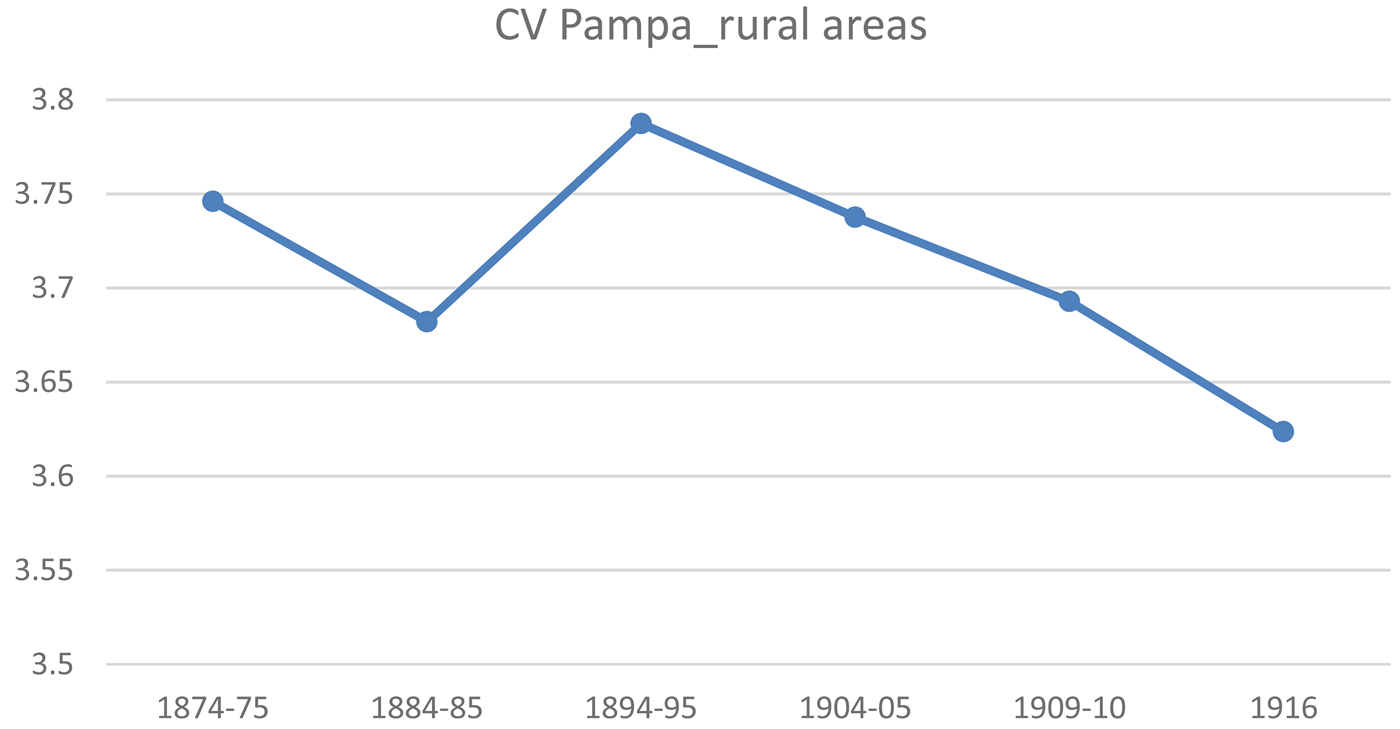
Economic historians have speculated that the period 1880–1914 generated increased concentration of income and hence, greater inequality in income and wealth. They have argued that the rapid and sustained economic growth, based on the expansion of the agrarian frontier, the investment of foreign capital, and the rapid construction of a railway network produced greater inequality in the economy and the society of the Pampas. Based on this new estimation of height CVs for rural districts we can now affirm that during the period 1875–1910, not only did the average stature of males (farmers and their peons) increase, but also that nutritional inequality tended to decline. This fall in inequality is consistent with the trends in inequality estimated using data for prisoners of the Buenos Aires province and recruits of the «Patricios Battalion».
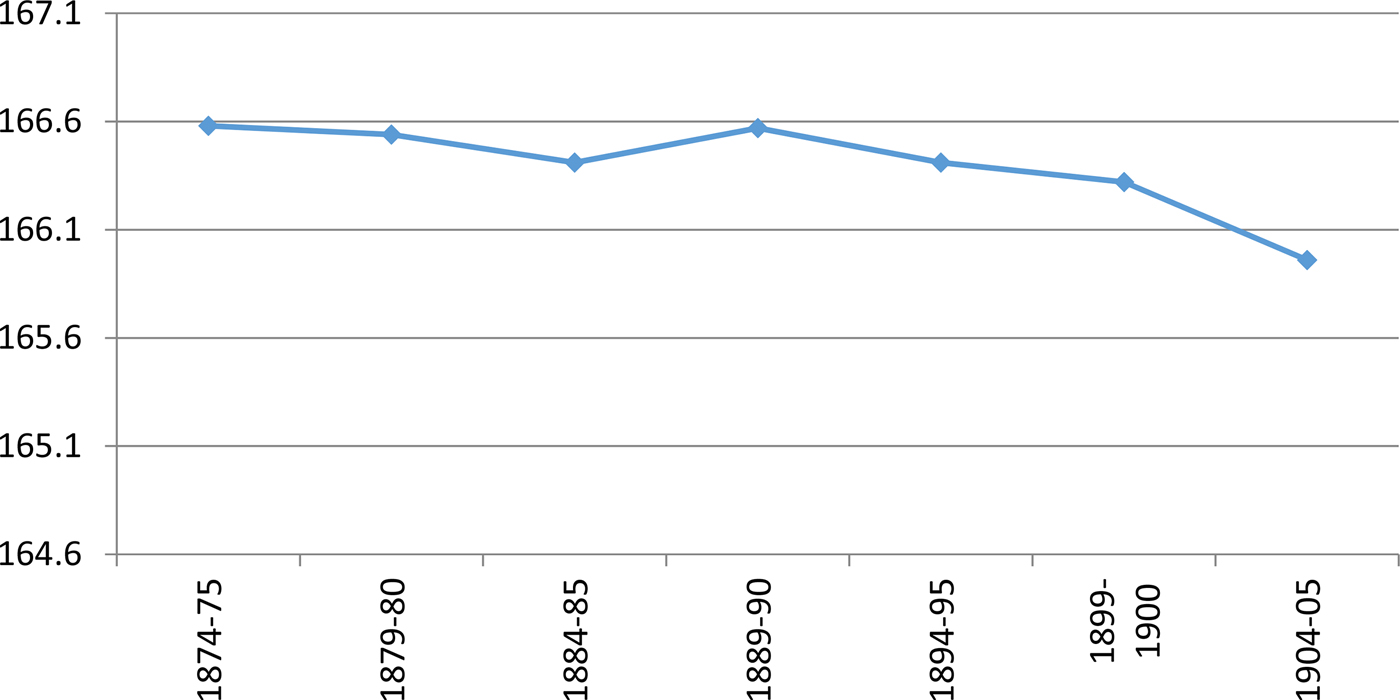
What happened in the rest of the country? Estimates produced by Linda Twrdek (Reference Twrdek2010) show that average stature in the interior provinces showed stagnation from 1874–75 to 1889–90. Average stature then fell in the interior until 1904–05. While not a large decrease (0.6 cm), this fall in heights contrasts with the rise in average stature observed in the Pampa region during the same period (0.7 cm) (Salvatore Reference Salvatore2010) (Figure 4, Table 2).
EVOLUTION OF MEAN HEIGHTS IN THE INTERIOR PROVINCES (MEAN STATURE IN CM).
DESCRIPTIVE STATISTICS (INTERIOR PROVINCES1)

1 The sample includes the provinces of Catamarca, Corrientes, Chaco, Salta, Jujuy, Mendoza and San Juan.
Source: Computed with data from Twrdek (Reference Twrdek2010).
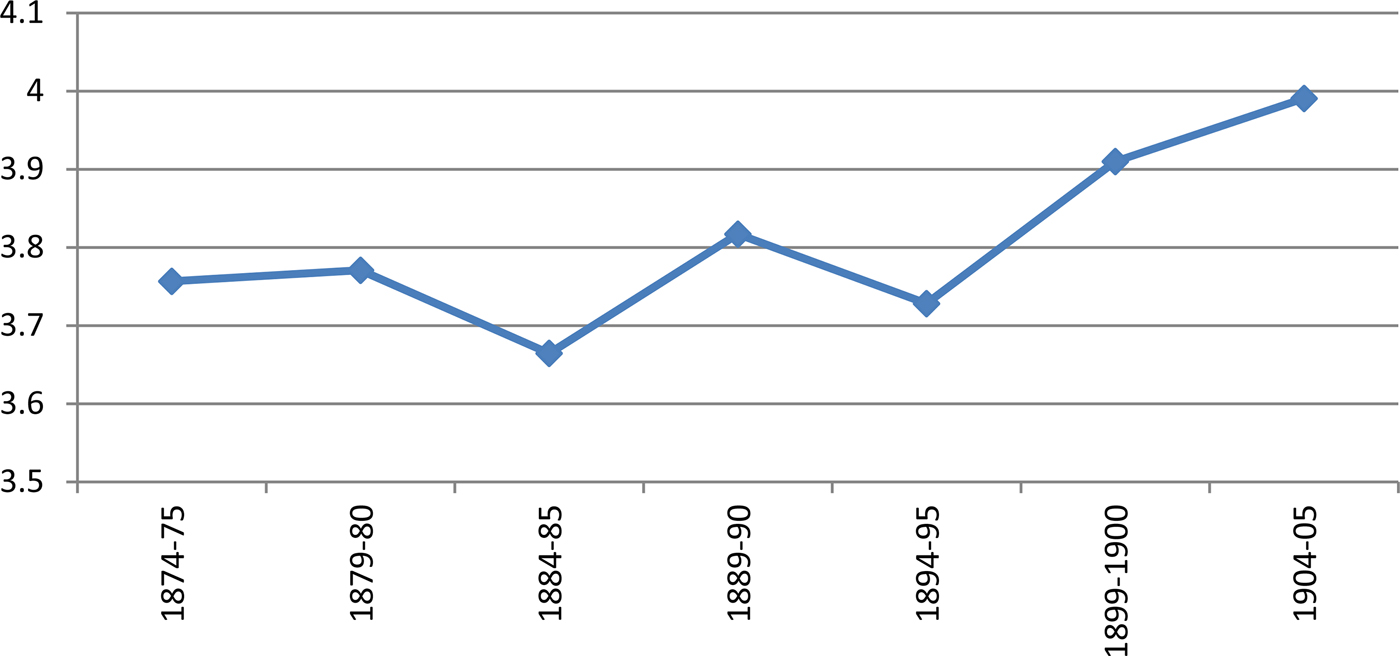
Contrary to what happened in the Pampa region (rural districts), nutritional inequality in the interior provinces increased. There was a period between 1875 and 1895 when inequality remained relatively stable, with a fall in 1885 and a recovery in 1890. After 1895, as export-growth resumed, inequality increased. Hence, during the most expansive decade in the exports of the Pampa region (1895–1905), nutrition inequality rose in the interior provinces (Fig. 5).
EVOLUTION OF THE CV OF STATURE IN THE INTERIOR PROVINCES. CV × 100.
These results are important. They show that, starting in mid-1890s, the agrarian export economy produced an improvement in biological well-being in the Pampa region and a deterioration of well-being in the interior provinces. This divergent evolution of mean heights was also reflected in the value of CVs; nutritional inequality tended to decrease in the Pampa region and to increase in the interior provinces. In short, the nutrition and health impact of export-led growth was different according to recruit's birth place—whether in the Pampa or in the interior. The impact was positive in the most productive and wealthy region, the Pampa, a region close to the ports and also to the nutrients (grain and beef). The impact was negative in provinces to the north and west, areas less favoured in natural resources and human capital, and situated at a greater distance from the littoral cities and ports.
INTRA-REGIONAL NUTRITIONAL INEQUALITY, 1916–1951
For the birth cohorts of 1916–1951 we have data for the heights of recruits born and raised in the provinces, which we gathered into five great regions. To these regional samples, we have added estimates of heights taken from two large urban areas: the city of Buenos Aires and its surrounding industrial cities, the so-called Conurbano. In Table 3 we present the estimated CVs, together with the rest of the descriptive statistics.
DESCRIPTIVE STATISTICS BY REGION (RECRUITS 1916; 1951)

Source: Database «Recruits by Region 1916–1951». Microfilmed archive.
Argentine Army; División Nacional de Reclutamiento.
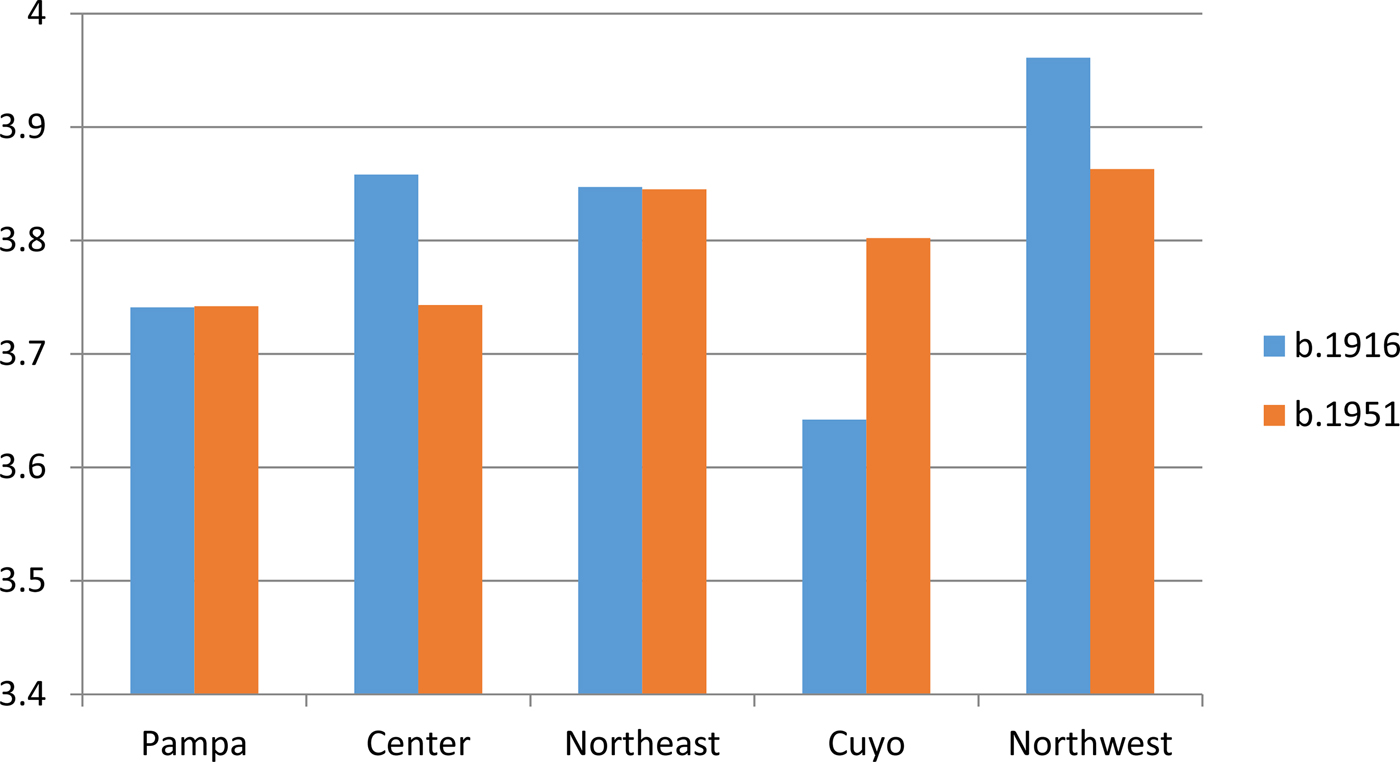
As we can see in Figure 6, if we compare the extremes of this long period, 1916–1951, the Pampa region maintained the same level of nutritional inequality; the same happened with the Northeast region. In the Northwest and Centre regions (where most of provincial migrants to the Buenos Aires Conurbano came from), nutrition inequality declined; while in the Cuyo region, inequality increased. If we estimate height CVs for the whole country, considering only these five regions (Patagonia is missing), we could conclude that, during the period 1916–1951, nutritional inequality showed a small decline.
EVOLUTION OF THE CV OF HEIGHTS BY GREAT REGIONS. CV × 100.

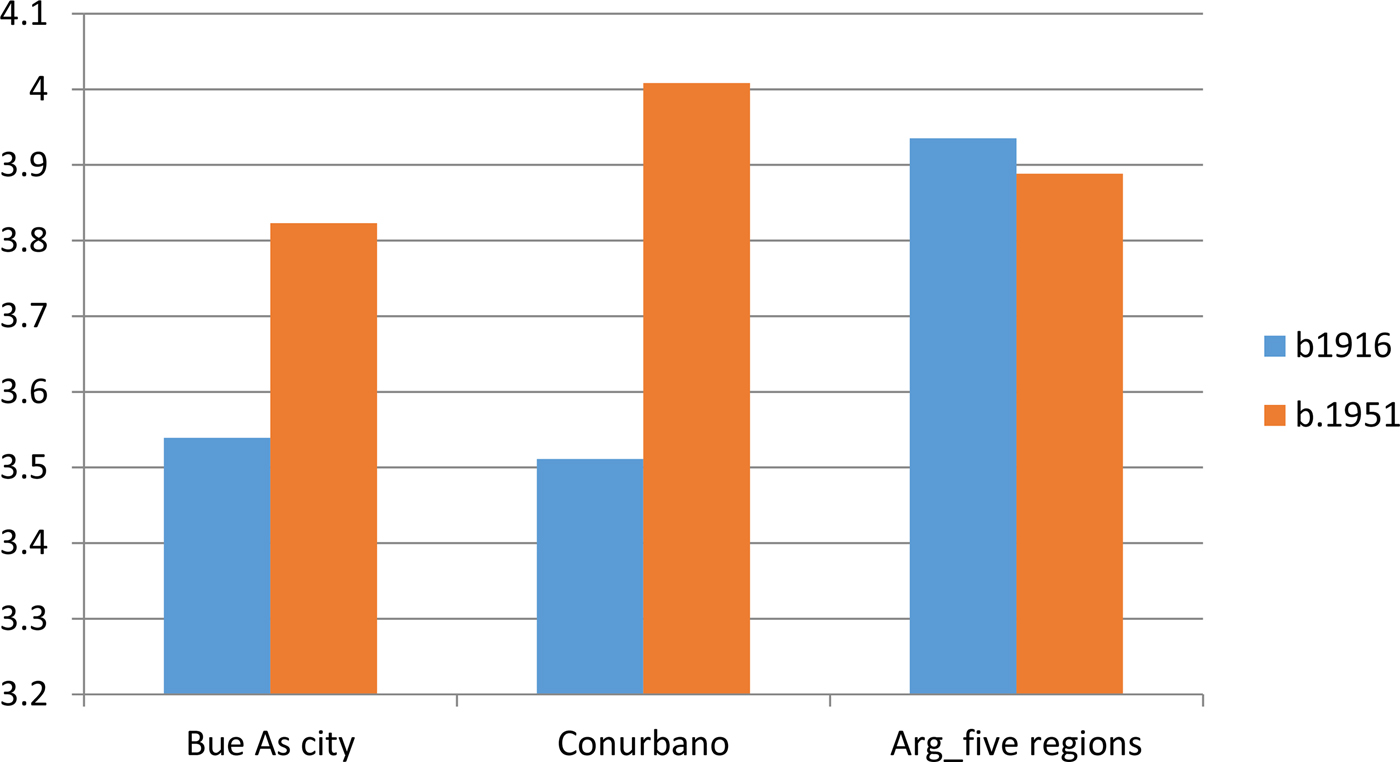
A much greater increase in inequality took place in the great urban centres of the country, which acted as poles of attraction for migrant workers from the interior provinces. The available evidence for both the city of Buenos Aires and the Buenos Aires Conurbano shows that in these places, nutritional inequality increased considerably. The rise in inequality in these urban centres was so great that it over-compensated for the reduction of inequality in other regions (Centre and Northwest). Our presumption is that in large urban areas, the diversification of industrial and service activities increased the range of wages in different branches of activity and occupational categories.
By 1951 the industrial Conurbano was undoubtedly the region with greatest nutritional inequality. If, as social historians contend, this was the «paradise of the working-class», this was clearly a very unequal «paradise» in terms of nutrition and health. The city of Buenos Aires still showed lower inequality than the five regions, yet the differences were not as great as in the 1916 cohort. The Interior (Northwest, Cuyo, Centre and Northeast) was still more unequal in nutrition and health conditions than the Pampa region. Contrasted with the cohort of 1916, the country seemed less unequal, except for the great two urban concentrations: the city of Buenos Aires and its industrial belt (Fig. 7).
CV OF HEIGHTS IN LARGE URBAN CENTRES. CV × 100.
As a result of an uneven process of development between agrarian regions and urban-industrial centres, the regional structure of net nutrition inequality changed significantly between the First World War and the end of the first Peronist administration. While for the 1916 cohort, the regions of greatest nutritional inequality were the Northwest, the Centre and the Northeast, for the 1951 cohort the most unequal regions were the Conurbano, the Northwest region and the city of Buenos AiresFootnote 17. As we can see, the combined effect of industrialisation and urbanisation brought about great changes in the regional distribution of nutritional inequality (Table 4).
SOME CONJECTURES
Based on these estimates—which we consider quite solid—we offer here some conjectural explanations about the factors or processes which may have produced these results. The following are mere working hypotheses for future elaboration into models of behaviour and institutions that could eventually lead to econometric testing.
The intuitive explanation of these results—which we borrowed from Williamson—is quite simple. The city of Buenos Aires and its surrounding industrial belt offered interior migrants employment at higher wages in a growing variety of occupational categories. The diversification of the industrial and service sectors increased wage differentials between activities and skill levels. This expanded the gap between households with food security and those with malnourished children. It is also possible that the first phase of industrialisation generated a dual-labour market situation, creating a variety of informal jobs in great urban centres. By contrast, in the economies of the interior, where there was no such diversification of economic activities and occupations, the structure of remunerations remained fairly stableFootnote 18.
In addition, we know that the rapid population increase in the Conurbano was not accompanied by the expansion of public health infrastructures with migrants settling in areas that lacked basic sanitary services (sewerage and potable water in particular). This might have contributed to the increased differentiation in the biological well-being between wage-earners in the Conurbano (lower) and those in the city of Buenos Aires (higher). Meanwhile, the provinces of the interior, with lower rates of economic growth and fewer employment opportunities, had medical and sanitary services subsidised or financed by the central government (particularly, in the 1930s and 1940s) as compensation. This was an equalising force that must be measured against the increasing disparity of income between the interior provinces and the capital city and its industrial belt.
If Buenos Aires and its industrial Conurbano were the «centre» and the regions of Centre and Northwest were the «periphery», it is clear that nutritional inequality increased significantly in the centre and decreased in the periphery. During the interwar period this had much to do with the dynamic of internal migrations that resulted from import-substitution industrialisation. A sharp increase in the relative price of manufactures over those of agricultural goods shifted capital towards industry, which was located at the centre. Hence, the industrialised and highly urbanised centre attracted the poorest population from the periphery, populations with serious deficiencies in nutrition and health. In the centre these migrants found an ample range of occupations with distinct remuneration, according to industrial branch, education, skills and work experience. If this was so, we can speculate that the growing structure of remunerations caused by the combined forces of urbanisation and industrialisation, in the context of interior–littoral migrations, were the chief forces behind the changes in nutritional inequality by regions during the period 1919–1954Footnote 19.
DIFFERENCE BETWEEN THE TOP 20 AND THE BOTTOM 20
To confirm the validity of these estimations of nutritional inequality, we resorted to a second indicator: the difference in stature between the tallest 20 per cent and the shortest 20 per cent of each sample. This is an approximate indicator of the evolution of net nutrition inequality that uses different information from the same height distributionsFootnote 20. These estimates underscore the persistence of net nutrition inequality in the country, and the wide gaps that separated the average stature of the top 20 from the bottom 20.
Regarding the period of the agrarian export economy (1875–1910), the results are conclusive. In the interior of the country there was almost no variation in the difference between top 20 and bottom 20. Between 1874–1880 and 1899–1905 there was a small increase (+0.6 cm) in the indicator, from 17.2 to 17.8 cm. Something similar occurred in the rural districts of the Pampa region; between 1874–75 and 1904–05 there was almost no change (the indicator went from 17.3 to 17.4 cm). Surprisingly, during this period, the absolute gap between the top 20 and the bottom 20 was almost the same in the Pampa and the interior provinces. After that, the gap between the top 20 and the bottom 20 in the Pampa region showed a significant decline, from 17.4 cm in 1904–05 to 16.4 cm in 1916. In other words, when the average stature in the Pampa region stopped increasing, nutritional inequality declined (Tables 5 and 6).
DIFFERENCE IN STATURE; TOP 20; COMPARED WITH BOTTOM 20 (PAMPA REGION 1874–1916)

Source: Computed with data from Table A3 (Appendix).
DIFFERENCE IN STATURE; TOP 20 COMPARED WITH BOTTOM 20 (INTERIOR SAMPLE, 1874–1905)

Source: Computed with data from Twrdek (Reference Twrdek2010).
Data for army recruits from the «Patricios Battalion» show a similar evolution. During the first two decades of export-led growth, there was a slight downward trend in inequality. The top 20 − bottom 20 difference dropped from 16.7 to 16.4 cm between 1901–11 and 1918–29. During the initial phase of import-substituting industrialisation, on the other hand, nutrition inequality seems to have increased significantly. Between 1918–29 and 1930–43 the gap between the top 20 and the bottom 20 increased from 16.4 to 17.5 cm, a difference of more than 1 cm. This evidence confirms that inward-oriented growth—with its accompanying transformations: industrialisation and rapid urbanisation—generated greater inequality in net nutrition than outward-oriented growth (Table 7).
HEIGHT DIFFERENCE BETWEEN TOP 20 AND BOTTOM 20 (RECRUITS OF PATRICIOS BATTALION 1901–1943)

Source: Computed with data from Patricios Battalion database. See Table A1 (Appendix).
The sample of Buenos Aires prisoners also confirms our findings with height CVs. Between 1885–1900 and 1901–1914—the first phase of export-led growth—the top 20 − bottom 20 difference remained completely stagnant (17.2 cm for both points). By contrast, the first phase of import-substituting industrialisation reveals an increase in net nutrition inequality. The change is modest if one compares 1901–1914 with 1930–1959 (the gap increased from 17.2 to 17.6 cm). If we extend the period of export-led growth from the mid-1880s until the year 1925 (when the country exhibited record levels of grain exports), the rise in nutrition inequality increases, clearly due to a more egalitarian phase in the period 1915–1929. Between 1885–1925 and 1930–1959, the top 20 − bottom 20 gap rose from 15.9 to 17.6 cm: a difference of 1.7 cm. Again, our expectations are confirmed; the model of export-led growth had a neutral effect on the distribution of biological well-being, while the associated processes of industrialisation and urbanisation of the 1930s and 1940s resulted in an increase in nutritional inequality (Table 8).
HEIGHT DIFFERENCE BETWEEN TOP 20 AND BOTTOM 20 (PRISONERS FROM BUENOS AIRES PROVINCE 1885–1959)

Source: Computed with data from Prisoners of Buenos Aires Province database. See Table A2 (Appendix).
Concerning the evolution of nutritional inequality between regions during the long interwar period (1916–1951), this estimator generates results which are slightly different from those obtained using CVs. The top 20 − bottom 20 indicator shows a modest increase in inequality for all regions (of the order of 0.2 to 0.3 cm), while the CV estimates indicated a drop in inequality in some districts (Northwest and Centre) and stability in others. Nonetheless, similarly to the results obtained using CVs, the top 20 − bottom 20 indicator also shows that great urban and industrial areas experienced an important increase in nutritional inequality. Between WWI and the end of the Peronist administration, inequality rose by 1.7 cm in the city of Buenos Aires and by 3.6 cm in the industrial Conurbano. By 1951 the Buenos Aires Conurbano was the most unequal area in terms of biological well-being; it was also the region where nutritional inequality grew the most between 1916 and 1951Footnote 21. Meanwhile, the interior provinces showed few changes in nutritional inequality (Table 9).
HEIGHT DIFFERENCES BETWEEN THE TOP 20 AND THE BOTTOM 20 (BY GREAT REGIONS, 1916–1951)

Source: Computed with data from the «Recruits by Region 1916–1951» database. See Table 3.
The results of this second indicator for the five great regions of Argentina and its principal urban centres, summarised in Table 9, reinforce the proposition that the processes of industrialisation and rapid urbanisation did not generate greater equality of incomes and food security. On the contrary, the region with the greatest concentration of industry by 1950—the Buenos Aires Conurbano—was the area with the greatest increase in nutritional and health inequality. This finding displaces our previous focus from Pampa vs. Interior to a larger divergence in nutrition inequality between great urban and industrial centres and the rest of the country.
To understand the differences emerging from the estimates of nutritional inequality using two different indicators (CV and top 20 − bottom 20 indicators), it is necessary to underline that average stature in all great regions of Argentina increased between 1916 and 1951. Even the stature of the most vulnerable population (the bottom 20) increased between 2.1 and 2.7 cm in the five regions examined. This means that the stature of the top 20 increased more than the country's average. Table 10 shows that Argentina's economic growth in the interwar period did not bring a long-term deterioration in the biological well-being of the bottom 20 per cent of the height distributions, populations with the poorest health and nutrition conditions. This generalisation applies both to the second phase of «outward-oriented» growth (1916–1929) and to the first phase of the «inward-oriented» growth (1930–1951).
EVOLUTION OF MEAN HEIGHTS AMONG THE BOTTOM 20 (BY GREAT REGIONS, 1916–1951)
Source: See Table 3.
Yet, perhaps the most notable aspect of the information provided in Table 10 is the poor performance of the bottom 20 in the Buenos Aires Conurbano. There, at the heart of industrialised Argentina, the average heights of the poorest population increased by only 0.7 cm in 35 years, while other regions showed increases of between 2.1 and 2.8 cm. Stature growth of the bottom 20 in the Conurbano during the period 1916–1951 was only a quarter of that experienced by the provinces of the interior. Those migrants who left their provinces in the interior to seek a better standard of living in the Conurbano might have obtained higher wages, but in fact their biological well-being did not improve. Looking at the performance of other regions, one is tempted to argue that their families would have been better off (in terms of nutrition and health) had they stayed in their provinces of origin.
The explanation of this phenomenon seems clear: the Conurbano tended to concentrate the poverty of other provinces. The massive nature of the internal migrations during the period 1930–1960 is well-known (Lattes and Lattes Reference Lattes and Rechini De Lattes1969). Due to lower housing costs and subsidised transportation, internal migrants chose to settle in the various cities of the industrial belt rather than in the capital city. Severe fiscal constraints faced by the partidos of the Conurbano made them unable to provide minimal medical and sanitary services to their residents. Those who migrated to the capital city had much better luck; their biological well-being improved substantially (4.0 cm), more than in any other part of the republic. At the end of our period (the 1951 cohort) the bottom 20 of the city of Buenos Aires was substantially taller on average (1.6 cm taller) than any other poor population in the country, including the Pampa region.
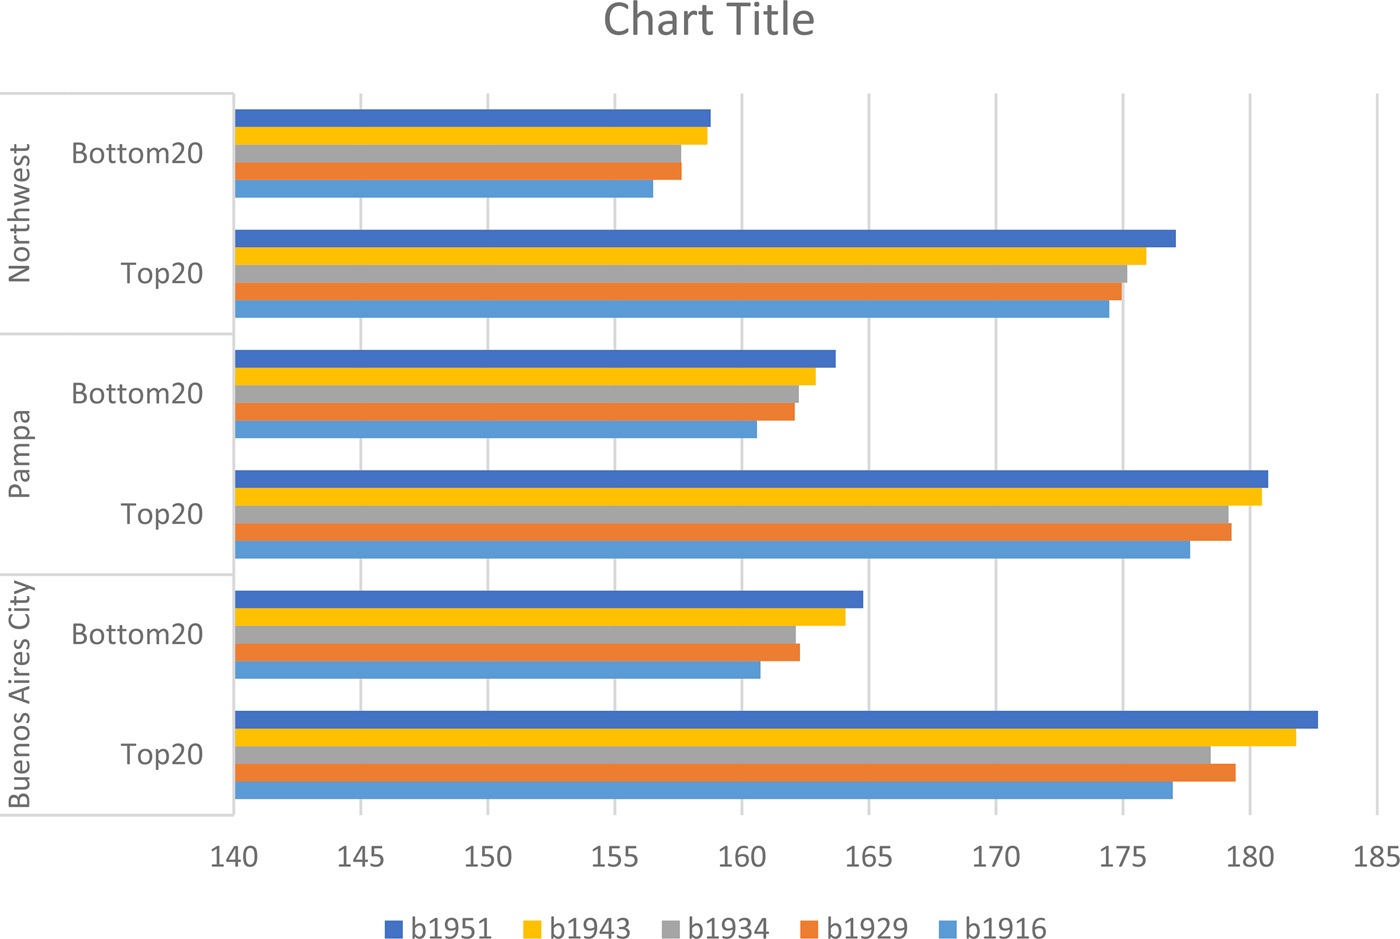
Figure 8 provides a summary view of the evolution of the mean height of the top 20 (tallest) and the bottom 20 per cent (shortest) of the population. Here we considered only those regions for which we have large samples for each of the five time-benchmarks (1916, 1929, 1934, 1943 and 1951): the city of Buenos Aires; the Pampa region and the Northwest. The staircase pattern of each bar makes it apparent that the mean height of the top 20 as well as that of the bottom 20 (except for one exception, Buenos Aires 1934) increased from one benchmark to the next for all regions. Second, the top 20 were taller in the city of Buenos Aires city than in the Pampa region, while the top 20 of the latter region were taller than those of the Northwest. The same situation can be observed with the bottom 20. This leads us to a third observation: the differences in stature continued over time.
MEAN HEIGHT FOR TOP 20 AND BOTTOM 20 (MEAN HEIGHT IN CM).
How did the top 20 − bottom 20 difference evolve over time? Figure 9 allows us to examine this question. For the long interwar period it is clear that nutrition inequality as measured by this height difference increased in the three areas considered. Secondly, the Northwest, perhaps the poorest region of the country, was always the most unequal region in terms of net nutrition, except for the industrial Conurbano (not included in this figure). For various of the benchmark years, the Pampa region was the second in top–bottom inequality; while the city of Buenos Aires was the least unequal of the three (at least until 1934), becoming the second most unequal by 1951. The 1943 cohort presents itself as a reversal of this hierarchy; an anomaly that it is worth exploring for it seems to be the result of the economic, social and political changes of the period 1934–1943, that is, of the combined processes of industrialisation, urban–rural migrations and the new policies of the post-depression years. Third, if we compare the 1934 and the 1951 cohorts, both the poorest of regions (the Northwest) and the richest of cities (Buenos Aires) have substantial increases in nutrition inequality. In the Pampa region, inequality increased at a slower pace, so that by 1951 the city of Buenos Aires had surpassed the Pampa region in nutrition inequality.
TOP 20 − BOTTOM 20 DIFFERENCE. IN BUENOS AIRES CITY, PAMPA AND NORTHWEST (STATURE DIFFERENCE IN CM).
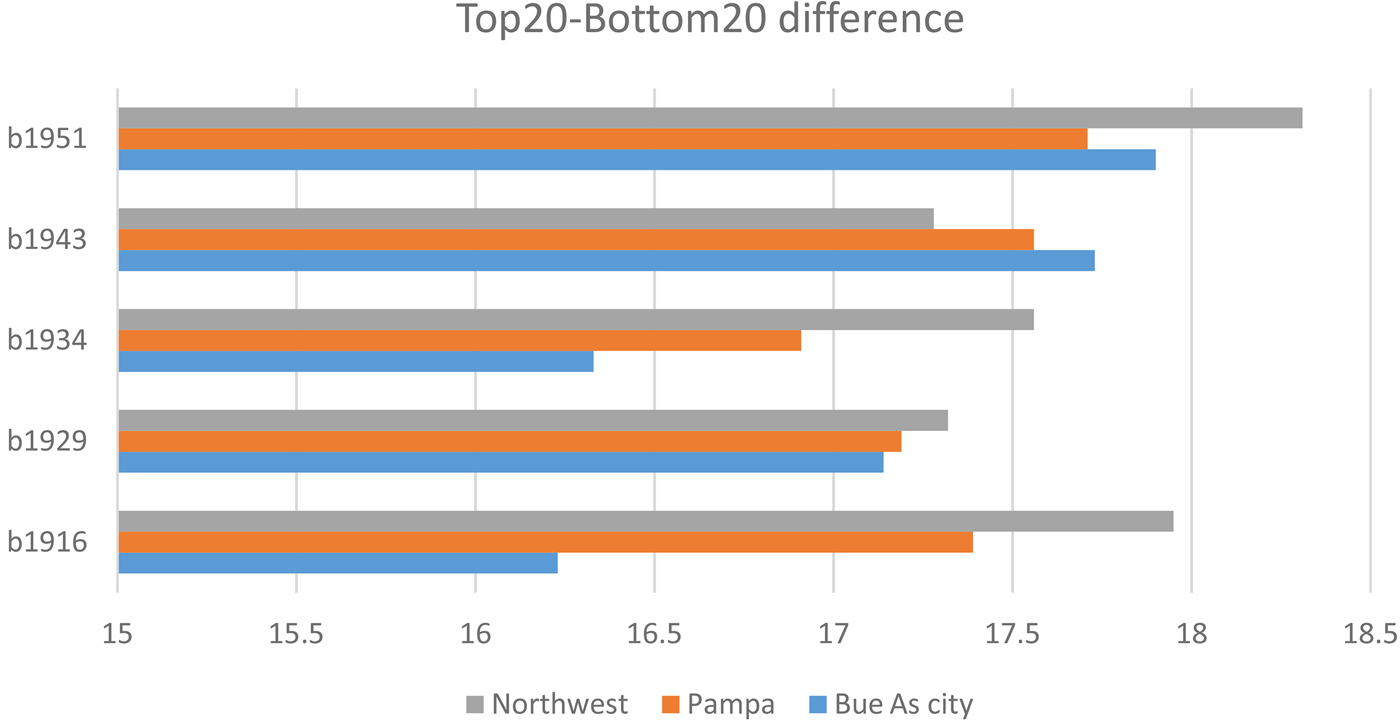
Looking at the first two benchmarks (1916 and 1929), during the after-effects of the export-led era, we find interesting differences. The city of Buenos Aires became more unequal, while both the Northwest and the Pampa (mostly rural districts) became less unequal. After 1934, that is, with the beginning of industrialisation and more rapid urbanisation, all three regions became more unequal; the only exception being the poor Northwest between 1934 and 1943. In principle, one could imagine that during this period, the Northwest expelled its poor to the littoral and the metropolitan area via out-migration. Yet this hypothesis needs to be investigated further.
SUMMARY OF FINDINGS AND CONCLUSION
Using the CV of stature as the main indicator of nutritional inequality, we obtained important and somewhat surprising results. Contrary to traditional interpretations, we found that during the period of export-led growth, nutritional inequality either declined or remained stable. Our sample of recruits shows a moderate reduction of nutritional inequality from the beginning of the 20th century to the mid-1920s, a trend that later reverted towards greater inequality in the 1930s and 1940s. Similarly, the information about prisoners in Buenos Aires province shows a decline in inequality during the whole «Golden Age», from the mid-1880s to the end of the 1920s. From then on, there was a marked increase in nutritional and health inequality which persisted until the 1950s. In other words, agrarian export-led growth produced greater equality in the access to nutrients and health than the process of industrialisation that followed. These results coincide with Williamson's finding for Britain's industrial revolution, in the sense that industrialisation generated greater wage inequality within the industrialising country yet appears contrary to Williamson's finding that the wage-rent ratio fell in the periphery during the export-led era and remained more stable during the post-WWI era. The key question here is whether Williamson's measures of inequality (wage dispersion and wage-rent ratio) are systematically related to the distribution of nutrients. Although one of these measures—wage dispersal—can in principle be related to net nutrition inequality, the other—wage/rental ratios is not. If real wages (w/p) remain constant while land rents are growing, there is no clear reason why net nutrition inequality should rise.
New information on stature for the period 1875–1910 indicates that export-led growth was associated with a decline of net nutrition inequality in the Pampa region and with greater inequality in the interior provinces. Data for the interwar period—also new—generated quite interesting results. Of the five large regions, only one showed increased inequality (Cuyo); in the other regions, inequality either declined (Centre and Northwest) or remained stable (Pampa and Northeast). The whole country (the five regions, not including large urban areas) showed a slight decrease in inequality between 1916 and 1951, as measured by height CVs. A completely different image emerges when we consider the great urban and industrial centres. Nutritional inequality increased substantially in those urban conglomerates, the city of Buenos Aires and its industrial belt (Conurbano), which attracted internal migrants.
The use of top 20 − bottom 20 differences alerted us to the ample differences in stature separating social groups; this indicator ranges from 15.7 to 18.3 cm according to the region and period considered. With a few differences, the evolution of this indictor confirms most of our previous findings using CVs. The top 20 − bottom 20 difference remained almost unchanged during the period of export-led growth and increased during the period of import-substitution industrialisation. The latter result was heavily influenced by the performance of the city of Buenos Aires and the Conurbano (which represented 33.6 of the total population of the country by 1960). The Buenos Aires industrial belt, the area with the largest concentration of industry in the country in the 1950s, also showed the greatest nutritional inequality. It appears then that, in the Argentine case, nutritional inequality accompanied the process of industrialisation.
Measures of net nutrition inequality allow us to entertain some conjectures about two dimensions of Argentine long-run economic growth: (a) the regional dimension, the centre vs. the periphery and (b) the time dimension, represented by the transition from export-led growth to import-substituting industrialisation. The lessons from this evidence are clear: export-led growth was consistent with less inequality in net nutrition; while the first phase of import-substituting industrialisation seems to be associated with greater inequality in nutrition and health conditions during infancy. During the first phase of export-led growth (1880–1930) net nutrition improved in the centre while it declined in the periphery. Later, during industrialisation, the results were mixed among different regions. Yet it seems clear that the great urban areas, which attracted migrants and where industries were established, became areas of greater net nutrition inequality. In other words, industrialisation at the centre bred biological inequality.
We can conclude then that, after 1930, the combined processes of industrialisation, urbanisation and internal migrations were associated with distinct outcomes in the nutritional and health status of the population. These processes seem to have produced increased inequality in the «centre» (Buenos Aires and its industrial belt) and greater equality in the «periphery» (the Centre and Northwest region, where most migrants came from). This appears to confirm Williamson's impression that industrial growth produces inequality of income and wages in the short and medium run (Williamson Reference Williamson1985). Assuming a constant structure of food prices across regions, the widening of the wage gap between occupational categories and industrial branches at the «centre» can generate greater nutritional inequality.
The «Williamson intuition», used to explain the rise of inequality in industrialising Britain, can be used in the Argentine case to understand the forces behind an increase in net nutrition inequality. A more diversified structure of earning in industrialised areas tends to generate greater inequality in the access to nutrients and health, whereas a lower dispersal of earnings in backward areas would produce the opposite result. Economic progress also brings about higher fiscal revenues to the central government and this may translate in infrastructure investments (railroads and roads) that tend to reduce transportation costs. If this is so, the regional dispersal of food prices may fall. Public health policies operate in the same direction. Greater investments in sanitation projects and efforts to eradicate infectious and endemic diseases in peripheral provinces may reduce the net nutrition gap between different social groups. Hence, the combination of public policy effects with income distribution effects could provide a satisfactory explanation to the evolution of net nutrition inequality, as we have observed in Argentina for the period 1916–1950.
For the moment this is all no more than a series of informed conjectures. What we know about internal migrations in Argentina tends to confirm this intuition. At the risk of simplifying a complex process, we can argue that internal migrations contributed to create the situation we find in 1951: great inequality at the centre, and moderate inequality in the periphery. Internal migrations transferred skilled and unskilled workers from the poorest provinces to the Argentine Littoral and particularly to the city of Buenos Aires and its industrial Conurbano. The provinces where migrants came from had a simpler economic structure generating less wage and income dispersal. By contrast, the structure of earnings in the city of Buenos Aires and its industrial belt (the Conurbano) expanded as a result of industrialisation and the expansion of services. This process, the reconfiguration of wage structures in the centre and the periphery during industrialisation, may explain many of the observed differences in net nutritional inequality. By moving from the periphery to the centre, internal migrants validated the observed changes in net nutrition inequality by locating the less skilled-educated in the Conurbano and the more skilled-educated in the city of Buenos Aires.
Yet, we also know that there were two forces operating in the opposite direction (greater net nutrition equality): roads and public sanitation. Starting in the 1930s the central government began to invest in roads that tended to reduce transportation costs and, consequently, to reduce the differences in food prices between provinces and regions. Contemporaneously, the government tried to expand the provision of sanitary and medical services to the interior provinces. This policy, however, encountered important difficulties, as infant mortality rates in the interior provinces failed to converge with those of coastal cities. In addition, sanitary conditions differed greatly in the city of Buenos Aires vis-à-vis those found in the Conurbano. At the «centre» migrants’ children found two different epidemiological environments: a capital city with modern hospitals and important sanitation improvements; and a surrounding industrial belt with great deficiencies in terms of sanitation and hospitals.
It is not easy to identify and separate these distinct effects: the effect of income changes and infrastructure improvements on caloric intake during infancy; and the effect of public policies in health and sanitation on the health of infant children. It seems clear, however, that at the end of the period of export-led growth and during the first stage of import-substituting industrialisation, nutritional inequality in Buenos Aires and its industrial belt had increased substantially, while levels of net nutrition inequality in the rest of the country had maintained or reduced. For the moment, these should remain as reasonable conjunctures rather than complete explanations. In future work, I shall attempt to examine the configuration of interrelated factors that affected Argentine nutritional inequality in the long run in more depth.
ACKNOWLEDGEMENTS
Funds for data gathering and processing were provided by the John Simom Guggenheim Foundation. Various research assistants coordinated by Juan Manuel Truppia gathered the original data. In processing the regional database, I had the assistance of Emiliano Salas Arón, which I much appreciate. I am grateful to those who read and commented earlier versions of this article at the CLADHE meeting of Bogota and at the ALIHS congress at Buenos Aires. I extend my gratitude to the anonymous reviewers who carefully read and commented on this manuscript.
Appendix
DESCRIPTIVE STATISTICS (RECRUITS OF PATRICIOS BATTALION 1901–1943)
DESCRIPTIVE STATISTICS (PRISONERS FROM BUENOS AIRES PROVINCE, 1888–1959)
DESCRIPTIVE STATISTICS (RECRUIT-CITIZENS B.1874–1916. BUENOS AIRES PROVINCE).
ESTIMATES OF TOP-20; BOTTOM-20 DIFFERENCES (TOP 20, BOTTOM 20 DIFFERENCE; INTERIOR SAMPLE, 1874–1905)

TOP 20, BOTTOM 20 DIFFERENCE (PAMPA REGION 1874–1916)
TOP 20, BOTTOM 20 DIFFERENCE (PATRICIOS BATTALION 1901–1943)
TOP 20, BOTTOM 20 DIFFERENCE (INMATES OF BUENOS AIRES PRISONS 1885–1959)
TOP 20, BOTTOM 20 DIFFERENCE (RECRUITS, PAMPA REGION, 1916–1951)
TOP 20, BOTTOM 20 DIFFERENCE (RECRUITS, NORTHWEST REGION 1915–1951)
TOP 20, BOTTOM 20 DIFFERENCE (RECRUITS FROM BUENOS AIRES CITY; 1916–1951)
TOP 20, BOTTOM 20 DIFFERENCE (BUENOS AIRES CONURBANO 1916–1951)