


Introduction
Ungulates are an integral component of Himalayan mammalian fauna and play an essential role in shaping ecosystems by influencing vegetation structure (McNaughton, Reference McNaughton1979; Bagchi & Ritchie, Reference Bagchi and Ritchie2010) and as primary prey for large predators (Bagchi & Mishra, Reference Bagchi and Mishra2006; Sathyakumar et al., Reference Sathyakumar, Bhattacharya, Bashir and Poudyal2013a). Population estimates are important for effective conservation management (Singh & Milner-Gulland, Reference Singh and Milner-Gulland2011; Suryawanshi et al., Reference Suryawanshi, Bhatnagar and Mishra2012). Methods to estimate animal abundance include distance sampling (Buckland et al., Reference Buckland, Anderson, Burnham, Laake, Borchers and Thomas2001), track count (Sulkava & Liukko, Reference Sulkava and Liukko2007), dung count (Laing et al., Reference Laing, Buckland, Burn, Lambie and Amphlett2003), the abundance induced heterogeneity model (Royle & Nichols, Reference Royle and Nichols2003), repeated count (Royle, Reference Royle2004) and the double observer method (Forsyth & Hickling, Reference Forsyth and Hickling1997; Suryawanshi et al., Reference Suryawanshi, Bhatnagar and Mishra2012; Suryawanshi et al., Reference Suryawanshi, Mudappa, Khanyari, Raman, Rathore, Kumar and Patel2020). In mountains, however, rugged and steep terrain, inaccessibility and harsh weather conditions make these techniques less effective (Singh & Milner-Gulland, Reference Singh and Milner-Gulland2011).
As a consequence, several studies on mountain ungulates have used an indirect index of abundance (e.g. Schaller et al., Reference Schaller, Junrang and Mingjiang1988; Sathyakumar, Reference Sathyakumar1994; Bagchi & Mishra, Reference Bagchi and Mishra2006; McCarthy et al., Reference McCarthy, Fuller, Ming, McCarthy, Waits and Jumabaev2008; Suryawanshi et al., Reference Suryawanshi, Bhatnagar and Mishra2010) as an alternative to absolute abundance. However, these estimates are less reliable and highly dependent on the assumption of constant detection probability throughout the survey period (Yoccoz et al., Reference Yoccoz, Nichols and Boulinier2001). In addition, small population sizes, cryptic and elusive behaviour, and patchy distribution of Himalayan ungulates limit the number of observations that can be made for a given survey effort (Singh & Milner-Gulland, Reference Singh and Milner-Gulland2011). Forest-dwelling mountain ungulates may have activity peaks at night (Cavallini, Reference Cavallini1992; Bhattacharya et al., Reference Bhattacharya, Bashir, Poudyal, Sathyakumar and Saha2012a) and are rarely detected during day-time surveys.
Distance sampling is one of the most popular methods for assessing the density of large herbivores in tropical forests (Buckland et al., Reference Buckland, Anderson, Burnham, Laake, Borchers and Thomas2001). However, meeting the underlying assumptions of this method in the mountains is difficult (Corlatti et al., Reference Corlatti, Fattorini and Nelli2015), which can lead to underestimation of population sizes. In the mountains, non-random locations of non-linear transects, inaccurate measurements of sighting distance and angle, and elusive behaviour of target species violate the assumptions underlying conventional distance sampling (O'Neill, Reference O'Neill2008; Singh & Milner-Gulland, Reference Singh and Milner-Gulland2011). Furthermore, the structure of mountainous terrain can hamper animal detectability, as animals hidden behind rocks or in valleys could remain undetected, irrespective of their distance from the observer.
Camera traps are an efficient tool for detecting elusive and rare species in remote habitats (Burton et al., Reference Burton, Neilson, Moreira, Ladle, Steenweg and Fisher2015; Rovero & Zimmermann, Reference Rovero and Zimmermann2016), and extending the point transect method to accommodate data from camera traps could help solve some of the issues related to the violation of the assumptions underlying classic distance sampling (Howe et al., Reference Howe, Buckland, Després-Einspenner and Kühl2017). Distance sampling with camera traps has recently been tested for estimating the populations of Maxwell's duiker Philantomba maxwellii (Howe et al., Reference Howe, Buckland, Després-Einspenner and Kühl2017) and the western chimpanzee Pan troglodytes versus (Cappelle et al., Reference Cappelle, Després-Einspenner, Howe, Boesch and Kühl2019) in Côte d'Ivoire. However, the efficacy of this technique in mountainous terrain has yet to be tested.
Mountain ungulates are threatened by hunting for meat and body parts (Sathyakumar et al., Reference Sathyakumar, Bhattacharya, Bashir and Poudyal2013a,Reference Sathyakumar, Gopal, Johnsingh, Johnsingh and Manjrekarb), habitat loss (Namgail et al., Reference Namgail, Fox and Bhatnagar2007; Kittur et al., Reference Kittur, Sathyakumar and Rawat2010) and competition with livestock (Mishra et al., Reference Mishra, van Wieren, Ketner, Heitkonig and Prins2004; Bhattacharya et al., Reference Bhattacharya, Kittur, Sathyakumar and Rawat2012b) throughout the Himalaya. Here, we focused on the Himalayan blue sheep or bharal Pseudois nayaur and the Himalayan musk deer Moschus leucogaster, both of which are affected by anthropogenic impacts (Mishra et al., Reference Mishra, van Wieren, Ketner, Heitkonig and Prins2004; Bhattacharya & Sathyakumar, Reference Bhattacharya and Sathyakumar2011). The bharal is a social species of the Caprinae subfamily. It is associated with alpine and steppe mountain pastures, and subalpine slopes devoid of tree cover (2,500–5,500 m; Prater, Reference Prater1980; Sathyakumar & Bhatnagar, Reference Sathyakumar and Bhatnagar2002). The species is categorized as Least Concern on the IUCN Red List and listed in Schedule I of the Indian Wildlife (Protection) Act, 1972. In contrast, the Himalayan musk deer is solitary and sedentary, remaining within a defined home range throughout the year. The musk deer, a primitive deer-like ruminant, is a member of the family Moschidae. In the Indian Himalayan region, the southern side of the Greater Himalaya, it is restricted to areas between 2,500 m and the treeline (Green, Reference Green1985; Sathyakumar et al., Reference Sathyakumar, Gopal, Johnsingh, Johnsingh and Manjrekar2013b). It is categorized as Endangered on the IUCN Red List (Timmins & Duckworth, Reference Timmins and Duckworth2015) and listed in the Indian Wildlife (Protection) Act, 1972, in Schedule I.
Here, we tested the efficacy of the extension of the distance sampling method to accommodate camera-trap data for estimating the density of the group-living bharal in the trans-Himalayan region (3,500–5,500 m) and the solitary Himalayan musk deer in the subalpine region (2,500–3,500 m) of the Upper Bhagirathi basin. We examined the field applicability and possible limitations of this method for estimating the density of these two ungulates in mountainous terrain.
Study area
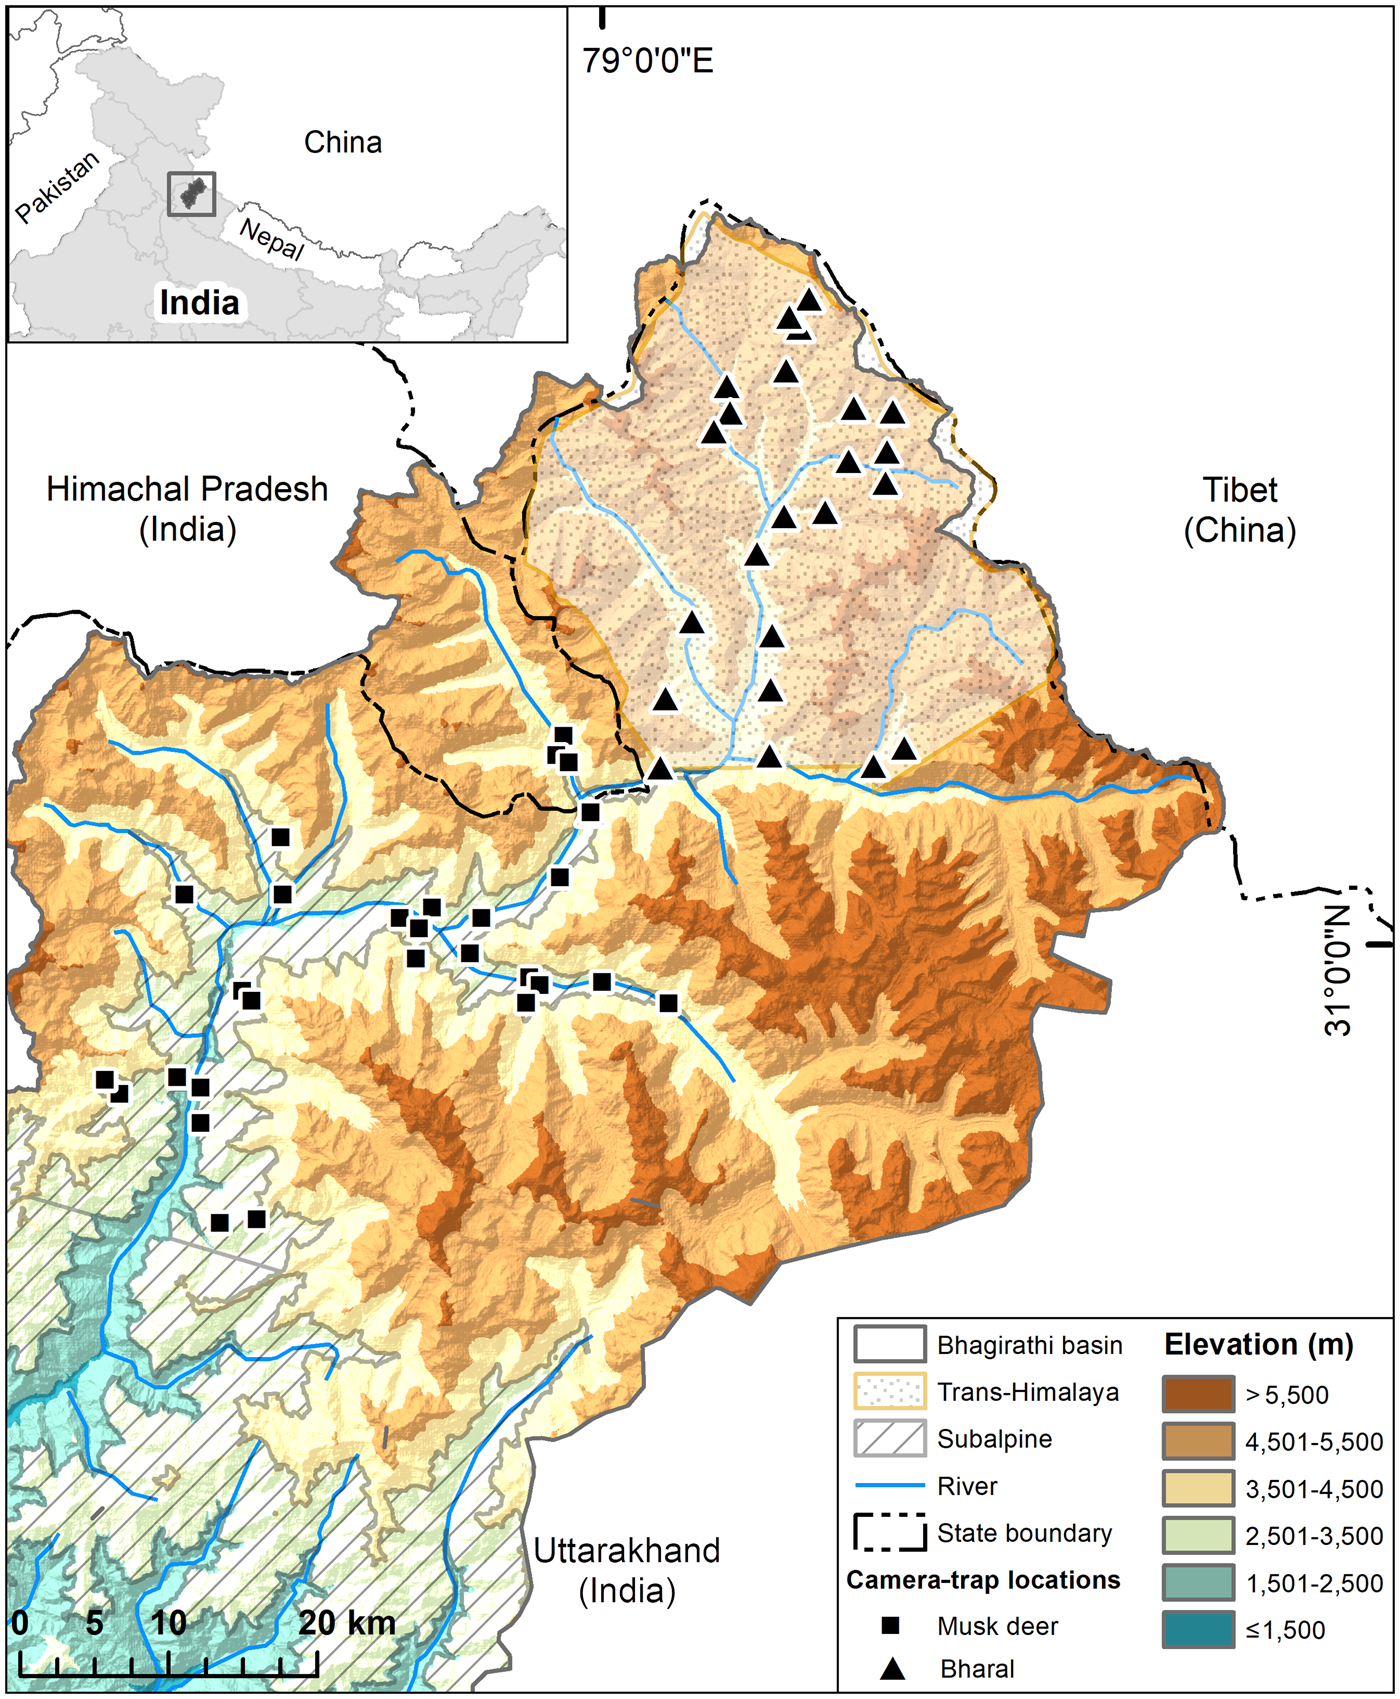
We carried out this study in the trans-Himalayan part (Nilang valley) of Gangotri National Park, in the subalpine portion of the Park and Uttarkashi Forest Division within Uttarakhand State, India (Fig 1, Plate 1). Nilang valley is characterized by broken terrain, deep gorges, steep slopes (> 45°) and narrow valleys (Bhardwaj et al., Reference Bhardwaj, Uniyal and Sanyal2010). The study area does not have permanent human settlements, but the alpine and subalpine zones are seasonal grazing ground for livestock from lower parts of the Bhagirathi basin. Tourists also use the area in summer (June–September). Nilang valley forms the international boundary with Tibet and is controlled by military personnel. There is a network of snow-fed tributaries of the Jadh Ganga, which drains the area to meet the Bhagirathi River. We surveyed areas of dry alpine scrub vegetation at 3,000–5,200 m for the bharal, and subalpine habitats dominated by Betula utilis, Pinus wallichiana, Quercus semecarpifolia and Cedrus deodara, at 2,500–3,000 m, for the Himalayan musk deer.
Study area in the trans-Himalayan region and subalpine region of the Upper Bhagirathi basin, with the locations of camera traps used for estimating densities of the bharal Pseudois nayaur, and Himalayan musk deer Moschus leucogaster, respectively. The inset map shows the location of the Bhagirathi basin in Uttarakhand State, Western Himalaya, India.
Methods
Data collection
We divided the study area into grid cells of 3 × 3 km. In each grid cell, we generated 20 random points using a sampling tool in ArcGIS 10.4 (Esri, Redlands, USA), and selected accessible points for the placement of camera traps. Some randomly generated locations were inaccessible because of precipitous terrain or the presence of seasonal pastoral nomad camps. We deployed camera traps (Cuddeback blue series, Cuddeback, De Pere, USA) to capture the bharal at 21 locations during summer (May–September 2017; 2,205 trap nights) and 25 locations during winter (October 2017–January 2018; 1,786 trap nights) in the trans-Himalayan region of Gangotri National Park (Fig. 1). For the Himalayan musk deer, we set up camera traps in subalpine habitat, at 30 locations during summer (May–September 2018; 2,246 trap nights) and 28 locations during winter (October 2018–January 2019; 964 trap nights). Camera traps were mounted 30–35 cm above the ground, and programmed to trigger immediately and record an image followed by a 30-s video when movement was detected.
Distance analysis requires calculating distance of the target species from the observer, in our case from the camera. To estimate the distance of photo-captured individuals from the camera trap, we calibrated image measurements against actual measurements during camera installation. For this, we took measurements using a calibration pole of known height at known distances from the camera, in the centre and along both sides of the camera's field of view. This calibration was done for a total of 30 camera traps, and we considered the measurements taken at these locations representative for others with similar topography and field of view.
Data analysis
Test for sampling bias
To test whether we had sampled all elevations and topographic features according to their availability in the landscape, we compared elevation, ruggedness, slope and aspect of camera-trap locations and 100 randomly generated points using a non-parametric Mann–Whitney U test for scale variables (elevation, slope, ruggedness) and Bonferroni confidence intervals for the categorical variable (aspect). We resampled elevation data from the Shuttle Radar Topography Mission, at 1 km resolution (Jarvis et al., Reference Jarvis, Guevara, Reuter and Nelson2008). We calculated slope, ruggedness and aspect information using spatial analyst from the Digital Elevation Model in ArcGIS.
Availability for detection
With camera traps, we can only estimate the density of populations that are available for detection (Howe et al., Reference Howe, Buckland, Després-Einspenner and Kühl2017). If the population surveyed is not available for detection during the data collection period selected for analysis, temporal sampling effort is overestimated, and as a result, density could be underestimated (Cappelle et al., Reference Cappelle, Després-Einspenner, Howe, Boesch and Kühl2019). To avoid this bias, either the sampling period should be defined as the time during which the entire population was available for detection (peak activity period) or the proportion of time when animals were available for detection should be included as a parameter in the model (Howe et al., Reference Howe, Buckland, Després-Einspenner and Kühl2017). In our study, the bharal was active during 6.00–18.00, without a marked peak in activity (Fig. 2). The Himalayan musk deer was active at night (18.00–6.00) in summer and during the day (6.00–20.00) in winter (Fig. 2). We used the active period of each species as the sampling period for the analysis. We corrected for the bias caused by animals being unavailable for detection by calculating the mean proportion of animals that were active during the period selected for analysis and incorporating this proportion in the density estimates.
Kernel density estimates of daily activity pattern of the bharal and the musk deer in summer and winter in the Upper Bhagirathi basin.
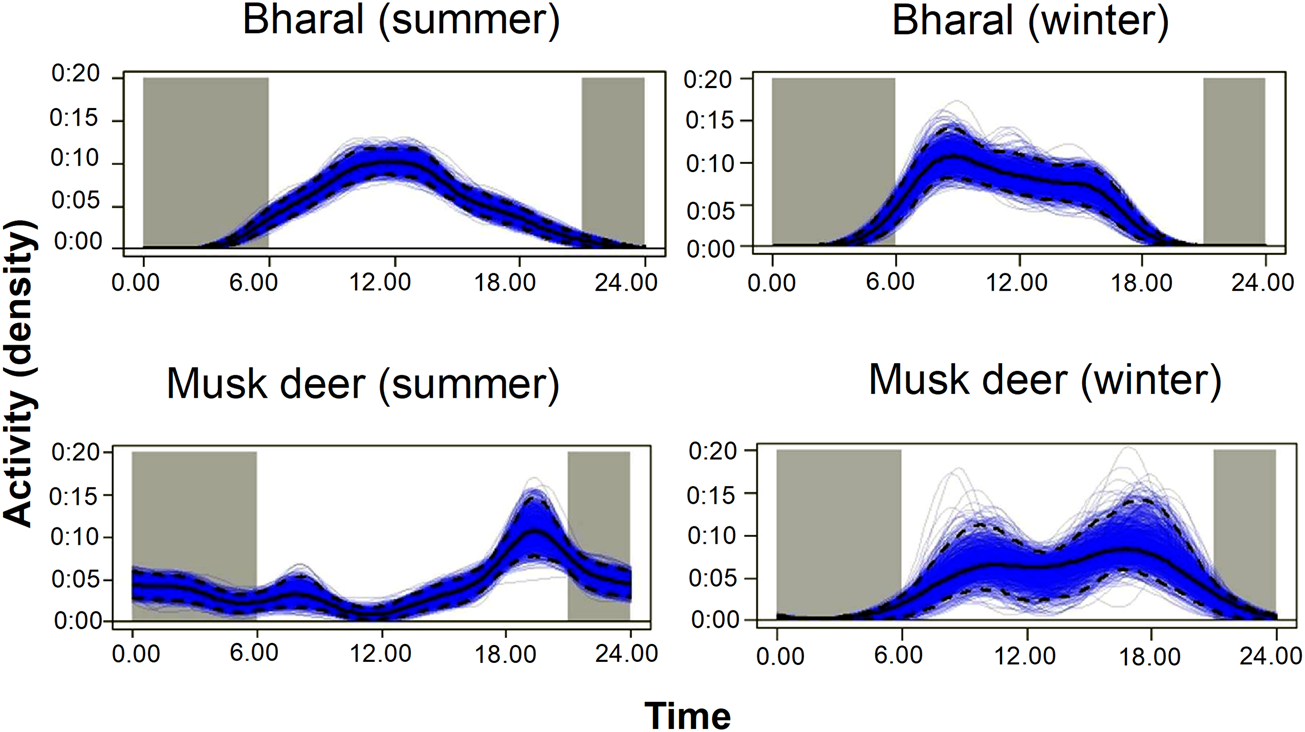
For example, for the bharal we first plotted the number of independent captures (i.e. at least a 30-minute interval between subsequent captures) to visualize the activity pattern of the species (Fig. 2). We assumed that if all animals were active throughout the day, then the curve would be a flat line between 6.00 and 18.00. On the other hand, if all the animals were active around 12.00 (at the highest point of the curve), then this flat line will coincide with the curve at 12.00. We calculated both the areas under the imaginary flat line and under the actual activity curve shown in Fig. 2. We then calculated the mean proportion of animals that are active between 6.00 and 18.00 by dividing the proportion of the area under the actual activity curve by the area under the imaginary flat line, where animal activity reaches a peak. The estimated mean proportion of animals that are active during the period selected for analysis was 0.75 in summer and 0.8 in winter for the bharal. For the Himalayan musk deer it was 0.65 in summer and 0.7 in winter. We used the proportion of time animals are active to correct the naïve density estimate by dividing it by proportion of time active, using Distance 7.0 (Thomas et al., Reference Thomas, Buckland, Rexstad, Laake, Strindberg and Hedley2010).
Density estimation
Distance sampling with camera traps requires calculating the distance between the animal and the camera at snapshot moments to ensure that animal movement does not bias the distribution of detection distances (Howe et al., Reference Howe, Buckland, Després-Einspenner and Kühl2017). We thus defined a finite set of snapshot moments (2 s apart) within the sampling period (as suggested in Howe et al., Reference Howe, Buckland, Després-Einspenner and Kühl2017). For each snapshot moment when the species was captured, we estimated the radial distance between each animal and the camera trap, using a regression equation developed from the field calibration. In this equation, the dependent variable was the ratio of the actual height of an individual to its height in the photograph, and the explanatory variable was the distance at which the individual was photo-captured (see Supplementary Material 1 for details). We obtained information on actual heights for different age and sex classes of the bharal by comparing the camera-trap photos of the species with the height of the calibration pole height. We identified eight, 14, two and 10 comparable photographs of adult males, adult females, subadults and fawns, respectively. We calculated the mean height as 76.3 ± SE 2.4 cm (adult male), 70.0 ± SE 1.1 cm (adult female) and 64.0 ± SE 1.0 cm (subadult) and 47.3 ± SE 1.9 cm (fawn). For adult Himalayan musk deer we used a mean height of 50 cm (Sathyakumar et al., Reference Sathyakumar, Gopal, Johnsingh, Johnsingh and Manjrekar2013b) to estimate their distance from the camera.
Density was estimated following the equation for camera-trap point transects (Howe et al., Reference Howe, Buckland, Després-Einspenner and Kühl2017):
 $$\hat{D} = \displaystyle{{\mathop \sum \limits_{k = 1}^K n_k} \over {\pi w^2\mathop \sum \limits_{k = 1}^K e_{k\;}{\hat{P}}_k}}\times \;\displaystyle{1 \over A}$$
where n k is the number of observations of animals at a point k (camera-trap location), e k is the temporal effort, and  $\hat{P}_k$ is the estimated probability of obtaining an image of an animal that is within θ degrees (angle covered by the camera's field of view), K is the total number of camera-trap locations and w (truncation distance) in front of the camera at a snapshot of the moment. The effort at a point k was measured as e k = θ T k/2 πt where θ /2π describes the fraction of a circle covered by a camera, T k is the period of camera deployment (in seconds), and t is the unit of time used to determine a finite set of snapshot moments within T k (also in seconds). We defined the period of camera deployment as the time the target species was expected to be active during the sampling period. For the bharal, this was a 12-hour period per day (6.00–18.00) in both seasons and for the Himalyan musk deer a 12-hour period per day (18.00–6.00) in summer and a 14-hour period per day (6.00–20.00) in winter. 1/A is the availability correction factor.
Seven camera traps malfunctioned because of technical errors and were not included in the final analysis. For the analysis in Distance, we modelled the detection from using the same functions as Howe et al. (Reference Howe, Buckland, Després-Einspenner and Kühl2017): half normal with 0, 1 or 2 Hermite polynomial adjustment terms; hazard rate with 0, 1, or 2 cosine adjustments; uniform with 1 or 2 cosine adjustments. As model selection methods based on Akaike's information criterion (AIC) tend to favour overly complex models because of overdispersion in the data, we selected models using a recently proposed two-step procedure (Howe et al., Reference Howe, Buckland, Després-Einspenner and Kühl2019): (1) Firstly, the best model is selected on the basis of AIC adjusted for overdispersion (QAIC) within each key function, where the overdispersion parameter (Ĉ) is calculated from the ratio between the χ 2 statistics of the most parameterized model for each key function and its degrees of freedom (χ 2/df). (2) Secondly, the best model is selected with the smallest values of the χ 2 goodness-of-fit statistic divided by its degrees of freedom (across QAIC-selected models, one from each key function). We used the point transect distance sampling method in Distance (Thomas et al., Reference Thomas, Buckland, Rexstad, Laake, Strindberg and Hedley2010) for all analyses.
Results
Sampling bias test
In case of the Himalayan musk deer, the elevation, ruggedness and slope of sampled camera-trap locations were not biased: the mean values of sampled locations were not significantly different from the mean elevation, ruggedness and slope of 100 random points in both seasons (P > 0.05 in each case, Mann–Whitney U test; Supplementary Fig. 1). Bonferroni confidence intervals indicated no particular aspect category was preferred for sampling in winter or summer (Supplementary Fig. 1). Similarly, in the case of the bharal, the ruggedness, elevation and slope of the sampled camera locations were not different from the mean ruggedness, elevation, slope and aspect of the random points (Supplementary Fig. 2). Encounter rates were highly variable amongst locations and did not show any spatial autocorrelation for the bharal (Moran's I P: 0.6 in summer, 0.9 in winter) or the musk deer (Moran's I P: 0.8 in summer, 0.6 in winter).
Density estimates
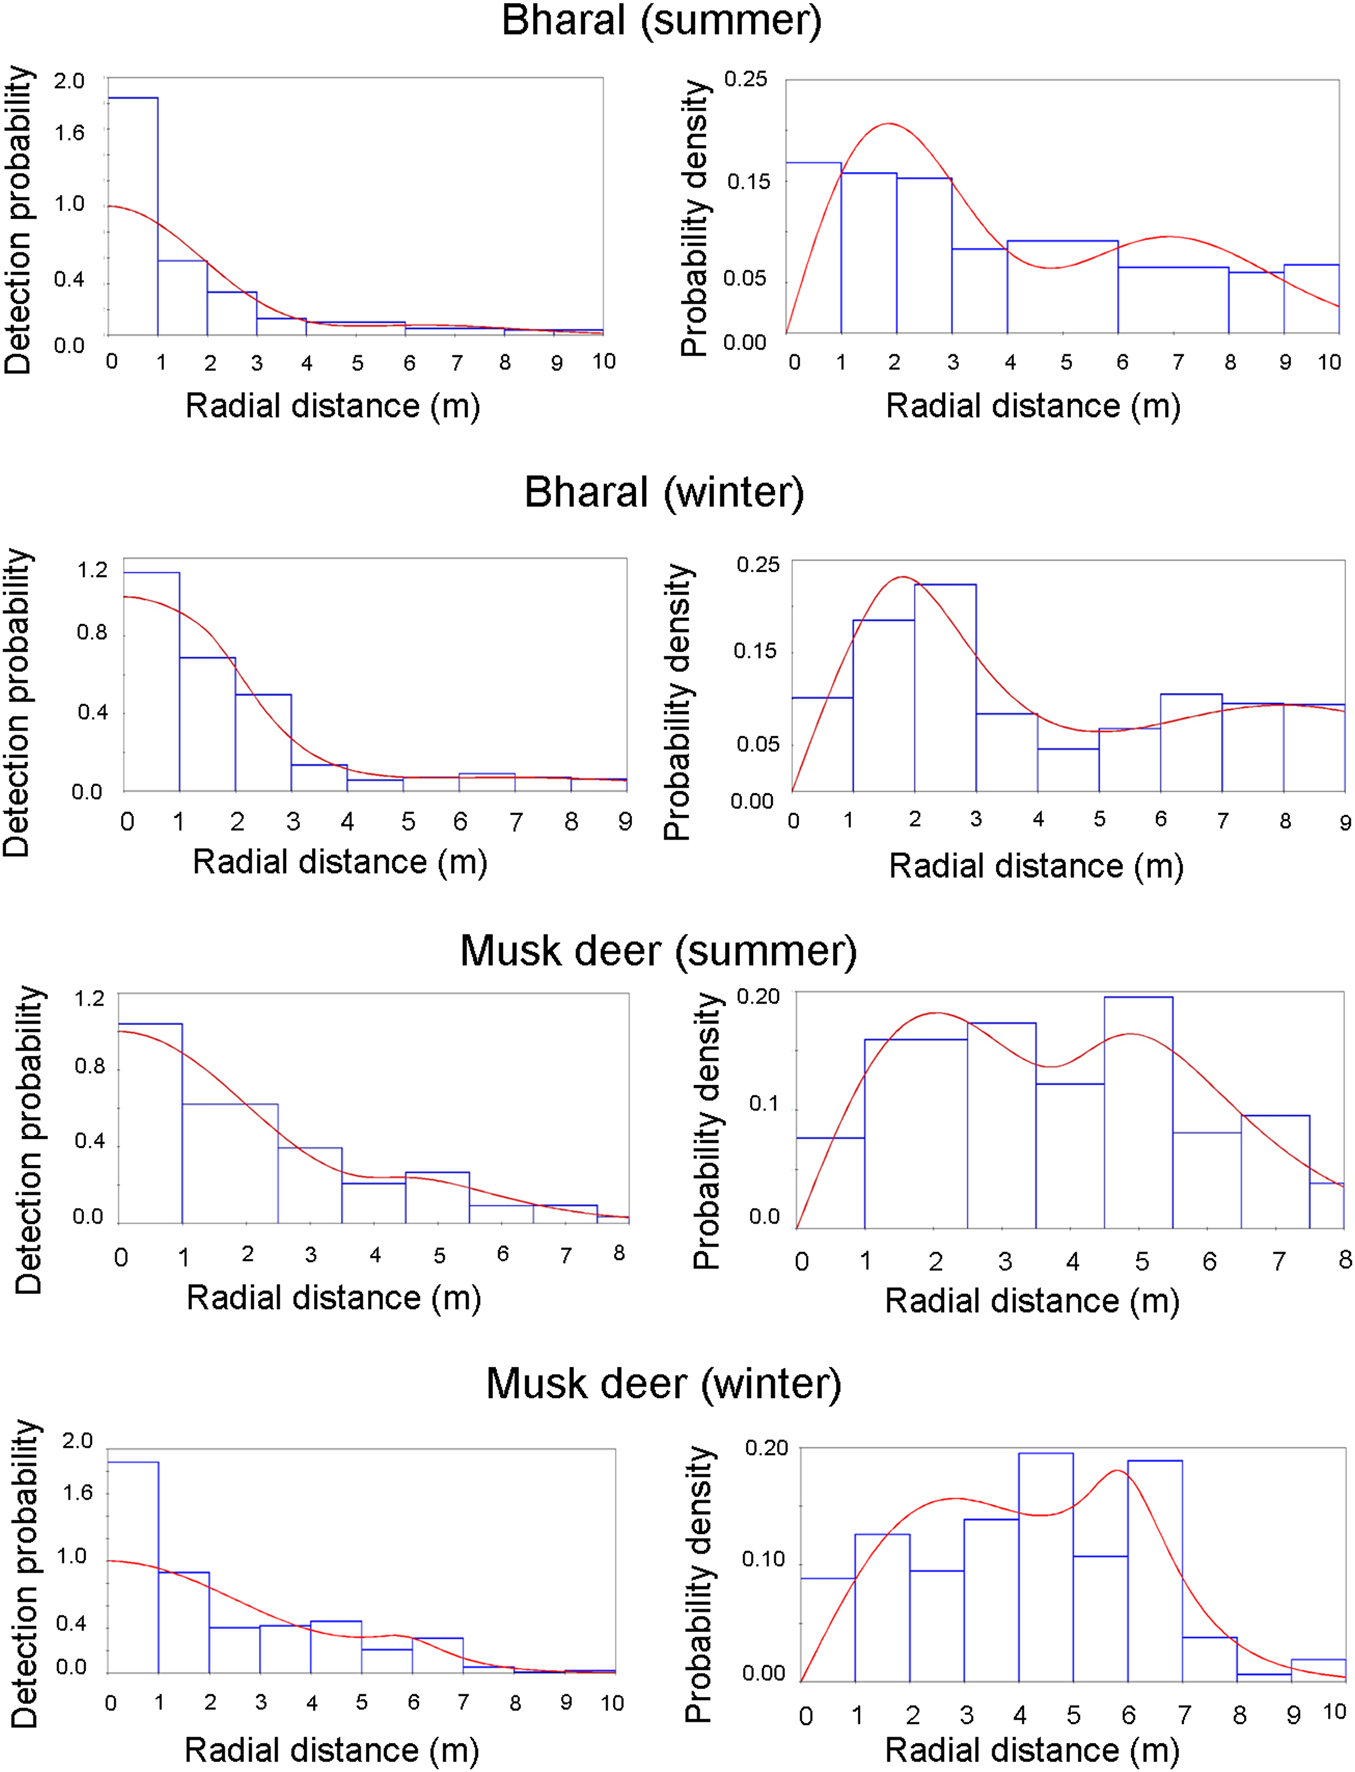
The bharal was photo-captured by 17 out of 21 camera traps deployed in summer, and 14 out of 24 in winter. We obtained 1,059 snapshots in 104 videos in summer and 949 snapshots in 61 videos in winter. In summer, one of the cameras contributed a large number of captures (c. 60% of the total dataset). This particular camera was placed on a steep slope with cliffs on both sides, and close (10–15 m) to an intensively used bharal trail along a stream. Consequently, a large number of observations by this camera were within 9–12 m as most of the bharals followed the path to move up or down the slope. Because of this bias, the initially estimated density of 0.15 ± SE 0.31 individuals/km2 had a high CV (207.35). We removed this camera from the final analysis to get an estimate with reduced bias. Amongst the summer captures, we found an excess of distances close to the camera (Fig. 3). The hazard-rate model is more sensitive than the half-normal model to this excess, resulting in an implausible rapid fall-off in the detection probability. Therefore, we used the second-best model (Table 1), the half-normal model, for estimating bharal density in summer (0.51 ± SE 0.1 individuals/km2, CV = 0.31). In winter, the best model was the hazard-rate model, and the second-best half-normal model resulted in the same density estimates (0.64 ± SE 0.2 individuals/km2, CV = 0.37; Table 1).
Detection probability and probability density for the models selected for estimating density. The bars show the data distribution, and the line represents the model fit. The heights of the bars are scaled so that they cover the same total area as the area under the line, to show how well the detection function fits the data.
Details of the top three models used to estimate the densities of the bharal Pseudois nayaur and the Himalayan musk deer Moschus leucogaster in summer and winter in the Upper Bhagirathi basin, Uttarakhand, India, showing key functions (defining parametric shapes for the detection function), adjustment types (to allow for departures from the parametric shape), the number of adjustment terms selected (order), overdispersion factor (Ĉ), Akaike's information criterion adjusted for overdispersion (QAIC), and density estimates with standard error (SE) and coefficient of variance (CV).

Himalayan musk deer were captured by 11 out of 28 cameras in summer and 6 out of 25 cameras in winter. We obtained 564 snapshots in 102 videos in summer and 166 snapshots in 31 videos in winter. Himalayan musk deer data did not show the heterogeneity in capture probabilities amongst cameras that we observed for the bharal, nor any evidence of bias in terms of distances (Fig. 3). The best model was the hazard-rate model with cosine adjustment in both seasons (Table 1), and estimated density was 0.4 ± SE 0.1 individuals/km2 (CV = 0.34) in summer and 0.1 ± SE 0.05 individuals/km2 (CV = 0.48) in winter (Table 1).
Discussion
Our estimates of bharal density in summer (0.5 ± SE 0.1 individuals/km2) and winter (0.6 ± SE 0.2 individuals/km2) were similar. Estimates of bharal densities from three different locations in Spiti, the nearest trans-Himalayan landscape (using standardized double observer method; Suryawanshi et al., Reference Suryawanshi, Bhatnagar and Mishra2012) were 1.60, 1.49 and 3.19/km2. Estimates of bharal densities in our study are low compared to those of Spiti can be expected because of differences in habitat type and topography. The Spiti landscape comprises vast trans-Himalayan meadows (Biotic Province 1B; Rodgers et al., Reference Rodgers, Panwar and Mathur2000), whereas our study area consists primarily of narrow valleys and gorges with rough terrain and barren slopes (Biotic Province 1C; Kumar et al., Reference Kumar, Adhikari and Rawat2017; Plate 1). The differences of bharal density estimates and mean group sizes (9.6 in Nilang valley vs 13.1 in Kibber, Spiti) between these two areas may thus be a result of differences in habitat quality. In addition, Nilang valley is affected by anthropogenic disturbances such as hunting (Bhardwaj et al., Reference Bhardwaj, Uniyal and Sanyal2010), livestock grazing (Chandola, Reference Chandola2009; RP pers. obs., 2017) and presence of free-ranging dogs (Pal et al., Reference Pal, Thakur, Arya, Bhattacharya and Sathyakumar2020). The differences could also be caused by different survey techniques. We were unable to estimate bharal density using the point count distance method because of insufficient observations. The double observer method used to estimate bharal density in trans-Himalayan habitat requires visual coverage of the entire survey area in a short period, a requirement that could not be fulfilled in our study because parts of the study area were inaccessible and visual coverage was insufficient (Plate 1).
The study was conducted in the trans-Himalayan part (Nilang valley) of Gangotri National Park characterized by dry alpine scrub vegetation, broken terrain, deep gorges, high gradient slopes, and narrow valleys (a), and in the subalpine portion of the Park and Uttarkashi Forest Division (b) within Uttarakhand State, India.

The density of Himalayan musk deer was higher in summer (0.4 ± SE 0.1 individuals/km2) than winter (0.1 ± SE 0.05 individuals/km2). The analysis of seasonal habitat use in the study area also showed a trend of decline in captures at high elevations (Pal et al., Reference Pal, Thakur, Arya, Bhattacharya and Sathyakumar2020) in winter, possibly because musk deer migrate to lower altitudes during periods of heavy snowfall. Similar seasonal movements were also observed in other areas (Anwar & Minhas, Reference Anwar and Minhas2008; Dendup & Lham, Reference Dendup and Lham2018). Other studies using the silent drive count method in Kedarnath Wildlife Sanctuary estimated musk deer density to be 3.7 ± SE 0.2 individuals/km2 in 1989–1991 (Sathyakumar, Reference Sathyakumar1994), 2.2 individuals/km2 in 1994–1995 (Sathyakumar & Malik, Reference Sathyakumar and Malik2006) and 1.2 individuals/km2 in 2000 (S. Sathyakumar, unpubl. data). These studies may have overestimated musk deer densities as the drive count method is known for overestimating the density of animals (Takeshita et al., Reference Takeshita, Ikeda, Takahashi, Yoshida, Igota, Matsuura and Kaji2016). In addition, they were carried out in a small portion (c. 2.5 km2) of a protected area; small study areas combined with a bias towards good habitat quality can result in highly overestimated densities (Suryawanshi et al., Reference Suryawanshi, Khanyari, Sharma, Lkhagvajav and Mishra2019).
Our density estimates are associated with high coefficients of variation. This high variability is probably caused by landscape topography and species biology. The fit of the model for the solitary Himalayan musk deer was better than for the group-living bharal. Here, we discuss some of the issues we faced using sampling with camera traps, and make suggestions as to how these can be addressed in future studies.
For the bharal, the main problem that caused bias in the distances at which individuals were captured was the inadequate camera view because of slopes. The ruggedness of the landscape also influences the approach angle and the distance covered by the cameras: those on hilltops or at the base of a hill covered distances of 10–20 m, whereas cameras on hill slopes covered distances of 6–10 m (depending on the slope). Topographic variability probably also influenced detection probability and the estimated angle of the camera view. Future studies in similar landscapes could use statistical tests to examine the effects of these parameters more thoroughly.
Another issue encountered with the group-living bharal was that animals grazing close to the camera blocked the view of animals that were further away. This can make it impossible to calculate the distance from the camera for individuals in the background, leading to a bias towards individuals recorded at shorter distances. However, such incidents were relatively rare in our study (six occasions). Herd behaviour also affects captures, as bharals tend to follow the first individual when moving together. Because we analysed individual distances from the camera, this can cause heaping in the distances recorded (Fig. 3).
Distance sampling with camera traps requires setting the cameras in burst or video mode. Our effort to implement this method in the Greater Himalayan alpine habitats failed because cameras were continuously triggered by grass movements in the field of view (RP, pers. obs., 2017). We had to discard data from four camera traps in this study for the same reason. Mounting cameras higher off the ground could help minimize this problem. In addition, the imprecise (high CV) estimates suggest that more sampling locations are required to improve precision (Howe et al., Reference Howe, Buckland, Després-Einspenner and Kühl2017; Cappelle et al., Reference Cappelle, Després-Einspenner, Howe, Boesch and Kühl2019).
The ability of camera sensors to detect moving animals may vary depending on camera type and placement, temperature, and humidity (Hofmeester et al., Reference Hofmeester, Rowcliffe and Jansen2017). Different camera models can be tested at a site to assess the ability to detect animals. There could be inconsistencies between the theoretical and actual angle of view θ, which can lead to biased estimates. This can result in underestimates if sensors are less sensitive to movements near the edges of the camera's field of view (i.e. the effective angle can be smaller than the assumed angle). This can be addressed with field tests to estimate the effective angle θ, which can then be accounted for in the analysis. Imprecise measures of distance should not be an issue if they are appropriately binned in distances for the analysis (Buckland et al., Reference Buckland, Rexstad, Marques and Oedekoven2015). However, imprecise estimates of the target species’ availability for detection can cause erroneous estimates. Care should thus be taken in selecting the appropriate time period of animal activity and availability for detection (Howe et al., Reference Howe, Buckland, Després-Einspenner and Kühl2017).
Distance sampling with camera traps has paved the way for a new analytical approach to estimate the abundance of both group-living and solitary mountain ungulates in rugged and inaccessible terrains of the Himalaya. It can to some extent overcome the logistic constraints associated with rugged terrain and harsh weather that affect other methods such as point counts and transects sampling. These traditional methods are difficult to implement effectively in a high-altitude, rugged and remote landscape because they require cover of most vantage points in a single day or within a defined, short period of time (Singh & Milner-Gulland, Reference Singh and Milner-Gulland2011). In addition, the low number of detections often limits the conventional analytical process. Indirect observations such as dung counts can be useful but require estimation of the decay rate, which is often difficult to obtain (Buckland, Reference Buckland, Anderson, Burnham, Laake, Borchers and Thomas2001; Kuehl et al., Reference Kuehl, Todd, Boesch and Walsh2007). Distance sampling with camera traps can work for longer periods in the field and may help to overcome the challenges presented by low numbers of detections and observer bias (Cappelle et al., Reference Cappelle, Després-Einspenner, Howe, Boesch and Kühl2019). An important advantage of camera traps over conventional distance sampling is that they are better suited to monitor solitary, elusive and nocturnal species such as the Himalayan musk deer. Camera traps have been extensively used to survey the snow leopard Panthera uncia. A slight modification in the sampling design (modified camera placement) could help gain information on its main prey species, including the bharal, the ibex Capra sibirica, the argali Ovis ammon and the musk deer.
Despite these advantages, there are limitations to the use of camera traps, including the high cost of the cameras and the extensive time required to process photographs and videos. Substantial numbers of camera traps would be required to improve the precision of density estimates derived from distance sampling with camera traps (Cappelle et al., Reference Cappelle, Després-Einspenner, Howe, Boesch and Kühl2019). Despite the high initial cost, we believe this approach could help improve abundance estimations for both group living and solitary mountain ungulates in rough, mountainous terrain where conventional techniques cannot be implemented.
Acknowledgements
This work is part of a project initiated under the National Mission for Sustaining the Himalayan Ecosystem (NMSHE) Programme funded by the Department of Science and Technology, Government of India (grant no.: DST/SPLICE/CCP/ NMSHE/TF-2/WII/2014[G]). The Miriam Rothschild Travel Bursary Programme provided funding for a 4-week internship for R. Pal with S.T. Buckland at St Andrews University, UK. We thank the Director and Dean of the Wildlife Institute of India for their guidance and support; D.V.S. Khati, Principal Chief Conservator of Forests and Chief Wildlife Warden, Uttarakhand, for granting research permission; Sandeep Kumar, Divisional Forest Officer and former Deputy Director, Gangotri National Park, and Shrawan Kumar for their support and cooperation; and L. Corlatti for reviewing the manuscript.
Author contributions
Conception of study: SS, RP, TB, QQ; data collection: RP; data analysis: RP, STB, TB; writing: all authors; revisions: QQ, STB, SS.
Conflicts of interest
None.
Ethical standards
This work was carried out with permission from Uttarakhand Forest Department (Letter no. 836/5-6) and abided by the Oryx guidelines on ethical standards.


 Open access

