


Non-technical Summary
Punctuated equilibrium predicts a distribution of anatomical change that is fundamentally different from the phylogenetic models used in studies of relationships among species. We present a model to assess relationships that assumes punctuated change. We apply this model to a dataset of strophomenoid brachiopods to demonstrate that a model of punctuated change fits better than a model of continuous-time (i.e., phyletic gradualism) change in this group. Notably, because the punctuated model posits elevated speciation rates early in the strophomenoid history, it also posits elevated rates of change among the early strophomenoids relative to later ones. This corroborates notions of what causes bursts of anatomical evolution rooted in ecological theory rather than evolutionary developmental theory. More basically, it emphasizes that paleontologists should consider both punctuated and continuous-time models when assessing relationships and other aspects of macroevolutionary theory.
Introduction
Eldredge and Gould’s (Reference Eldredge, Gould and Schopf1972) proposal that anatomical change commonly is “punctuated” rather than continuous through time inspired a flurry of research. Although early research focused on particular case studies documenting examples of gradual (e.g., Gingerich Reference Gingerich, Cracraft and Eldredge1979; Sheldon Reference Sheldon1996) or punctuated (Cheetham Reference Cheetham1986; Polly Reference Polly1997) change, more recent studies have focused on the ubiquity of punctuation and stasis relative to continuous, anagenetic change (e.g., Hunt Reference Hunt2013; Hunt et al. Reference Hunt, Hopkins and Lidgard2015). Other work focused on the implications of punctuated change for the interface between macroevolution and processes such as selection (e.g., Lande Reference Lande1976). However, the macroevolutionary implications of punctuated versus continuous-time models go beyond how speciation itself works. This was first realized for trends over time (Eldredge and Gould Reference Eldredge, Gould and Schopf1972; Stanley Reference Stanley1975), as state-dependent origination and extinction rates (i.e., species selection sensu lato) can induce the same patterns as frequent shifts to particular conditions. The possibility of punctuated change has necessary implications for patterns of morphological evolution: punctuated change coupled with elevated cladogenesis rates should induce rapid increases in disparity and apparently high rates of anatomical change per million years even if the rates of change per speciation event remain constant (Foote Reference Foote, Jablonski, Erwin and Lipps1996a; Congreve et al. Reference Congreve, Patzkowsky and Wagner2021a).
Macroevolutionary implications of punctuated change dovetail into methodological implications for how we conduct phylogenetic analyses with anatomical data. This goes beyond the co-occurrence of ancestor and descendant species that led to the initial recognition of punctuated equilibrium (Eldredge Reference Eldredge1971) or the expected differences in tree shapes that we expect from punctuated equilibrium and continuous-time models of character change (Wagner and Erwin Reference Wagner, Erwin, Erwin and Anstey1995). Quantitative phylogenetic methods consider not only topologies, but also rates of change and divergence times (e.g., Lewis Reference Lewis2001). Rates of cladogenesis are important in Bayesian phylogenetic analyses, but to establish prior probabilities of divergence times and tree shapes via tree priors (e.g., Heath et al. Reference Heath, Huelsenbeck and Stadler2014), not for generating expected amounts of character change. Under punctuated models, cladogenesis rates would also affect the likelihoods of character change rates and divergence times, simply because, even if a rate-of-change parameter remains constant, the expected amount of change over two different branches with the same duration t will be different if those two branches span intervals with different cladogenesis rates. Innumerable paleobiological studies suggest that cladogenesis rates vary substantially over time (e.g., Foote et al. Reference Foote, Cooper, Crampton and Sadler2018, Reference Foote, Edie and Jablonski2024; Foote Reference Foote2023). It is already standard practice for phylogenetic studies to consider a range of possible models of character evolution and diversification simply because we cannot know in advance which set of assumptions maximizes the probability of our observed data or our possible inferences (e.g., see Wright et al. Reference Wright, Wagner and Wright2021). Thus, even if speciation models are not a focus of a study that we are conducting, speciation rate might still represent an important nuisance parameter that we need to accommodate to test seemingly unrelated macroevolutionary hypotheses.
The flip side of the relationship between macroevolutionary theory and phylogenetic character evolution models is that different models of character evolution often favor different phylogenies for the same datasets. There are numerous tree-based analyses of punctuated versus continuous‑time character evolution, particularly with morphometric and size data (e.g., Cheetham Reference Cheetham1986; Bokma Reference Bokma2002, Reference Bokma2008; Hunt Reference Hunt2006, Reference Hunt2008; Hunt et al. Reference Hunt, Hopkins and Lidgard2015; Landis and Schraiber Reference Landis and Schraiber2017). However, those studies used “model” trees constructed independently of the analyses: approaches that assess character evolution models and relevant macroevolutionary theory without assuming “known” phylogenies relax the assumption of a known phylogeny and might avoid unrecognized biases in phylogenetic topologies estimated under incorrect models (Wright et al. Reference Wright, Wagner and Wright2021).
We have three goals in this paper. First, we shall elaborate upon a punctuated analogue to the Mk model (Lewis Reference Lewis2001) that is commonly used in phylogenetic studies (see also Wagner and Marcot Reference Wagner, Marcot, Alroy and Hunt2010). We will also present means of applying this to existing Bayesian phylogenetic packages such as RevBayes (Höhna et al. Reference Höhna, Landis, Heath, Boussau, Lartillot, Moore, Huelsenbeck and Ronquist2016). Second, we will then apply this approach to Ordovician strophomenoid brachiopods (Congreve et al. Reference Congreve, Krug and Patzkowsky2015), which represent a clade displaying an early burst of disparity that coincides with elevated rates of cladogenesis. We will use this example to examine the possible implications of punctuated change models when testing “intrinsic constraint” versus “empty ecospace” explanations for early bursts (Congreve et al. Reference Congreve, Patzkowsky and Wagner2021a). Third and finally, we will discuss how future alterations of phylogenetic methods might take into account the stasis component of punctuated equilibrium.
Methods
Continuous-Time versus Punctuated Change in Phylogenetic Models
Different possible macroevolutionary scenarios often predict different relationships between phylogeny and observable data. Models of character evolution exemplify this. The most common method used for anatomical data is Lewis’s (Reference Lewis2001) Mk model. Here, the likelihood of a specific combination of relationships, diversification times, and rates of change is the Poisson probability of net stasis or, ultimately, transitioning to another state is given by:
 $$ {e}^{Q_C} $$
where Qc in its simplest form is a rate matrix:
 $$ {Q}_C=t\times \left(\begin{array}{cccc}-\alpha & \frac{\alpha }{k-1}& \dots & \frac{\alpha }{k-1}\\ {}& & & \\ {}\frac{\alpha }{k-1}& -\alpha & \dots & \frac{\alpha }{k-1}\\ {}& & & \\ {}\vdots & \vdots & \ddots & \vdots \\ {}& & & \\ {}\frac{\alpha }{k-1}& \frac{\alpha }{k-1}& \dots & -\alpha \end{array}\right) $$
with t being the amount of time over which a character might change (e.g., the span between a divergence time and the first appearance of a taxon), α is the instantaneous (Poisson) rate of change, and αt therefore is the expected amount of change. (It is unnecessary to place t outside the matrix and using −αt or −
 $ \frac{-\alpha t}{k-1} $
in each cell will yield the same results; we use this form because phylogenetic analyses vary t and α independently and because the scripts for performing these analyses require separating α and t.) Following matrix exponentiation, the probability of net stasis is
$ \frac{-\alpha t}{k-1} $
in each cell will yield the same results; we use this form because phylogenetic analyses vary t and α independently and because the scripts for performing these analyses require separating α and t.) Following matrix exponentiation, the probability of net stasis is
 $ \frac{1+\left(k-1\right){e}^{- k\alpha t}}{k} $
, and the probability of any transition is
$ \frac{1+\left(k-1\right){e}^{- k\alpha t}}{k} $
, and the probability of any transition is
 $ \frac{1-{e}^{- k\alpha t}}{k} $
, where k is the number of character states (e.g., 3 in eq. 2; Lewis Reference Lewis2001). Note that the probability of net stasis is not the Poisson probability of no change (e −αt
) but instead is the probability of no net change: that is, starting at State X and ending at State X. This includes both no character change and 2+ characters changes ultimately leading to reversal back to the original condition. Thus, for a binary character, the probability of net stasis is the Poisson probability of zero changes plus the summed probabilities of all even numbers of change. Correspondingly, the probability of “ultimate” transition for a binary character is the summed probability of all odd numbers of changes. When there are 3+ states, these probabilities are weighted by the probability that (say) 3 changes will lead back to the original state or from State X to State Y. More complex models exist that allow for biased state transitions (including driven trends sensu McShea [Reference McShea1994]), variation in probabilities of state transitions over phylogeny (Nylander et al. Reference Nylander, Ronquist, Huelsenbeck and Nieves-Aldrey2004; Wright et al. Reference Wright, Lloyd and Hillis2016), and correlated character change (e.g., Billet and Bardin Reference Billet and Bardin2018). The Mk model itself is a special case of all of these more complex models in which state transition rates are equal under all circumstances (Guimarães Fabreti and Höhna Reference Guimarães Fabreti and Höhna2023). Thus, these variants all assume that anatomical change can happen at any point in time rather than being concentrated in speciation events.
$ \frac{1-{e}^{- k\alpha t}}{k} $
, where k is the number of character states (e.g., 3 in eq. 2; Lewis Reference Lewis2001). Note that the probability of net stasis is not the Poisson probability of no change (e −αt
) but instead is the probability of no net change: that is, starting at State X and ending at State X. This includes both no character change and 2+ characters changes ultimately leading to reversal back to the original condition. Thus, for a binary character, the probability of net stasis is the Poisson probability of zero changes plus the summed probabilities of all even numbers of change. Correspondingly, the probability of “ultimate” transition for a binary character is the summed probability of all odd numbers of changes. When there are 3+ states, these probabilities are weighted by the probability that (say) 3 changes will lead back to the original state or from State X to State Y. More complex models exist that allow for biased state transitions (including driven trends sensu McShea [Reference McShea1994]), variation in probabilities of state transitions over phylogeny (Nylander et al. Reference Nylander, Ronquist, Huelsenbeck and Nieves-Aldrey2004; Wright et al. Reference Wright, Lloyd and Hillis2016), and correlated character change (e.g., Billet and Bardin Reference Billet and Bardin2018). The Mk model itself is a special case of all of these more complex models in which state transition rates are equal under all circumstances (Guimarães Fabreti and Höhna Reference Guimarães Fabreti and Höhna2023). Thus, these variants all assume that anatomical change can happen at any point in time rather than being concentrated in speciation events.
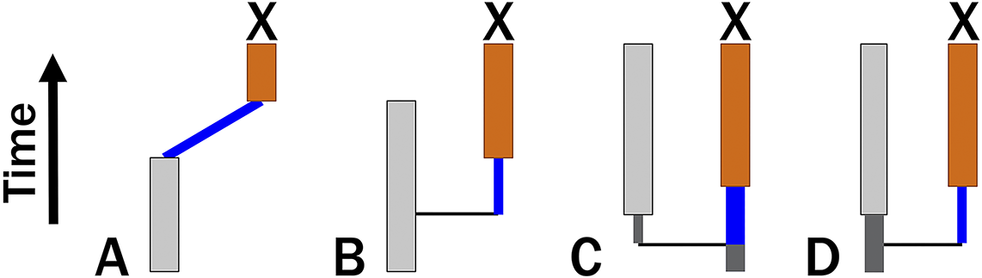
Because punctuated models posit that change is limited to cladogenetic events, we might expect a punctuated analogue to the Mk model to use binomial/multinomial probability. However, this would require that we know the number of cladogenetic events that occur over some duration t. If cladogenesis itself is a continuous-time process with rate λ, then the expected number of events over time t is λt. If the probability of change per branching event is ε, then the expected amount of change over time t is simply ελt. This led Lewis (Reference Lewis2001: p. 917) to suggest that the Mk model accommodates punctuated change, making no assumptions about how the change is distributed across a given branch. Because this ignores information about necessary cladogenetic events that result in clades having 2+ contemporaneous lineages, ελt predicts punctuated anagenetic change in which change is neither continuous over time nor attached to cladogenetic events (Wagner and Marcot Reference Wagner, Marcot, Alroy and Hunt2010). This differs from Eldredge and Gould’s model, which posits that cladogenesis and anatomical change have a common cause. Phylogenetic topologies will imply some minimum number of cladogenetic events, m, which means that expected change is ε(m + λt). We can assume m = 0 only for a possible anagenetic topology (Fig. 1A). Given a budding cladogenetic topology (Fig. 1B), m = 1 for the branch leading to the daughter species, and expected change is ε(1 + λt). Given a bifurcating pattern between two true sister taxa, there are two possibilities for any one branch (Fig. 1C,D). There must be one branching event, but we usually will have no reason to think that the “necessary” branching event leads to either branch: it might be either a continuation of the ancestral line or it might be the product of cladogenesis. Thus, the prior probability that the necessary cladogenetic event leads to the branch in question is 0.5, and expected change now is:
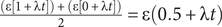 $ \frac{\left(\varepsilon \left[1+\unicode{x03BB} t\right]\right)+\left(\varepsilon \left[0+\unicode{x03BB} t\right]\right)}{2}=\varepsilon \left(0.5+\unicode{x03BB} t\right) $
. This effectively makes the minimum number of branching events leading to either of two true sister taxa m = 0.5, and the expected number over branch duration t = 0.5 + λt. A key difference that emerges is that even if t = 0, the expected change is greater than zero given any phylogenetic topology in which there must have been at least one cladogenetic event (i.e., m = 0.5 or 1.0).
$ \frac{\left(\varepsilon \left[1+\unicode{x03BB} t\right]\right)+\left(\varepsilon \left[0+\unicode{x03BB} t\right]\right)}{2}=\varepsilon \left(0.5+\unicode{x03BB} t\right) $
. This effectively makes the minimum number of branching events leading to either of two true sister taxa m = 0.5, and the expected number over branch duration t = 0.5 + λt. A key difference that emerges is that even if t = 0, the expected change is greater than zero given any phylogenetic topology in which there must have been at least one cladogenetic event (i.e., m = 0.5 or 1.0).
Four possible cladogenetic histories leading to taxon X. Thin black vertical lines denote necessary cladogenesis. Blue lines denote time over which continuous change and/or additional cladogenetic events might occur. A, X is the descendant of an observed species that last appears before X first appears. Here, there might be no cladogenetic events (m = 0). B, X is the descendant of a species that co-occurs with X. Here, there must be at least one cladogenetic events (m = 1). Bifurcation, where neither X nor its sister taxon are ancestral to one another. There must be one cladogenetic event; however, C, X might be the continuation of the original ancestor and thus need not have any cladogenetic events separating it from its common ancestor with X’s sister taxon. D, Alternatively, X represents the line derived from the cladogenetic event. Assuming both possibilities to be equiprobable, here m = 0.5.

Following Wagner and Marcot (Reference Wagner, Marcot, Alroy and Hunt2010), a “true” punctuated equilibrium analogue to the Mk model in its simplest form is given by:
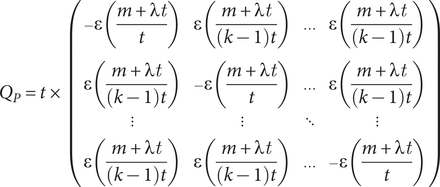 $$ {Q}_P=t\times \left(\begin{array}{cccc}-\varepsilon \left(\frac{m+\lambda t}{t}\right)& \varepsilon \left(\frac{m+\lambda t}{\left(k-1\right)t}\right)& \dots & \varepsilon \left(\frac{m+\lambda t}{\left(k-1\right)t}\right)\\ {}& & & \\ {}& & & \\ {}\varepsilon \left(\frac{m+\lambda t}{\left(k-1\right)t}\right)& -\varepsilon \left(\frac{m+\lambda t}{t}\right)& \dots & \varepsilon \left(\frac{m+\lambda t}{\left(k-1\right)t}\right)\\ {}& & & \\ {}\vdots & \vdots & \ddots & \vdots \\ {}& & & \\ {}\varepsilon \left(\frac{m+\lambda t}{\left(k-1\right)t}\right)& \varepsilon \left(\frac{m+\lambda t}{\left(k-1\right)t}\right)& \dots & -\varepsilon \left(\frac{m+\lambda t}{t}\right)\end{array}\right) $$
with the probability of net stasis being
 $ \frac{1+\left(k-1\right){e}^{- k\varepsilon \left(m+\lambda t\right)}}{k} $
, and the probability of “ultimate” transition to a new condition being
$ \frac{1+\left(k-1\right){e}^{- k\varepsilon \left(m+\lambda t\right)}}{k} $
, and the probability of “ultimate” transition to a new condition being
 $ \frac{1-{e}^{- k\varepsilon \left(m+\lambda t\right)}}{k} $
. We would accommodate more complex models of character state transitions such as those outlined earlier by varying ε in the same way that those models vary α. Note that we format equation (3) as we did because this is how it currently must be implemented to be used in programs such as RevBayes (Höhna et al. Reference Höhna, Landis, Heath, Boussau, Lartillot, Moore, Huelsenbeck and Ronquist2016; see Supplementary Code). The simplest depiction is:
$ \frac{1-{e}^{- k\varepsilon \left(m+\lambda t\right)}}{k} $
. We would accommodate more complex models of character state transitions such as those outlined earlier by varying ε in the same way that those models vary α. Note that we format equation (3) as we did because this is how it currently must be implemented to be used in programs such as RevBayes (Höhna et al. Reference Höhna, Landis, Heath, Boussau, Lartillot, Moore, Huelsenbeck and Ronquist2016; see Supplementary Code). The simplest depiction is:
 $$ {Q}_P=\left(\begin{array}{cccc}-\varepsilon \left(m+\lambda t\right)& \varepsilon \left(\frac{m+\lambda t}{\left(k-1\right)}\right)& \dots & \varepsilon \left(\frac{m+\lambda t}{\left(k-1\right)}\right)\\ {}& & & \\ {}& & & \\ {}\varepsilon \left(\frac{m+\lambda t}{\left(k-1\right)}\right)& -\varepsilon \left(m+\lambda t\right)& \dots & \varepsilon \left(\frac{m+\lambda t}{\left(k-1\right)}\right)\\ {}& & & \\ {}\vdots & \vdots & \ddots & \vdots \\ {}& & & \\ {}\varepsilon \left(\frac{m+\lambda t}{\left(k-1\right)}\right)& \varepsilon \left(\frac{m+\lambda t}{\left(k-1\right)}\right)& \dots & -\varepsilon \left(m+\lambda t\right)\end{array}\right) $$
which reveals a major difference between the punctuated and continuous-time models that epitomizes the difference between punctuated equilibrium and “phyletic gradualism”: when t = 0 (i.e., a tree positing that a species is found immediately after a cladogenetic event or even a possible cladogenetic event), then we still expect some change. Indeed, if we somehow “knew” the true number of missing cladogenetic events along each branch, then time would cease to be a parameter here; however, as we cannot, we must use m + λt. Wagner and Marcot (Reference Wagner, Marcot, Alroy and Hunt2010) show that when t = 0, then the expected change converges on m + λt as we consider increasing numbers of possible events weighted by the probability of that many cladogenetic events given λt. Finally, note that it is not necessary to add a parameter to assess the probability that we have missed 1, 2, 3, etc., ancestors along each branch simply because this is already part of the prior probabilities of each branch assuming a fossilized birth–death or similar process (see Foote et al. Reference Foote, Hunter, Janis and Sepkoski1999; Heath et al. Reference Heath, Huelsenbeck and Stadler2014).
Cladogenesis Rates
Two issues immediately arise from tying expected character change to rates of cladogenesis (λ). One is whether allowing two parameters (λ and ε) instead of just one (α) to generate the likelihoods of possible evolutionary histories might unduly bias tests toward favoring punctuated equilibrium models. Another is how we go about including λ in phylogenetic analyses. Because the latter informs on the former, we will first review how Bayesian analyses incorporate diversification and sampling rates.
Bayesian phylogenetic analyses such as the fossilized birth–death (FBD) model (e.g., Stadler Reference Stadler2010; Heath et al. Reference Heath, Huelsenbeck and Stadler2014) assess the prior probability of branch durations on phylogenetic topologies based on rates of cladogenesis (λ), extinction (μ), and sampling (ψ) (Fig. 2). Sampling (ψ) alone affects the probability that we fail to sample either an earlier member of a lineage or some direct ancestor to one or more sampled taxa over time t (Wagner Reference Wagner1995a; Foote Reference Foote1996b). Cladogenesis (λ) affects the probability that 0…N cladogenetic events will happen over that time, and the combination of λ, μ, and ψ affect the probability that we would fail to sample any descendants of each cladogenetic event (Foote et al. Reference Foote, Hunter, Janis and Sepkoski1999; Stadler Reference Stadler2010; Bapst Reference Bapst2013; Didier et al. Reference Didier, Fau and Laurin2017). Thus, λ has a major effect on the posterior probability of a tree regardless of the model of character change (Fig. 2A), and using λ to co-determine expected character change does not introduce any new parameters into our model (Fig. 2B).
Graphical model for Bayesian analyses of evolutionary histories with varying rates of origination, extinction, and sampling over time and constant rates of change among characters and over time. In each graph, the likelihood component is on the left and is evaluated by character data, whereas the prior probability component is on the right and is evaluated by first appearance data. A, Continuous change, where the matrix of transition probabilities (Q) reflects the instantaneous rates of change (α) and duration of branches from a particular phylogeny (t). B, Punctuated change, where Q reflects the probability of change per branching event (ε) and t. Although allowing Q to reflect two parameters can increase the likelihood component of the posterior probability, this also demands that cladogenesis rate (λ) satisfies both first appearance and character data.
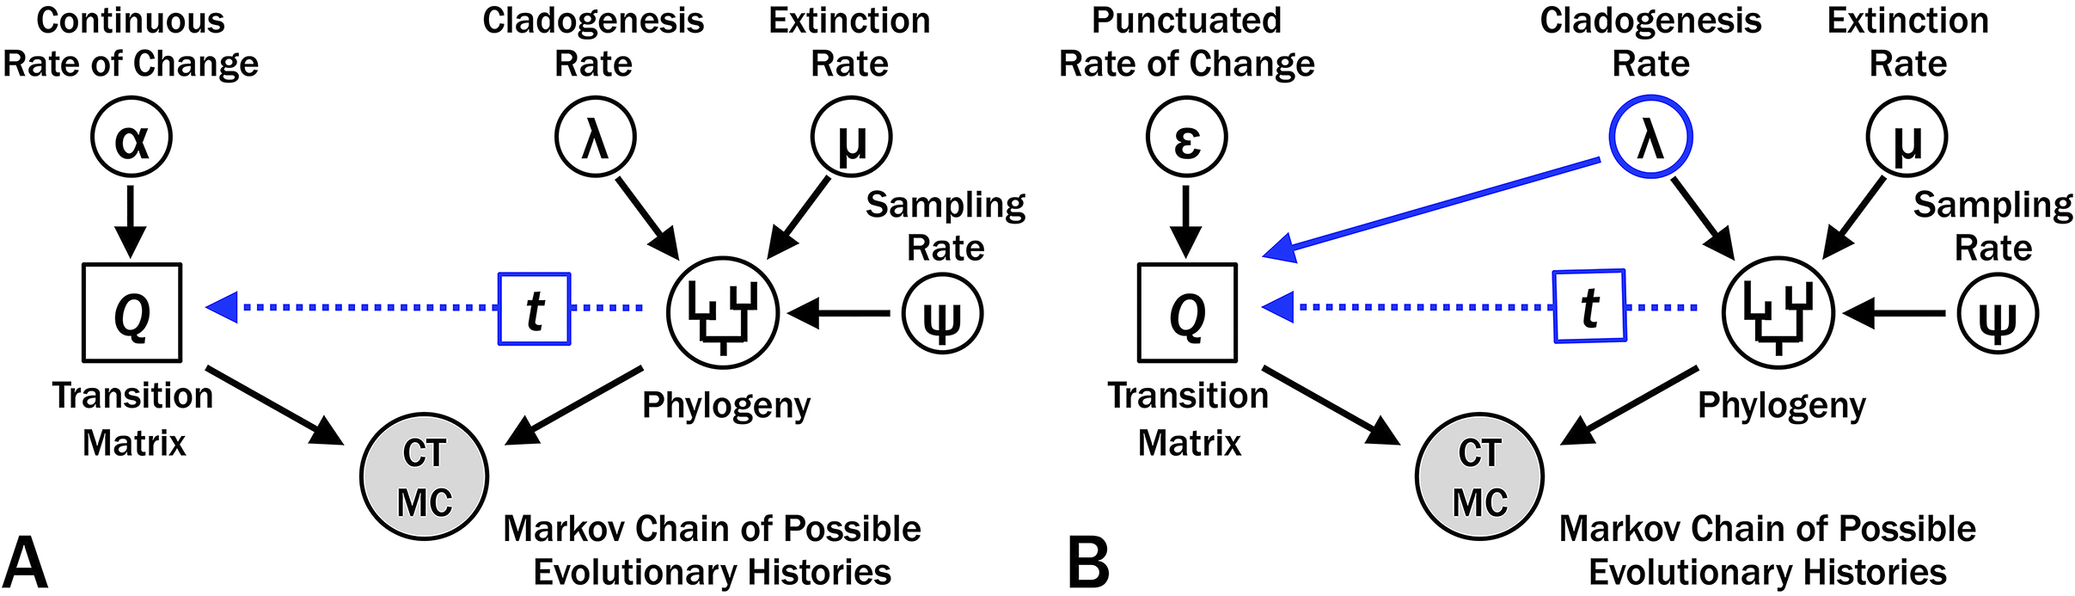
As described elsewhere (e.g., Wright Reference Wright2019; Wright et al. Reference Wright, Wagner and Wright2021, Reference Wright, Bapst, Barido-Sottani and Warnock2022), we can make numerous modifications to the basic models illustrated in Figure 2 that relax assumptions about homogeneity of rates. We would make identical modifications to both the continuous‑time and punctuated models in Figure 2 in order to allow for rate variation among characters (e.g., gamma or lognormal vs. invariant rates; e.g., Yang Reference Yang1994; Wagner Reference Wagner2012; Harrison and Larsson Reference Harrison and Larsson2015) or over the phylogeny (e.g., relaxed vs. strict clocks; e.g., Sanderson Reference Sanderson1997; Drummond et al. Reference Drummond, Ho, Phillips and Rambaut2006). Skyline models (e.g., Stadler Reference Stadler2011; Stadler et al. Reference Stadler, Kühnert, Bonhoeffer and Drummond2013; Warnock et al. Reference Warnock, Heath and Stadler2020) allow for the temporal variation in diversification (or sampling) rates of the sort that innumerable paleobiology studies document (e.g., Krug and Jablonski Reference Krug and Jablonski2012; Alroy Reference Alroy2015; Foote et al. Reference Foote, Cooper, Crampton and Sadler2018, Reference Foote, Edie and Jablonski2024; Lowery and Fraass Reference Lowery and Fraass2019; Foote Reference Foote2023). Under Skyline FBD models, an X Myr branch duration in an interval with high λ usually will have a lower probability than will an X Myr duration in an interval with low λ (see Wagner Reference Wagner2019). This is where the continuous-time and punctuated models might yield very different results, particularly if we are using “strict clock” models for both α and ε. Variation in λ over time will allow shifts in expected amounts of change per million years, even under constant ε. However, λ is simultaneously evaluated by the prior probabilities of branch durations: as λ increases, the probability of shorter branches increases, and as λ decreases, the probability of shorter branches increases (see, e.g., Wagner Reference Wagner2019). Thus, we cannot freely vary λ to maximize how well constant (i.e., strict clock) ε maximizes the probability of the character data. Instead, the punctuated model should result in high posterior probabilities relative to the continuous-time model only if increasing or decreasing origination rates to improve likelihood given character data also improves prior probabilities given stratigraphic data.
Data and Analyses
We examine 37 Ordovician genera from the brachiopod superfamily Strophomenoidea based on character data published by Congreve et al. (Reference Congreve, Krug and Patzkowsky2015; data available from Congreve et al. [Reference Congreve, Patzkowsky and Wagner2021b]) Strophomenoids appear during the Middle Ordovician and are one of the two superfamilies (along with the Plectambonitoidea) that contribute most to the diversification of “articulate” brachiopods during the Great Ordovician Biodiversification Event (GOBE) (Harper et al. Reference Harper, Rasmussen, Liljeroth, Blodgett, Candela, Jin, Percival, Rong, Villas and Zhan2013). Congreve et al. (Reference Congreve, Patzkowsky and Wagner2021a) show that the clade displays an early burst of morphological disparity that coincides with elevated rates of change per million years given phylogenies consistent with the cladogram published by Congreve et al. (Reference Congreve, Krug and Patzkowsky2015). However, those elevated rates themselves coincide with similar peaks in origination rates, leading Congreve et al. (Reference Congreve, Patzkowsky and Wagner2021a) to suggest that the early burst might reflect elevated frequencies of punctuated change rather than changes in the basic evolvability of strophomenoid shells. The former interpretation is more in keeping with predictions of “empty ecosytems” driving morphological change rather than “relaxed intrinsic constraints” (e.g., see Valentine Reference Valentine1969, Reference Valentine1980) and thus highlights the potential importance of being able to distinguish between continuous‑time and punctuated character change models when addressing other macroevolutionary issues.
We conduct analyses in RevBayes (Höhna et al. Reference Höhna, Landis, Heath, Boussau, Lartillot, Moore, Huelsenbeck and Ronquist2016). The following aspects of the punctuated and continuous‑time analyses are identical for both analyses. Both analyses assume lognormal rate variation among characters, as prior analyses indicate that this fits better than gamma or invariant distributions (Wagner Reference Wagner2012; Harrison and Larsson Reference Harrison and Larsson2015). Both use a 12-bin Skyline model, with chronostratigraphic partitions reflecting the Ordovician stage slices proposed by Bergström et al. (Reference Bergström, Chen, Gutiérrez–Marco and Dronov2009) and the Ordovician timescale given in Gradstein et al. (Reference Gradstein, Ogg, Schmitz and Ogg2020), although after lumping some of the relatively brief stage slices (see Congreve et al. Reference Congreve, Patzkowsky and Wagner2021a). We used sampling (ψ) and origination (λ) rates derived from published birth–death sampling analyses (Congreve et al. Reference Congreve, Patzkowsky and Wagner2021a) for the initial rates, but we then allowed these rates to vary over the analyses. These rates are given in the RevBayes scripts provided in the Supplementary Material. Following Wright et al. (Reference Wright, Wagner and Wright2021), we did not have extinction (μ) vary independently of origination; instead, we use a separate “turnover” parameter (i.e., μ/λ) that follows a lognormal distribution matching substage variation in relative extinction and origination rates found in empirical studies. Finally, the upper and lower bounds of the first appearance times for the analyzed taxa reflect the earliest and latest possible dates of the oldest species in each genus based on data in the Paleobiology Database (PBDB). However, instead of the dates given by the PBDB, we use an extrinsic database (see Congreve et al. Reference Congreve, Patzkowsky and Wagner2021a) that restricted possible first appearances to conodont or graptolite zones, with the ages of those zones again derived from Gradstein et al. (Reference Gradstein, Ogg, Schmitz and Ogg2020). We could not implement the complex compound beta distributions for possible first appearance dates used in Congreve et al. (Reference Congreve, Patzkowsky and Wagner2021a); therefore, the analyses assumed a uniform distribution of possible ages within those upper and lower bounds (see Barido-Sottani et al. Reference Barido-Sottani, Aguirre-Fernández, Hopkins, Stadler and Warnock2019). Barido-Sottani (Reference Barido-Sottani, Aguirre-Fernández, Hopkins, Stadler and Warnock2019; see also O’Reilly and Donoghue Reference O’Reilly and Donoghue2020) recommend using the entire stratigraphic range of taxa for the upper and lower bounds of a taxon’s stratigraphic range as the possible “true” first appearance age, noting that the failure to allow for this uncertainty biases the results. However, those authors did not consider “boundary crosser” taxa sensu Foote (Reference Foote2001) In this study, every analyzed taxon spans multiple conodont and graptolite zones, which means that only some of the finds might represent the oldest (or youngest) occurrences (see also Wright et al. Reference Wright, Wagner and Wright2021). For datasets like strophomenoid brachiopods, using the entire stratigraphic range biases results toward finding divergences after the oldest possible first appearance of a taxon.
For the purposes of this study, we use invariant rates (= strict clocks) for both continuous‑time (α) and punctuated (ε) rates of change. The sole difference in the two sets of analyses is that in the punctuated analysis, the rate of character change was set by ε, the “local” cladogenesis rate (λ i) and the minimum branching events (m). For branches spanning 2+ stage slices, the expected change from cladogenesis in addition to m is given by:
 $$ \varepsilon \times \sum_{i=1}^n{\lambda}_i{t}_i $$
with ∑ti equaling the branch duration. We accomplished this by: (1) dividing each branch into 100 kyr intervals; (2) referring to the origin time of each branch on each particular phylogeny; and (3) setting the rate of change to ελ i where λ i is the origination rate during that 100 kyr time slice (see Supplementary Material). We set m to 0.5 for all branches, because this was a genus-level analysis and we had no strong intuition of which branches the cladogenetic events should sit on. Even if a particular phylogeny has: (1) one genus as ancestral to another, and (2) both genera coexisting, it is possible that the branching event allowing 2+ lineages to coexist happened within the paraphyletic genus, while the “derived” genus represents greater amounts of continuous anagenetic change. This neglects the possibility that an ancestral genus might disappear before the first appearance of the derived genus. Unfortunately, current implementations of Markov chain Monte Carlo (MCMC) phylogenetic analyses do not include last appearance data and thus treat each taxon as a single occurrence in time (but see Warnock et al. Reference Warnock, Heath and Stadler2020). Fortunately, initial analyses (e.g., Congreve et al. Reference Congreve, Krug and Patzkowsky2015) do not suggest this happened within the clade, and most of the genera have wide ranges with apparent close relatives usually coexisting. As we will discuss later, using first and last appearance data that will allow phylogenetic algorithms to recognize the different scenarios illustrated in Figure 1 is an area that requires further development.
We set up each of our models in RevBayes 1.2.1 (Höhna et al. Reference Höhna, Landis, Heath, Boussau, Lartillot, Moore, Huelsenbeck and Ronquist2016). Additionally, we collected the following statistics from RevBayes: the Colless imbalance (Colless Reference Colless1995) of the trees, and tree length to be used for contrasting the results. We ran the models until convergence, as assessed in the software tracer (about 1 million generations per estimation). RevBayes returns both trees and parameter estimates in a tab‑separated format. We then processed results in the R programming environment using both our own scripts and existing programs (R Core Team 2018; Paradis and Schliep Reference Paradis and Schliep2019).
Ideally, we would contrast the results from the two models using tests such as stepping-stone analyses (Xie et al. Reference Xie, Lewis, Fan, Kuo and Che2011). Unfortunately, our implementation of the punctuated model results in very slow run times: whereas the continuous-time model requires approximately 12 hours on a fast laptop to execute 1 million MCMC generations, the punctuated model requires more than 2 months on the same device. Because methods such as stepping stone require multiple replications (usually 20), it was not possible to complete them using the punctuated model at the present time.
Results
Relative Success of Continuous-Time and Punctuated Models
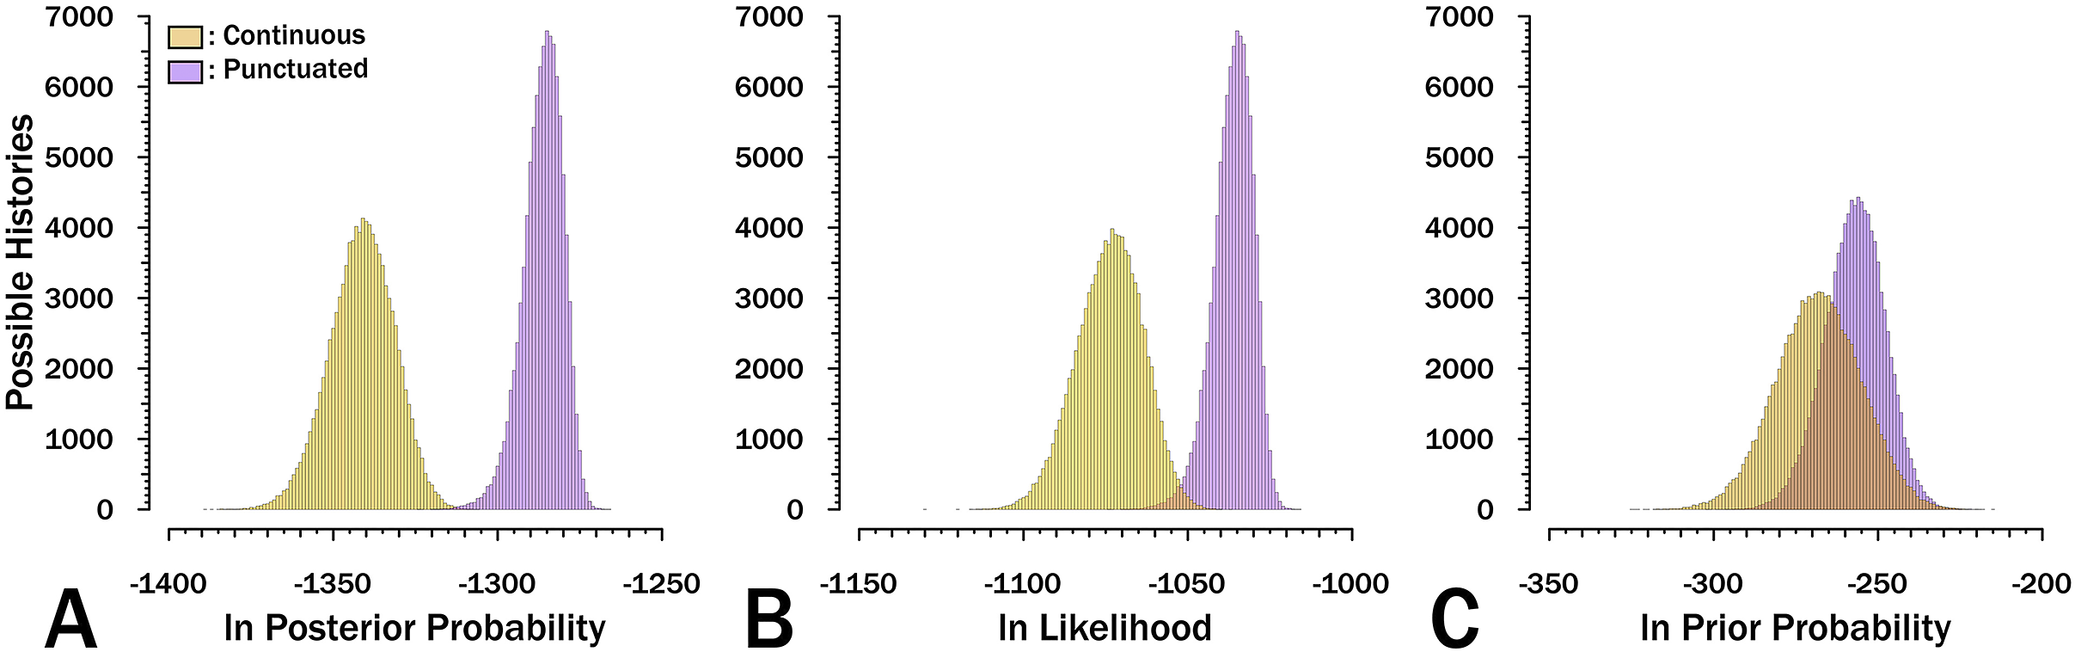
Evolutionary histories of strophomenoid brachiopods with punctuated change are much more probable than are those with continuous change (Fig. 3A). In general, the most probable histories assuming continuous change are only slightly better than are the least probable histories assuming punctuated change. The distribution in log-posteriors is much more peaked and restricted for the punctuated model than for the continuous-time model. Because the MCMC analyses achieve solid convergence under both models (Supplementary Fig. 1), we have no reason to suspect that longer runs would find continuous histories that rival or exceed the best punctuated histories.
Distribution of results for 105 possible evolutionary histories for strophomenoids saved from 106 total generations. A, Posterior probabilities. B, Log likelihoods, which describe how well either αt or ε(m + λt) predict the character matrix across the phylogeny particular to a given evolutionary history. C, Log prior probabilities, which describe how well λ, μ, and ψ predict the branch durations of the corresponding phylogeny given the range of possible first appearances for the 37 analyzed strophomenoids.

Although workers rarely contrast the differences in priors and likelihoods independently, it is instructive to do so here. The prior probabilities overlap substantially, but not entirely, due to the differences in the model reflected in Figure 2. The difference in log-posterior probabilities is driven much more by the differences in log‑likelihoods than in differences in log‑priors (Fig. 3B vs. Fig. 3C). This can be seen in both the differences in values and in how much more constrained and peaked the punctuated posteriors and likelihoods are relative to the continuous posteriors/likelihoods. That likelihood drives the posteriors more than the priors do is unsurprising, given that both models used identical skyline models to parameterize diversification and sampling that would favor identical trees if we ignored the likelihood component as is done in the final stages of stepping-stone analyses (Xie et al. Reference Xie, Lewis, Fan, Kuo and Che2011). Thus, the fact we see the same pattern (albeit less dramatically) for the priors, in which the prior probabilities of the phylogenetic topologies under punctuated histories tend to be both higher and more concentrated around the central values, is noteworthy. This indicates that the punctuated model does a better job than the continuous‑time model of favoring phylogenetic topologies like those we would get if we simulated trees under the same range of diversification and sampling parameters. We should expect the opposite pattern if the continuous‑time model is correct, that is, with the prior probabilities of the punctuated trees generally being lower and more broadly distributed, simply because that model expects high amounts of change coinciding with the high cladogenesis rates that generate many short branches on phylogenies, but instead would find reduced change on the shorter branches. Although we were unable to execute stepping-stone analyses, a basic premise of such tests is that better models should show better overlap between likely and probable results than should worse models. This already can be seen in the basic results.
Finally, when we run the model under the priors alone (i.e., without data), we find that parameters such as cladogenesis rates in a given time bin are heavily influenced by the prior. This is to be expected, as a given time bin may not contain fossils from which speciation can be calculated. Other parameters, such as fossil ages and origin times are not heavily influenced by the prior.
Apparent Rates of Character Change
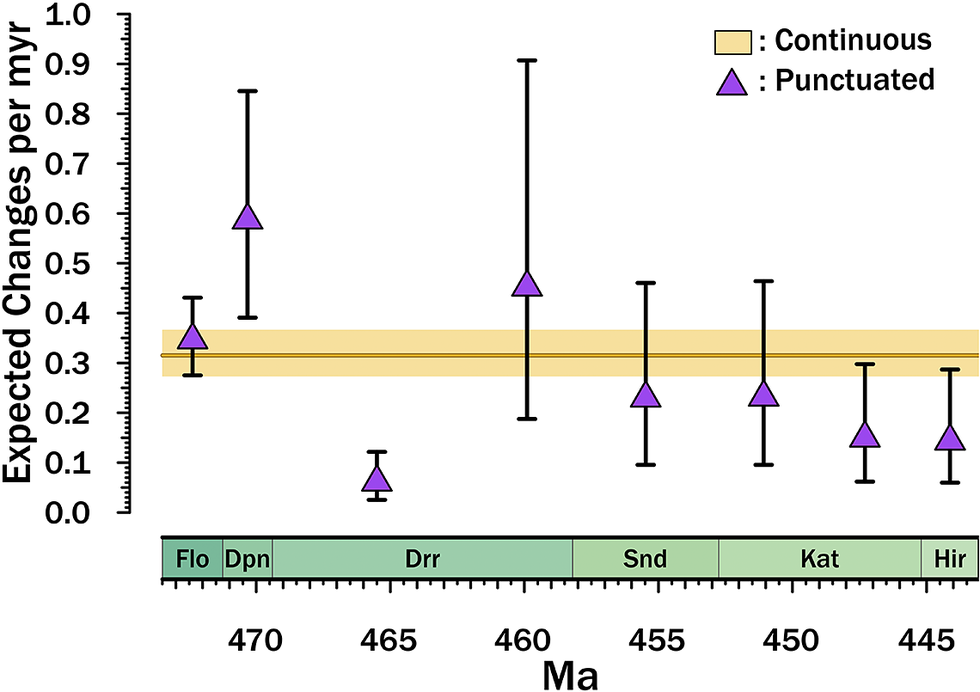
Both models employ strict clocks (i.e., the same rates of character change over the entire tree), which means that either α (continuous-time) or ε (punctuated) are the same on all branches. However, heterogeneity in cladogenesis rates (λ) over stage slices results in considerable temporal variation in expected rates of change per million years under the punctuated model (Fig. 4). the Dapingian and late Darriwilian (Dw3 of Bergström et al. [Reference Bergström, Chen, Gutiérrez–Marco and Dronov2009]) both elevate expected change substantially under the punctuated model despite constant ε. Conversely, relatively low cladogenesis rates in the Late Ordovician yield an apparent quiescence in expected amounts of change.
Implied rates of character change per million years. Dark orange line gives the median α from the Markov chain Monte Carlo (MCMC) runs with the 25th–75th percentile distributions shown by the pale orange bar. Purple triangles give the median ελ i from the MCMC runs with brackets encompassing the 25th–75th percentile distributions, with λ i being the cladogenesis rate for the stage slice in question. These therefore are directly proportional to the distribution of λ within and among stage slices. For each MCMC iteration, α and ε reflect the median of the lognormal distributions of rate. Finally, note that this excludes the effect of the minimum number of branching events, which means that each branch is expected typically 0.21 changes in the punctuated models in addition to those expected from ελ i. Note that most MCMC iterations place the divergence of the analyzed taxa in the earliest Darriwilian (Drr) or latest Dapingian (Dpn); thus, the Darriwilian through Hirnantian (Hir) points are the ones of primary interest to this study. Flo, Floian; Snd, Sandbian; Kat, Katian.

Phylogenetic Relationships
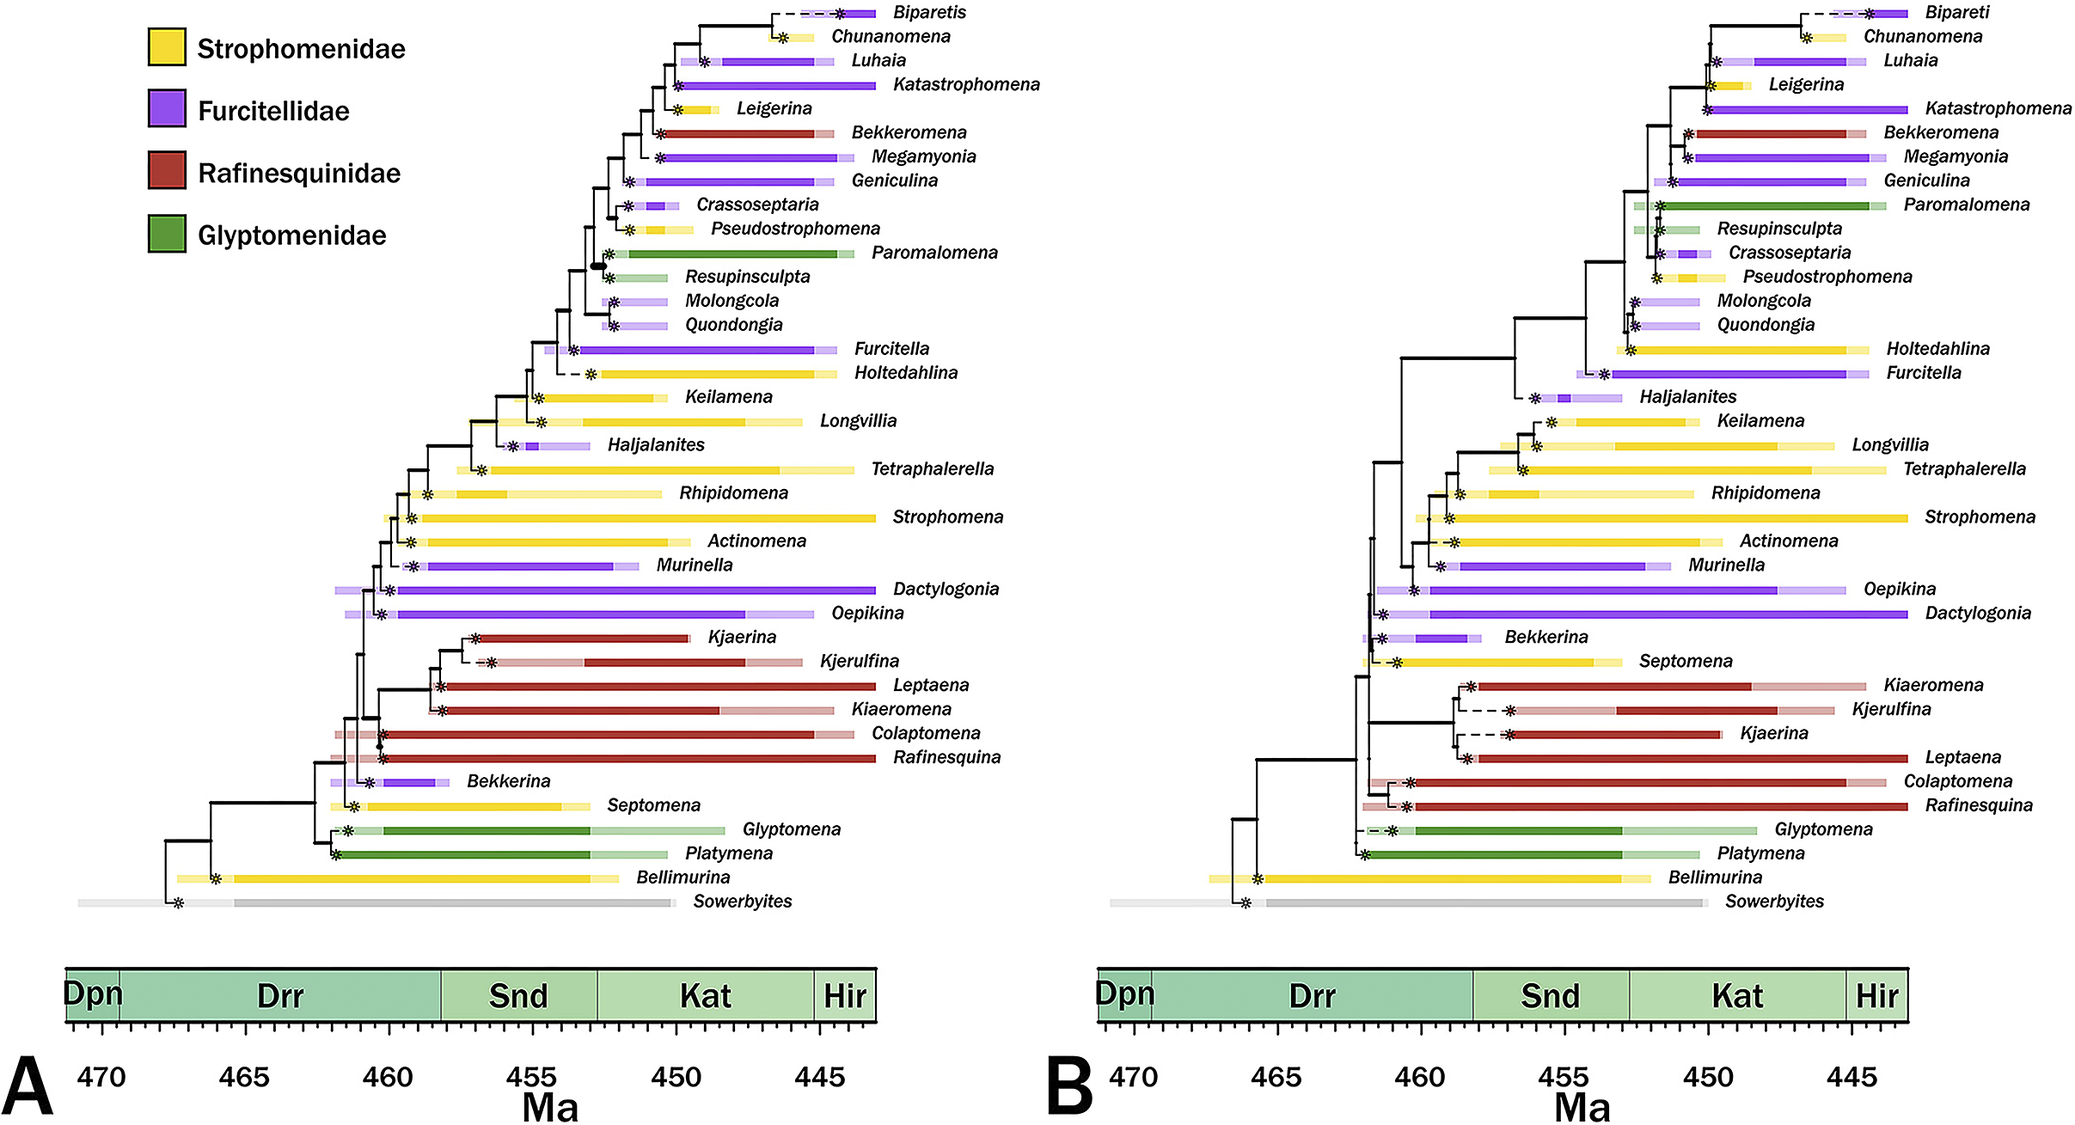
The maximum credibility trees given continuous and punctuated change histories are generally similar, differing more in implied divergence times than in cladistic relationships (Fig. 5). Both trees imply similar patterns of polyphyly among three of the families while suggesting that one (the Rafinesquinidae) is one taxon away from monophyletic. The primary difference between the two trees is that the continuous-time model has a fairly even distribution of branch durations, whereas the punctuated tree contains more heterogeneous distribution, with both more long and very short branch durations (Figs. 5, 6); however, for the most part, this changes the exact nature of the same general relationships rather than changing general relationships.
Maximum credibility trees for continuous‑time (A) and punctuated (B) models. Colors denote current family assignments. Bold portions denote necessary (range‑through) stratigraphic ranges, and pale spans denote ranges of possible first or last occurrence ages. Asterisks denote the most probable origins given the analyses. Dpn, Dapingian; Drr, Darriwilian; Snd, Sandbian; Kat, Katian; Hir, Hirnantian.
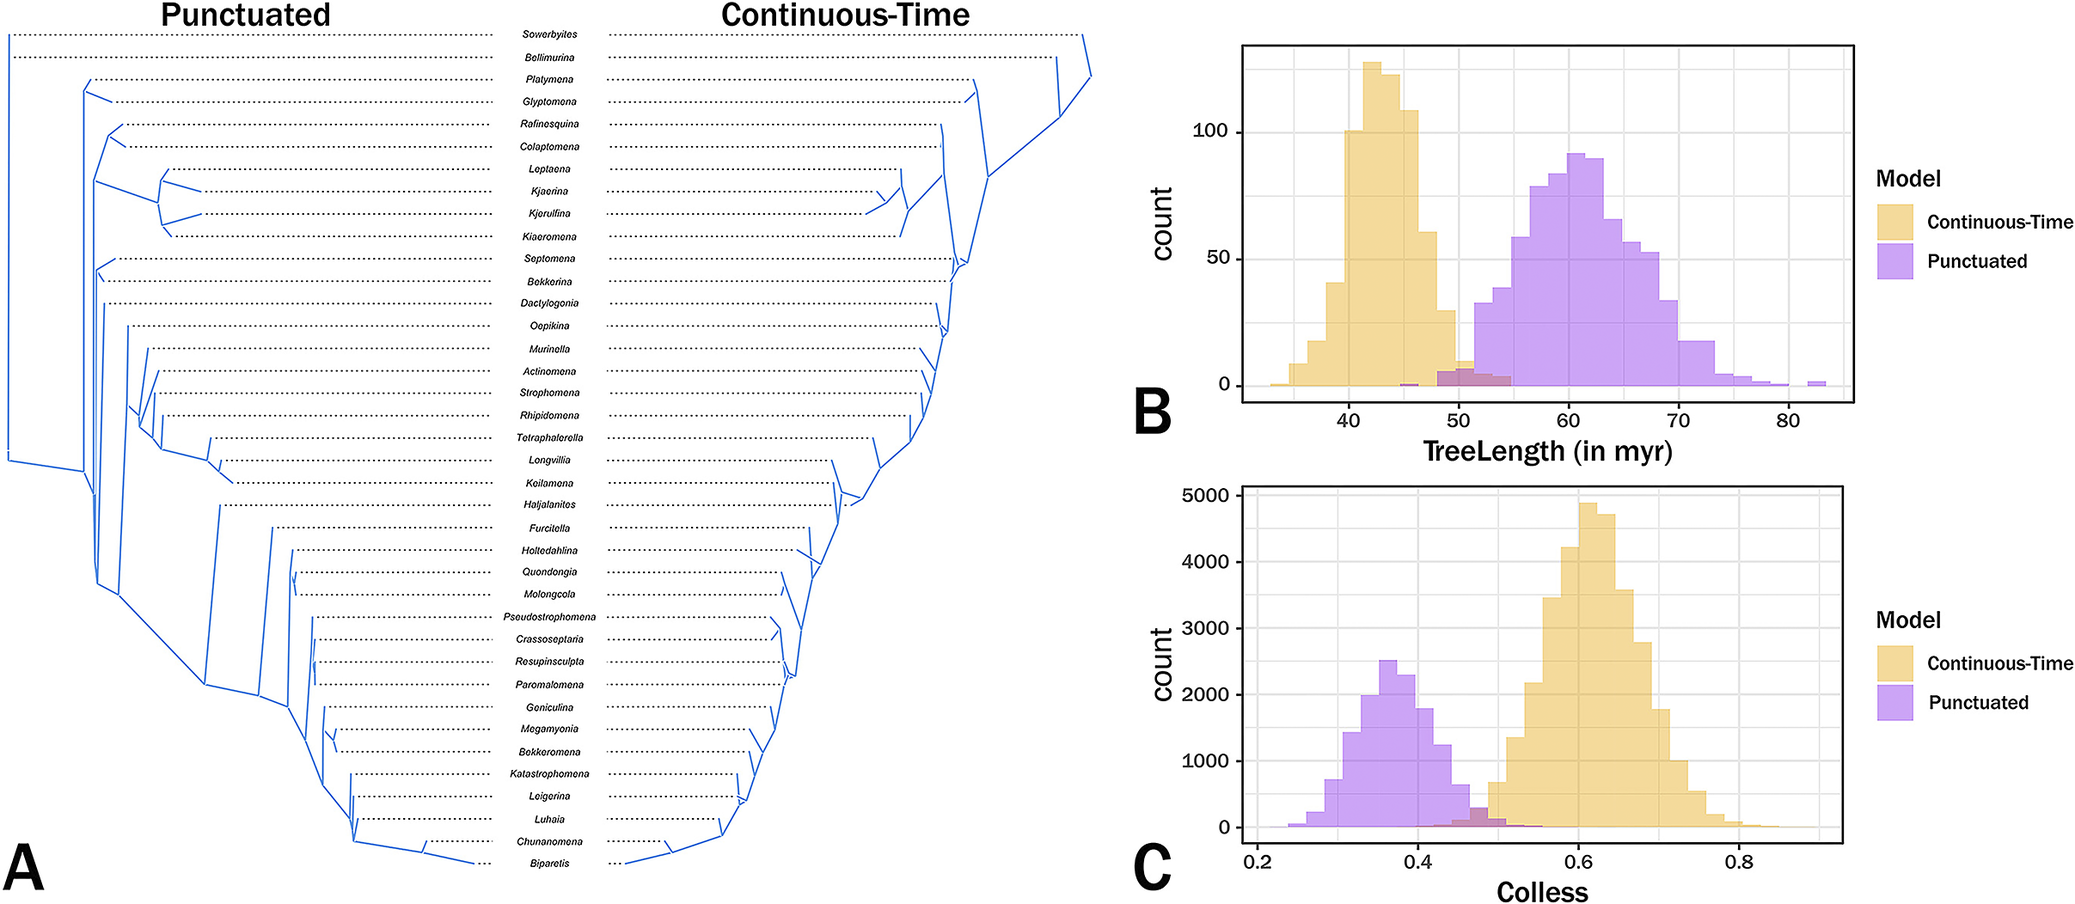
Tree contrasts. A, Tanglegram contrasting cladistic topologies and branch durations of the maximum credibility trees. B, Distribution of summed branch durations (TreeLength) across Markov chain Monte Carlo (MCMC) generations. C, Distribution of Colless balance across MCMC generations, where 0 represents maximum balance and 1 represents maximally pectinate topologies.
Discussion
Punctuated Character Change among Strophomenoid Brachiopods
Our analyses strongly support the notion that anatomical change within the Ordovician Strophomenoidea is tied to speciation rates and thus consistent with the punctuated equilibrium model. The elevated likelihoods of punctuated histories indicate that the variation in “rates” of change over time generated by temporal variation rates in branching rates do a very good job of predicting anatomical evolution among strophomenoids. It is equally noteworthy that the prior probabilities are generally better given punctuated change histories than given continuous change histories. As we noted earlier, demanding that origination rates predict both branch durations and the distribution of character states among taxa means that the origination rate parameter must make reasonable predications about both rates of branching and rates of morphological diversification. If character change is continuous and cladogenesis rates vary, then intervals of high cladogenesis should generate many short branches with little character change. High cladogenesis rates elevating branch duration priors will receive reduced likelihoods under the punctuated model due to the lack of change along those branches. Conversely, low cladogenesis rates predicting reduced change along branches will elevate the likelihoods under punctuated change but reduce the priors of the short branch durations.
Our results also suggest that the range of data that we can use to assess punctuated change versus continuous change models is broader than we usually assume. Traditionally, these analyses have focused on species-level studies that relied on contrasting (lack of) change within lineages with apparent change between lineages. Here, we can show at the genus level that explicitly tying rates of change to cladogenesis rates greatly elevates the likelihoods and posterior probabilities of evolutionary histories, and thus is sufficient for assessing a key component of the punctuated equilibrium model.
Macroevolutionary Implications
This study corroborates Congreve et al.’s (Reference Congreve, Patzkowsky and Wagner2021a) suggestion that the elevated rates of change per million years underlying a burst of disparity during the later Darriwilian among early strophomenoid brachiopods was driven at least in part by punctuated change coupled with elevated cladogenesis. This coincides with the peak of the final phase of the GOBE, in which origination rates were very high for numerous groups (e.g., see Servais et al. Reference Servais, Owen, Harper, Kröger and Munnecke2010; Stigall Reference Stigall2018; Thomas et al. Reference Thomas, Borja and David2021). These patterns in turn relate to “loose genes” versus “empty ecospace” notions of what might drive early bursts in disparity (Valentine Reference Valentine1969, Reference Valentine1980). Because “diversity‑dependent” models such as logistic diversification generate elevated cladogenesis rates (λ) under empty ecospace scenarios, we expect punctuated change plus rapid radiation to generate high disparity. Of course, this is an incomplete representation of the empty ecospace model, as the original concept focused on relatively lax selection allowing more change than “usual” rather than on elevated cladogenesis rates (e.g., Valentine Reference Valentine1969). Thus, like the loose gene models, the empty ecospace model posits (or can posit) elevated α or ε as well as elevated λ. Were the point of this paper to fully evaluate strophomenoid evolution during the GOBE, the next step would be to use “relaxed clock” models (see Wright et al. Reference Wright, Wagner and Wright2021), in which ε varies over time in order to assess whether we do see declining amounts of change per speciation event over time. Moreover, because alterations of modularity or other variations of loose gene models might help trigger adaptive radiations (e.g., Wagner and Müller Reference Wagner and Müller2002), one would need to partition characters based on inferred ecological roles in order to better assess whether reduced internal constraints or relaxed ecological restrictions drive elevated ε (e.g., Foote Reference Foote1994; Wagner Reference Wagner1995b; Ciampaglio Reference Ciampaglio2002, Reference Ciampaglio2004; see Wright et al. Reference Wright, Wagner and Wright2021). However, the primary point for this study is that speciation models are a critical nuisance parameter when trying to distinguish between basic explanations for rapid increases in morphological disparity. At least in the case of Ordovician strophomenoids, elevated early disparity is at least partially explained solely by elevated punctuated speciation.
Effects on Inferred Phylogeny
The maximum credibility trees under both continuous change and punctuated change are generally similar, which indicates that the basic patterns are embedded in the character state and stratigraphic range data. We obviously cannot know which tree is more accurate and the tanglegram of the maximum credibility trees (Fig. 6A) shows that the trees are very similar. Despite the generally higher prior probabilities for the punctuated model, the continuous‑time model generates trees that typically have shorter branches than do the punctuated change tree (Fig. 6B). This general finding is expected if the continuous‑time model is generally more accurate than the punctuated model (Wagner Reference Wagner2000; Wright and Lloyd Reference Wright and Lloyd2020). However, the punctuated model also tends to generate shorter branches at the base of the tree (Figs. 5, 6A), which coincides with the clade’s early burst (Congreve et al. Reference Congreve, Patzkowsky and Wagner2021a). Moreover, trees from punctuated change history also tend to be somewhat more symmetrical (= “balanced”; i.e., possessing greater proportions of sister taxa that are both clades rather than one clade and one analyzed taxon) than are trees from continuous change histories (Colless Reference Colless1995; Fig. 6C, where 1.0 means a completely “pectinate” or imbalanced tree), which is expected if the punctuated model is generally more accurate than the continuous change model (Huelsenbeck and Kirkpatrick Reference Huelsenbeck and Kirkpatrick1996). This reflects in part the major topological difference: punctuated analyses separate an Oepkinia clade from a Haljalanites clade with long branches connecting the basal members of the latter clade to the rest of the tree, whereas the continuous‑time analyses nest the Haljalanites clade within a larger Oepkinia clade. Although the differences between the maximum credibility trees (and thus the preponderance of the probable trees used to generate those maximum credibility trees) are not great, the fact that they exist suggests that punctuated versus continuous change represents yet another set of parameters that paleophylogeneticists should consider when assessing phylogeny for its own sake (see Warnock and Wright Reference Warnock and Wright2021; Wright et al. Reference Wright, Wagner and Wright2021). Future work should concentrate on how common these differences in general shape and total branch durations are when contrasting these models.
What If Both Punctuated Equilibrium and Phyletic Gradualism Happen within the Same Clade?
One obvious “flaw” with our approach is that we currently treat punctuated and continuous-time models as an “either/or” scenario. However, studies using morphometric data indicate that both can happen within the same clade even if one model predominates (e.g., Hunt Reference Hunt2013; Hunt et al. Reference Hunt, Hopkins and Lidgard2015). If this is true for morphometric characters, then we should assume that it also is true for discrete characters. Wagner and Marcot (Reference Wagner, Marcot, Alroy and Hunt2010) note that the expected amount of change along any branch linking taxa to nodes (or nodes to other nodes) under a mixed model is:
 $$ \varepsilon m+\left(\alpha +\varepsilon \lambda \right)t $$
The “strict” punctuated equilibrium and “strict” phyletic gradualism models we use here both are special cases of this in which either α = 0 or ε = 0.
A second obvious “flaw” with our analyses, and a major difference between our study and the previously cited studies using morphometric data, is that our approach focuses entirely on differences among taxa: we do not assess the probability of apparent stasis within lineages. Although the punctuated model predicts restricts change to cladogenetic events, the continuous‑time model makes no such distinction, and α predicts the same amounts of change within species as it does “between” sampled taxa over the same amount of time. Now, we need the upper and lower bounds of possible last occurrences as well as first occurrences. The simplest analytical approach would vary the first and last appearances within the lower and upper bounds of the oldest possible finds and youngest possible finds for each species X, calculate t
X as the span between them, and then calculate the likelihood of the continuous-time model given net stasis over t
X. Thus, continuous‑time model does not forbid apparent stasis: there is both some chance that all the characters failed to change (which increases as t
X decreases) and also some chance that multiple changes take those characters that do change back to their original conditions. However, when species have long minimum stratigraphic ranges and commonly differ by numerous characters, then static lineages will make high α very unlikely. When taxa are known from 3+ intervals, we could take this a step further by varying not just the first and last appearance ages, but also the ages of intermediate finds, and then calculating the probability of net stasis from each assigned age of occurrences within t
X. This would come closer to the comparable morphometric studies, which usually use within-species gaps as the intervals for accumulating anagenetic change. This also would greatly reduce the likelihood of continuous‑time models, as the probability of 2+ changes taking lineages back to the original conditions would be greatly reduced and thus provide stronger evidence of stasis. For example, suppose that we have a species with oldest and youngest finds separated by 2 Myr. If there are no other finds, then the probability of net stasis for a binary character with α = 0.025 is
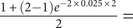 $ \frac{1+\left(2-1\right){e}^{-2\times 0.025\times 2}}{2}= $
0.9524; if there is a third find halfway through the range, then the probability of net stasis drops slightly to
$ \frac{1+\left(2-1\right){e}^{-2\times 0.025\times 2}}{2}= $
0.9524; if there is a third find halfway through the range, then the probability of net stasis drops slightly to
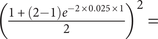 $ {\left(\frac{1+\left(2-1\right){e}^{-2\times 0.025\times 1}}{2}\right)}^2= $
0.9518, as we are forbidding reversed changes halfway through the 2 Myr span; if there are 10 additional finds equally spaced throughout, then the probability of net stasis drops to
$ {\left(\frac{1+\left(2-1\right){e}^{-2\times 0.025\times 1}}{2}\right)}^2= $
0.9518, as we are forbidding reversed changes halfway through the 2 Myr span; if there are 10 additional finds equally spaced throughout, then the probability of net stasis drops to
 $ {\left(\frac{1+\left(2-1\right){e}^{-2\times 0.025\times 0.2}}{2}\right)}^9= $
0.9513, as we now forbid reversed changes at several points throughout the span. However, this would almost certainly make MCMC analyses of most marine invertebrate clades intolerably slow, as it would require allowing the ages of “intermediate” finds to vary in the same way that analyses currently vary the possible first appearance age. Thus, we will probably have to settle for analyses that are slightly biased toward exaggerating the likelihood component of the best continuous‑time models.
$ {\left(\frac{1+\left(2-1\right){e}^{-2\times 0.025\times 0.2}}{2}\right)}^9= $
0.9513, as we now forbid reversed changes at several points throughout the span. However, this would almost certainly make MCMC analyses of most marine invertebrate clades intolerably slow, as it would require allowing the ages of “intermediate” finds to vary in the same way that analyses currently vary the possible first appearance age. Thus, we will probably have to settle for analyses that are slightly biased toward exaggerating the likelihood component of the best continuous‑time models.
An issue directly related to stasis and prolonged stratigraphic ranges/temporal durations is the possibility of budding cladogenesis. Indeed, it is often forgotten that the study initiating the punctuated equilibrium debate was a “tree-based” study in which phylogenetic reconstruction of Devonian trilobites suggested that ancestral species survived extinction rates and sometimes generated what we now call polytomies on cladistic depictions of relationships (Eldredge Reference Eldredge1971). The maximum credibility trees given either punctuated or continuous change models (Fig. 5) both include the same improbable pattern: numerous long-ranging genera are not reconstructed as “ancestral” (paraphyletic) relative to any other genera (e.g., see Foote Reference Foote1996b; Fig. 1C,D). The same issue would be true if this were a species‑level phylogeny with numerous long‑ranging genera: just as α predicts character change over a species’ lifetime, λ predicts that the lineage should be just as prone to giving rise to new species as are the unsampled ancestral lineages linking species on a phylogeny (Wagner and Erwin Reference Wagner, Erwin, Erwin and Anstey1995). There are two issues here. One, because current programs such as RevBayes do not include information about stratigraphic ranges, the MCMC searches could not consider that (say) Strophomena was still present when Rhipidomena or Tetraphalerella appeared; thus, the analyses could not consider potentially more probable phylogenies in which one or both taxa “bud” directly from Strophomena. Two, the longer a lineage (or group of closely related lineages) persists, the more sampled descendants we expect them to generate. This means that the prior probability of a polytomy with (say) Strophomena linked as an ancestor to 2+ descendant species should increase as durations increase (e.g., see Wagner Reference Wagner2019). Trees lacking such polytomies but still including long‑lived species should have lower prior probabilities than should trees placing long-lived species at the nodes of polytomies with descendants appearing at different time over the species’ histories. Note that the mode of speciation itself is not important here: under low rates of continuous change, we will expect accidental “stasis” sometimes, and the same expectations would apply to slowly changing anagenetic ancestors as to static ancestors. However, because we expect species with long durations relative to origination rates to be more common under punctuated models than under continuous change models, accommodating “natural polytomies” should be more important when change was punctuated.
Other Future Directions
Finally, future work should also include simulation studies to assess both the efficacy of the model that we propose and when we will be able to distinguish between punctuated, continuous‑time, and mixed models. Like stepping-stone analyses and assessing stasis within lineages, this will again require modifying existing programs to explicitly examine punctuated models rather than scripts such as ours that essentially superimpose punctuated change onto continuous‑time algorithms. Prior simulation studies show that punctuated change reduces the ability of simple phylogenetic algorithms to correctly reconstruct trees (e.g., Wagner Reference Wagner2000), so such studies will also provide insight as to how the wrong speciation model might bias our perceptions of other macroevolutionary patterns.
Conclusions
Punctuated equilibrium presents a model of character evolution that is fundamentally different from the continuous change models currently used in Bayesian and likelihood phylogenetics. In the case of strophomenoid brachiopods from the Ordovician, punctuated character models imply evolutionary histories that are both more probable and more likely than those implied by continuous change models. Moreover, the punctuated model combined with variable diversification rates over time at least partly accounts for an early burst in strophomenoid disparity purely from elevated speciation rates early in the group’s history that elevate the expected numbers of changes per million years without changing the expected numbers of changes per speciation event. Thus, concerns about whether speciation and character change are continuous or punctuated transcend theoretical interest in how speciation operates: it is an important nuisance parameter that can affect our conclusions about hypotheses stemming from seemingly unrelated macroevolutionary theory.
Acknowledgments
We thank the organizers of this special issue for the invitation to submit this work. We would also like to thank N. Eldredge, S. J. Gould, and our other predecessors who provided enough thoughts outside existing boxes that we are still working on expanding the box 50 years later. We also thank two anonymous reviewers for thoughtful reviews that helped clarify some of the concepts we attempt to communicate here. This research was initiated under NSF grants NSF EAR 2129628 to P.J.W. and NSF DEB 2045842 and NSF CIBR 2113425 to A.M.W. This is Paleobiology Database Publication #531.
Competing Interests
The authors declare that they have no competing interests.
Data Availability Statement
RevBayes and R scripts for these analyses are available from the Dryad Digital Repository: https://doi.org/10.5061/dryad.dfn2z35f3.


 Open access