


Introduction
Herbivore foraging is hierarchical over a range of spatial scales: individuals select patches within landscapes, where to forage and what plants to consume within patches (e.g. Bailey et al., Reference Bailey, Gross, Laca, Rittenhouse, Coughenour, Swift and Sims1996; Searle et al., Reference Searle, Thompson Hobbs and Shipley2005). Optimal foraging models suggest that herbivores integrate information on resource quality and quantity (Hopcraft et al., Reference Hopcraft, Anderson, Pérez-Vila, Mayemba and Olff2012), energy intake rates (Fryxell et al., Reference Fryxell, Wilmshurst and Sinclair2004), home ranges or territories (Mitchell & Powell, Reference Mitchell and Powell2012) and predation risk (Valeix et al., Reference Valeix, Loveridge, Chamaillé-Jammes, Davidson, Murindagomo, Fritz and Macdonald2009) when selecting habitat patches in a heterogeneous landscape (e.g. Owen-Smith et al., Reference Owen-Smith, Fryxell and Merrill2010).
For rare or threatened species, a thorough understanding of how individuals identify and select habitat and forage is required for successful management and conservation. This is especially true when management activities, such as fencing, burning, mowing or chemical application, can be targeted at increasing or restoring habitats or forage that may encourage population growth and stability. In African savannahs, natural resource managers use fire as a tool to increase nutrient rich forage for grazers (e.g. Parrini & Owen-Smith, Reference Parrini and Owen-Smith2010), reduce bush encroachment (Dalle et al., Reference Dalle, Maass and Isselstein2006) and control ticks and diseases (e.g. Trollope, Reference Trollope2011). Fire can increase nutrient concentrations in regrowing grasses (Anderson et al., Reference Anderson, Ritchie, Mayemba, Eby, Grace and McNaughton2007) and the ratio of grass to woody plants (Holdo et al., Reference Holdo, Holt and Fryxell2009), both of which favour grazing herbivores. Savannahs also harbour a diverse community of browsing herbivores, but the impact of fire on browser forage quality and quantity is less well understood (but see Ferwerda et al., Reference Ferwerda, Siderius, van Wieren, Grant, Peel, Skidmore and Prins2006).
The black rhinoceros Diceros bicornis is a large-bodied savannah browser that uses hind-gut fermentation for digestion. Illegal poaching during the 20th century decimated black rhino populations across Africa; they are now one of the most threatened large mammals (Emslie, Reference Emslie2012). Prior to 1960 black rhinos were abundant in protected areas throughout their native range and numbered in the hundreds of thousands across Africa (Emslie, Reference Emslie2012). In Serengeti National Park, in northern Tanzania, population estimates in the late 1970s were 400–700 (Frame, Reference Frame1980). By the early 1980s poaching had reduced the population to 10 individuals (Borner, Reference Borner1981; Metzger, et al., Reference Metzger, Sinclair, Campbell, Hilborn, Hopcraft, Mduma and Reich2007). Today, < 50 survive, under heavy surveillance.
Habitat selection by rhinos is positively related to vegetation type, such as thicket and dense savannah for black rhinos in South Africa and forest for Sumatran rhinos, and negatively related to human settlements and roads (Odendaal-Holmes et al., Reference Odendaal-Holmes, Marshal and Parrini2014; Pusparini et al., Reference Pusparini, Sievert, Fuller, Randhir and Andayani2015). Although fire is an important management tool for African savannahs, little is known about how fire influences the black rhino's use of the landscape. Emslie & Adcock (Reference Emslie, Adcock, Penzhorn and Kriek1994b) called fire ‘one of the most important influences on black rhino habitat’, but data on how fire influences rhino spatial occupancy, habitat selection and foraging is scarce. Rhinos in the Ngorongoro Crater fed on charred and resprouting plants in recent burns, suggesting that burning may increase the availability of essential nutrients (Goddard, Reference Goddard1968), and black rhinos in Hluhluwe and Umfolozi game reserves in South Africa preferred recently burnt areas and selected burnt twigs of Acacia, suggesting that burning is beneficial (Emslie & Adcock, Reference Emslie, Adcock, Penzhorn and Kriek1994a). Consequently, we hypothesized that fire would increase the nutritive quality of resprouting tissues and keep woody plants within an accessible height (< 2.5 m; e.g. Kotze & Zacharias, Reference Kotze and Zacharias1993). However, we also considered the alternative hypothesis that fire would reduce the abundance of woody plants and forbs preferred by rhinos in favour of fire-tolerant grasses.
Here we explore fire effects on rhino habitat use and on plant species selectively consumed by rhinos across a range of scales. We adopted a hierarchical approach that investigated rhino selectivity from the landscape scale to the scale of the individual animal and plant species (Fig. 1). At the scale of the landscape, we aimed to identify landscape features, fire regimes (i.e. frequency) and vegetation characteristics that predict rhino habitat use over multiple seasons. At the scale of foraging stations, we asked if rhino foraging was significantly associated with particular plant species. Within foraging stations, we asked if rhinos showed preferences for particular plant species or, alternatively, if they fed indiscriminately. Finally, if rhinos were associated with particular plant species, we asked how their abundance varied with fire frequency.
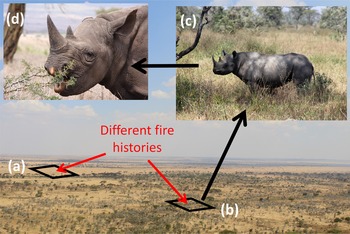
The hierarchical and scale-dependent nature of black rhinoceros Diceros bicornis habitat and forage selection. Rhinos select patches within the landscape, foraging stations within patches and plants for consumption within foraging stations. (a) A grassy site with a history of frequent fire; (b) a woodland site with a history of low fire frequency; (c) a foraging station selected by rhinos within a heterogeneous landscape; (d) rhino selecting low-growing Acacia branches within a given foraging station (background photograph and (c) courtesy of Luisa Arenado; (d) courtesy of Phil Perry).

Methods
Ecosystem and study area
Our study was conducted in Serengeti National Park, part of the 30,000 km2 Serengeti ecosystem between northern Tanzania and southern Kenya. Serengeti vegetation is a mix of edaphic grassland and Acacia–Commiphora deciduous woodlands (White, Reference White1983). A large region of edaphic grassland in the south-east of the Park (i.e. the Serengeti plains) lies over ash-derived volcanic soils (de Wit, Reference de Wit1978). The remaining two-thirds of the Park, to the north and west, are typical wooded savannah habitat overlaying granitic and gneissic soils (Jager, Reference Jager1982). Our study focused on a population of c. 40 rhinos in the Moru region of the Serengeti, between the Serengeti plains to the east and wooded hills to the west. Detailed records and observations of individual rhinos, including identity, behavior and spatial location, were collected opportunistically by Tanzanian National Parks anti-poaching rangers. We used locations of rhinos during a 2-year period (2014–2016) to delineate the 3433 km2 Moru study area.
Habitat selection
We used resource selection functions (e.g. Manly et al., Reference Manly, McDonald, Thomas, McDonald and Erickson2002) to model rhino habitat use in relation to vegetation, topography and fire history. A common approach for resource selection functions, and one that is implemented here, is to use logistic regression with utilized and unutilized sites as binomial response variables (i.e. 1 = utilized, 0 = unutilized) and environmental variables associated with each location as predictors (e.g. Boyce et al., Reference Boyce, Mao, Merrill, Fortin, Turner, Fryxell and Turchin2003; Johnson et al., Reference Johnson, Seip and Boyce2004; Shafer et al., Reference Shafer, Northrup, White, Boyce, Côté and Coltman2012). Utilized habitat was based on 1,740 locations for 31 different rhinos recorded with a GPS between 26 June 2014 and 5 May 2016. The available (but unutilized) habitat was identified by randomly selecting three points within 10 km of each rhino observation, representing an appropriate ratio of utilized to available habitat (Northrup et al., Reference Northrup, Hooten, Anderson and Wittemyer2013). Areas above 1,750 m altitude (e.g. hilltops) were excluded from the available habitat because rhinos avoided these areas during the 2-year observation period. The 10 km distance was chosen for random point selection because it is half the maximum distance travelled in a single day by black rhinos in Namibia (Göttert et al., Reference Göttert, Schöne, Zinner, Hodges and Böer2010).
Landscape variation in topography, vegetation greenness and fire history were extracted for each location using the raster package (Hijmans, Reference Hijmans2016) in R 3.4.2 (R Development Core Team, 2017). Slope was estimated from a global 90 m digital elevation model (Jarvis et al., Reference Jarvis, Reuter, Nelson and Guevara2008). Topographic wetness index (TWI) was calculated from a hydrologically conditioned digital elevation model (Lehner et al., Reference Lehner, Verdin and Jarvis2006). This index combines upslope area, flow direction and slope angle to estimate water accumulation at a point for a given precipitation (e.g. Sörensen et al., Reference Sörensen, Zinko and Seibert2006). As an estimate of vegetation greenness, we created an 8-day near-infrared difference vegetation index (NDVI) using raw reflectance data collected during May 2000–April 2016 by NASA's Moderate Resolution Imaging Spectroradiometer (MOD09GQ; Supplementary Material 1). NDVI represents standing plant biomass, with larger values representing more abundant and higher quality vegetation (Vermote & Wolfe, Reference Vermote and Wolfe2015). The MOD09GQ data were also used to create an 8-day fire product using algorithms developed by Dempewolf et al. (Reference Dempewolf, Trigg, DeFries and Eby2007), from which we calculated fire frequency (Fire); i.e. the number of fires divided by the time period (16 years; Supplementary Material 1; Supplementary Figs 1 & 2).
To control for variation among individual rhinos and the temporal autocorrelation created by repeated sampling, we used mixed-model logistic regression (e.g. Gillies et al., Reference Gillies, Hebblewhite, Nielsen, Krawchuk, Aldridge and Frair2006) with Slope, TWI, NDVI and Fire as fixed, main effects, and rhino identity (Rhino) and day (Date) as random effects in the model. Foraging opportunities may be limited by high fire frequency, which reduces woody biomass, and low fire frequency, which allows trees to outgrow the maximum browse height for rhinos (c. 2 m). Thus, in addition to linear terms, we also included models with quadratic terms to allow for the hypothesis that rhinos favoured habitats with intermediate values of Fire or NDVI. The model was fit using the glmer command in the R package lme4 (Bates et al., Reference Bates, Maechler, Bolker and Walker2015) assuming a binomial response and fixed predictors zero-scaled prior to modeling. Ten candidate models were identified, emphasizing combinations of topography, resource availability and fire (Table 1). The model with the smallest Akaike's Information Criteria (AIC) value was selected as the best explanation of the data; models within 2 AIC units were considered equivalent (e.g. Burnham & Anderson, Reference Burnham and Anderson2002).
Results of AIC model selection (ordered by ΔAIC) for resource selection functions predicting occupancy of 31 rhinoceroses Diceros bicornis during 2014–2016.

1Difference in AIC from best model.
2TWI, topographic wetness index, NDVI, normalized difference vegetation index; Fire, fire frequency (fires/year); ~1, the intercept only model.
Forage selectivity
Rhino forage selectivity was analysed at two spatial scales: Firstly, vegetation composition at rhino foraging stations was compared to randomly located plots. Secondly, we determined if the plant species consumed by rhinos within foraging stations were consumed preferentially or in proportion to their availability.
For the first scale, rhino foraging stations were identified opportunistically during June–August 2016 using the backtracking method (e.g. Oloo et al., Reference Oloo, Brett and Young1994; Ganqa et al., Reference Ganqa, Scogings and Raats2005; van Lieverloo et al., Reference van Lieverloo, Schuiling, de Boer, Lent, de Jong, Brown and Prins2009). Rhino foraging stations were observed, coordinates were recorded, and stations were relocated immediately after the location was vacated by the rhino. A total of 64 foraging stations were surveyed, representing 19 individual rhinos. Each foraging station consisted of a 4 m2 (2 x 2 m) plot in which ground cover of each plant species was quantified. To establish background forage availability, plant species composition was quantified at 60 sites that were randomly located across the study area. At each site the ground cover of each plant species was quantified in five 4 m2 plots, each separated by 20 m, in a linear array. To ensure that background forage availability was adequately sampled across fire histories, 24 additional sites were randomly selected in areas with 1, 3, 5 or 15 years since the last fire. At each of these sites ground cover of each plant species was quantified in nine 4 m2 plots, arranged in two perpendicular arrays of five plots separated by 20 m each (with one shared center plot). In total, 560 4 m2 plots were sampled. Cover data were summed, relativized and analysed with non-metric multi-dimensional scaling (NMDS) using the metaMDS command and Bray-Curtis distance in the R package vegan (Oksanen et al., Reference Oksanen, Blanchet, Friendly, Kindt, Legendre and McGlinn2017); plant species in six or fewer plots across the dataset were removed prior to analysis. Models were estimated with 1, 2 and 3 axis solutions and up to 500 random starts to converge; the model with the fewest axes and stress < 0.2 was accepted as the final model (McCune et al., Reference McCune, Grace and Urban2002). We explored the relationship between environmental factors and NMDS axis scores with a mixed model linear regression using the lmer command in the R package lme4; the best model was selected using AIC. Models included all main effect combinations of Slope, TWI and Fire. Subsequently, we conducted indicator species analysis using the multipatt command in the R package indicspecies (De Cáceres & Legendre, Reference De Cáceres and Legendre2009), to investigate if individual plant species were statistically associated with rhino foraging stations. The species by plot matrix served as input data and plot type (either a rhino forage plot or not) as the cluster variable. We used the group-equalized indicator value (De Cáceres et al., Reference De Cáceres, Legendre and Moretti2010; option ‘func. = IndVal.g’ in R) for the analysis and determined statistical significance by species using permutation tests (option ‘nperm = 999’ in R).
For the second scale, plant species within the 64 rhino foraging plots were inspected for evidence of rhino browsing by their distinct bite pattern relative to other ungulates (e.g. Oloo et al., Reference Oloo, Brett and Young1994). The per cent browsed for each species was analysed relative to the availability of that species by calculating the type III Manly's selectivity index with the widesIII command in the R package adehabitatHS (Calenge, Reference Calenge2006; Morrison et al., Reference Morrison, Holdo and Anderson2016). This index (Wiii) estimates resource selection individually for each animal assuming that resource availability (i.e. plant composition within the visited plots) is known (Manly et al., Reference Manly, McDonald, Thomas, McDonald and Erickson2002). Plant species were assigned a selection index, with Wiii = 1 indicating the plant was selected in proportion to its availability, Wiii > 1 indicating positive selection and Wiii < 1 indicating avoidance.
Plant DNA identified from dung
Rhino diet preferences were analysed via DNA metabarcoding (e.g. Kartzinel et al., Reference Kartzinel, Chen, Coverdale, Erickson, Kress and Kuzmina2015) by opportunistically collecting 15 fresh dung samples from individuals observed defecating (n = 4) or found during foraging observations (n = 11). Samples were stored in 96% ethanol; prior to exportation and DNA metabarcoding, samples were exposed to air for c. 10 seconds to allow ethanol to evaporate and then packed in silica gel (Supplementary Material 1). Molecular libraries were used to identify the lowest possible taxonomic identity of plants in the samples (i.e. molecular operational taxonomic units or MOTUs). The number of sequences for each MOTU was divided by the total number of sequences per sample to obtain the relative read abundance and the taxonomic sample frequency was the frequency of each MOTU across all samples. Only MOTUs with taxonomic sample frequencies ≥ 5 and relative read abundances > 2% were considered in the final analysis.
Effect of fire on preferred forage
We explored the effects of fire on plant species associated with rhino foraging using mixed model regression analysis with the lmer command in lme4 and with the best model selected using AIC. As a response variable, we summed the relative cover of all plant species statistically associated with rhino foraging from the indicator analysis (i.e. with P < 0.05 from permutation tests). All models included Fire as a fixed predictor and Site as a random effect to control for the spatial association of plots nested within sites. Topography was analysed by including TWI and Slope as main and interaction effects in all pairwise combinations with Fire.
Results
Habitat selection
The top model predicting rhino utilization of the landscape (Table 1) included landscape features (Slope and TWI), plant productivity (NDVI) and linear and quadratic terms for fire frequency (Fire). Relative to randomly sampled points, rhinos tracked productive green vegetation and occupied flat sites that accumulate moisture (Table 2). In addition, the quadratic Fire term indicates that rhinos selected landscape patches that burn at a relatively low frequency of 0.1/year (i.e. one fire every 10 years; Fig. 2) and avoid frequently burnt sites (i.e. Fire > 0.6/year).
Presence or absence of rhinos (grey dots) across values of fire frequency for rhino locations and randomly selected non-rhino points. The modelled response (line) shows the quadratic response of rhino occupancy to average annual fire frequency; grey shaded area shows the 95% prediction interval for the mean.

Logistic regression model coefficients for the best resource selection functions (model 9 in Table 1) predicting rhino habitat selection.

Forage plots
The best NMDS ordination had a three axis solution and final stress = 0.196. NMDS axes 1 and 3 explained the most variation and showed that rhino foraging plots (Fig. 3) were compositionally distinct from much of the landscape; i.e. more positive on axes 1 and 3 than randomly sampled background plots (Fig. 3). Positive values on axis 1 were associated with large cover values of Indigofera basiflora, Bothriochloa insculpta, Eustachys paspaloides and Dolichos trilobus (Kendall's τ values = 0.38, 0.32, 0.28 and 0.26 respectively; Supplementary Table 3). Positive values on axis 3 were characterized by plots with abundant cover of Pennisetum mezianum, Cymbopogon excavatus and Bothriochloa insculpta (Kendall's τ values = 0.31, 0.23 and 0.23 respectively; Supplementary Table 3). Axis 1 was negatively related to Fire (−0.85 ± 0.25, t = −3.365, P = 0.001; Fig. 4), indicating that rhino foraging sites had lower fire frequencies than randomly selected background plots. The next best model predicting NMDS axis 1 included both Fire and Slope, but was inferior according to model selection (ΔAIC = 7.2) Indicator analysis identified 18 plant species with statistically significant associations between background vegetation and rhino foraging plots (Table 3). One species, the grass Chloris gayana, was statistically associated with background plots. The other 17 species, largely woody forbs, shrubs and trees (n = 13), were statistically associated with rhino foraging plots.
Rank Manly selectivity index ± SD (W iii) for all species (Supplementary Table 3) in rhino foraging plots. W iii > 1 are statistically selected, < 1 are avoided and W iii = 1 are species consumed in direct proportion to their availability. Inset shows NMDS results for plant species community data for randomly selected background plots (light grey dots) and for rhino forage plots (black dots). Axes 1 and 3 best represented the differences between background and forage plots.

Negative linear relationship between NMDS axis 1 of the ordination and fire frequency. Solid line shows the best fit ordinary least squares for the relationship between NMDS axis 1 and fire frequency; dashed lines show 95% prediction intervals and the grey region shows 95% confidence intervals for the mean.

List of plant species that were identified with indicator analysis as being statistically associated with rhino foraging plots as compared to background vegetation plots.

1The association statistic of each species by plot type, with probability estimated from permutation tests. Species in bold were preferred by rhinos in forage selectivity analyses (Manly selectivity index >1).
*Found in faecal samples using DNA metabarcoding.
Forage selectivity
Within foraging stations, nine of 56 species were positively selected by rhinos; one species (Indigofera volkensii) was significantly consumed but with a standard error that included zero and the other 47 species were avoided (Fig. 3). Of the species selectively consumed, four were herbs or trees of the family Leguminosae and the others were robust suffruticose forbs (e.g. Achyranthes aspera and Justicia betonica) or woody shrubs (e.g. Abutilon grandiflorum, Hibiscus sp. and Ziziphus abyssinica). Of the nine plant species preferred by rhinos, eight were also identified as statistically associated with rhino presence from the indicator analysis (Table 3).
Diet selection
Rhino dung samples contained sufficient DNA to identify 72 MOTUs. Of these, 39 taxa occurred at a taxonomic sample frequency ≥ 4 and of those, 14 occurred at a relative read abundance > 2% (Supplementary Table 4). For these 14 species, seven were selectively consumed in the rhino foraging plots (Table 3) and 13 were amongst the indicator species (Table 3). The species composition of the dung samples, the indicator species and the Manly selectivity index therefore showed considerable agreement concerning the plant species preferred by foraging black rhinos. Notable of the 14 species in dung were plants of the family Leguminosae, which accounted for the top four species, with relative read abundances of 9.4–12.6% (Supplementary Table 4).
Fire effects on vegetation
Two equivalent models predicted the relative abundance of the 17 indicator species: one with only Fire (ΔAIC = 0.0) and one with Fire and TWI as main effects (ΔAIC = 1.1). The next best model included only TWI but was not considered further (ΔAIC = 4.5). In the best model, the abundance of rhino indicator species decreased with Fire across all plots (−1.97 ± 0.85, t = −2.31, P = 0.024). In the next best model, rhino indicator species also decreased with Fire (−1.69 ± 0.84, t = −2.01, P = 0.048) and increased with TWI (0.13 ± 0.06, t = 2.22, P = 0.029).
Discussion
Serengeti rhinos demonstrated strong preferences for a relatively small selection of woody shrubs and forbs, particularly those in the Leguminosae family. However, the novelty of our study lies in the relationships among fire, spatial occupancy in the landscape and foraging selectivity confirmed through observations and faecal DNA analyses. Our results show that (1) rhinos select habitats that burn infrequently, (2) the plant composition of foraging stations used by rhinos is associated with low fire frequencies and (3) the abundance of plant species preferred by rhinos decreases with increasing fire frequency. To the best of our knowledge, this is the first study to demonstrate potentially negative effects of fire on the foraging and ranging activities of this Critically Endangered species.
Habitat selectivity
Fire, plant productivity and topography were important predictors of rhino habitat selection. As precipitation is uniform across the study area, topography and soils are the major determinant of variation in plant productivity and thus rhino habitat use. For example, slopes and ephemeral drainages receive greater amounts of runoff and have deeper soils than upslope savannahs. Woody plants exploit these soils, obtaining deeper sources of water, thus driving high productivity of the broad-leaved/woody vegetation favoured by rhinos. The microclimatic conditions in low-lying drainages encourage growth of vegetation preferred by rhinos, which further suppresses fire by modifying the soil, altering grazing frequency and reducing evapotranspiration (e.g. Vetaas, Reference Vetaas1992).
Plant species selectivity
Plants highly preferred by rhinos tended to be woody or suffruticose forbs with upright growth forms. Of the five legumes occurring in foraging plots but not selected by rhinos (Fig. 3), three are prostrate vines that grow below the grass canopy (Dolichos, Tephrosia and Vigna; TMA, pers. obs.) and the remaining two are trees defended either by ants (Acacia drepanolobium) or secondary compounds (Acacia robusta). Thus, within foraging stations, Serengeti black rhinos consumed plants that were accessible and not heavily defended.
Black rhinos in East Africa (Goddard, Reference Goddard1968; Goddard, Reference Goddard1970; Oloo et al., Reference Oloo, Brett and Young1994) and South Africa (Emslie & Adcock, Reference Emslie, Adcock, Penzhorn and Kriek1994a; Ganqa et al., Reference Ganqa, Scogings and Raats2005; Buk & Knight, Reference Buk and Knight2010) consume a wide variety of plants but tend to rely heavily on few species, notably leguminous trees and shrubs. In Itala game reserve, South Africa, 86% of browsed plants were from few species, including the highly available Acacia nilotica, Acacia karoo and Dichrostachys cinerea and highly preferred Cassine transvaalensis, Rhus gueinzii and Acacia gerrardii (Kotze & Zacharias, Reference Kotze and Zacharias1993). In the Massai Mara ecosystem of southern Kenya, rhinos were highly selective for the woody herb Solanum incanum, low growing trees, such as Dichrostachys cinerea, Acacia hockii, Acacia brevispica and Croton dichogamus, and the shrub Maerua edulis (Mukinya, Reference Mukinya1977). Solanum sp. was abundant in Serengeti dung samples (relative read abundance = 8.3; Supplementary Table 4) but was not consumed by rhinos in the foraging plots, perhaps because Solanum is unpalatable in large quantities (e.g. Goddard, Reference Goddard1968) and only selected when other species, such as highly preferred leguminous forbs and shrubs, are unavailable.
Given their large body size and hind-gut digestion, one might expect black rhinos to tolerate a variety of forage qualities. However, chemical analyses of preferred, indifferent and rejected plant species suggested that rhinos do not select forage to maximize digestibility or nutrient intake (van Lieverloo et al., Reference van Lieverloo, Schuiling, de Boer, Lent, de Jong, Brown and Prins2009). Rhinos cannot tolerate plants heavily protected by volatile secondary compounds such as alkaloids and phenols (Muya & Oguge, Reference Muya and Oguge2000). Taken together, these studies suggest that rhino selectivity may be aimed at reducing intake of secondary chemical compounds.
Responses to burning
Fire is a powerful management tool that improves foraging opportunities for many African savannah herbivores (e.g. Archibald et al., Reference Archibald, Bond, Stock and Fairbanks2005; Trollope Reference Trollope2011). In Kruger National Park, high fire frequency and short fire return intervals lead to increased foliar nitrogen and decreased non-structural carbohydrate defense compounds in Colophospermum mopane (Ferwerda et al., Reference Ferwerda, Siderius, van Wieren, Grant, Peel, Skidmore and Prins2006), presumably increasing palatability for browsers. In contrast, if fire eliminates preferred plants it may have a net negative effect on browsers. Therefore, the effect of fire on browser foraging may depend on the balance between improving foliar quality of plants that regrow after fire and eliminating plants that are preferred by browsers.
For black rhinos, some have noted they prefer unburnt (or not seriously burnt) vegetation (e.g. Mukinya, Reference Mukinya1977), whereas others have noted they consume burnt vegetation (Goddard, Reference Goddard1968; Emslie & Adcock, Reference Emslie, Adcock, Penzhorn and Kriek1994a), perhaps because of the high salt content. Although individual animals may eat burnt plants, or be found in burnt areas, rhino habitat preference and forage consumption is negatively associated with frequent fire in the Serengeti. We acknowledge that a negative relationship could arise because rhinos (1) directly avoid frequently burnt vegetation or (2) select habitat because of other features and the relationship with fire is one that emerges indirectly. Whether the relationship is direct or indirect, the implication is that rhinos do not benefit from frequent fire and it may have negative consequences for rhino foraging and ranging behavior. For example, when rhinos increase their search area to find food, energy expenditure increases as does the potential for greater encounter rates with humans and natural predators (PMN, pers. obs.).
Management implications
Rhinos face threats from poaching (Emslie, Reference Emslie2012), loss of population genetic diversity (Mills et al., Reference Mills, Morkel, Amiyo, Runyoro, Borner and Thirgood2006), unpalatable invasive species (Murphy et al., Reference Murphy, Subedi, Jnawali, Lamichhane, Upadhyay, Kock and Amin2013), changing vegetation and habitat quality (Reid et al., Reference Reid, Slotow, Howison and Balfour2007) and an expanding human population (Sinclair et al., Reference Sinclair, Hopcraft, Olff, Mduma, Galvin, Sharam, Sinclair, Packer, Mduma and Fryxel2008), making their conservation more challenging than ever. A study that mapped habitat suitability and poaching risk in the Serengeti suggested rainfall and elevation best predict successful black rhino reintroduction (Metzger et al., Reference Metzger, Sinclair, Campbell, Hilborn, Hopcraft, Mduma and Reich2007). Our data suggest that fire history, NDVI and the proportion of available shrubs and legumes in the understory be explicitly considered in determining black rhino habitat suitability.
Kotze & Zacharias (Reference Kotze and Zacharias1993) and Emslie & Adcock (Reference Emslie, Adcock, Penzhorn and Kriek1994b) concluded that management actions encouraging a switch from open woodland to closed canopy forest would negatively affect black rhinos. Their explicit recommendation was clearing or thinning of tall vegetation and frequent burning at a low to moderate intensity, the implication being that tree removal and fire maintain open woodland habitat and fire suppression encourages a detrimental switch to closed canopy woodland. In theory, regions with abundant resources or low rates of woody plant consumption should have a shorter time until canopy closure relative to regions with low resources or high rates of woody plant consumption (Lehmann et al., Reference Lehmann, Archibald, Hoffmann and Bond2011). Thus, an important implication is that the effects of altered fire regimes on rhino habitat quality and foraging may be context specific, depending on timing and likelihood of canopy closure in the absence of burning (Fig. 5). In the Moru area, even where fire frequencies are low, woody vegetation does not form closed-canopy woodlands that reduce rhino foraging opportunities. Perhaps because of the large browser community in the Serengeti, and elephants in particular, vegetation is maintained in shrub-like growth forms and well within the browse line of black rhinos. Others have suggested negative interactions between elephants and rhinos (Birkett, Reference Birkett2002). Becasue of recent increases in elephant populations in the Serengeti and their disproportionate negative effect on tree survival (Morrison et al., Reference Morrison, Holdo and Anderson2016), this should be tested explicitly.
Theoretical relationship between savannah tree canopy and time since last fire for two hypothetical sites, one high resources, or low rates of browsing pressure, and one low resources, or high rates of browsing pressure on woody plants. A threshold at which forage availability drops significantly for black rhinos is shown as a horizontal dotted line; the intersection between this threshold and the curves indicates the predicted time until rhinos are excluded from foraging at a high resource/low browsing (T H) and low resource/high browsing site (T L). Modified from Lehmann et al., Reference Lehmann, Archibald, Hoffmann and Bond2011.

Given the importance of pyrodiversity (i.e. fire size, timing, intensity; sensu Hempson et al., Reference Hempson, Parr, Archibald, Anderson, Mustaphi and Dobson2018) for influencing African bird and mammal richness (Beale et al., Reference Beale, Courtney-Mustaphi, Morrison, Archibald, Anderson and Dobson2018), future research is required to understand how different fire characteristics, other than frequency, influence black rhino foraging, movements and habitat utilization. For example, large, intense fires may be particularly pernicious if they remove large quantities of woody biomass, whereas small, cooler fires, even if they burn frequently, may not eliminate preferred plant species.
A management recommendation resulting from our work is to implement controlled experiments that determine how fire characteristics (frequency, size, timing and intensity) effect the stability of woody cover (Fig. 5) and the abundance of trees, shrubs and legumes that dominate rhino diets in the Serengeti. By highlighting the potential effects of fire on black rhino ecology we hope to improve chances of successful reestablishment in one of the last great natural sanctuaries for the Critically Endangered black rhino.
Acknowledgements
Funding was provided by National Geographic grant 9034-11, NSF-DEB-1145861 and NSF-BCS-1461728 to TMA. BJG, ER, FF and JDMS were supported by the European Union's Horizon 2020 research and innovation programme, AfricanBioServices grant 641918. We thank Serengeti chief park warden W. Mwakilema, Tanzanian National Parks and the Tanzania Wildlife Research Institute for providing permits and facilitating our research. J. Sarakiya and K. Magige assisted with field work.
Author contributions
Data collection: TMA, PMN and MLN; data analysis: TMA, PMN, JDMS, DG, FF and BJG; creation of the fire map for the Serengeti: DG; writing: TMA and PMN. All authors conceived the ideas and methods and contributed to the text.
Conflicts of interest
None.
Ethical standards
This research complied with the Oryx Code of Conduct for authors.


 Open access