

Provision of safe drinking-water was a critical US public health intervention of the 20th century( Reference Cutler and Miller 1 ). Mortality rates, particularly child mortality, declined with proper treatment of public water systems. While ongoing challenges persist in the USA, including deteriorating water infrastructure and emerging pathogens, tap water from public water systems remains the healthiest hydration choice for most( Reference Cutler and Miller 1 , Reference Hanna-Attisha, LaChance and Sadler 2 ).
The USA has one of the most comprehensive, reliable and safest water infrastructure systems in the world( 3 ), yet sales of bottled water have increased from ~1·325 billion litres (~350 million US gallons) in 1976 to 48·45 billion litres (12·8 billion US gallons) in 2016( Reference Gleick 4 , Reference Maloney 5 ). The Environmental Protection Agency (EPA) regulates US public water systems, which serve ~90 % of the population( 3 ). By comparison, bottled water is regulated by the Food and Drug Administration and is 240–10 000 times more expensive than tap water( 6 ). Differences in tap and bottled water consumption have major public health implications for fluoride delivery and exposure to chemical contaminants and pathogens, as studies have found higher proportions of sampled bottled water had fluoride levels below the recommended amount and higher bacterial counts than tap( Reference VanDerslice 7 – Reference Victory, Cabrera and Larson 11 ).
Perceptions of water sources may affect who drinks tap or bottled water( Reference Doria 12 ). The American Housing Survey found that foreign-born, Hispanic, non-Hispanic (NH) Black, and adults with lower income and education were more likely to state tap water was unsafe( Reference Pierce and Gonzalez 13 ). Previous research found racial disparities in access to community water services such that low-income households experienced more water insecurity and ethnic minorities were more likely to have negative previous experiences with tap water( Reference Gibson, DeFelice and Sebastian 14 – Reference Viscusi, Huber and Bell 16 ). Therefore, these populations may be consuming less tap and more bottled water.
A few nationally representative studies have examined water intake patterns in the USA( Reference Drewnowski, Rehm and Constant 8 , Reference Patel, Shapiro and Wang 17 – Reference Rosinger and Herrick 19 ); however, a gap exists in examining tap v. bottled water intake by demographic and socio-economic characteristics. It is important to know whether specific populations are more likely to drink tap or bottled water, how much of each source they consume, and whether use of household water filters affects these relationships as water filters may increase trust in tap water, particularly since drinking more bottled water may reflect extra economic and mental stress faced by families spending greater amounts on water and who may perceive tap water to be unclean( Reference Jepson 15 , Reference Viscusi, Huber and Bell 16 , Reference Pierce and Jimenez 20 ). Additionally, these patterns may provide insights into health disparities, like higher prevalence of dental caries, tooth loss and inadequate hydration among NH Black and Hispanic adults( Reference Brooks, Gortmaker and Long 21 , Reference Dye, Thornton-Evans and Li 22 ).
The present study had three objectives: (i) to assess the percentages of US adults who consume total plain, tap and bottled water and examine how these vary by sociodemographic characteristics to assess potential disparities; (ii) to determine how much total plain, tap and bottled water US adults consume on a given day and examine how reported intake varies by race/Hispanic origin, nativity status and socio-economic status; and (iii) to examine how household water treatment use affects these relationships and whether it is associated with differences in likelihood of water source use.
Methods
The present study uses four two-year National Health and Nutrition Examination Survey (NHANES) cross-sectional cycles: 2011–2012 and 2013–2014 for the main analysis, and 2007–2008 and 2009–2010 for the sensitivity analysis (discussed later). NHANES provides a representative sample of the non-institutionalized, civilian US population using a complex, stratified, multistage probability design. NHANES combines in-person interviews with physical examinations conducted in mobile examination centres. Details of the survey sampling procedures and methodology are described elsewhere( 23 , 24 ). Since 1999, NHANES has been continuously conducted by the National Center for Health Statistics. The Research Ethics Review Board of the National Center for Health Statistics approved the continuous NHANES and all adult participants gave written informed consent. In 2011–2014, NHANES oversampled NH Black, Hispanic and NH Asian persons, among other groups. The examination response rate, which includes the dietary recalls, for adults aged ≥20 years in 2011–2014 was 64·0 %( 25 ).
Measures
Adults completed an in-person 24 h dietary recall by trained dietary interviewers using the automated multiple-pass method in the mobile examination centre and a second dietary recall by telephone 3–10d later( Reference Moshfegh, Rhodes and Baer 26 ). This recall method uses standardized probes to improve respondents’ recall of foods and beverages consumed and minimizes bias( Reference Moshfegh, Rhodes and Baer 26 ). During the recall respondents listed all foods and liquids consumed in the previous 24 h period from midnight to midnight. Data from the dietary recall are used to generate estimates of the amount of foods, water and nutrients consumed and to describe dietary behaviours( Reference Rosinger and Herrick 19 ).
To assess population means and differences in overall plain water (sum of tap and bottled water), tap water and non-carbonated, unsweetened bottled water on a given day, we used one 24 h recall to estimate total plain water (millilitres), tap water (millilitres) and bottled water (millilitres) calculated on the Day 1 Total Nutrients file( 24 ). To assess the percentage of adults using tap, bottled and overall plain water, all three variables were defined as follows: >0 ml=drank tap/bottled/plain water; 0 ml=did not drink tap/bottled/plain water. These categories were also used to distinguish whether an individual drank tap water (>0 ml of tap) or not (0 ml of tap) and whether an individual drank bottled water (>0 ml of bottled) or not (0 ml of bottled). The categories of ‘drank tap water’ and ‘drank bottled water’ are not mutually exclusive. For example, adults in the category ‘drank tap water’ may also have drank bottled water, whereas adults in the category ‘did not drink tap water’ consumed 0 ml of tap but may have drank bottled water.
Covariates
For the 2011–2014 NHANES data, race/Hispanic origin was self-reported and made available on the public-use file as NH White, NH Black, Hispanic (Mexican American and other Hispanic) and NH Asian. Adults who identified as other race, including multi-racial, were included in analyses but not shown separately (other ethnicity included NH Asians in 2007–2010). To assess nativity status, participants were asked in what country they were born. Those who answered they were born in the fifty US states or Washington, DC were coded as ‘US-born’ and those who reported being born in other countries or US territories, like Puerto Rico, as ‘born outside fifty US states or Washington, DC’.
We examined income and educational level as markers of socio-economic status. Federal income to poverty ratio (FIPR) is an index based on the ratio of family income to poverty. The US Department of Health and Human Services’ poverty guidelines were used to calculate this index( 27 ). FIPR was categorized as ≤130 %, 131–350 % and >350 %. To assess education, adults were asked ‘What is the highest grade or level of school you have completed or the highest degree you received?’ Educational level was categorized as ‘less than high school’ (includes 12th grade with no diploma), ‘high school graduate/GED or equivalent’, ‘some college or associates degree’ and ‘college graduate or above’, where GED is General Educational Development. Age was categorized as 20–39 years, 40–59 years and ≥60 years, and sex as male/female.
Statistical analysis
Data analyses were conducted with the statistical software package Stata version 13.1, using survey commands to estimate means and with se estimated by Taylor series linearization. Day 1 dietary sample weights were used to adjust for oversampling, non-response rates, non-coverage and day of week. Differences between categories were tested with Wald F-test statistics adjusted for the survey design and tested for linear trends, when appropriate, by treating categorical ordinal covariates as continuous in linear and logistic regressions.
We used multiple logistic regressions to test for differences in the likelihood to consume any plain, tap and bottled water on a given day by race/Hispanic origin, nativity status and education, adjusting for covariates. We excluded FIPR in the regression models because education and income are strongly correlated and because FIPR had 720 missing observations (see online supplementary material, Supplemental Table 1). Multiple linear regressions were used to test how mean intakes of water (plain, tap and bottled) differed by the sociodemographic characteristics, similar to the logistic regressions.
Sample
The analytic sample for 2011–2014 included 9678 adults (unweighted) who completed the dietary recall out of 10 599 adults who participated in any part of the examination (91·3 %; see online supplementary material, Supplemental Table 1). Pregnant (n 111) and lactating (n 59) women were excluded. Twelve adults were excluded due to missing nativity status and education, leaving 9666 adults (Supplemental Table 1).
Sensitivity analysis
Since water filters may change water consumption behaviours, we examined the role they play as a potential effect modifier or confounder on the association between sociodemographic characteristics and plain, tap and bottled water consumption. In 2007–2010, participants were asked if they used water treatment devices to improve home water safety and quality, including carbon, fibre, reverse osmosis, neutralizers, chemical feed-pumps, disinfection and softeners, and pitcher water filters. We examined the percentage and characteristics of adults using these water treatment devices (see online supplementary material, Supplemental Table 2), and then re-estimated the models in Table 2 with and without water treatment as a covariate (Supplemental Table 3). The sample size for 2007–2010 was 10 998 (Supplemental Table 1) with an examination response rate of 71·4 %( Reference Brooks, Gortmaker and Long 21 ).
Results
Percentage consuming
In 2011–2014, 81·4 (se 0·6) % of US adults reported they drank any plain water, 55·2 (se 1·4) % consumed any tap water and 33·4 (se 1·4) % consumed any bottled water on a given day (Table 1). Tap and bottled water use was not exclusive, as 13·0 (se 0·9) % of adults who drank tap water also drank bottled water and 21·5 (se 1·2) % of adults who drank bottled water also drank tap water on a given day (all P<0·001).
Percentage of US adults aged ≥20 years (n 9666) who reported plain water intakes, by sociodemographic characteristics, National Health and Nutrition Examination Survey (NHANES) 2011–2014Footnote †,Footnote ‡
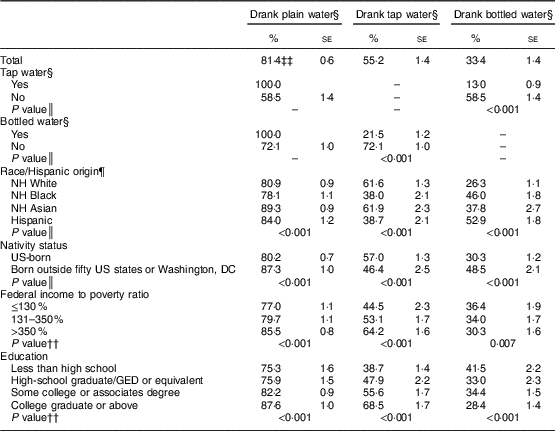
NH, non-Hispanic; GED, General Educational Development.
† Sample sizes and missing values are described in the online supplementary material, Supplemental Table 1.
‡ All estimates are weighted. Data are from NHANES( 23 ).
§ Data from a single 24 h dietary recall.
║ P value by adjusted Wald F test between mean differences of category (joint test).
¶ Includes other race/Hispanic origin, but not shown.
†† P value for test of linear trend across the categories shown based on a linear/logistic regression.
‡‡ Percentage does not sum tap and bottled percentage use because tap and bottled water use are not mutually exclusive.
Differences in plain water use existed by race and Hispanic origin and nativity status (Table 1). In 2011–2014, 80·9 (se 0·9) % of NH White, 78·1 (se 1·1) % of NH Black, 89·3 (se 0·9) % of NH Asians and 84·0 (se 1·2) % of Hispanic adults reported drinking plain water (P<0·001). Of NH White adults, 61·6 %, and of NH Asian adults, 61·9 %, consumed tap water on a given day, compared with 38·0 % of NH Black and 38·7 % of Hispanic adults. More than half of Hispanic adults (52·9 %) consumed bottled water on a given day compared with 46·0 % of NH Black, 37·8 % of NH Asian and 26·3 % of NH White adults. A significantly higher percentage of adults born outside the fifty US states or DC reported they consumed any plain water as well as any bottled water than US-born adults. A lower percentage of adults born outside the fifty US states or DC consumed tap water on a given day (all P<0·001).
Differences also existed by SES (Table 1). Income (FIPR) and education were positively linearly associated with the percentage of adults who consumed any plain and tap water (all P<0·001), and inversely linearly associated with the percentage of adults who consumed bottled water on a given day (P=0·007 for FIPR; P<0·001 for education). For example, a lower percentage of those making less than 130 % FIPR (77·0 (se 1·1) %) and those with less than a high-school diploma (75·3 (se 1·6) %) reported consuming any plain water than adults greater than 350 % FIPR (85·5 (se 0·8) %; P<0·001, linear trend) and those with a college diploma or above (87·6 (se 1·0) %; P<0·001, linear trend), respectively.
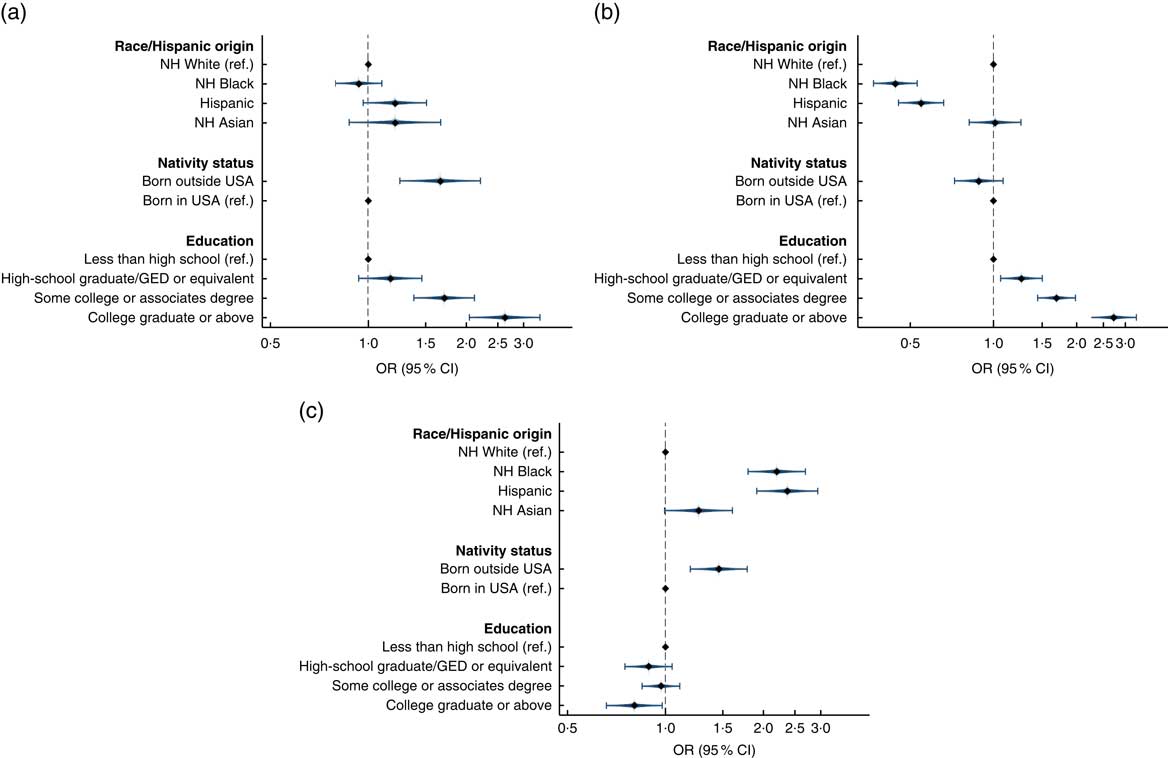
The results from the multiple logistic regression models examined the relationship among race/Hispanic origin, nativity status and education on reported drinking of any plain, tap and bottled water on a given day adjusting for these covariates as well as age and sex (Table 2; Fig. 1). Race/Hispanic origin was not associated with increased odds of consuming plain water in adjusted models (Fig. 1(a)). However, NH Black (OR=0·44; 95 % CI 0·37, 0·53) and Hispanic (OR=0·55; 95 % CI 0·45, 0·66) adults had significantly lower odds of consuming tap water compared with NH Whites (Fig. 1(b)). Additionally, NH Black (OR=2·20; 95 % CI 1·79, 2·69) and Hispanic (OR=2·37; 95 % CI 1·91, 2·94) adults had more than twice the odds of consuming bottled water than NH Whites (Fig. 1(c)).
Adjusted odds ratios (![]() ), with their 95 % confidence intervals represented by horizontal bars, from multiple logistic regression models in Table 2 assessing the predictors of US adults aged ≥20 years (n 9666) consuming (a) plain water, (b) tap water and (c) bottled water, National Health and Nutrition Examination Survey (NHANES) 2011–2014. Models adjusted for all variables shown as well as sex and age (NH, non-Hispanic; ref., reference category; GED, General Educational Development)
), with their 95 % confidence intervals represented by horizontal bars, from multiple logistic regression models in Table 2 assessing the predictors of US adults aged ≥20 years (n 9666) consuming (a) plain water, (b) tap water and (c) bottled water, National Health and Nutrition Examination Survey (NHANES) 2011–2014. Models adjusted for all variables shown as well as sex and age (NH, non-Hispanic; ref., reference category; GED, General Educational Development)
Multiple logistic regression assessing predictors of using plain water sources among US adults aged ≥20 years (n 9666), National Health and Nutrition Examination Survey (NHANES) 2011–2014Footnote †,Footnote ‡

NH, non-Hispanic; GED, General Educational Development; ref., reference category.
*P<0·05, ** P<0·01.
† All estimates are weighted.
‡ Sample sizes and missing values are described in the online supplementary material, Supplemental Table 1. Data are from NHANES( 23 ).
§ Data from a single 24 h dietary recall.
║ All covariates listed are adjusted for in the models.
Nativity status and education were associated with plain and bottled water consumption, controlling for covariates. Adults born outside the fifty US states or DC had higher odds of consuming any plain water (OR=1·67, 95 % CI 1·25, 2·21) and bottled water (OR=1·46, 95 % CI 1·19, 1·79) than US-born adults, but were no less likely to consume tap water. Education was significantly associated with plain, tap and bottled water use (Fig. 1(a)–(c)). Being a college graduate or above was associated with 2·63 (95 % CI 2·05, 3·38) times the odds of consuming any plain water than adults with less than a high school degree, with similar associations for tap water. Education level was not strongly related to bottled water consumption after adjustment.
Mean consumption
In 2011–2014, the mean total plain water intake on a given day for US adults was 1167 (se 26) ml, with 725 (se 32) ml (62·2 %) from tap water and 441 (se 23) ml (37·8 %) from bottled water (Table 3). Adults who drank any tap water (and potentially some bottled) on a given day consumed more total plain water than adults who did not drink any tap water (1444 (se 38) v. 824 (se 32) ml; P<0·001) with 131 (se 11) ml water coming from bottled water. Adults who drank bottled water (and potentially some tap water) consumed 1501 (se 27) ml of plain water (with 179 (se 11) ml coming from tap) on a given day, which was higher than adults who did not drink any bottled water (999 (se 37) ml).
Mean plain water intakes on a given day, by sociodemographic characteristics, among US adults aged ≥20 years (n 9666), National Health and Nutrition Examination Survey (NHANES) 2011–2014Footnote †

NH, non-Hispanic; GED, General Educational Development.
† All estimates are weighted. Data are from NHANES( 23 ).
‡ Data from a single 24 h dietary recall.
§ P value by adjusted Wald F test between mean differences of category (joint test).
║ P value for test of linear trend across the categories shown based on a linear/logistic regression.
¶ Significantly different from NH Black (P<0·05 using a univariate t statistic).
†† Significantly different from Hispanic (P<0·05 using a univariate t statistic).
‡‡ Significantly different from NH Asian (P<0·05 using a univariate t statistic).
Overall and group-specific differences in total plain, tap and bottled water intake existed between race/Hispanic origin groups (all P<0·001). Hispanic adults had the highest mean total plain water intake (1281 (se 48) ml) except for NH Asians (1194 (se 51) ml), while NH Black (1044 (se 31) ml) adults had the lowest intake (Table 3). NH White adults had the highest mean tap water intake (813 (se 38) ml) except for NH Asians (730 (se 42) ml), while NH Black adults had the lowest intake (450 (se 32) ml). Hispanic adults had the highest bottled water intake (731 (se 39) ml), while NH Whites had the lowest (345 (se 19) ml).
US-born adults reported lower total plain water intake than adults born outside the fifty US states or DC (1147 (se 28) v. 1261 (se 39) ml, P=0·01), higher tap (755 (se 35) v. 579 (se 38) ml, P<0·001) and lower bottled water intake (393 (se 19) v. 682 (se 41) ml, P<0·001). Adults with higher income (FIPR) consumed more total plain water, more of their plain water from tap and less bottled water than adults with lower income (P<0·001, linear trends). Education was associated with plain water intake patterns, as total plain and tap water intake was highest among college graduates and bottled water intake was higher among adults with less education (P<0·001, linear trends).
We examined how these sociodemographic characteristics were associated with total plain, tap and bottled water intake adjusted for all variables in the models (Table 4). Similar to bivariate analyses, in regression models NH Black adults consumed less total plain water (B=−118 (se 46) ml), less tap water (B=−330 (se 45) ml) and more bottled water (B=212 (se 40) ml) than NH Whites after adjustment (Table 4). Hispanic adults consumed less tap (B=−180 (se 64) ml) and more bottled water (B=243 (se 42) ml) than NH Whites. No differences were found for nativity status on total plain or tap water; however, adults born outside the fifty US states or DC consumed significantly more bottled water (B=188 (se 41) ml) than US-born. Total plain and tap water were higher with more education, but there were no differences in bottled water intake by education after adjustment.
Multiple linear regression assessing predictors of water intakes among US adults aged ≥20 years (n 9666), National Health and Nutrition Examination Survey (NHANES) 2011–2014Footnote †
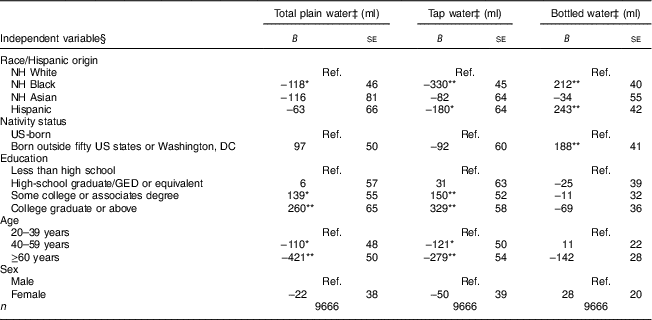
NH, non-Hispanic; GED, General Educational Development; ref., reference category.
*P<0·05, **P<0·01
† All estimates are weighted. Data are from NHANES( 23 ).
‡ Data from a single 24 h dietary recall.
§ All covariates listed are adjusted for in the models.
Sensitivity analysis
In 2007–2010, 33·1 (se 1·7) % of adults reported using home water treatment devices (see online supplementary material, Supplemental Table 2). These adults were more likely to drink plain and tap water, but less likely to drink bottled water on a given day. Additional differences in water treatment usage were seen by race/Hispanic origin, FIPR and education (all P<0.001).
We re-estimated the multiple logistic regressions presented in Table 2 unadjusted and adjusted for filter use (see online supplementary material, Supplemental Table 3). Interactions between water treatment and key sociodemographic variables were not significant (results not shown); therefore, we included filter use as a covariate to address confounding. The models unadjusted for water treatment from 2007–2010 are mostly consistent with results in Table 2.
Adjusting for sociodemographic characteristics, adults who did not use water treatment had 0·60 (95 % CI 0·51, 0·71) and 0·55 (95 % CI 0·47, 0·64) times the odds of consuming any plain and tap water compared with adults who reported water treatment, respectively; they were more likely to drink bottled water (OR=1·21; 95 % CI 1·01, 1·44; Supplemental Table 3). Controlling for water treatment, the results changed slightly but remained mostly consistent.
Discussion
In 2011–2014, 81·4 % of adults consumed any plain water on a given day, 55·2 % consumed tap water and 33·4 % consumed bottled water. Overall, the results suggest that while the majority of US adults consumed plain water, we found major differences in the source of plain water (i.e. tap v. bottled) by race/Hispanic origin and nativity status. While overall differences in plain water intake between NH Black and NH White adults were relatively small at 118 ml (or ~4 US fluid ounces), which on a given day may not translate into substantial hydration improvements, the differences in tap and bottled water intake were up to 330 ml (or ~11 US fluid ounces) which may have compounding benefits or consequences in terms of fluoride delivery or other exposures. For NH Black, Hispanic and non-US-born adults, the majority of plain water intake came from bottled water, whereas for NH White, NH Asian and US-born adults the majority of plain water came from tap water. Our results were consistent with a previous study showing that NH Blacks and Hispanics had lower odds of tap water use among children( Reference Patel, Shapiro and Wang 17 ). The results of our study may help explain health disparities in inadequate hydration and dental caries among non-Hispanic Black and Hispanic adults( Reference Brooks, Gortmaker and Long 21 , Reference Dye, Thornton-Evans and Li 22 ).
Many factors influence the decision to drink tap or bottled water, including access, convenience, cost, education, location, environmental beliefs, marketing, previous experiences, and perception of water source quality and safety( Reference Pierce and Gonzalez 13 , Reference Williams and Florez 28 – Reference de França Doria 31 ). Written reports of water quality violations, required by the EPA Safe Drinking Water Act, from public water systems to users may induce households to seek alternatives, whereas bottled water companies are not held to this same EPA standard( Reference Pape and Seo 32 ). Access to water that meets water quality standards often falls along race/ethnicity and socio-economic boundaries, which may affect consumption of tap v. bottled water, leading to restriction of intake or consumption of other beverages( Reference Hanna-Attisha, LaChance and Sadler 2 , Reference VanDerslice 7 , Reference Pierce and Gonzalez 13 , Reference Pierce and Jimenez 20 , Reference Williams and Florez 28 , Reference Balazs and Ray 33 ). For example, tap water from wells is not regulated by the EPA Safe Drinking Water Act, yet is more frequently used on Tribal lands and in rural parts of the USA such that well testing is not conducted systematically in the same way as on municipal water systems( Reference Pape and Seo 32 , Reference Balazs, Morello-Frosch and Hubbard 34 , Reference Teodoro, Haider and Switzer 35 ).
While Hispanic and non-US-born adults consumed more plain water than other groups, they consumed the majority of their plain water from bottled water, which is more expensive( 6 ). One potential explanation for these findings relates to perception of tap water safety. The American Housing Survey found that foreign-born adults from Latin American countries had the lowest perception of tap water safety (70·9 %) and that US-born Hispanic (85·3 %) and NH Blacks (89·4 %) had lower perception of tap water safety than NH Whites (94·8 %)( Reference Pierce and Gonzalez 13 ).
Our study found that adults with lower FIPR and educational attainment consumed less plain and tap water than their higher-income and higher-education peers, but that in regression analyses lower education was not as strongly associated with bottled water intake. While bottled water is more expensive than tap water( 6 ), previous research found that taxes on bottled water reduced purchasing behaviour by only 6 % in Washington State, indicating relative inelasticity( Reference Berck, Moe-Lange and Stevens 36 ).
Reasons for drinking bottled water may be heterogeneous by socio-economic status. Previous research found higher-income adults drink bottled water for convenience( Reference Viscusi, Huber and Bell 16 ), whereas lower-income adults may drink bottled water because of tap water access issues. Economically disadvantaged groups, like those living in mobile home units, often have less reliable water services, which may suffer from water quality violations and increase their need to buy bottled water( Reference Hanna-Attisha, LaChance and Sadler 2 , Reference Jepson 15 , Reference Pierce and Jimenez 20 , Reference Balazs and Ray 33 ). Small water systems, which are more likely to serve lower-income and immigrant populations on the border, are more likely to have water quality violations( Reference Jepson 15 , Reference Balazs, Morello-Frosch and Hubbard 34 , Reference Teodoro, Haider and Switzer 35 ).
Finally, we found that after adjustment for in-home water filters, NH Black, Hispanic and non-US-born adults were still less likely to drink tap and more likely to drink bottled water. Additionally, in 2007–2010, a higher percentage of NH White, higher-education and higher-income adults used water treatment devices. Adults who used water treatment devices were more likely to drink tap water; therefore, water filters may influence tap water consumption.
The public health implications of drinking less tap and more bottled water relate to potential exposures to bacteria, chemicals and fluoride delivery( Reference Eggers, Moore-Nall and Doyle 9 – Reference Victory, Cabrera and Larson 11 ). Removal of fluoride from a water supply in Canada was linked to increased risk of dental caries( Reference McLaren, Patterson and Thawer 37 ). Additional implications of drinking more bottled water on a regular basis may place extra economic burden and mental stress on families( Reference Pierce and Jimenez 20 , Reference Balazs, Morello-Frosch and Hubbard 34 ).
Strengths and limitations
The current study is subject to limitations. First, the relationships presented are associations and not causal because NHANES is cross-sectional. Second, water treatment information was collected only during 2007–2010 and uncontrolled for in 2011–2014. Third, participants were not asked why they drank bottled or tap water, only to report their intake. Therefore, it is hard to make inferences about why certain groups are more or less likely to drink bottled v. tap. Finally, self-reported dietary data are subject to recall and social desirability bias. Specifically, previous research has found that weight status may affect dietary recall reporting as overweight adults tend to under-report energy intake and underweight adults who want to gain weight tend to over-report( Reference Johansson, Solvoll and Bjørneboe 38 ). However, those findings relate to energy intake and it is unclear whether plain water, an energetically neutral beverage, would be systematically over- or under-reported based on these lifestyle characteristics. Additionally, the automated multiple-pass method used by NHANES for dietary recall reduces this bias( Reference Moshfegh, Rhodes and Baer 26 ).
The present study has several strengths. It is a nationally representative study and provides the most recent estimates of plain, tap and bottled water consumption by sociodemographic differences. While most research has quantified the amount of plain water US adults consume( Reference Drewnowski, Rehm and Constant 8 , Reference Kant, Graubard and Atchison 18 , Reference Rosinger and Herrick 19 ), we also estimated the percentage of adults who drink or do not drink plain water, which provides information on the proportion of consumers in the population. The multiple plain water intake outcomes provide better understanding of who chooses tap or bottled water and the potential dental, hydration and other health implications( Reference Brooks, Gortmaker and Long 21 , Reference Dye, Thornton-Evans and Li 22 ). Finally, the present report provides one of the first nationally representative water intake estimates for adults born outside the fifty US states or Washington, DC and for NH Asians.
Conclusions
The present study found differences in plain, tap and bottled water consumption by race/Hispanic origin, nativity status and socio-economic status. While most people drank plain water, where they obtained their plain water differed, which has implications for fluoride delivery, risk of dental caries and potential water-related exposures to contaminants. Water filters were associated with higher likelihood of drinking plain and tap water and thus may encourage water intake and hydration. Future research should further elucidate these relationships by the specific tap water sources available and by geographic regions in the USA to understand structural differences that may exist to help explain people’s options for drinking different water sources.
Acknowledgements
Acknowledgements: The authors thank Dr Lara Akinbami for her helpful discussion of this work, and Dr Ryne Paulose and Dr Amy Branum for their helpful comments and suggestions on previous versions of this paper. Disclaimer: The findings and conclusions in this report are those of the authors and do not necessarily represent the official position of the National Center for Health Statistics (NCHS), Centers for Disease Control and Prevention. Financial support: This research received no specific grant from any funding agency in the public, commercial or not-for-profit sectors. Conflict of interest: A.Y.R. declares no conflicts of interest. K.A.H. declares no conflicts of interest. A.Y.W.’s work was supported by the National Science Foundation under grant number SES-1462086, DMUU: DCDC III: Transformational Solutions for Urban Water Sustainability Transitions in the Colorado River Basin. This funding source did not have any role in the study design, data, writing of the report or decision to submit it for publication. J.S.Y. declares no conflicts of interest. C.L.O. declares no conflicts of interest. Authorship: A.Y.R. drafted the manuscript; A.Y.R. and K.A.H. analysed the data; A.Y.R. and C.L.O. designed the research; and all authors edited and revised the manuscript, had responsibility for the final content of the manuscript, and read and approved the final manuscript. Ethics of human subject participation: This study was conducted according to the guidelines laid down in the Declaration of Helsinki and all procedures involving human subjects/patients were approved by the NCHS Research Ethics Review Board. Written informed consent was obtained from all subjects.
Supplementary Material
To view supplementary material for this article, please visit https://doi.org/10.1017/S1368980017004050


