

DOMINANCE, PROFICIENCY, AND SPANISH HERITAGE SPEAKERS' ENGLISH AND SPANISH VOWEL PRODUCTIONS
Bilinguals differ widely from each other because some grow up with two languages from birth, while others start learning a second language later in life. They also generally use each of their languages for different purposes and with different people (Grosjean, Reference Grosjean1985, Reference Grosjean1998, 2008), which means the knowledge they develop of their languages is tied to the use they make of each. A central theme in the study of bilingualism is therefore how these differences between bilinguals can be best described, and how notions such as language dominance and language proficiency capture the bilingual experience. In the present study, we focus on heritage speakers, a unique population of bilinguals who were exposed to their heritage language at birth through familial and cultural connections and then acquired the dominant language of the larger community later in childhood.
Language dominance and proficiency in bilinguals are multidimensional constructs (Birdsong, Reference Birdsong, Silva-Corvalán and Traffers-Dallers2015) and are commonly determined for any given individual in relative terms—that is, the individual knows more words, or can speak with fewer pauses in one language than the other. Under this perspective, bilingualism can be interpreted as existing along a continuum, with monolingual speakers of each language representing the two ends (Zyzik, Reference Zyzik, Fairclough and Beaudrie2016). For researchers carrying out empirical studies, controlling for variability in linguistic experience across participants can be crucial to adequately interpreting experimental outcomes. It is common for researchers to employ questionnaires (Birdsong, Gertken, & Amengual, Reference Birdsong, Gertken and Amengual2012) and grammatical evaluations to group speakers into more or less consistent categories, based upon criteria determined by the investigator.
We take a somewhat different perspective on variability as it pertains to heritage speakers, however, and consider it to be the logical consequence of heritage language experience; that is, rather than control for variability, we consider it a fundamental part of heritage speaker language knowledge. In this study, we examine English and Spanish vowel productions by heritage and non-heritage speakers of each language and analyze the degree of overlap in productions between the two groups. We then asked how factors related to dominance and proficiency account for the degree of overlap between the heritage speakers and each non-heritage speaker group.
DOMINANCE AND PROFICIENCY IN HERITAGE SPEAKER SPEECH
Birdsong (Reference Birdsong, Silva-Corvalán and Traffers-Dallers2015) distinguishes between domains of dominance and dimensions of dominance. The former refers to what he calls the volitional aspects of language dominance, that is, situations in which the speaker may decide to use one language over the other, whether because the interlocutor does not speak both languages or because one language is the dominant language of the community in which the interaction is taking place.Footnote 1 From this perspective, the domain of dominance of one language necessarily differs from that of the other. Birdsong’s dimensions of dominance, however, can include language skills, which are related more closely to language proficiency (p. 87).
Montrul (Reference Montrul, Silva-Corvalán and Traffers-Dallers2015) takes a slightly different perspective and argues that proficiency is a subcomponent of dominance. For Montrul, dominance includes factors that are biographical in nature (age of acquisition, place of birth/residency, and languages of environment) as well as factors that are related to the amount of input and context and degree of use for each language. Proficiency, however, refers to more quantifiable aspects of language knowledge, such as grammatical ability and fluency. Montrul suggests that proficiency can be operationalized as “the cognitive and linguistic component of dominance” (2015, p. 15). Following this logic, it is possible for speakers to share similar dominance profiles but differ on proficiency.Footnote 2
In the present study, we consider dominance and proficiency as separate but related constructs—separate because proficiency may not always align with dominance and related because dominance refers to domains of use and at least a certain level of proficiency is necessary for language use to occur. We can think, for example, of an L2 Spanish learner with very high L2 proficiency, whom bilingual Spanish/English speakers may nonetheless address in English. Alternatively, we can think of a heritage speaker with relatively low proficiency in her heritage language who nonetheless speaks only that language with certain family members.
Heritage speakers are a unique population that defy traditional categorization in terms of how dominance and proficiency typically align. Heritage speakers began learning the heritage language before (or at the same time as) the language that would become the stronger language, leading to divergence from nonheritage native speaker grammars. Within the field of heritage language research, formal approaches have explained this divergence in various ways, as a result of “incomplete acquisition”—the lack of further development in the heritage language due to dominance shift, “attrition” (Benmamoun et al., Reference Benmamoun, Montrul and Polinsky2013; Polinsky, Reference Polinsky2006)—or, alternatively, as a consequence of limited formal education in the heritage language and lack of exposure to a standard dialect (Kupisch & Rothman, Reference Kupisch and Rothman2016; Pascual y Cabo & Rothman, 2012; Rothman, Reference Rothman2009; Silva-Corvalán, 1994). In general, formal approaches have focused on describing the grammatical competence of adult heritage speakers and accounting for how and why it may differ from monolinguals or nonheritage speaker bilinguals (Montrul, Reference Montrul2008). The results have revealed that heritage speaker competence and performance is indeed different from monolingual norms in complex ways (Montrul, Reference Montrul2009; Montrul & Perpiñan, Reference Montrul and Perpiñán2011) and within heritage speaker groups there is often considerable variability as well (Polinsky & Kagan, Reference Polinsky and Kagan2007; Rothman, Tsimpli, & Pascual y Cabo, 2016).
Much of this research has compared heritage speakers to either L2 learners of the heritage language or monolingual speakers of the heritage language, often distinguishing between “native” and “heritage” speakers in this way. We follow Rothman and Treffers-Daller (Reference Rothman and Treffers-Daller2014) and consider heritage speakers as native speakers of Spanish, given that they acquired Spanish in a naturalistic context as children and can still be considered native speakers of the heritage language. Consistent with this, we consider speakers of English and Spanish who did not undergo a dominance shift (that characterizes heritage speakers) during their language acquisition process as different native speakers. Bilinguals who belong to this group began the acquisition of their second language at a much later age and under distinct input conditions. Both heritage and nonheritage learners are native speakers under this definition. Furthermore, we do not compare speakers across their two languages. This avoids issues related to comparing test results from two languages (Daller et al., Reference Daller, Treffers-Daller and Furman2011) and avoids the issue of defining language dominance in terms of balance or global dominance (Treffers-Daller, Reference Treffers-Daller, Silva-Corvalan and Treffers-Daller2015).
In the present study, our focus is on phonetics (we remain agnostic as to whether phonetics is part of a speaker’s grammar). As has been noted often in the literature, when compared to morphosyntax, the phonological/phonetic system of heritage speakers is generally considered closer to monolingual norms of the heritage language and the nonheritage language (Chang, Reference Chang2016; Lukyachenko & Gor, 2011). In studies where heritage speakers have been found to differ greatly from monolingual norms, these differences have been generally attributed to experience and proficiency in the heritage language (Au, Oh, Knightly, Jun, and Romo, 2008; Chang & Yao, Reference Chang and Yao2016; Rao, Reference Rao2015). Closely related to proficiency is the effect of task measures. Heritage speakers may perform more like second language learners on certain tasks and more like monolingual nonheritage speakers on others (Chang & Yao, Reference Chang and Yao2016). Researchers have attributed the general tendency of heritage speakers to be closer to monolingual phonetic/phonological norms to age of acquisition effects, given the early exposure to the heritage language and later childhood exposure to the dominant language of the community. However, as mentioned, continued language use is also key.
In the field of phonetics and phonology, divergent attainment will not necessarily mean that the heritage speaker cannot produce the phones of the dominant or nondominant language at all or have erased contrasts in one or the other language. Instead, it may mean that some contrasts are lessened (but most likely not lost completely) while others may be maintained in a similar fashion to nonheritage native speakers of the language (Godson, Reference Godson2003, Reference Godson2004). Importantly, while structural simplicity has been observed in heritage speaker morphosyntax (for a discussion of possible reasons and explanations, see Scontras, Fuchs, & Polinsky, Reference Scontras, Fuchs and Polinsky2015), the notion of structural simplicity in the phonetic/phonological domain is not as obviously applied. Structural simplicity in phonology, for example, commonly refers to the production of simplified complex structures such as singletons instead of consonant clusters, monophthongs instead of diphthongs, smaller vowel/consonant inventory, coda-devoicing, among other things. These “simplified” structures are also less marked, in linguistic terms, and are typical of child speech (Fabiano-Smith & Barlow, Reference Fabiano-Smith and Barlow2010). As far as the available evidence suggests, heritage speaker speech does not demonstrate this quality (Chang, Yao, Haynes, & Rhodes, Reference Chang, Yao, Haynes and Rhodes2011; Henriksen, Reference Henriksen2015; Kim, Reference Kim, Willis, Martín Butragueño and Herrera Zendejas2015; Rao & Ronquest, 2015; Roeder, 2010; Ronquest, 2012, among others). Heritage speaker speech does, however, seem to exhibit crosslinguistic influence from the dominant language into the heritage language and from the heritage language into the dominant language. The latter effect may be difficult to tease apart from situations of language contact where there are large communities of bilingual speakers.
In a study comparing Mexican heritage English in the Chicago region to L1 Mexican/L2 English speakers from the same community, Konopka and Pierrehumbert (2008) found that the two groups have distinct vowel systems, in particular with respect to the tense and lax vowels. The L2 English speakers showed a high degree of overlap between the tense and lax vowels while the heritage speakers did not. In Ronquest (Reference Ronquest2012), the comparison was between heritage Spanish speaker and monolingual Spanish speaker vowel productions. Her results showed that overall, the two systems differed considerably, particularly in terms of the greater centralization and shortening of atonic vowels. Relevant to the present study, Ronquest also found that frequent travel to Spanish-speaking countries and using Spanish outside the classroom also resulted in an expansion of the heritage speakers’ vowel space that rendered it closer to native monolingual Spanish speaker norms.
Previous work has considered (or controlled for) heritage speaker individual characteristics such as study abroad and cultural sensitivity (Ronquest, Reference Ronquest2012), employed standardized questionnaires to evaluate individual dominance and language use patterns (Henriksen, Reference Henriksen2015), and divided heritage speakers into groups based upon a combination of proficiency and dominance scores in the heritage language (Chang et al., Reference Chang, Yao, Haynes and Rhodes2011).
CURRENT STUDY
In the present study, we create four multiple regression models, once each for dominance and proficiency, for English and Spanish, to examine the degree of overlap between heritage speaker vowel productions in each language and compare these to non-heritage native speakers. The dependent variable for measuring the degree of overlap were Pillai scores (Hall-Lew, Reference Hall-Lew2010). The Pillai score is an output from a Multivariate Analysis of Variance (MANOVA) model, which represents the proportion of one variance that can be predicted by another variance. Pillai scores have been utilized extensively in sociophonetics to model the degree of vowel merger (Hay, Warren, & Drager, Reference Hay, Warren and Drager2006) and in crosslinguistic work where different vowel systems are involved (Amengual & Chamorro, Reference Amengual and Chamorro2015). Pillai scores were calculated for each vowel production for each speaker, in English and Spanish.
We hypothesize that if divergence in Pillai scores is observed, dominance and proficiency differences across the heritage speakers’ language experience may account for it. To this end, the dominance components were selected to reflect the different domains and contexts that characterize heritage speaker linguistic experience and were as follows (the operationalization of each is explained in the next section): age of acquisition of English (AoA English), use of Spanish in the home, use of Spanish outside the home, and amount of codeswitching. For proficiency, the components were as follows: fluency in a monologue related to an adult-oriented topic (e.g., politics, university major), fluency in a monologue related to a childhood-oriented topic (e.g., family dinners at grandma's house), picture naming, and vocabulary.
In order to determine which component made the greatest contribution to the variability in Pillai scores, we used multiple regression with commonality analysis (CA). CA is a statistical method that partitions the R2 effect size of a dependent variable into the effects uniquely explained by each predictor and those shared by all possible combinations of predictors and predictor subsets (Nimon et al., Reference Nimon, Lewis, Kane and Haynes2008; Zientek & Thompson, Reference Zientek and Thompson2006). The purpose of commonality analysis is to quantify precisely the percentage of explanatory power that is unique to, for example, the dominance predictor of Spanish use at home (U1) and common to different combinations of predictors, for example Spanish use at home and AoA English (C1, 2). This gives a more focused perspective on comparisons across languages in terms of the individual components. Another advantage to CA is that it avoids the problems commonly associated with stepwise and hierarchical regression (Harrell, Reference Harrell and Harrell2015) and also avoids the negative effects of multicollinearity3 because CA provides additional metrics to the usual regression beta coefficients. Thus, for studies where finding perfectly uncorrelated predictors is challenging, CA provides an alternative to either unnaturally forcing predictors to be uncorrelated or discarding interesting predictor variables because they are correlated.
To summarize, we predict that the contributions of the dominance and proficiency factors to variability in Pillai scores will differ across language, reflecting the distinct domains of use (dominance) and language knowledge (proficiency) that characterize the heritage speakers’ two languages.
METHOD
PARTICIPANTS
Fifteen heritage Spanish speakers of Mexican descent (five men) were recruited from undergraduate classes at a large American Midwest public university. Four were born in Mexico but arrived in the United States before the age of four. The others were all first generation, born in the United States of parents who were born in Mexico. The age of English acquisition was between 3 to 6 years of age (see Table 1) for all participants and none were simultaneous bilinguals.
Experimental measures

There was a great deal of variability in terms of the size of the heritage speakers’ hometowns and, importantly, the density of the network of Spanish speakers. Four grew up in areas of Chicago where the majority population is of Mexican descent. Of the heritage speakers not from Chicago, seven grew up in small towns (< 15,000 people) with between 10 to 30% Hispanic population (according to the 2010 Census, of both Mexican and Central American origins) and four grew up in very small towns (< 5,000 people), where they were either the only Spanish-speaking family or one of two or three families. Importantly, for the heritage speakers who grew up in this context, it was common to find that many of the Hispanic community members were from the same geographic region in Mexico, often the states of Michoacán, Jalisco, or Durango. Ten of the heritage speaker participants received 2.5% toward their semester grade for participating in the study; five were paid $10 for their time.
The Spanish nonheritage native speaker group consisted of 15 native Spanish speakers (6 men), from Mexico (9) and Colombia (6). Due to difficulties finding native Mexican Spanish speakers age and education matched with the heritage and native English speakers, we recruited Colombian Spanish speakers. The dialect of Spanish spoken in highland Colombia can be classified as similar to that spoken in Mexico particularly in terms of vowel productions (Hualde, Reference Hualde2005). The native Spanish speakers were either graduate students or graduate student spouses. The average age was 25 and all had started to learn English after the age of 12. The students were enrolled in a program where Spanish was the dominant language and all spoke Spanish at home. The average length of residence in the United States for this group was 5 years (3–9).
The English nonheritage native speaker group consisted of 15 L1 English/L2 (late learners) of Spanish (6 men), average age was 21. All were Spanish majors or minors and none had studied abroad and none spoke Spanish outside of the classroom.
VOWEL STIMULI
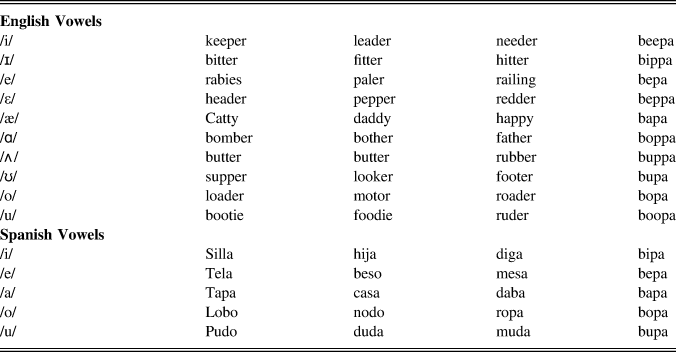
The stimuli were organized into lists of words, where each horizontal row corresponded to one target vowel sound. Each row consisted of three disyllabic, trochaic real words and a fourth nonword, in which the target vowel was contextualized in the frame “bVpa” (see Appendix B, online supplement). For example, the words for the English vowel [i] were “keeper, leader, needer, beepa” (Appendix A). The English monophthongal vowels were [i ɪ e ɛ æ ɑ ʌ o ʊ u]. The list of Spanish words was prepared in the same way. The list of words for the high front vowel [i], for example, was “silla, hija, diga, bipa.” The Spanish monophthongal vowels were [i e a o u]. By presenting the stimuli this way, the participant became accustomed to producing the vowel target in real words and then produced it in the nonword frame. And in case the nonword was produced in a nontypical fashion, we had samples from other words to draw from for the measurements.
Speakers were instructed to read the words from a sheet of paper at a comfortable pace.Footnote 4 They were recorded into a Shure SM58 dynamic microphone and recorded onto a Marantz model PMD 670 digital recorder at a 22.05 kHz sampling rate. All recordings were carried out in a soundproof booth.
VOWEL MEASUREMENTS
Vowels of the target nonwords were segmented with Praat (Boersma & Weenink, 2015) using waveform and spectrographic displays. Praat scripts divided the large sound files into individual files for each word. Vowel boundaries were determined by examining the waveform, the spectrogram, and the intensity contour. Vowel onset was taken after the stop release. Vowel offset was measured at the end of F2, on the last pitch period for stops. All F1 and F2 measurements were extracted using a Praat script. Window length was set at 25 ms and the Burg algorithm was used to calculate formant tracks. Outliers (more than two standard deviations above or below the mean for that speaker) were checked by hand (2.9%). The formant tracker was set to five formants and the ceiling was set to 5.0 kHz. Following Amengual (Reference Amengual2016), the automatic formant extraction was checked for reliability by using a selected subset of tokens from each participant (two per participant, for each vowel). Correlation between the hand measurements and automated measurements was r = .921.
Because participants were male and female, vowels were normalized by means of the Lobanov method of vowel normalization (speaker intrinsic, vowel extrinsic, formant intrinsic; Adank, Reference Adank2003; Fabricius & Johnson, Reference Fabricius, Watt and Johnson2009). Vowel normalization was carried out using the NORM vowel suite (Thomas & Kendall, Reference Thomas and Kendall2007). These normalized values served to calculate the Pillai scores, the dependent variable in the regression analyses.
MEASURES
LANGUAGE DOMINANCE
The four measures for evaluating language dominance are associated with domains of use (Grosjean, Reference Grosjean and Nicol2001, Reference Grosjean, Silva-Corvalán and Traffers-Dallers2015).
1. Age of English acquisition
Participants reported the age at which they were first exposed to English.
2. Spanish use inside the home
Participants reported the amount of Spanish they spoken at home with their family. A score of 1 meant the participant did not speak any Spanish at all at home while a score of 10 meant only Spanish was spoken at home with the family.
3. Spanish use outside the home
The variable of Spanish use outside the home—that is, in the community at large, at work, and at school—reflects the quantity of interactions in which the participant engages with different people (i.e., as compared to within the home, which is consistently with family members). Participants were asked to rate the amount of Spanish they speak outside the home and during a typical day at university. A score of 1 meant the participant did not speak Spanish outside the home at all and 10 meant Spanish was spoken every day for at least a while with someone who was not a family member. For those who are Spanish majors, this number will necessarily be higher than for those who are not, as it will be for those who have jobs that require them to use Spanish.
4. Amount of codeswitching
The codeswitching variable was included as a reflection of the degree of bilingualism of the individual’s daily interactions. For example, a high degree of codeswitching suggests extensive interaction with fellow bilinguals (codeswitching is only possible if both interlocutors share the same language). A lower score on codeswitching would reflect a more monolingual environment overall (either English or Spanish). For the present purposes, we are not claiming a quantitative or qualitative relationship between codeswitching and individual dominance profile (we did not collect data to reflect this). Instead, we are using the amount of codeswitching as a proxy for bilingualism in the participant’s environment. Participants who grew up in a small town where theirs was the only Spanish-speaking family will exhibit very little codeswitching outside of the home. The opposite may hold for those who grow up in a community with many bilingual individuals (not monolingual Spanish). Participants were asked to rate the amount of codeswitching they did when speaking Spanish. A score of 1 meant the participant did not codeswitch at all and 10 meant that codeswitching happened almost all the time when speaking Spanish. This variable indicates the amount of bilingual interaction the participant has daily, given that codeswitching requires interlocutors who speak both languages.
LANGUAGE PROFICIENCY FACTORS
1. Fluency
Given that the focus of the study is on speech production, and phonetics in particular, we focus on oral fluency measures as one of the proficiency factors. Speech samples were collected using monologue tasks in English and Spanish. The monologue prompts were of two types. The first prompt asked participants to discuss a topic related to their family or childhood. This was based upon the hypothesis that heritage speakers would be more accustomed discussing family-related topics in Spanish rather than in English. The second prompt was related to current events or university courses the participant was taking. Participants were encouraged to speak for about 2 minutes and a 1-minute sample was taken from 0:15 to 1:15 of the monologue for each language. Participants saw the prompt and had 15 seconds to think about what to say. Productions were recorded into a USB microphone connected to a PC computer. We counted the number of mid-clause pauses greater than 250 ms in a 1-minute speech sample (De Jong & Bosker, Reference De Jong, Bosker and Eklund2013; Leonard & Shea, Reference Leonard and Shea2017). Mid-clause pauses (vs. end-of-clause pauses) have been shown to influence the perception of fluency by native speaker listeners. We calculated the fluency measure for each monologue task in both languages, for a total of two scores in Spanish and two scores in English. We then summed the total number of mid-clause pauses for Spanish and the total number for English and that number formed the score for this variable for each language.
2. Expressive vocabulary scores
The vocabulary measure was the Expressive One Word Picture Vocabulary Test (EOWPVT; Martin & Brownell, Reference Martin and Brownell2012), a standardized expressive vocabulary test (untimed) in English and Spanish. For this test, participants see an image on a card and must name it. The experimenter notes correct and incorrect or unknown responses on an answer sheet. The EOWPVT has different starting points, normed for different age groups. The maximum, or ceiling score, is determined by six errors out eight responses, after which the test is halted.
When evaluating heritage speaker vocabulary knowledge, dominance domains play a key role. The heritage speaker participants in this study were monolingual Spanish speakers for at least the first three years of their lives (age of English onset ranged from 3–6 years) and were therefore exposed to Spanish childhood vocabulary words. English, however, was the language of formal education for all participants. These two distinct learning trajectories suggest different vocabulary knowledge for each language. Thus, we started the Spanish expressive vocabulary test at 6 years of age, with the expectation that the upper levels of vocabulary in Spanish would not be reached. We started the English expressive vocabulary test at 16 years of age, with the expectation that the upper levels of vocabulary knowledge in English would be reached. This achieved a dual purpose. First, time restrictions limited the number of images we could present to each candidate and, second, given the time restrictions, it allowed us to test the child vocabulary knowledge in Spanish and more academic and specialized vocabulary knowledge in English. Each language was scored out of a maximum of 60 points.
3. Picture naming
Participants completed a picture-naming task in Spanish and English. All words were selected from UCSD normed database for picture naming (Szekely et al., 2004) (see Appendix B online for a list of words and their frequencies for both languages). Images were black-and-white line drawings, rated as highly imageable, with an objective age of acquisition less than 5 years and a percent naming agreement of at least 90%. None of the words were obvious cognates (e.g., banco “bank” in Spanish—bank) or interlingual homographs (e.g., red “net” in Spanish—red “color” in English). All words were between three to six letters in length and had either two or three syllables.
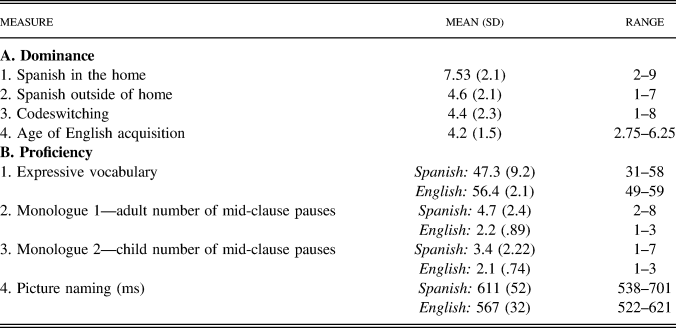
Stimuli were presented using Superlab 5 experimental software (Cedris Corporation, 2014). Participants were told that they were going to see a series of pictures and had to name them as quickly and accurately as possible. They were instructed to speak clearly and avoid fillers such as “um” or “uhh.” If they did not know the name of the picture, they were told to say “pass.” Responses were collected using the SV-1 Voice Key (Psychological Software Distribution). Responses were also recorded onto the computer for later verification. Trials initiated with a central fixation cross that was presented for 500 ms. After 300 ms interstimulus interval, a small beep sounded and the picture was presented in the center of the computer screen. The pictures remained on the screen for 4,000 ms. The interval between trials was 1,500 ms. There were 20 pictures in total for each language. For the regression analysis, we only counted correct response scores as part of the predictor variable. Errors in naming (1.9% in Spanish, .8% in English) were not included. RTs more than 2.5 standard deviations above each participant’s mean RT were also discarded (1.1% in Spanish, .6% in English). Table 1 lists the measures and how each was quantified for the regression analyses.
Given time restrictions, it was not possible to have the heritage speakers come in for separate sessions in each language. Language order (Spanish vs. English) was counterbalanced across participants. The first task was always the vowel word list and the other three were counterbalanced across participants. The experimenters were bilingual and switched between languages with the heritage speakers. With the nonheritage Spanish speakers, the session was conducted entirely in Spanish. For the nonheritage English speakers, the session was conducted entirely in English. The two comparison groups only read the word list.
RESULTS
PILLAI SCORES
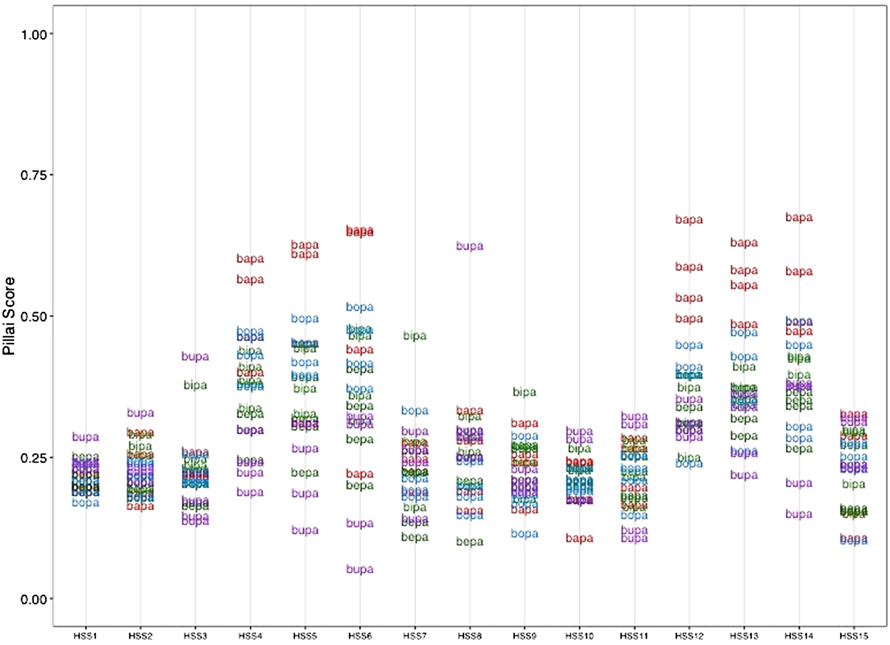
The Pillai scores were calculated using the R code provided in Hall-Lew (Reference Hall-Lew2010). Figure 1 shows the Pillai scores for Spanish and Figure 2 shows the scores for English. Higher Pillai values indicate a lower degree of overlap between the heritage speaker and the average for the nonheritage native speakers in F1/F2 space and lower Pillai indicates greater overlap. Appendix A online provides the Pillai scores for each participant by vowel and by language.
Spanish Pillai scores by participant.
English Pillai scores by participant.
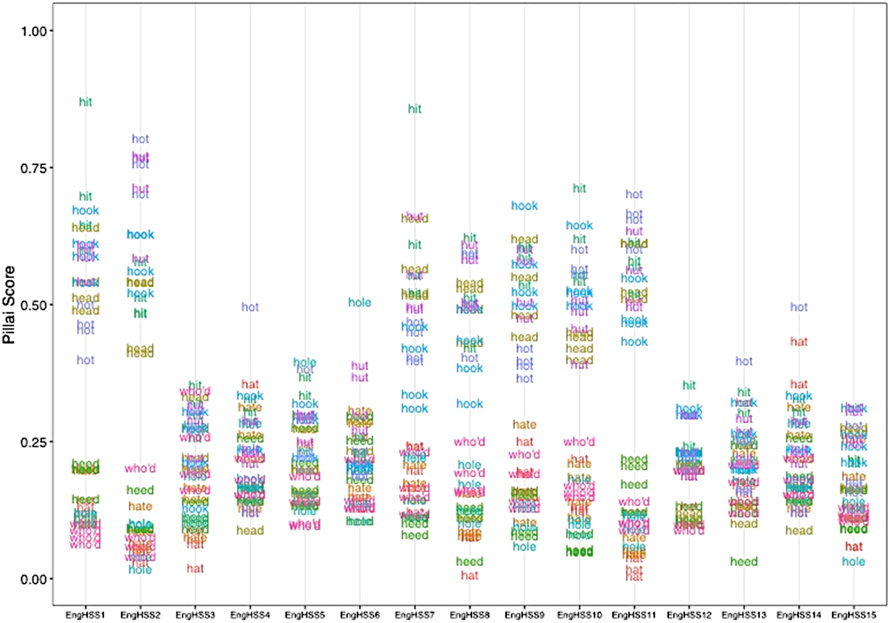
As shown in Figure 1, the Pillai scores for Spanish are more compact than those for English, suggesting greater overlap in general for the Spanish vowels than for the English vowels.
DOMINANCE AND PROFICIENCY RESULTS
Table 2 presents the means, standard deviations and ranges for the predictor variables.
Means and standard deviations for dominance and proficiency measures
We present two tables for each regression model. The first shows results from the correlation and regression analyses. The second shows results from the CA for the unique variance, specific to each predictor. At the end of the results section (Table 11) we provide the unique and common variance in R2 for each predictor and combination of predictors, that is, the second- and third-order effects. In CA, there are 2k-1 possible independent effects. For a model with four predictors, that means 15 in total.
SPANISH DOMINANCE
Table 3 provides the results from the correlation matrix and multiple regression model for the Pillai scores and each of the Spanish dominance factors. There were moderate to high correlations between Spanish at home and outside of home (r = .55), Spanish at home and codeswitching (r = .44), and Spanish outside the home and codeswitching (r = .61). The correlation coefficients between the Pillai scores and Spanish inside and outside the home were negative, reflecting the fact that as Pillai scores go up (i.e., less overlap with the nonheritage native Spanish speakers’ vowel distribution), Spanish at home and outside the home goes down. For codeswitching, the coefficient was also negative.
Correlation and regression results for Spanish dominance

*** =p < .001, **=p < .01, *=p < .05.
The results from the regression analysis revealed that the four predictors related to Spanish dominance accounted for only about 10% of the variability (RFootnote 2Adj = .096). Overall the model was significant (F[4, 295] = 8.72, p < 0.001).
Table 4 presents the results from the CA for the Spanish dominance model. In this table, the first column includes the structure coefficient (rs). The structure coefficient is the Pearson correlation coefficient between the independent variable and the predicted outcome scores  ${\rm{\vskip-4pt\hat{\hskip-0pt\vskip4ptY}}}$. The rs values are unaffected by collinearity, which does affect the interpretation of the beta weights, found in the next column, followed by the unique variance contribution of each predictor to R2, the common variance contribution and the percentage each predictor explains of the overall regression effect, or the ‘%effect of R2’.Footnote 5 The sum of column 4 (Total % of R2) can exceed 100% because it represents the total contribution of that particular variable to the total variance, including unique and common contributions. CA yields partitions that always sum to R2 and can be viewed as effect sizes (e.g., < 1% negligible, > 1% small, > 9% moderate, and > 25% large).
Spanish dominance commonality analysis

The variables with the largest unique contributions were Spanish outside of home (4.3%) and codeswitching (1.2%). The predictor English age of acquisition uniquely explained 0.8% of the variance in the Spanish Pillai scores and Spanish use at home explained 0.7%. None of the individual predictors had more than a moderate effect size. The highest total contribution to the variance in Spanish Pillai scores was made by the predictor Spanish outside the home (72%), followed by Spanish use at home (42%). English age of acquisition and codeswitching contributed very little to the overall model variance (14% and 10%, respectively). Figure 3 portrays the unique, common, and total contributions for each factor to the variance related to the Spanish Pillai scores.
Unique, shared, and total variance contributions for each predictor variable in Spanish dominance CA.

These results are unsurprising given the dominance profile of the participants—heritage Spanish speakers who speak Spanish at home with their family and started to learn English around the same age, right before beginning school (see Table 1). Spanish outside the home and codeswitching made the greatest contribution overall to the variance in the dominance model (40% and 11.1%, respectively), even though their unique contributions were only moderate.
Table 11 includes a more fine-grained presentation of the predictors, their relationship to each other, and their shared contribution to overall model variance. The combination of Spanish use inside and outside the home made the largest contribution to the total variance, at 19%. However, as noted previously, most of this variance comes from Spanish outside the home. The negative shared effect between Spanish outside the home and codeswitching (-10.6%) indicates the presence of a suppressor effect. In multiple regression, a suppressor variable has zero (or close to zero) correlation with the dependent variable but is correlated with one or more of the predictor variables, as is the case with codeswitching (Table 3), which has a high correlation with Spanish outside the home. Codeswitching serves to suppress the irrelevant variance of the other independent variable(s), in this case, Spanish outside the home. For this particular group of participants, age of English acquisition does not appear to make an important individual contribution to the variance in the Spanish dominance model, once the other three variables are taken into account.
SPANISH PROFICIENCY
Table 5 presents the results from the correlation analysis and multiple regression model for Spanish proficiency. There were moderate to high correlations for all factors with the dependent variable. The correlations between Spanish vocabulary and the other variables were negative; higher vocabulary meant lower number of pauses and lower Pillai score, which meant greater overlap in vowel distributions.
Correlation and regression results for Spanish proficiency

*** =p < .001, **=p < .01, *=p < .05.
The regression results revealed that the four predictors accounted for 40% of the overall variability (RFootnote 2Adj = .401). The model was significant (F[4, 295] = 29.72, p < 0.001). Table 6 provides the results from the CA.
Spanish proficiency commonality analysis

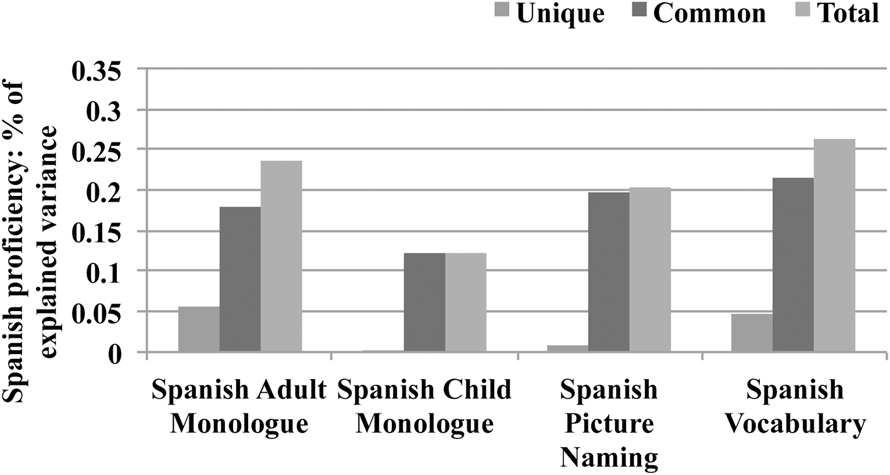
Of the four predictors, Spanish vocabulary made the highest unique contribution to the overall model variance (7%), followed by Spanish adult monologue (5.7%) and Spanish picture naming (4.7%). Spanish child monologue did not make a meaningful unique contribution to the overall variance (.17%). In terms of contribution to the total model variance, vocabulary and picture naming were the highest (52% and 48%, respectively) and then the two monologue scores (adult: 43%; child: 30%). Figure 4 portrays the unique, common, and total variance explained for each of the four predictors.

As can be seen in Table 11, the adult monologue task accounted for the highest unique amount of variance (17%), followed closely by vocabulary (16%) and picture naming (15%). Child monologue accounted for a very low amount (0.16%). In terms of shared second-order variance, adult monologue and picture naming contributed 14% to the overall total variance and picture naming and vocabulary contributed 11%. No other higher-order effects made contributions that were of any notable magnitude (< 9%). Of the four predictors, child monologue scores made the smallest contribution overall to the variance scores.
ENGLISH DOMINANCE
For English, we examined the correlation coefficients and multiple regression results for the dominance factors first, using the entire set of ten vowels. The Multiple R2 value for dominance was very low (R2 = .036). Overall, the model was significant (F[4, 595] = < .001). After examining the distribution of vowels and Pillai scores in Figure 3, we determined that there was a noticeable difference between the tense and lax and low vowels: Higher Pillai scores (less overlap with the nonheritage English speakers) were observed for the lax vowels [ɪ ɛ æ ʌ ʊ] and low vowel [ɑ] than for the tense vowels [i e o u]. To confirm this, we conducted a paired samples t-test on the average Pillai score for each participant across each set of vowels. The results revealed that there is a significant difference in Pillai values between [i e o u] (M = .1996, S.D. = .0197) and the lax vowels plus the low back vowel (M = .337, S.D. = .122), t(14) = 4.66, p = .00037. This indicates significantly less overlap in the distributions for the lax vowels and [ɑ] than for the tense vowels in English. With the goal of creating the most informative regression model possible, we opted to run the regression model using the Pillai scores for the lax vowels and [ɑ]. Table 7 provides the correlations and regression results for this model.
Correlation and regression results for English dominance

*** =p < .001, **=p < .01, *=p < .05.
For the English dominance model, there was a strong positive correlation between Spanish outside the home and codeswitching (r = .697) and Spanish inside and outside the home (r = .516). Weak correlations were observed between codeswitching and the English Pillai scores (r = .031) and age of English acquisition (.027).
The regression results showed that the English dominance predictors accounted for about 28% of the overall variability (RFootnote 2Adj = .274), which was twice as much as that accounted for by the Spanish dominance model. Overall the model was significant ((F[4, 355] = 21.69, p < 0.001). Table 8 presents the results from the CA for the English lax vowels and [ɑ] dominance factors.
English dominance commonality analysis

The predictor Spanish outside the home contributed the highest percentage of unique variance (5.1%), followed by age of English acquisition (4.2%). Spanish at home and codeswitching contributed 1.9% and 3.5%, respectively. In terms of the total variance in R2, codeswitching accounted for only 3% while Spanish outside the home and English age of acquisition accounted for 36% and 33%, respectively. Similar to the Spanish dominance model shown previously, codeswitching is a suppressor variable in this model. It exhibits a very low correlation with the Pillai scores (Table 7), a low unique contribution, and negative beta coefficients. Figure 5 shows the unique, shared, and total variance contributions for each predictor variable.
Unique, shared, and total variance contributions for each predictor variable in English dominance CA.

As shown in Table 11, the unique contribution of the four predictors as a percentage of model variance was lowest by far for Spanish inside the home, at 9.7% (Spanish outside the home: 26%; AoA English: 21%; codeswitching: 18%). Second-order effects were highest for Spanish inside and outside the home (16%). Third-order effects were highest for age of English acquisition, Spanish at home, and Spanish outside the home (11.63%). However, as stated, Spanish inside the home made very little unique contribution to model variance overall.
ENGLISH PROFICIENCY
We used the lax vowels and [ɑ] for the English proficiency correlation analysis. Coefficients ranged from weak (r = .222) for the child monologue and adult monologue (r = -.114) to strong positive for English picture naming and adult monologue (r = .673) to a strong negative correlation between English picture naming and Spanish vocabulary (-.635). The results from the regression analysis revealed that the four predictors related to English prominence accounted for about 40% of the overall variability (RFootnote 2Adj = .36) and overall the model was significant ((F[4, 355] = 49.99, p < 0.001).
Table 9 presents the results from the commonality analysis (CA) for the English lax vowels and [ɑ] proficiency factors.
Correlation and regression results for English proficiency

*** =p < .001, **=p < .01, *=p < .05.
The contribution of the predictor English picture naming to R2 was 78% of the total variance in the English Pillai scores; English vocabulary explained 58%. English adult and child monologue explained 7% and 3%, respectively (see Figure 6).
Unique, shared, and total variance contributions for each predictor variable in English proficiency CA.

The largest unique contribution to the full model variance was English picture naming (8.3%), followed by the adult monologue (7%). For second-order effects, English picture naming and English vocabulary together uniquely accounted for 24.9% of the full model variance. Following this were the third-order effects of adult monologue, picture naming, and English vocabulary, at 18.3%. Tables 9 and 10 present the proficiency commonality analysis for English.
English proficiency commonality analysis

In Table 11 we present the unique contributions of all predictors and combinations of predictors to the variance in Spanish and English Pillai scores. The highest percentages for each model are highlighted in bold. The confidence intervals (.95 CIs) for the commonality coefficients are also provided. These were calculated using the boot.yhat function (Nimon, Oswald, & Roberts, 2013), part of the yhat package in R.
Unique and shared effects for all possible subsets of the regression commonality analysis

AM = adult monologue; AoA = age of acquisition; CdSw = codeswitching; CM = child monologue; PN = picture naming; SpnH = Spanish at home; SpnO = Spanish outside home; Voc = vocabulary.
In sum, the CA results show that indeed, different factors made distinct unique and combined contributions to the variance in Pillai scores across both languages for dominance and proficiency. In the next section, we discuss the significance of these results for the overall picture of Spanish heritage speaker vowel productions in English and Spanish.
DISCUSSION
The goal of this study was to empirically demonstrate that heritage speaker dominance and proficiency in each language reflect the experiences and knowledge particular to that language. To this end, we calculated Spanish and English Pillai scores to measure the degree of overlap between heritage speaker and nonheritage speaker vowel distributions. We used CA to determine the precise contribution of each factor to the overall variance. CA allowed us to examine the unique and shared contributions of all predictors to the regression models and tease apart individual and common effects in accounting for the variability in Pillai scores.
Overall, Spanish outside the home made the greatest unique contribution to the Spanish dominance model, followed by the shared variance between Spanish inside the home and outside the home. The small unique contribution made by Spanish inside the home (.67%) compared to its large shared proportion of variance (47%) suggests that this variable is highly correlated with others, in particular, Spanish outside the home. The use of the heritage language at home is one of the characteristics often used to define a heritage language so it is not surprising that this variable did not account for a high degree of unique variance in the model.
For the English dominance model, however, age of English acquisition uniquely contributed 21% of the variance (vs. 7.5% of the unique variance for Spanish dominance) and Spanish outside the home contributed 26%. Age of English acquisition accounted for a larger proportion of the variance in the English Pillai scores than in Spanish. For the participants in this study, the range of first exposure to English was 3 to 6 years of age. By 3 years, children have already begun to establish the phonetic categories that form the basis for their native language. When the Spanish heritage speaker participants were exposed to English, their Spanish phonetic categories may have influenced the development of English. However, as noted, these effects did not occur across all vowels—they affected primarily the lax vowels in English that are not part of the Spanish inventory.
For both Spanish and English, Spanish outside the home accounted for a high proportion of the unique variance (Spanish: 40%; English: 26%). Importantly, for Spanish, the structure coefficient and beta weight were negative, while for English they were both positive, suggesting that the more Spanish an individual speaks outside of home, the more she approximates nonheritage native Spanish speaker vowel productions. For English, the result was the opposite—more Spanish spoken outside the home means less approximation to nonheritage native English speaker vowel productions. Extensive use of Spanish outside the home means the speaker is interacting with a wider variety of Spanish speakers (not just family members) and therefore using the language in different contexts. In addition to the obvious effect of speaking more Spanish, interacting with a wider variety of speakers may also serve to increase exposure to variable forms and increase exposure to more words and contexts (Gollan, Starr, & Ferreira, Reference Gollan, Starr and Ferreira2015).
To summarize, the factors related to dominance made different unique and common contributions to the Spanish and English variance in Pillai scores. This indicates that heritage speaker production in each language reflects distinct age of acquisition and context effects as a consequence of diverse experiences with each language.
The proficiency results also showed that different factors account for the variability in each model across Spanish and English. The unique contribution of the adult monologue score was more than two times greater for Spanish than for English (17% vs. 7%), clearly reflecting the effect of context of use upon the outcome of the monologue tasks.
The unique contribution of picture naming was also almost twice as large for Spanish as for English (15% for Spanish vs. 8% in English). The connection between picture naming and phonetics is not direct but rather mediated by the speed of lexical retrieval and the execution of articulatory plans. Specifically, to quickly identify an image (retrieval) and then articulate its name requires previous experience with the lexical item and the articulatory routines involved. Faster, more automatic articulatory routines reflect greater practice and, in this case, phonetic productions that are closer to nonheritage native speaker values.
Another important difference was found in the contribution of vocabulary scores. In Spanish, vocabulary knowledge accounted for 16% of the unique variance in R2. In English, vocabulary did not account for any unique variance at all (0%), which is also not surprising considering the heritage speakers were university students who had received all their formal education in English—less variability in English vocabulary knowledge was to be expected. For Spanish, the adult monologue, picture naming, and vocabulary tasks made unique contributions to the model variance that summed to almost 50% of the total. For English, the unique variance of the four proficiency factors summed to only 15%.
CONCLUSIONS
In this study, we set out to explore how different factors related to dominance and proficiency account for the variability observed in heritage speaker vowel production. The results showed that different factors accounted for unique and shared variance across each language, a logical outcome given the reality of heritage speaker linguistic experience. Heritage speakers are connected to their heritage language and the majority community language in different ways and through different contexts of use. Therefore, factors that best account for variability in heritage language proficiency will not necessarily be the same as those that reflect variability in the majority community language.
For both English and Spanish, the proficiency model accounted for a much higher percentage of the variability in Pillai scores than did dominance (four times more in Spanish). This suggests that there are other factors at play when capturing the notions of dominance that were not fully accounted for by our four variables, which we believe reflects the difficulty of capturing language dominance in general. The greater explanatory power of proficiency variables over dominance may be that proficiency is, essentially, easier to measure and therefore more reliable. Dominance measures for the most part rely upon individual reports regarding language use, interaction contexts and preferences. Questionnaires designed to measure dominance, such as the LEAP-Q (Marian, Blumenfeld, & Kaushanskaya, Reference Marian, Blumenfeld and Kaushanskaya2007) and BLP (Birdsong, Gertken, & Amengual, Reference Birdsong, Gertken and Amengual2012), have components that rely upon self-reports. This may be an unavoidable consequence due to the nature of dominance. In the present study, we did not include factors related to self-identity or cultural affinity, which may also play a role in the contexts of use for the heritage language.
One other important point to consider when discussing the results from this study concerns the type of input participants are receiving. Some of our participants were from Chicago and the greater Chicago region, from communities where Latinos (predominantly of Mexican descent) form the majority. In their home communities, they interact in Spanish with family and neighbors, and even in commercial establishments in the area. These individuals have a high density of interaction in Spanish when living in their home communities. The other group of heritage speakers was recruited from Iowa, from towns with much smaller networks of Spanish speakers. These participants do not use Spanish as much outside of home and did not have many (in some cases zero) fellow heritage speakers in class with them during elementary or high school.
Moving forward, the results from this study suggest two important points for consideration. First, heritage speakers use each of their languages in different domains. When thinking about proficiency and dominance in the heritage speaker context it is important to keep this in mind. Proficiency and dominance are constructs that rest upon a complex set of factors, which may interact differently for each of the heritage speaker's languages. The results from this study suggest that researchers should use the idea of ‘Spanish’ or ‘English’ dominant heritage speakers with care, keeping in mind the goals of their study and research questions. Second, it is useful to consider dominance and proficiency as separate but related constructs (or at least proficiency as a subpart of dominance, see Montrul Reference Montrul, Silva-Corvalán and Traffers-Dallers2016), particularly for heritage speakers. If dominance is not considered as separate from—but still related to—proficiency, we may inadvertently ignore the very thing that makes heritage speakers a unique population of language learners, distinct from early childhood bilinguals who maintain both languages and from second language learners: the role played by context of language use in language development.
Finally, it is important to note that the results obtained here hold for this particular group of speakers. Different speakers, with different dominance and proficiency trajectories will exhibit distinct patterns of shared and unique variance across factors. If instead of looking at sequential bilinguals we had examined simultaneous bilinguals, the variability in Pillai scores may have decreased, given the more uniform and earlier age of acquisition for both languages. The goal of this investigation is to highlight precisely this fact. Each of the heritage speaker’s languages develops under different conditions and variability across heritage speaker phonetic productions is to be expected.
SUPPLEMENTARY MATERIAL
To view supplementary material for this article, please visit https://doi.org/10.1017/S0272263117000328
APPENDIX A
SPANISH PILLAI VALUES

ENGLISH PILLAI VALUES

APPENDIX B
WORD LIST
APPENDIX C
WORDS FOR PICTURE-NAMING TASK