


1. Introduction
Microearthquakes beneath ice sheets and glaciers—commonly referred to as icequakes in glaciological contexts—reveal a wealth of critical information on a range of basal processes, including basal drag (Anandakrishnan and Bentley, Reference Anandakrishnan and Bentley1993), subglacial water flow (Winberry and others, Reference Winberry, Anandakrishnan and Alley2009; Clyne and others, Reference Clyne2023), subglacial erosion (Zoet and others, Reference Zoet, Alley, Anandakrishnan and Christianson2013), time-evolution of the bed (Walter and others, Reference Walter, Deichmann and Funk2008; Helmstetter and others, Reference Helmstetter, Nicolas, Comon and Gay2015; Kufner and others, Reference Kufner2021; Stevens and others, Reference Stevens2024) and much more. The field is advancing rapidly as new applications emerge and improvements in instrumentation and observational techniques expand the scope of what can be detected and analyzed.
A major challenge in microseismic research on glaciers is the ongoing and rapid increase in data volume. The original discovery of glacier-bed microseismicity, on Ice Stream B (now Whillans Ice Stream), West Antarctica in 1984–85, involved observation of ‘a few’ natural events during an active-seismic experiment (Anandakrishnan, Reference Anandakrishnan1990), including one clear basal event. This led Anandakrishnan (Reference Anandakrishnan1990) to develop and deploy a new digital, fiber-optic-linked, triggered seismic array at the Upstream B camp on Ice Stream B during 1985–86, which detected 25 events, including 9 basal events (Blankenship and others, Reference Blankenship, Anandakrishnan, Kempf and Bentley1987). A subsequent deployment on Ice Stream C (now Kamb Ice Stream) detected 161 microearthquakes (Anandakrishnan, Reference Anandakrishnan1990). These 161 microearthquakes were used to assess the importance of seismicity in basal motion, showing that most of the basal drag is supported on a few sticky spots, characterizing the size and stress on these sticky spots and demonstrating that triggered seismicity extended up to 1.5 km from events on asperities (small, seismogenic sticky spots) of order 10 m diameter (Anandakrishnan, Reference Anandakrishnan1990; Anandakrishnan and Bentley, Reference Anandakrishnan and Bentley1993; Anandakrishnan and Alley, Reference Anandakrishnan and Alley1994).
During 1995–96, arrays of short-period seismometers were deployed along the length of Ice Stream C/Kamb Ice Stream and operated in triggered mode. The times of all triggered events were recorded, and selected events were examined in greater detail to understand the characteristics of the seismicity. Basal events dominated along the ice stream, with additional events near the grounding zone. The timing of the hundreds of events observed, taken from the trigger record, revealed a velocity response to grounding-zone tidal fluctuations propagating 85 km inland in approximately 15 hours, demonstrating the ability of coastal perturbations to affect inland ice rapidly (Anandakrishnan and Alley, Reference Anandakrishnan and Alley1997).
This increase in data volume has only accelerated. Modern seismic deployments, processing and analysis techniques enable increasingly detailed and nuanced investigations into numerous controlling parameters of the basal environment and their variations in space and time. These insights are enabled by vastly larger datasets of detected events, such as 100 000 events (Hudson and others, Reference Hudson2023), 230 000 events (Kufner and others, Reference Kufner2020, Reference Kufner2021), 250 000 events (Stevens and others, Reference Stevens2024) or over one million events (this study). Automated processing and analytical techniques became favorable when the catalog grew to include hundreds of events; improved automated techniques are unequivocally necessary to handle catalogs of hundreds of thousands to millions of events.
In response, many automated seismic processing tools have been developed. Arguably two of the most useful are QuakeMigrate (manuscript submitted to Seismica; preprint at EarthArXiv, doi: 10.31223/X53447; Bacon and others, Reference Bacon, Winder and Greenfield2023, Reference Bacon, Winder and Greenfield2025) and GrowClust (Trugman and Shearer, Reference Trugman and Shearer2017). Their rapidly growing importance in the community has motivated the current effort to integrate them with the data stream and with each other, while also addressing common processing bottlenecks to significantly improve efficiency. We present a high-resolution dataset of over one million icequakes located just upglacier of the grounding line of Rutford Ice Stream (RIS), West Antarctica, spanning a 23 day period from 4 to 26 January 2019, generated using QuakeMigrate, with a sample cluster relocated using GrowClust. ‘High resolution’ refers to the temporal detail of event detections that are generated by QuakeMigrate. Spatial high resolution of groups of events can be achieved through GrowClust as needed based on a user’s research objectives; a catalog-wide relocation was not performed because GrowClust relocation is most effective with waveform-similar events that are spatially related, such as those from individual sticky spots. We use ‘grounding line’ for consistency with past literature and dataset naming (Gudmundsson, Reference Gudmundsson2006; Hill and others, Reference Hill2023; Dinh and others, Reference Dinh, Rignot, Mazloff and Fenty2024), while acknowledging that ‘grounding zone’ more accurately describes the spatially diffuse and tidally modulated transition from grounded to floating ice (Fricker and others, Reference Fricker, Coleman, Padman, Scambos, Bohlander and Brunt2009; Zhong and others, Reference Zhong, Simons, Minchew and Zhu2023; Rignot and others, Reference Rignot, Ciracì, Scheuchl, Tolpekin, Wollersheim and Dow2024). This catalog includes all detected events, including non-basal events or events located farther from the array; it is provided unfiltered to allow users to apply their own criteria for filtering based on their specific research goals. All detections are reported for the full array duration, with processing parameters carefully chosen to balance event detectability and data quality. Our analyses of this catalog, including the filtering criteria applied (briefly summarized in Section 4), are presented in separate follow-up manuscripts (Lee and others, in review, basal icequakes and sticky spots; Lee and others, in review, nonsteady basal hydrology). To support the QuakeMigrate–GrowClust processing workflow, we developed QuakeSupport, a supplementary package that automates data preparation, streamlines extended QuakeMigrate runs and formats QuakeMigrate outputs for GrowClust (Lee and others, Reference Lee, Anandakrishnan and Alley2025a).
2. Study area and data
2.1. Rutford Ice Stream
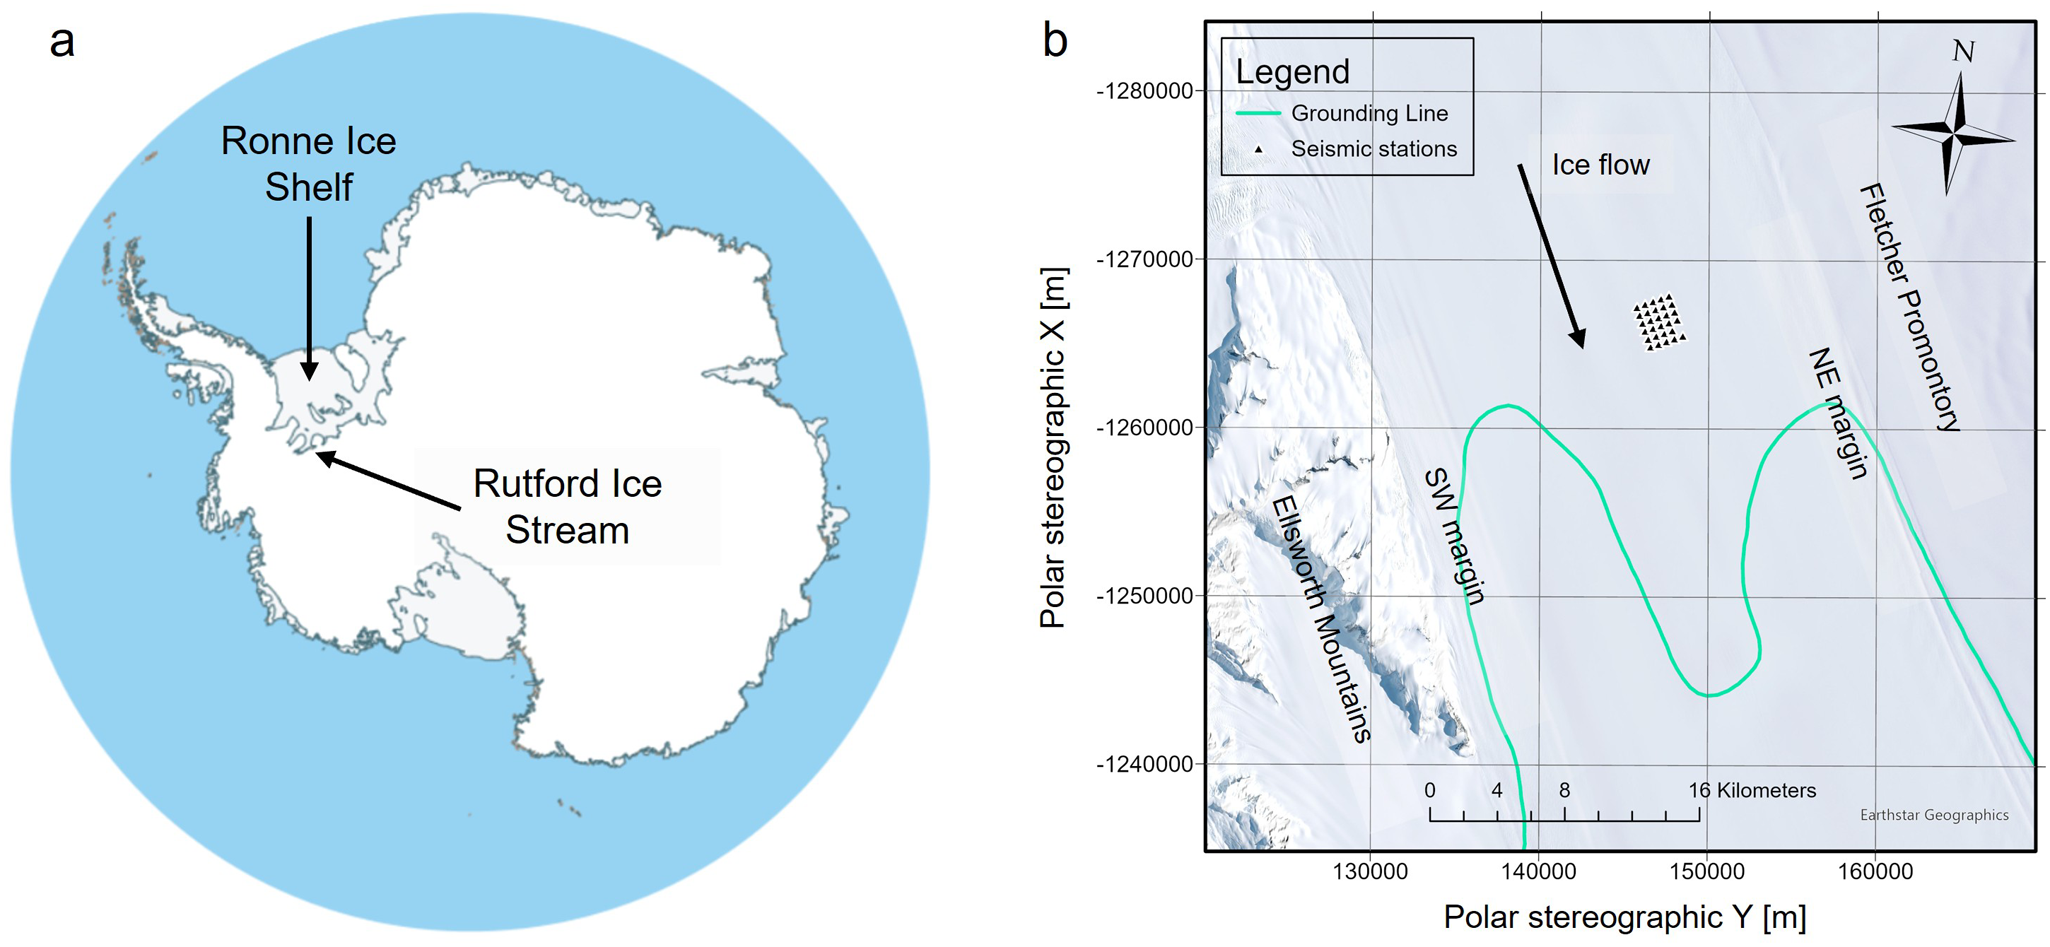
Our study area is just upglacier of the grounding line of RIS, a fast-flowing outlet of the West Antarctic Ice Sheet that drains an estimated 49 000  $k{m^2}$ sector of the ice sheet into the Filchner–Ronne Ice Shelf (Doake and others, Reference Doake, Alley and Bindschadler2001; Fig. 1a). Several previous passive seismic surveys at RIS have focused on an inland site approximately 40 km upglacier (e.g., A. Smith, Reference Smith2006; E. Smith and others, Reference Smith, Smith, White, Brisbourne and Pritchard2015; Kufner and others, Reference Kufner2021), but no prior work has targeted the grounding line directly. This area overlies a domain of either stiff subglacial till or weakly lithified sedimentary bedrock (A. Smith and Murray, Reference Smith and Murray2009; Schlegel, Reference Schlegel2022), where ice flow is likely dominated by basal sliding, in contrast to enhanced deformation over softer, more porous beds (Stokes, Reference Stokes2018). The grounding line experiences fortnightly velocity variations from approximately 0.9–1.2 ${\text{m}}\,{{\text{d}}^{ - {\text{1}}}}$—about 27% of the total velocity—due to spring-neap tidal forcing (Gudmundsson, Reference Gudmundsson2006), and the bed lies roughly 1500 m below sea level with complex basal topography (Aðalgeirsdóttir and others, Reference Aðalgeirsdóttir2008). To our knowledge, this is the first study to report seismic monitoring results near the RIS grounding line and the first event catalog focused on this region.
RIS grounding line study area. (a) Location of RIS in West Antarctica, which drains into the Ronne Ice Shelf. The map of Antarctica was retrieved from the SCAR Antarctic Digital Database, showing seamask data (Gerrish, Reference Gerrish2024) and coastline data (Gerrish and others, Reference Gerrish, Ireland, Fretwell and Cooper2024). (b) Location of the 29-station grounding line array. RIS lies in a subglacial trough bounded by the Ellsworth Mountains to the west and Fletcher Promontory to the east, with ice flowing to the southeast. The grounding line position is derived from Zhong and others (Reference Zhong, Simons, Minchew and Zhu2023). Map created in ArcGIS Pro using the World Imagery basemap (Esri and others, 2025).
2.2. Seismic dataset
We used 23 days of continuous passive seismic recordings (4–26 January 2019) from a 29-station array deployed near the grounding line of RIS (Fig. 1b), collected during the 2018/19 austral summer as part of the BEAMISH project (A. Smith and others, Reference Smith2021), to generate the high-resolution icequake catalog. Each station recorded three-component ground motion at 1000 samples per second (sps) using a 10 Hz geophone (Magseis Fairfield Nodal) with integrated power, logging and GPS timing. Stations were buried about 50 cm beneath the surface to enhance coupling and reduce noise. The array formed a rectangular 2.5 km × 2 km grid (5  $k{m^2}$ total area) with approximately 500 m interstation spacing, providing a dense, homogeneous network optimized for detecting individual icequake events. This configuration enables high sensitivity to spatiotemporal variations in basal seismicity, reflecting changes in subglacial conditions over a sustained, multi-week period. This network makes it possible to detect and characterize icequakes as a high-resolution probe of the basal properties of RIS.
The recorded seismic data were archived at the IRIS Data Management Center (IRISDMC) following the BEAMISH field season. We downloaded the raw recordings from IRISDMC for processing and catalog generation.
3. Workflow overview
To process the raw seismic data into a high-resolution icequake catalog, we applied a workflow involving detection and location of icequake events with QuakeMigrate, clustering with Density-Based Spatial Clustering of Applications with Noise (DBSCAN) and relocation with GrowClust. This workflow was streamlined with QuakeSupport to enable efficient and reproducible processing.
We note that the workflow described here was developed to optimize identification and location of events and characterization of seismicity on asperities, while minimizing processing time and effort for the research team. We experimented with many processing paths that proved suboptimal before settling on the methodology described here.
3.1. QuakeMigrate
QuakeMigrate is an open-source Python software for automatic earthquake detection and location using a waveform migration and stacking algorithm. It transforms seismic waveforms into onset functions—continuous functions indicating the likelihood of phase arrivals over time—based on short-term to long-term average (STA/LTA) ratios, which are migrated and stacked across a subsurface grid to identify coherent arrivals. Coalescence (i.e., coherent stacking) of these onset functions above a detection threshold indicates a potential event hypocenter (Winder and White, Reference Winder and White2020). QuakeMigrate is particularly effective for detecting relatively weak icequake signals at RIS, where ambient noise levels are low (as is true on the Antarctic ice sheets generally). These low ambient noise levels, combined with coherent stacking across a dense array, enhance sensitivity, event detectability and location accuracy. From the seismic data, QuakeMigrate produces a catalog of icequakes with hypocenter locations, origin times, phase picks, local magnitude estimates and associated uncertainty estimates.
QuakeMigrate has been widely used in a range of seismic and acoustic signal detection and location applications, including: basal icequakes approximately 40 km upglacier from the RIS grounding line (Kufner and others, Reference Kufner2021); caldera fault seismicity at Bárðarbunga Volcano, Iceland (Glastonbury‐Southern and others, Reference Glastonbury‐Southern, Winder, White and Brandsdóttir2022); deep long-period seismicity associated with the 2021 Fagradalsfjall eruption, Iceland (Greenfield and others, Reference Greenfield2022); seismicity around the mainshock of the 2022 Mw 5.6 Cianjur earthquake, Indonesia (Supendi and others, Reference Supendi2023); and vessel-induced acoustic signals using distributed acoustic sensing in the Dutch North Sea and off the west coast of Oregon, USA (Paap and others, Reference Paap, Vandeweijer, van Wees and Kraaijpoel2025). Since its official release in 2021, the QuakeMigrate GitHub repository (https://github.com/QuakeMigrate/QuakeMigrate) has amassed over 150 stars as of November 2025, while the associated preprint (Winder and others, Reference Winder, Bacon, Smith, Hudson, Greenfield and White2022) on Authorea has received over 800 views and over 200 downloads, along with a growing citation list—attesting to its popularity and value in the seismology community. The associated QuakeMigrate manuscript has been submitted to Seismica and is currently in review (preprint at EarthArXiv, doi: 10.31223/X53447).
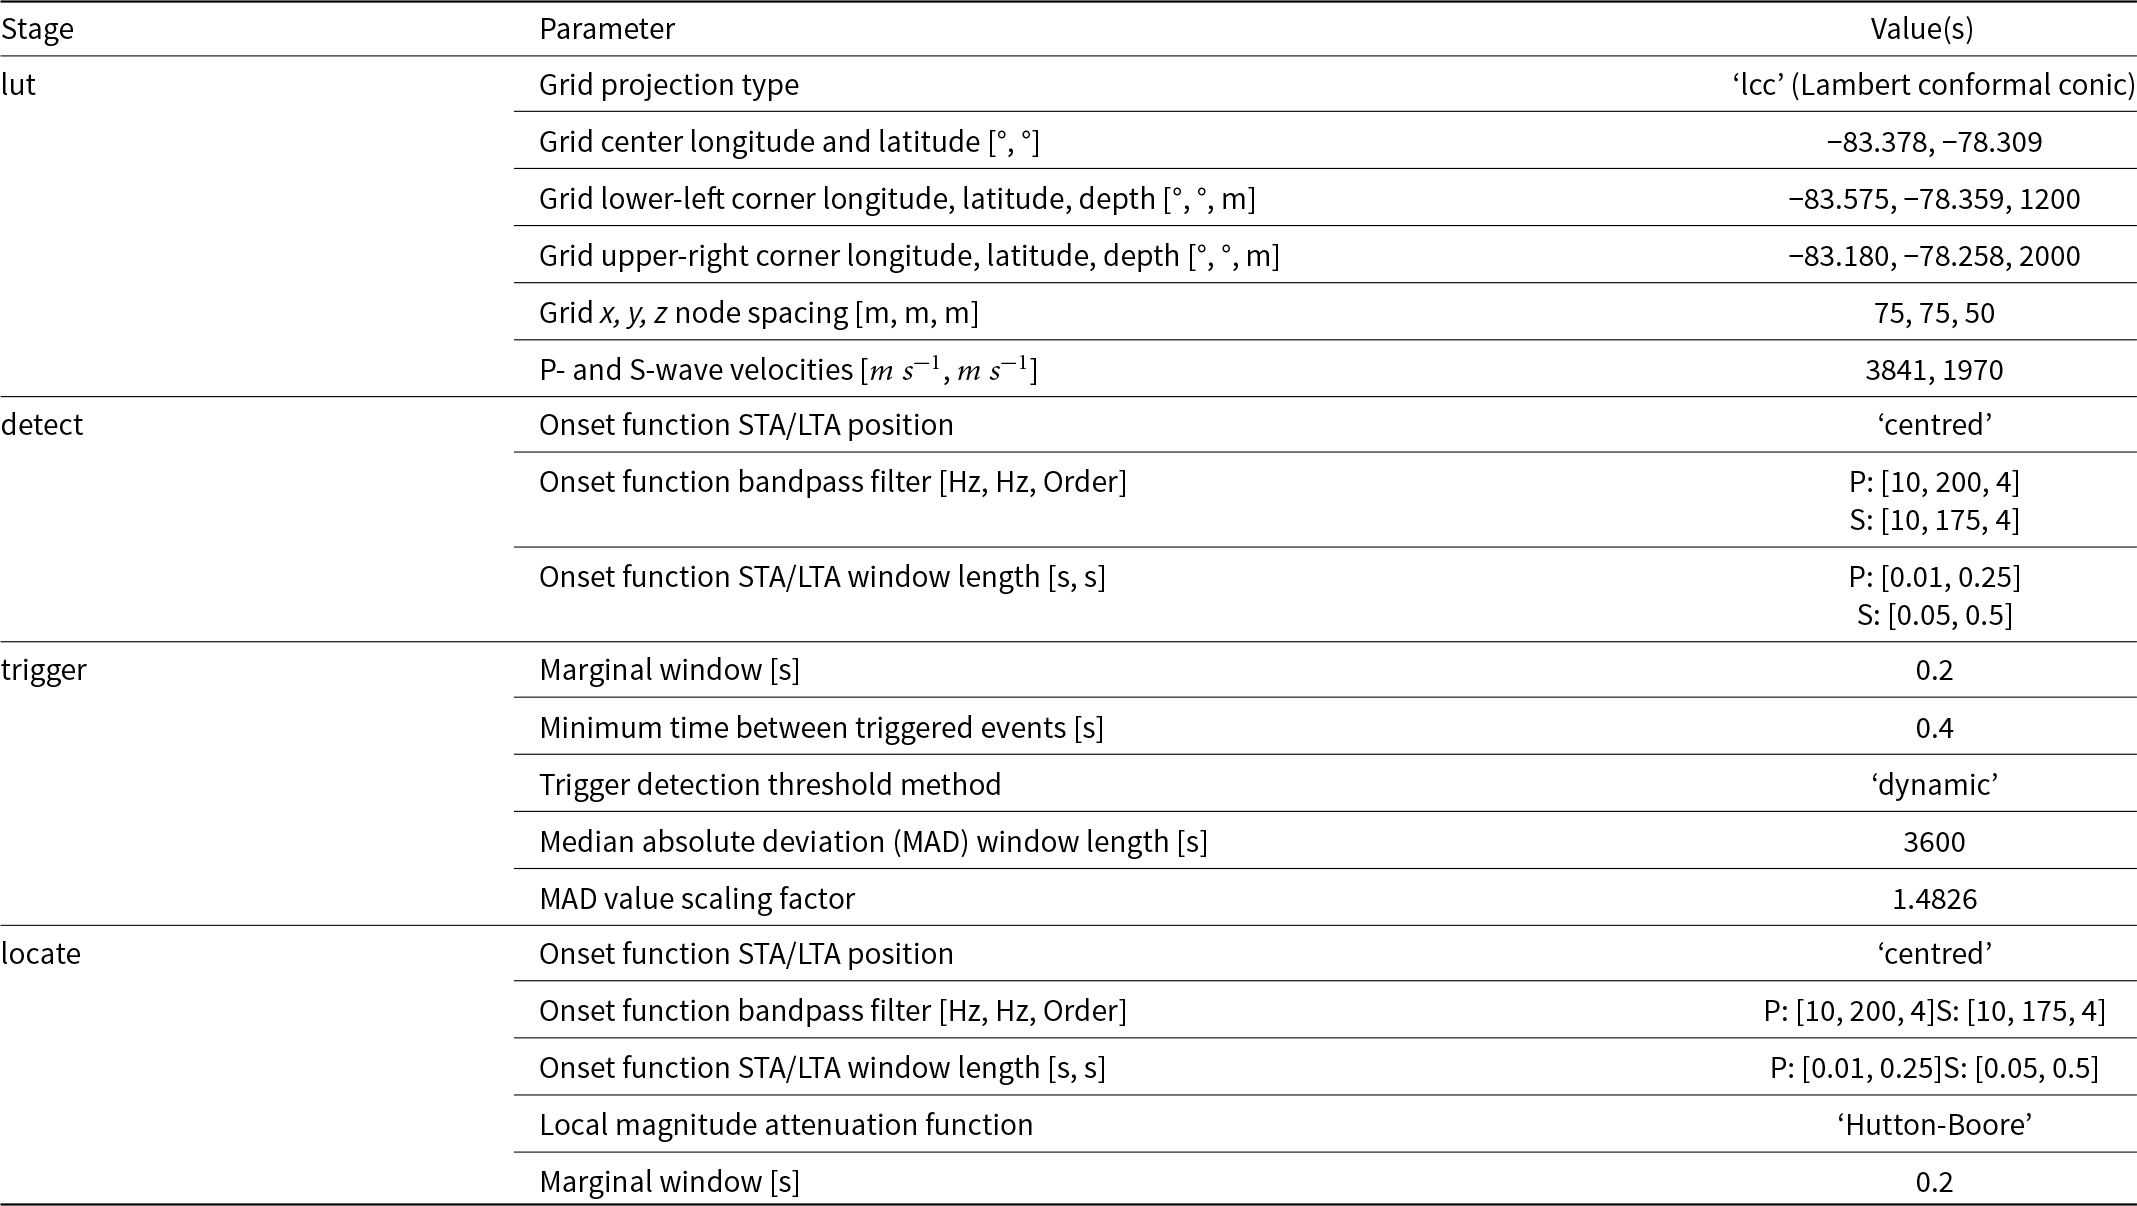
Prior to running QuakeMigrate, the downloaded seismic data were zero-calibrated (i.e., DC offset removed to center signals around zero, correcting for baseline shifts), time-aligned, separated by station and component, and reformatted to meet QuakeMigrate’s input requirements. To keep file sizes manageable and minimize computational bottlenecks that would lead to long processing times during QuakeMigrate’s detect and locate stages, the data were partitioned and read sequentially in 2 hour chunks. We used a homogeneous velocity model  $({V_p} = 3,841{\text{ m }}{{\text{s}}^{ - 1}},\,{V_s} = 1,970{\text{ m }}{{\text{s}}^{ - 1}},\,{V_p}/{V_s} = 1.95)$ consistent with observed and previously reported values at RIS (A. Smith, Reference Smith1997; E. Smith and others, Reference Smith, Smith, White, Brisbourne and Pritchard2015; Kufner and others, Reference Kufner2021). Station metadata and instrument response files were also provided, the latter required for computing local magnitudes. Additional details of the QuakeMigrate parameter tuning for the grounding line array are listed in Table 1 in the Appendix. Technical explanation and justification of parameter choices are presented in both a separate follow-up manuscript (Lee and others, in review, basal icequakes and sticky spots) and the first author’s PhD dissertation (Lee, Reference Lee2026).
3.2. DBSCAN
Before relocating the QuakeMigrate-generated events using GrowClust, we identified clusters of events using the DBSCAN (Ester and others, Reference Ester, Kriegel, Sander and Xu1996) unsupervised clustering algorithm. Given that icequakes at RIS commonly occur in spatially and temporally clustered bursts (E. Smith and others, Reference Smith, Smith, White, Brisbourne and Pritchard2015; Kufner and others, Reference Kufner2021), we examined the catalog for similar spatial patterns by grouping spatially proximate events. Such spatial concentrations of seismicity likely reflect localized ‘sticky spots’—zones of elevated basal resistance embedded within an otherwise well-lubricated bed—that are recognized as key controls on ice stream dynamics (Alley, Reference Alley1993; Stokes and others, Reference Stokes, Clark, Lian and Tulaczyk2007; Luthra and others, Reference Luthra, Anandakrishnan, Winberry, Alley and Holschuh2016).
DBSCAN identifies spatial clusters by grouping events within a specified distance and excluding isolated noise, without requiring a pre-defined number of clusters. Informed by prior observations of sticky spot diameters on the order of 10–60 m at RIS (Hudson and others, Reference Hudson2023), we selected DBSCAN parameters to capture event groupings within that size range, while accounting for QuakeMigrate location uncertainty and ice flow velocity. For regions with closely spaced clusters, we applied DBSCAN iteratively with progressively tighter distance thresholds to better separate spatially concentrated, well-constrained clusters representing distinct sticky spots. For additional context on why we use DBSCAN to define smaller, spatially coherent subsets before applying relocation in the next step, readers can refer to the QuakeSupport documentation (https://github.com/cryoilrj/QuakeSupport/tree/main/docs).
3.3. GrowClust
After DBSCAN identified well-constrained clusters in the grounding line array—potentially representing sticky spots—we refined event locations within each cluster using the GrowClust algorithm to improve event localization and more accurately define the extent of each sticky spot. GrowClust is an open-source software package with Fortran and Julia implementations for earthquake hypocenter relocation using differential travel times and waveform cross-correlation of event pairs recorded at common seismic stations.
GrowClust has been widely used in a range of high-precision earthquake relocation applications, including: injection-induced earthquakes in Harper and Sumner Counties, Kansas, USA (Rubinstein and others, Reference Rubinstein, Ellsworth and Dougherty2018); aftershocks of the 2018 Mw 7.9 offshore Kodiak earthquake, Alaska, USA (Ruppert and others, Reference Ruppert2018); foreshocks of the Mw 6.1 2009 L’Aquila earthquake, Italy (Cabrera eand others, Reference Cabrera, Poli and Frank2022); and seismic swarms above the Socorro magma body, New Mexico, USA (Aerts, Reference Aerts2024), and near the Bitdal valley, Norway (Halpaap and others, Reference Halpaap, Ottemöller, Shiddiqi and Rondenay2025). Since its release in 2017, the GrowClust GitHub repositories for the Fortran (https://github.com/dttrugman/GrowClust) and the newer Julia (https://github.com/dttrugman/GrowClust3D.jl) implementations have amassed a total of over 120 stars as of November 2025, while the associated publications (Trugman and Shearer, Reference Trugman and Shearer2017; Trugman and others, Reference Trugman, Chamberlain, Savvaidis and Lomax2023) have together garnered close to 370 citations to date, reflecting GrowClust’s sustained popularity and value in the seismology community.
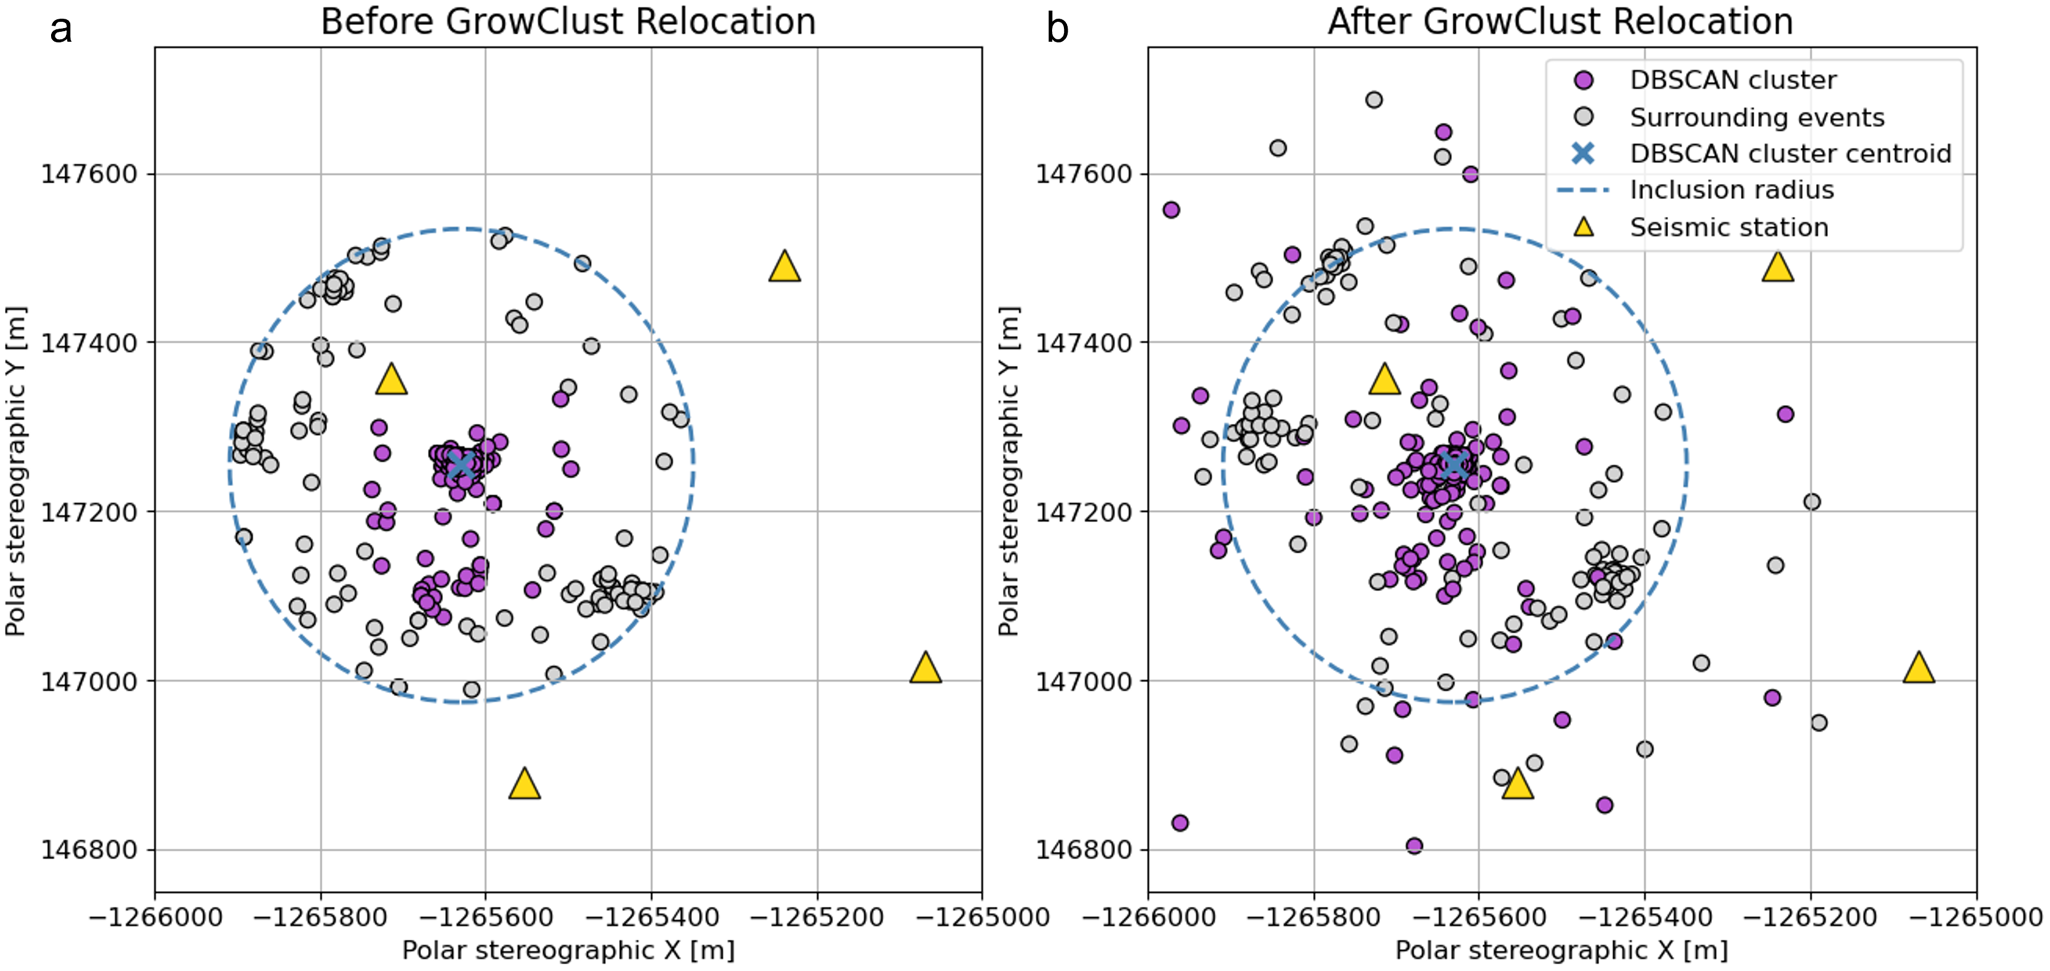
Our workflow has been tested with the Fortran implementation of GrowClust but not with the Julia version, which we have not incorporated into our setup. However, both implementations use the same standardized input formats for the event list, station list and cross-correlation data, so the Julia implementation is fully compatible with the GrowClust inputs generated by QuakeSupport. We incorporated absolute time-domain cross-correlation coefficients and differential travel times based on QuakeMigrate-derived picks and their associated uncertainties. This weighting approach reduces the influence of noisy or poorly picked arrivals while emphasizing high-similarity waveforms, helping to cluster events with similar source characteristics, such as repeated slip on a sticky spot, more closely together. GrowClust builds hierarchical linkages between events using an L1-norm misfit criterion, which is robust to outliers. Figure 2 shows an example of event relocations in and around a cluster from the RIS grounding line array using GrowClust. All GrowClust parameters were kept at their default values, except the maximum station distance for differential-time computation (10 km), set to match our QuakeMigrate array grid size, and the P- and S-wave velocities, set to observed RIS values. Technical explanation and justification of parameter choices are presented in both a separate follow-up manuscript (Lee and others, in review, basal icequakes and sticky spots) and the first author’s PhD dissertation (Lee, Reference Lee2026).
Example event relocations in and around a DBSCAN-identified cluster from the RIS grounding line array using GrowClust. (a) Before relocation: DBSCAN cluster events (purple, n = 1298) are relocated together with surrounding unclustered events (gray, n = 127) within an inclusion radius defined as the distance from the cluster centroid to the furthest cluster event, plus QuakeMigrate’s 1σ mean horizontal location uncertainty of the cluster events—accounting for events that may have had less precise initial locations from QuakeMigrate. (b) After relocation: Event colors reflect pre-relocation classification. This relocation improves the spatial coherence of event locations and better delineates the likely extent of sticky spot activity. An insignificant number of cluster events, relative to the central sticky spot, were relocated outside the circle due to initial misclassification and changing sticky-spot membership.
QuakeMigrate and GrowClust are complementary tools that integrate smoothly within a seismic processing workflow, as required GrowClust inputs—such as event locations, station metadata and waveform cross-correlation values—are readily available or can be derived from QuakeMigrate’s inputs and outputs. However, a key technical hurdle is formatting QuakeMigrate’s inputs and outputs to meet GrowClust’s input requirements.
3.4. QuakeSupport
QuakeMigrate and GrowClust are highly effective tools for generating high-granularity seismic event catalogs, but users face several challenges. Input data preparation and formatting require significant manual effort because inputs must adhere to specific formatting requirements defined by QuakeMigrate and GrowClust, with this effort compounded when working across multiple seismic arrays, extended recording periods, higher sampling rates or large miniSEED (mSEED) datasets. Additionally, during QuakeMigrate’s detect and locate stages, seismic data read times can become prohibitively long with large files, even when only a small subset of the data is being used. While reducing the time window per run and limiting input data size can help, the management and partitioning of runs to achieve this still requires considerable user oversight. QuakeMigrate also currently does not have built-in support for exporting its outputs to GrowClust, requiring users to manually convert the data. Collectively, these challenges are not immediately intuitive to address and often result in a substantial time investment.
QuakeSupport is an open-source suite of Python scripts that facilitates a seamless workflow between QuakeMigrate and GrowClust while improving performance, particularly for extended QuakeMigrate runs. QuakeSupport addresses the identified challenges through four core capabilities: First, an integrated processing pipeline (Fig. 3) that automates seismic data download and preparation, partitioning and execution of QuakeMigrate runs, and conversion of QuakeMigrate outputs into GrowClust-compatible inputs, effectively bridging the gap between QuakeMigrate and GrowClust. Second, QuakeSupport automates input data preparation and formatting for both QuakeMigrate and GrowClust, ensuring workflow compatibility. Third, QuakeSupport automates management and partitioning of QuakeMigrate runs into shorter time chunks, reducing data-reading overhead and improving processing efficiency, particularly for extended time periods, including both continuous and discontinuous intervals. Fourth, QuakeSupport has a modular design that includes three scripts capable of functioning independently outside the QuakeSupport ecosystem: a multithreaded seismic data downloader for concurrent downloads, a QuakeMigrate modeled and observed picks plotter, and a simple waveform inspection tool.
QuakeSupport workflow, consisting of the QuakeMigrate and GrowClust modules. Arrows indicate the sequence for running the QuakeSupport scripts, with optional scripts enclosed in dashed boxes. Users interested in running only QuakeMigrate can omit the GrowClust module.
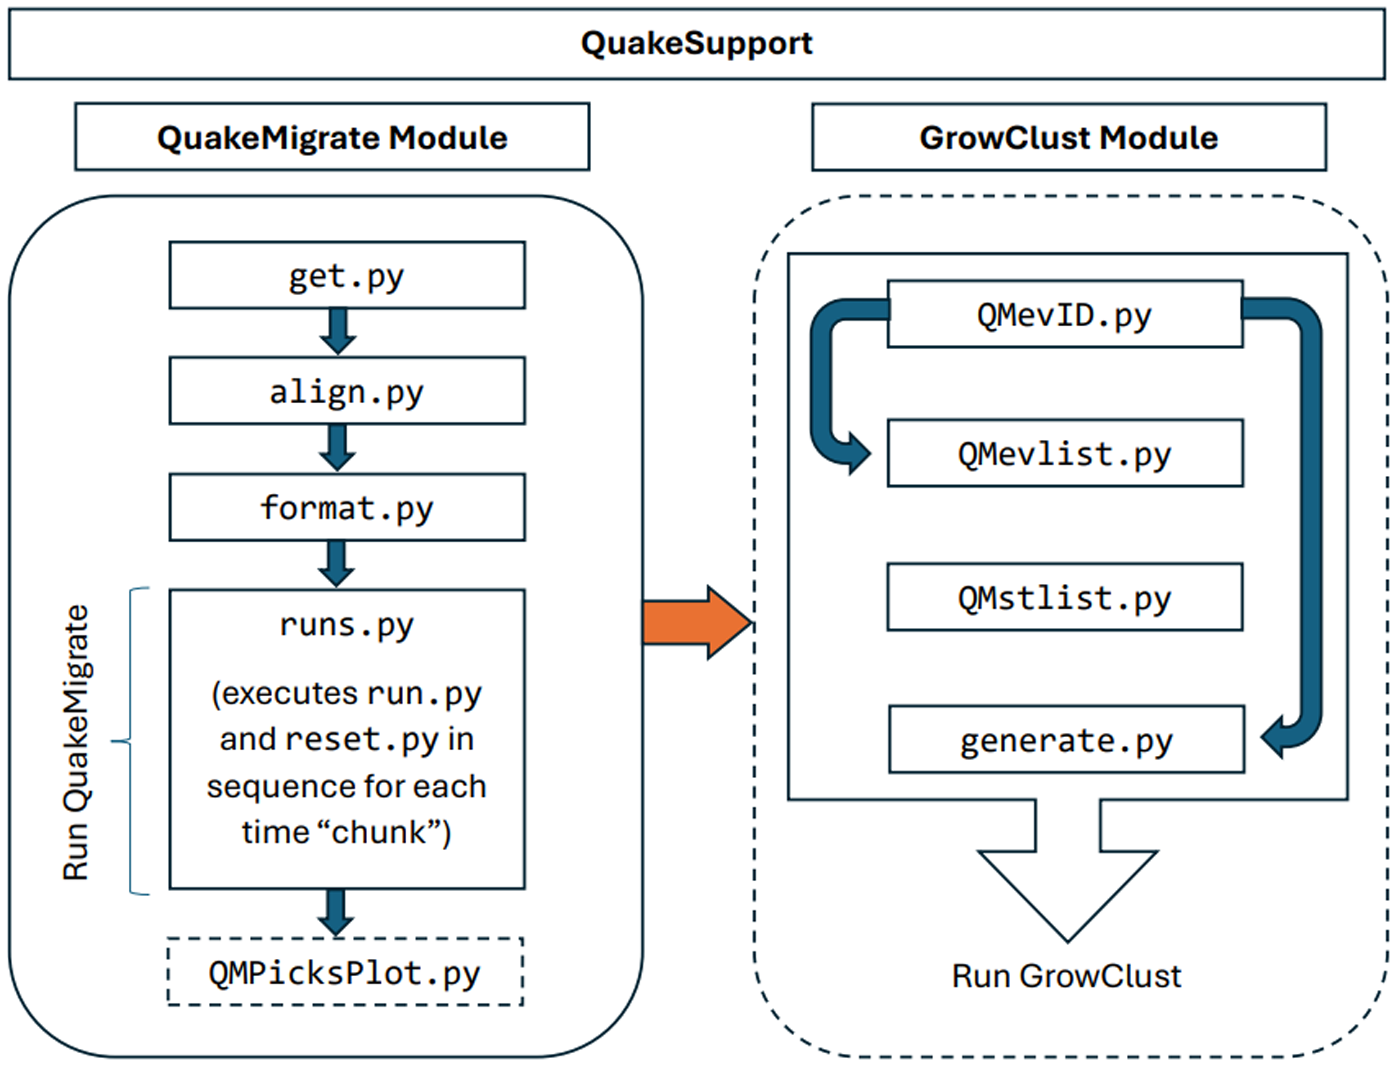
In typical use, users edit configuration blocks in each script to set parameters such as paths, time ranges and basic processing options; directory creation, QuakeMigrate script updates and all input-file formatting are handled automatically. Running the QuakeSupport scripts in the core end-to-end workflow (get.py → align.py → format.py → runs.py → QMevID.py → QMevlist.py + QMstlist.py + generate.py) efficiently downloads and prepares seismic data for QuakeMigrate input, manages and partitions QuakeMigrate runs and generates GrowClust-compatible inputs from the QuakeMigrate outputs. More comprehensive per-script details are provided in the QuakeSupport documentation (https://github.com/cryoilrj/QuakeSupport/tree/main/docs) and the first author’s PhD dissertation (Lee, Reference Lee2026).
Beyond managing the complexities of data preparation, data and run partitioning, and execution, QuakeSupport focuses on accessibility and ease of use. It centralizes user-modifiable parameters in dedicated configuration sections for intuitive access. It also leverages multithreading and multiprocessing for performance and runs cross-platform on Linux, Windows and Mac. A test module using 2018–19 Rutford Ice Stream 5B network data (Anandakrishnan, Reference Anandakrishnan2018) from an inland array, distinct from the grounding line array, is provided for validation and user orientation. A comprehensive user guide details configuration, usage and best practices. The QuakeSupport GitHub repository is available at https://github.com/cryoilrj/QuakeSupport.
QuakeSupport was developed to ease the learning curve of the QuakeMigrate and GrowClust workflows, drawing on years of hands-on experience with icequake research in RIS (Lee and others, Reference Lee, Anandakrishnan, Kufner and Alley2020, Reference Lee, Anandakrishnan, Alley, Kufner, Smith and Brisbourne2021, Reference Lee, Anandakrishnan, Alley, Brisbourne and Smith2022, Reference Lee, Anandakrishnan, Alley, Brisbourne and Smith2023, Reference Lee, Anandakrishnan, Alley, Brisbourne and Smith2024a, Reference Lee, Anandakrishnan, Alley, Brisbourne and Smith2024b). It was conceived in response to challenges and difficulties users encountered while using QuakeMigrate and GrowClust. This repository fills an identified need that expands on the capabilities of QuakeMigrate and GrowClust and has been applied in icequake studies at Thwaites Glacier (Willet and others, Reference Willet2024) and other seismic arrays in RIS (Perkins and others, Reference Perkins, Anandakrishnan, Lee, Willet, Alley and Parizek2025). Designed for both students and experienced seismologists, it supports users working with QuakeMigrate and GrowClust together, QuakeMigrate alone, or for more general tasks such as seismic data downloading. By combining automation, accelerated processing and modularity, QuakeSupport enables researchers to dedicate more effort to seismic analysis and discovery.
QuakeSupport was originally tailored to address specific challenges in our RIS icequakes study—seismic data download and pre-processing for QuakeMigrate, handling of extended QuakeMigrate runs and integration of its outputs with GrowClust. Recognizing QuakeSupport’s broader potential, we expanded it into a flexible, user-configurable framework suitable for a wide range of seismic applications. This work builds on the robust foundation established by the QuakeMigrate and GrowClust developers, expanding their capabilities rather than replicating them, thereby benefiting downstream users. QuakeSupport is not a standalone system but an extension designed to streamline workflows, enhance processing and improve compatibility, ensuring these powerful tools work together even more effectively.
The QuakeSupport repository is maintained as needed to ensure ongoing compatibility with QuakeMigrate and GrowClust updates. Additional functionalities and improvements may be considered, particularly if similar features are not already incorporated into QuakeMigrate or GrowClust. For suggestions and comments, contact Ian Lee at ianrj.lee@gmail.com.
4. Illustrative catalog results
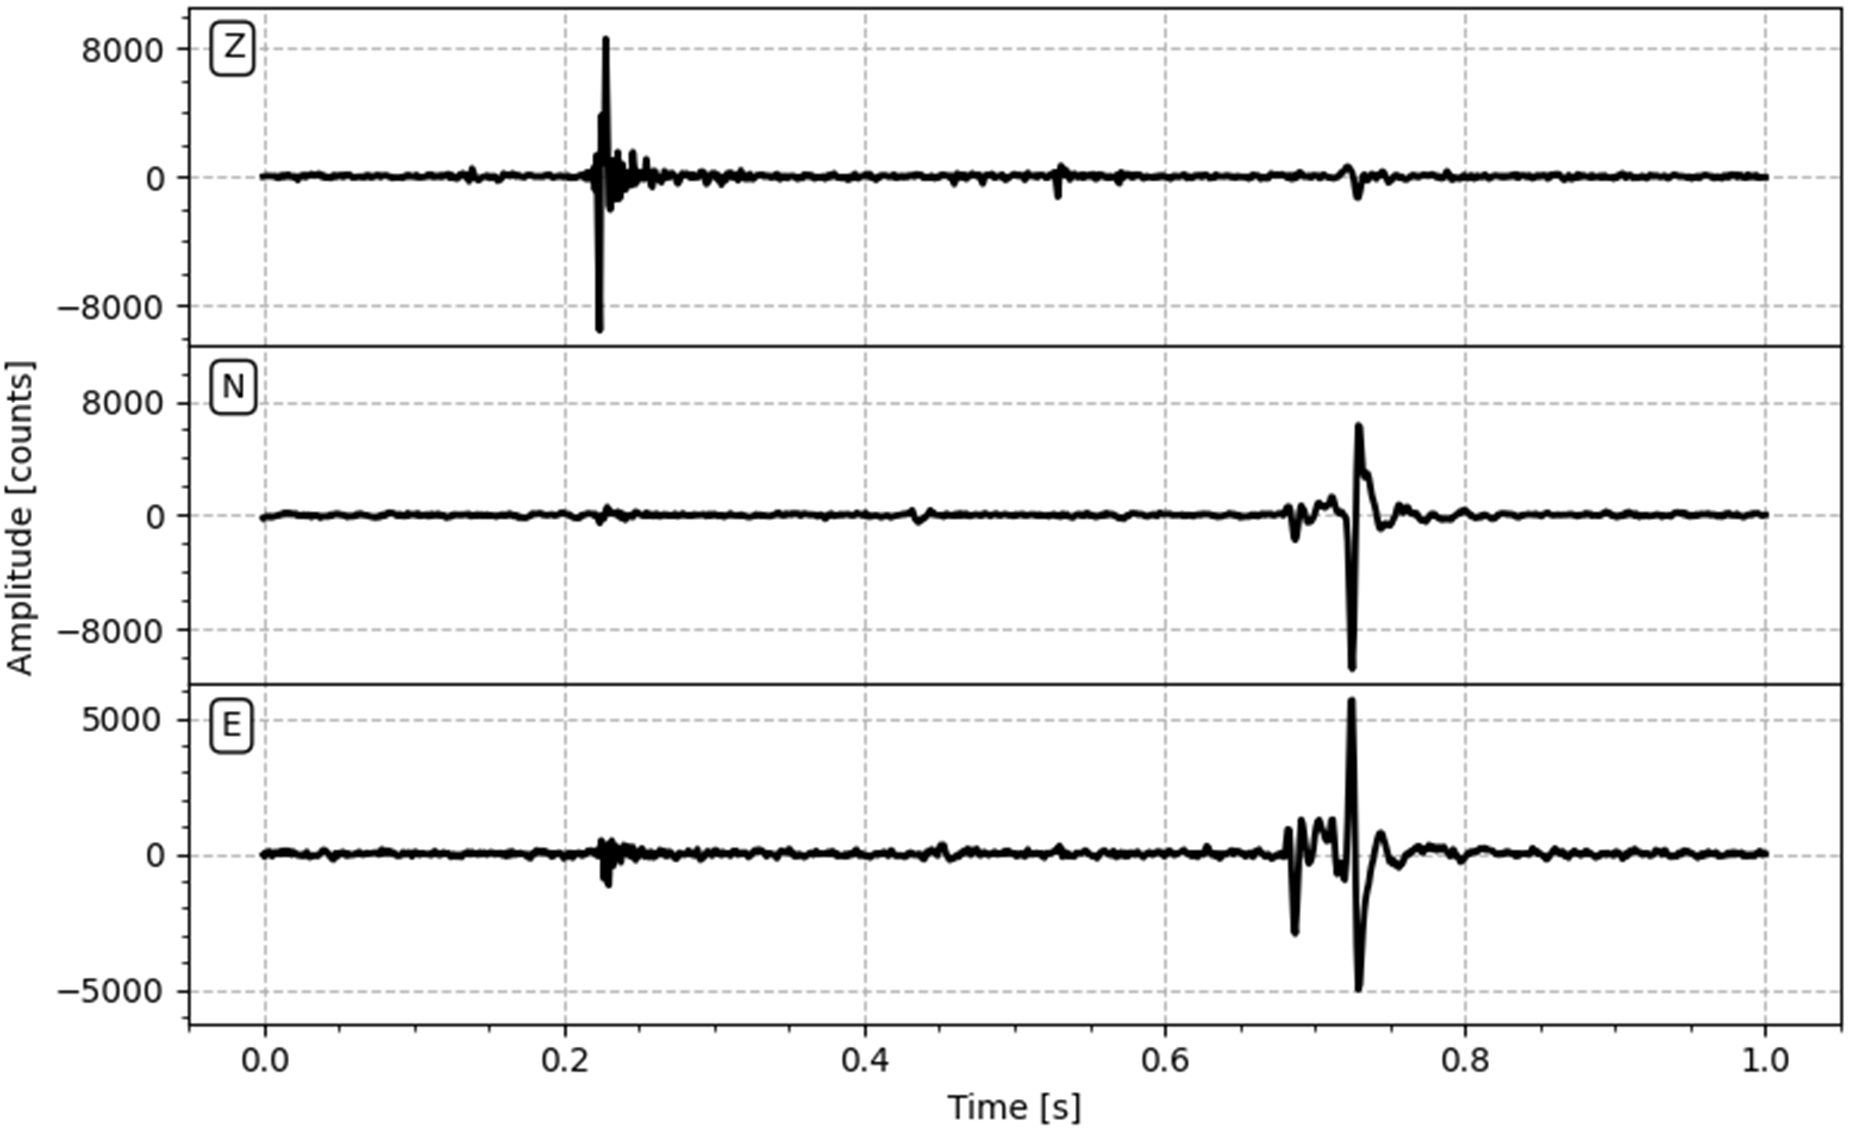
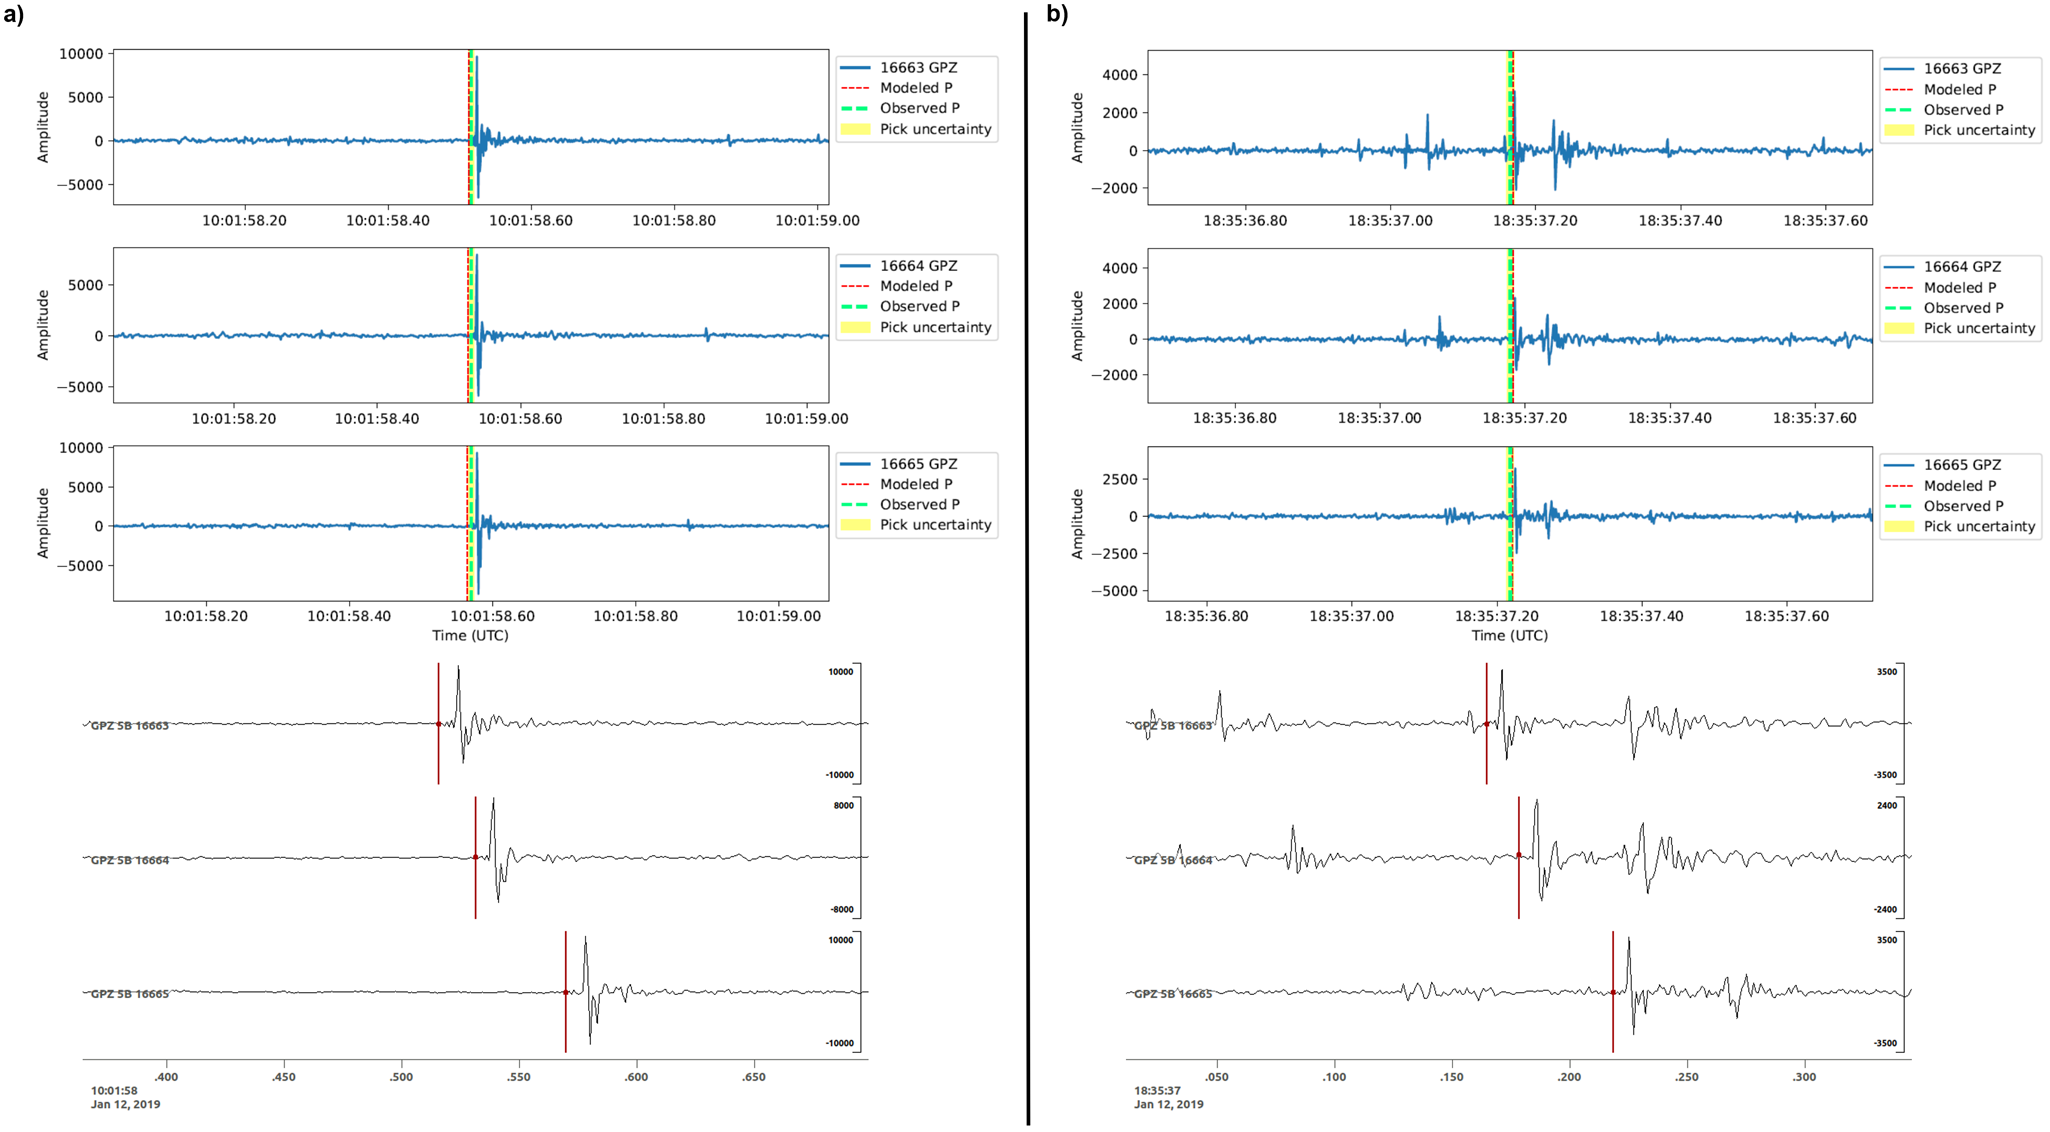
To provide a brief summary of our RIS grounding line array catalog from 4 to 26 January 2019, generated from QuakeMigrate runs streamlined by QuakeSupport, we present a set of representative event waveform examples and the spatial event distribution. For our study, we focused on basal events originating at or near the ice-bed interface, which are associated with basal sliding. Figure 4 shows an example seismogram from one station of a located basal icequake, illustrating the relative amplitude of the vertical component, which is larger than the horizontal components, and the clear impulsive P-arrival compared to the S-arrivals. Many of these basal events cluster in sticky spots, and events from the same sticky spot tend to show similar waveforms and relative arrival times at common stations due to their similar travel paths. Figure 5 illustrates a pair of high- and low-quality basal events—quality defined as differences in their signal-to-noise levels—from the same sticky spot on the vertical component at three stations, with QuakeMigrate’s picks overlain and plotted using QuakeSupport’s QMPicksPlot.py utility.
Example three-component seismogram of a located basal icequake from the RIS grounding line array at station 16613, with vertical (Z/GPZ) and horizontal (N/GP1 and E/GP2) components. Each trace spans a 1 s window and shows the phase arrivals (P- and S-waves) picked by QuakeMigrate. Amplitudes are given in instrument counts and scaled to the minimum and maximum of each trace.
P-arrivals for two basal events of different signal-to-noise quality from the same sticky spot in the RIS grounding line array, plotted using QuakeSupport’s QMPicksPlot.Py utility and Snuffler (Heimann and others, Reference Heimann2019). (a) High-quality event showing strong, impulsive P-arrivals. The top three panels show QuakeMigrate’s modeled and observed picks for the vertical component at three stations, with traces centered on the observed P-arrivals and their pick uncertainty shown. The bottom three panels show the observed QuakeMigrate picks over a ∼0.35 s window to illustrate their relative arrival order. (b) Low-quality event with weak, less impulsive P-arrivals. The top and bottom panels are arranged as in (a). The P-arrivals exhibit reduced signal-to-noise levels such that noise and unrelated signals are more apparent, making these P-arrivals more difficult to pick. Despite the lower quality, the picks and their relative arrival order across stations remain consistent with (a), demonstrating QuakeMigrate’s consistent picking performance. Amplitudes are in instrument counts.

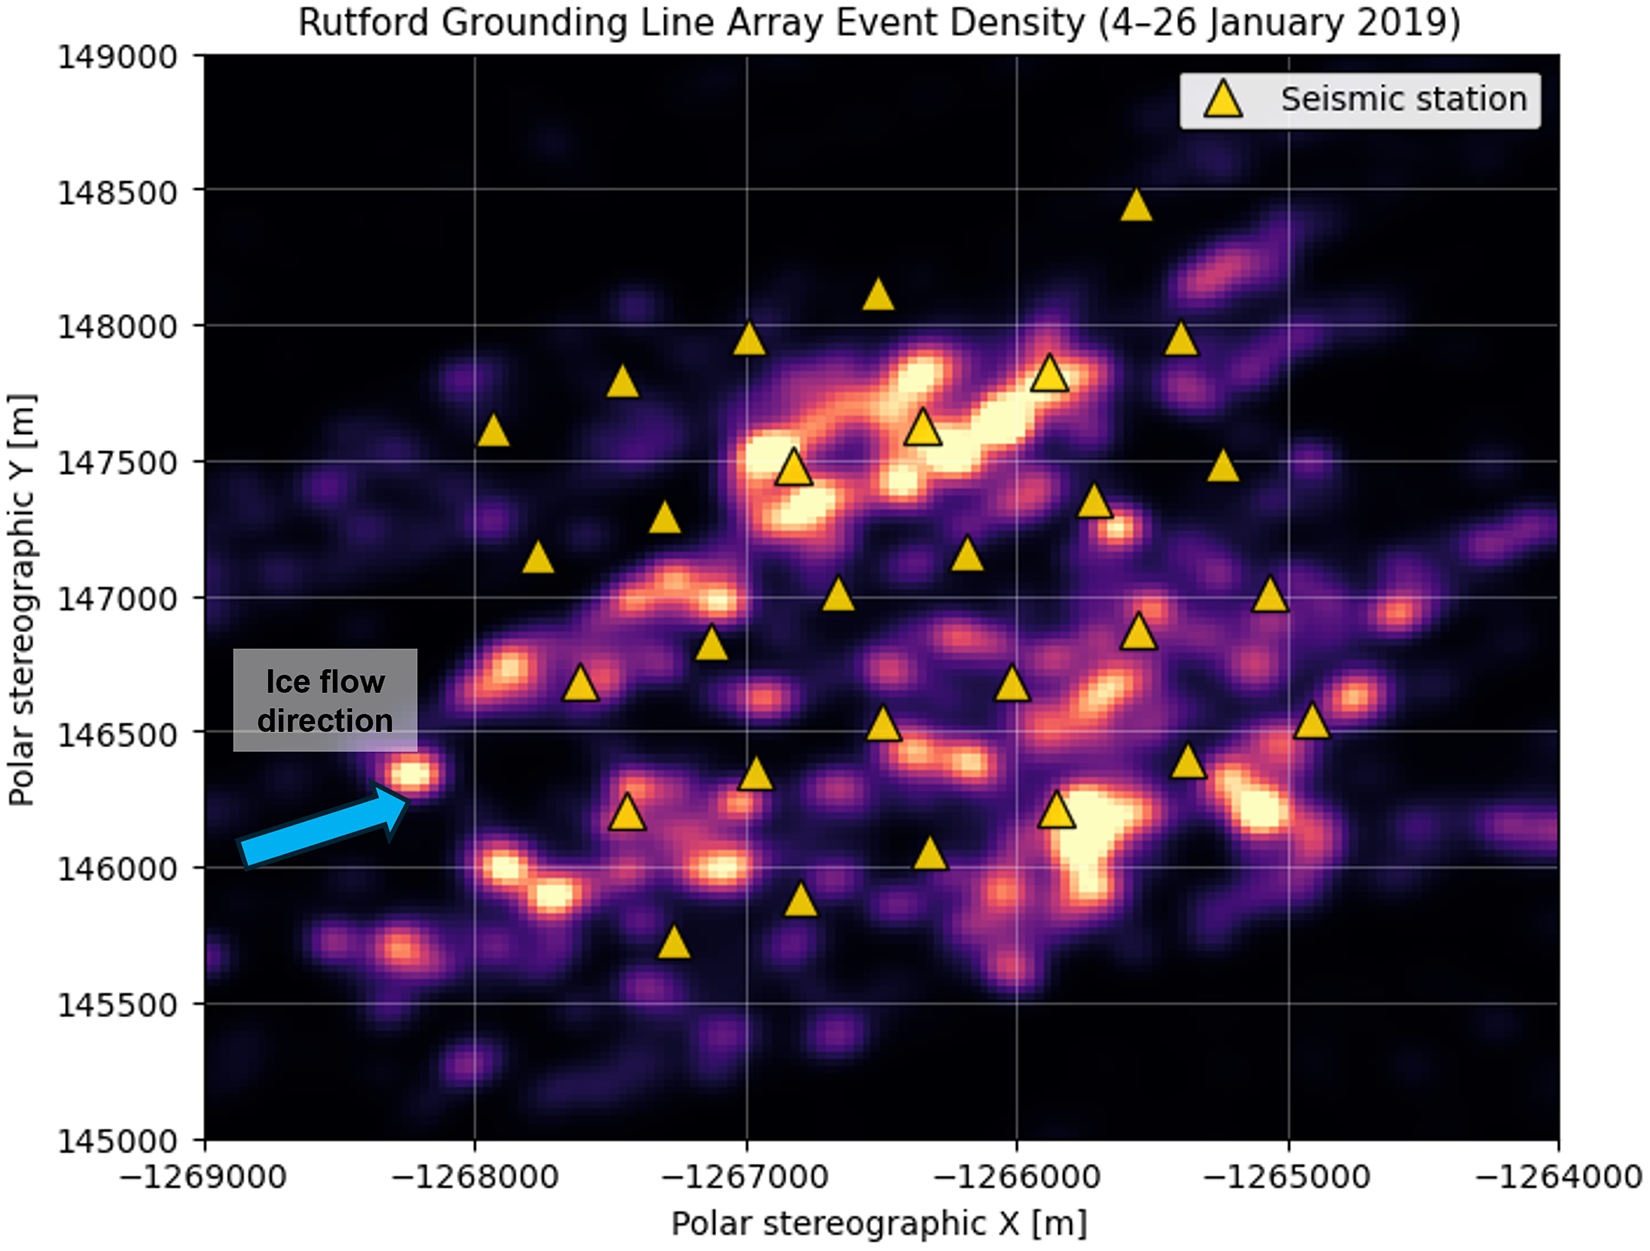
For our study, we worked with well-constrained basal events by filtering out events whose depth solution deviated substantially from the bed (approximately 1650 m ice thickness near the RIS grounding line; A. Smith and Doake, Reference Smith and Doake1994; Schmeltz and others, Reference Schmeltz, Rignot and MacAyeal2001) and events located far from the array, yielding a subset catalog of more than 650 000 basal icequakes. We did not filter by QuakeMigrate’s coalescence value, as recommended for larger tectonic events, because many of our basal icequakes are small and near or below the detection threshold, and coalescence-based filtering would remove genuine events. A high-resolution event-density heatmap of this filtered catalog is shown in Fig. 6, highlighting the spatial concentration of basal icequakes and potential sticky spot locations. Additional details on event filtering, catalog uncertainties and event characteristics, such as temporal behavior, are presented in follow-up manuscripts (Lee and others, in review, basal icequakes and sticky spots; Lee and others, in review, nonsteady basal hydrology) and the first author’s PhD dissertation (Lee, Reference Lee2026). The complete unfiltered original catalog, containing over one million detected events, is provided as-is for the community as an open-source dataset, and users may apply their own filtering criteria depending on their specific research needs. This catalog offers substantial opportunity for further exploration and independent analysis.
High-resolution event-density heatmap of basal icequakes detected using QuakeMigrate from the RIS grounding line array during 4–26 January 2019, after filtering out non-basal events and events located far from the array. Brighter regions indicate higher event densities, and darker regions indicate little to no activity. Within the bright regions, smaller concentrated subsets are visible, suggesting the presence of sticky spots or groups of them. Ice flow direction is from bottom-left to top-right, and the bright bands align with the flow direction. The occurrences and locations of these sticky spots are presented in follow-up manuscripts (Lee and others, in review, basal icequakes and sticky spots; Lee and others, in review, nonsteady basal hydrology) and the first author’s PhD dissertation (Lee, Reference Lee2026).

5. Data access
Our Rutford grounding line array icequake catalog is available from the U.S. Antarctic Program Data Center (USAP-DC) at https://www.usap-dc.org/view/dataset/601932 (Lee and others, Reference Lee, Alley and Anandakrishnan2025b), provided in CSV format along with a README describing each column header as defined in QuakeMigrate’s event output file. The dataset comprises 1033 331 events detected and located using QuakeMigrate v1.0.1, with parameters used listed in Table 1 of the Appendix. A subset of the catalog was reproduced using QuakeMigrate v1.2.0 to verify consistency with newer versions and showed negligible differences aside from the addition of a new column, COV_Err_XYZ, which represents the geometric mean of the existing covariance errors (COV_ErrX, COV_ErrY and COV_ErrZ). The original catalog reflects results produced using the latest available version of QuakeMigrate at the time of processing. Processing of this dataset was supported by the QuakeSupport package, archived at https://doi.org/10.5281/zenodo.15460028. The Rutford grounding line array icequake catalog and the QuakeSupport package are freely available for public use.
Acknowledgements
We thank Amanda Willet for testing the QuakeSupport prototypes and providing valuable feedback that helped identify user pain points and improve functionality. We extend our gratitude to the developers of QuakeMigrate (notably Conor Bacon, Tom Winder and Tom Hudson) and GrowClust (notably Daniel Trugman) for creating these invaluable tools that aid in our data processing and on which QuakeSupport builds and for their willingness to address questions related to their software. We thank the British Antarctic Survey (BAS) field team members Andy Smith, Alex Brisbourne, Catrin Thomas and Rebecca Schlegel for field logistical support and thank Alex Brisbourne, Catrin Thomas and Rebecca Schlegel for installing the grounding line array used in this study. We thank the staff at Rothera Research Station and BAS logistics for enabling the fieldwork associated with this project and the BEAMISH field team (2018/19) for acquiring the passive seismic data. Lastly, we thank Pennsylvania State University and BAS for making the RIS inland array dataset available for the QuakeSupport installation test run. These datasets were collected with support from NERC AFI award numbers NE/G014159/1 and NE/G013187/1 and the U.S. National Science Foundation (NSF) award 1643961. Additional support for this study was provided by NSF award 1738934 and the Heising-Simons Foundation. Seismic instruments were provided by NERC SEIS-UK (Loan 1017), by BAS, and by the Incorporated Research Institutions for Seismology (IRIS) through the PASSCAL Instrument Center at New Mexico Tech. The facilities of the IRIS Consortium are supported by NSF’s Seismological Facilities for the Advancement of Geoscience (SAGE) Award under Cooperative Support Agreement EAR-1851048.
Author contributions
IL identified the core challenges, developed the workflow, wrote all code, built the QuakeSupport repository and wrote the manuscript. SA and RA provided scientific guidance, suggested workflow improvements and reviewed the manuscript. AS provided scientific guidance and reviewed the manuscript.
Appendix—Parameters for icequake catalog generation
QuakeMigrate parameters used for the RIS grounding line array.


 Open access