


The mass transportation of African people for slave labor has cast a long shadow over American history. That shadow has made elusive the quest for all Americans, regardless of race, to find equal opportunity before the law and the freedom to exercise voice in the political process. Via emancipation and Reconstruction, Black people took a hard-fought step toward equal integration into American democracy. But that “moment in the sun” was made brief, as Du Bois observed, by a now well-documented turn on the part of white people to the coercive apparatus of the state to fortify a threatened racial hierarchy (Blackmon Reference Blackmon2009; Du Bois Reference Du Bois1998; LeFlouria Reference LeFlouria2015; Lichtenstein Reference Lichtenstein1996; Muhammad Reference Muhammad2011; Oshinsky Reference Oshinsky1997). The 13th Amendment to the Constitution perhaps most clearly exemplifies this intimate link between race, slavery, and incarceration in the exception it granted in outlawing slavery for “punishment for crime.”
Like Reconstruction, the civil rights movement of the 1950s and 60s is often seen as a critical moment in the quest for political equality, securing new federal legal protections for Black civil and voting rights that successfully rolled back decades of Jim Crow segregation and voter suppression. Chief among these federal policies was the Voting Rights Act (VRA) of 1965, which abolished literacy tests and grandfather clauses and—via Section 5—required that subject jurisdictions preclear changes to their voting practices with the Department of Justice. The VRA is consistently argued to have ushered in a new era of Black voter participation, descriptive political representation, and government responsiveness to minorities (Aneja and Avenancio-Leon Reference Aneja and Avenancio-Leon2019; Bernini, Facchini, and Testa Reference Bernini, Facchini and Testa2019; Bullock and Gaddie Reference Bullock and Gaddie2009; Cascio and Washington Reference Cascio and Washington2014; Davidson and Grofman Reference Davidson and Grofman1994; Fresh Reference Fresh2018).
But despite enormous political progress for minorities, acts such as the VRA were no miracle corrective, and minority voting rights have remained a site of fierce contention more than a half century on. The ability of Black people to vote in the midcentury represented a profound political and social threat to the institutionalized system of racial domination of Jim Crow that was fiercely maintained by the Southern white elite (Key Reference Key1950; Mickey Reference Mickey2015; Valelly Reference Valelly2004). Following the passage of the VRA, this elite sought alternate means of enforcing racial hierarchy and protecting their political power—redrawing constituency boundaries, eliminating elected offices, and shifting electoral institutions to their advantage (Keyssar Reference Keyssar2009; Komisarchik Reference Komisarchik2018; McDonald Reference McDonald2003; Rosenberg Reference Rosenberg2008). Many of these strategies, however, were fundamentally electoral and ultimately failed to obtain preclearance under the VRA, rendering them unusable.
Despite the attention paid to electoral levers, they are hardly the only tools that incumbents can use to maintain their power or the only responses that can reify a failing social order. In this paper, we study the extent to which institutions of the carceral state—police, the courts, and the prison system—were transformed in response to Black enfranchisement by the VRA.Footnote 1 Alexander (Reference Alexander2012) most prominently articulates the argument that these institutions effectively replaced previous practices and policies of social control and disenfranchisement, explicitly terming the mass incarceration of Black people that grew from the mid-twentieth century onward the New Jim Crow. Footnote 2
In this paper, we develop and extend the New Jim Crow argument to explicitly link Black enfranchisement to the use of the carceral state via two primary mechanisms. The first mechanism argues that the breakdown in the Jim Crow racial hierarchy—that is, a social order supported through voter suppression—may have activated racial resentment on the part of whites throughout carceral institutions, as well as on the part of the white electorate. This resulted in individual-level race-specific decisions and broader racially motivated policy that aggregated to different rates of incarceration. According to the second mechanism, Black enfranchisement generated a direct political threat to white political elites in the South after the VRA, potentially leading them to use carceral institutions to instrumentally disenfranchise minority voters to preserve their own political power. While race-based mass incarceration was arguably achieved toward the end of the twentieth century, both of these mechanisms could potentially explain the roots of these racial inequities.
This argument stands in direct contrast to arguments about the VRA—and enfranchisement, more generally—that predict a far more straightforward translation of increased electoral strength from the newly enfranchised group into policy outcomes more closely aligned with that group’s preferences (e.g., Downs Reference Downs1957).Footnote 3 Therefore, we also explore whether Black enfranchisement may have influenced the use of the carceral state from the demand side; that is, we explore the possibility that newly enfranchised Black voters’ policy demands drove changes in the carceral state. In particular, we explore two forms of what we term the Self-Policing argument: that Black people may have (1) used their political power to reduce the carceral burden on their communities or, alternatively, (2) they may have supported efforts to increase the carceral presence in their own communities—for example, via more policing and harsher sentences—to protect the nascent gains of the civil rights movement from a rising tide of crime. While contemporary repression of Black people by law enforcement would seem to suggest that the former relationship is more likely, we emphasize that prominent scholars have argued the latter has occurred in some cases (Clegg and Usmani Reference Clegg and Usmani2018; Forman Reference Forman2017; Fortner Reference Fortner2015).
To evaluate these possibilities, we first systematically investigate how race-based incarceration at the state level changed in response to Black enfranchisement that resulted from the 1965 VRA. Our state-level focus differentiates us from the vast majority of existing work in this domain that focuses on the national carceral state. As Figure 1 demonstrates, the contribution of states to total US incarceration heavily dominates that of localities and the federal government. Moreover, subnational governments are the primary political entities in control of carceral institutions, and thus they are those most likely to be responsive to enfranchisement.Footnote 4
National Trends in the Incarceration Rate by Jurisdiction of Government Custody
Source: Prison Policy Initiative (2016).
Note: The plot presents trends in the incarceration rate—prisoners held in each federal custody, state custody, and local custody as a percentage of the relevant population. This data source does not include racial breakdowns.

One reason that the literature has traditionally focused on federal incarceration is a lack of subnational incarceration data by race. To overcome that limitation, we gather archival statistical reports and prison intake rosters to compile a new dataset on admissions to state prisons by race in the decades before and after the 1965 VRA (~1940–1985). We use these data in a series of difference-in-differences designs leveraging variation in state and local coverage by Section 5 of the VRA. Section 5 represented the revolutionary enforcement mechanism of the VRA, requiring covered jurisdictions to preclear changes to their voting rules and practices to curb further attempts at minority disenfranchisement. While the VRA applied everywhere, only some jurisdictions were subject to Section 5, effectively being “treated” with greater intensity.Footnote 5 We find that in states subject to Section 5, Black prison admissions rates (as well as the difference between Black and white admissions rates) increased more after 1965 relative to those that remained uncovered.
These findings are consistent both with our articulation of the New Jim Crow argument and a version of the Self-Policing argument in which Blacks preferred more punitive carceral policies and were empowered to obtain them once enfranchised. To adjudicate between these explanations, we draw on public opinion data from the period and examine a subsample of our states for which we collect further-disaggregated data on county-specific admissions to state-level prison. To our knowledge, this is the only data of its type available for this period. We examine how both the electoral power of Black voters (alternatively conceptualized as the threat to white elites) and the descriptive representation of Blacks in elected office condition our main effects.
We find that while our main effects are increasing in the Black electorate, crucially, they decline in relative terms for majority-Black counties where Black voters are most likely to obtain their preferred policies. Moreover, when we consider the presence of Black elected officials we find that, if anything, their presence reduced differential Black incarceration. Finally, in examining Black punitive attitudes from contemporaneous surveys, we find little evidence that Blacks differentially preferred more punitive carceral policies that they could have better pursued after 1965. Given these findings, we conclude that our results likely derive from the New Jim Crow dynamic—that Black incarceration rose because of a white reaction to enfranchisement, not the political system responding to Black demands for it.
In offering new empirical insights into the initial factors that contributed to late twentieth-century mass incarceration in the US, we contribute to a large and growing literature on the causes and origins of this phenomenon, particularly in terms of race (Alexander Reference Alexander2012; Beckett and Francis Reference Beckett and Francis2020; Gottschalk Reference Gottschalk2006; Reference Gottschalk2008; Hinton Reference Hinton2016; Murakawa Reference Murakawa2014; Pfaff Reference Pfaff2017; Soss and Weaver Reference Soss and Weaver2017). Where this literature is generally qualitative and descriptive, our work departs by bringing new quantitative evidence to bear in a set of research designs that better account for counterfactual conditions. Rather than explaining the full development of race-based mass incarceration, our findings isolate the contribution of one root cause of particular political importance.
We build on work that has examined the role of punitive public opinion, partisan politics, and Black threat in determining law enforcement and criminal justice outcomes (e.g., Enns Reference Enns2016; Fording Reference Fording2001; Jacobs and Helms Reference Jacobs and Helms1996; Yates and Fording Reference Yates and Fording2005). Our findings in support of the New Jim Crow argument are consistent with much of the work in this domain that demonstrates a positive relationship between racial threat and social control. We further contribute a test of how perceptions of threat can be activated via key political junctures like enfranchisement. At first glance, our results appear inconsistent with more recent work that finds that Black arrest rates declined in response to the VRA (Facchini, Knight, and Testa Reference Facchini, Knight and Testa2020). Yet, the apparent difference is largely a function of emphasis. As the authors explain, their findings are driven by rural elected Sheriffs in counties with predominantly Black populations. We find similar heterogeneity—we also find that predominantly Black counties have smaller increases in incarceration than other counties. However, our state-level analyses give much smaller weight to these rural counties, instead emphasizing the large-scale state-level effects of the VRA that come from the population-weighted average across counties.
Finally, our project contributes to the literature on minority enfranchisement in American political development and the effectiveness of 1960s civil- and voting-rights legislation (Davidson and Grofman Reference Davidson and Grofman1994; Grofman, Handley, and Niemi Reference Grofman, Handley and Niemi1994; Kousser Reference Kousser1974). This literature has largely overlooked extraelectoral repression as a strategy of disenfranchisement after 1965, something our project theorizes and tests for explicitly. Our results offer a qualification—though hardly a rebuke—to the largely positive view of the effects of the VRA, demonstrating that the breakdown in a politically enforced system of racial domination can have significant second-order political consequences.
The Carceral Response to the VRA
In this section, we develop and extend two arguments linking Black enfranchisement following the VRA to Black incarceration.Footnote 6 The first is what we refer to as the New Jim Crow argument, based primarily on Weaver (Reference Weaver2007) and Alexander (Reference Alexander2012). The second is the Self-Policing argument of Black political efficacy following from enfranchisement.
The New Jim Crow Argument
The New Jim Crow argument, as we articulate and extend it, contends that Black enfranchisement was considered a fundamental threat to the encompassing white-dominated political order in the US South. In addition, the VRA, in general, and Section 5 even more specifically, restricted the ability of the existing white political elite to use Jim Crow policies to disenfranchise minority voters as part of the broad project of maintaining racial hierarchy. Given this, we propose two classes of explanations for how this VRA-generated threat may have lead to increases in subsequent Black incarceration—what we term (1) the diffuse reactive mechanism and (2) the instrumental political mechanism. We think there is theoretical precedent for each of these mechanisms, but we note that results consistent with the New Jim Crow, broadly, may reflect only one or the other mechanism working in isolation, not necessarily both. We further note reasons to think the diffuse reactive mechanism is more likely to hold, and we return to evaluating the mechanisms at the end of the paper.
The Diffuse Reactive Mechanism
The diffuse reactive mechanism argues that a shift in the incarceration of Black people as a result of the VRA resulted from diffuse reactive responses to the breakdown of the Jim Crow system and the status threat of newly enfranchised Blacks. This diffuse reaction may have then resulted in increased incarceration in two ways. First, it may have influenced incarceration directly by shaping how discretion was exercised by individuals working in the criminal justice system. Second, it may have resulted in changes in public opinion among white voters that were then harnessed, politicized, and turned into policy by entrepreneurial politicians.
To understand the logic of the diffuse reactive mechanism, it is essential to understand what Jim Crow was, what it did, and how the VRA changed that. Jim Crow was a broad project to maintain a racial hierarchy in which whites were dominant and Blacks and other minorities were subordinate.Footnote 7 That hierarchy was institutionalized through formal laws—which segregated public and private spaces and severely constrained the political participation of Blacks—as well as informal rules and norms governing everyday behaviors (Berrey Reference Berrey2016; Kennedy Reference Kennedy1990).Footnote 8 The instrumental and symbolic importance of voting rights made the suppression of Black political power a critical aspect of the overall Jim Crow project.
The VRA upset that order by removing a central political pillar on which it rested. The diffuse reactive mechanism emphasizes how this federally imposed change threatened the dominance of whites atop the entirety of the racial hierarchy organized by Jim Crow, not simply their direct dominance of political office. In line with theories of racial threat, the VRA produced a broad threat to white status (Blalock Reference Blalock1967; Blumer Reference Blumer1958).Footnote 9 This status threat then facilitated behaviors inside and outside carceral institutions as whites grasped for means of reconstructing a sociopolitical order built on racial hierarchy that the VRA had fractured (Banks and Valentino Reference Banks and Valentino2012; Jardina Reference Jardina2019; Kinder and Kam Reference Kinder and Kam2010; Kinder and Sears Reference Kinder and Sears1981).
This, both rational and affective, reaction may have manifested in racial disparities in incarceration via the exercise of individual discretion in various places in the carceral state (United States Department of Justice 1982, xix–xx). It may also have shifted the attitudes of white voters who were in turn aggregated through the political process—including via entrepreneurial politicians who further hastened broad-based attitudinal shifts—to produce carceral policy (Campbell and Schoenfeld Reference Campbell and Schoenfeld2013; Enns Reference Enns2016; Kuziemko and Washington Reference Kuziemko and Washington2018; Weaver Reference Weaver2007). But in contrast to the instrumental political mechanism described below, the motivation was not elite desire to directly prevent changes in the racial composition of the electorate but, rather, a response to diffuse changing attitudes among white voters.
We distinguish this mechanism from pure backlash theories of post-Civil Rights behavior (Edsall and Edsall Reference Edsall and Edsall1991). Scholars have offered a strong critique that white backlash alone neglects the role of political entrepreneurs in channeling activated racial resentment toward the issue of law and order (Lopez Reference Lopez2015; Weaver Reference Weaver2007). We too emphasize the importance of political entrepreneurs who framed crime as a problem for governmental involvement. While that innovation had broad electoral goals in terms of cultivating white—and specifically, Southern white voters—it was effective because it traded in very real perceptions of status threat and worked within institutions that had long been used for minority social control (Muhammad Reference Muhammad2011).
The Instrumental Political Mechanism
In contrast to the diffuse reactive mechanism, which emphasizes the status threat to individuals caused by the end of Jim Crow, the instrumental political mechanism draws its logic from the fact that the VRA posed a direct political threat to the incumbent white political establishment. While Jim Crow was multifaceted, a crucial component was the set of political laws and practices that severely constrained the political participation of Blacks. In order to continue exercising their political control, whites—and in particular, white political elites—needed new strategies to replace practices banned by the VRA. The differential use of carceral institutions against Black people was, in this view, an intentional, instrumental strategy of white elites, chosen to suppress Black political power and maintain white political dominance.Footnote 10
As an instrumental tool, the carceral state could have arguably helped to maintain the power of the white establishment elite in a number of ways. First, police could have been used to directly suppress Black political participation through intimidation and outright prevention (see, e.g., USCCR 1975). Second, differential application of the carceral state could have indirectly suppressed Black political participation via its effects on the income, education, and health of subject communities (Burch Reference Burch2014; Western Reference Western2007). Finally—and most directly—incarceration itself explicitly disenfranchises the felons who experience it. Most states—and all states in the South pre-1965—did not allow inmates to cast a ballot while incarcerated, and many further barred those with a felony record from voting (Manza and Uggen Reference Manza and Uggen2008).Footnote 11
The instrumental political mechanism thus implies a significant degree of intentionality among white Southern elites.Footnote 12 At the national level, studies of race, the carceral state, and partisan politics have consistently revealed such intentionality in the fashioning of crime as a racialized policy from the mid-twentieth century onward (Weaver Reference Weaver2007).Footnote 13 Much of this national rhetoric was founded in the state-level careers of politicians—for example, Goldwater, Wallace—who then sought national office.
While theoretically well founded, we note up front a few reasons to question that the New Jim Crow was primarily facilitated by an instrumental political mechanism. First, while the instrumental use of the carceral state for elite ends has significant historical precedent (Appendix A), much of what scholars—and in turn politicians—have learned about the disenfranchising consequences of the carceral state has come from relatively recent scholarship. Second, the scale of the race-based application of the carceral state necessary to directly affect electoral outcomes appears large at first glance. Nevertheless, the evidence indicates police repression has played a role in deciding close local elections and deterrence may magnify the effects of observed repression. Third, although in the post-Civil Rights era covered states are, on average, likely to use the type of highly restrictive felony disenfranchisement laws that could instrumentally compliment race-based increases in incarceration, not all do (Behrens, Uggen, and Manza Reference Behrens, Uggen and Manza2003). Finally, research shows that much of the rhetoric around law and order was primarily produced to cultivate white votes (Lopez Reference Lopez2015; Phillips Reference Phillips1969). There is relatively little evidence that law and order rhetoric—whether on the part of national politicians or state and local elites—was a strategic directive to political actors to instrumentally suppress Black voters.Footnote 14
The Self-Policing Argument
The New Jim Crow focuses on a reactionary—whether diffuse or elite-driven—response to Black enfranchisement on the part of a white establishment that was not fully swept aside by the VRA. By contrast, the Self-Policing argument contends that Black people achieved meaningful de facto power as a consequence of de jure enfranchisement. In an application of Downs (Reference Downs1957), it may have been the case that enfranchised Black people meaningfully shifted the policy preferences of the median voter with respect to carceral policy. Additionally, the VRA gave Black officeholders the chance to govern in the South for the first time since Reconstruction in furtherance of Black policy goals (Beach and Jones Reference Beach and Jones2017). But, crucially, whether Self-Policing predicts an increase, decrease, or no change in Black incarceration depends on both whether Black people achieved de facto political influence and whether the newly enfranchised group had policy preferences about carceral policy that diverged from the preenfranchisement status quo.
Contemporary debates about racial injustice in carceral institutions would seem to suggest that newly enfranchised Black people preferred lowering the carceral burden on their communities. Indeed, there is ample evidence that before 1965 Black communities wanted for unbiased law enforcement (USCCR 1965). However, important scholarship alternatively contends that many Black people—specifically in the elite and middle class—favored an increased law enforcement presence in their own communities, which, in conjunction with improved social welfare provisions, was championed to protect socioeconomic gains made during the civil rights era from a rise in Black crime victimization (Forman Reference Forman2017; Fortner Reference Fortner2015; Miller Reference Miller2008).Footnote 15 Practicing a so-called politics of respectability, Black elites and the middle class exposed class divisions within their communities, labeling drug dealers “Black-face traitors” as they pushed to rid themselves of the criminal element in their midst (Forman Reference Forman2017; Kennedy Reference Kennedy1998). The draconian Rockefeller drug laws in New York, a spate of punitive drug and gun laws in Washington DC, and similar measures taken at the state and local level by Black communities around the US were argued to have been supported, if not spearheaded, by Black elites and Black middle-class voters in order to keep their communities safe.Footnote 16 If the dynamics found in these particular cases were representative of Black attitudes generally—or, in particular, the attitudes of the voter who became median via the VRA—then increased Black incarceration rates may have resulted via enfranchisement, rather than as a reaction to it.
Yet, we note that these punitive measures were accompanied by few, if any, of the broader welfare provisions for which Black communities were also advocating Kohler-Hausmann (Reference Kohler-Hausmann2015).Footnote 17 In arguing that white politicians “selectively heard” Black demands for better policing as punitive policing without accompanying social reform, scholars like Hinton, Kohler-Hausmann, and Weaver (Reference Hinton, Kohler-Hausmann and Weaver2016) call into question the extent of de facto Black political power in the post-Civil Rights era and, thus, the applicability of the Self-Policing argument.
Observable Implications of the Arguments
Both of the theoretical arguments above—the New Jim Crow, and the version of Self-Policing in which Blacks were de facto empowered and preferred more aggressive criminal justice policies that would result in greater incarceration—predict the same first-order relationship: we should expect Black enfranchisement from the VRA to result in increased Black incarceration and differentially higher incarceration among Blacks relative to whites. In the subsequent sections of the paper we turn to our data and design for evaluating that first-order relationship before turning to evidence that can help us adjudicate between these two alternative arguments.
Data and Measurement
In order to evaluate the arguments outlined in the previous section, we collect new data on admissions by race to state prison for the mid-twentieth-century US. First, we construct a state-year dataset that builds from Bureau of Justice Statistics data on the race of admissions to state prison covering the period 1926 to 1986.Footnote 18 While this dataset presents an important starting point for the analysis, it is unfortunately sparse in its coverage.Footnote 19 Therefore, we augment these data though an extensive process of data collection from archival state corrections reports, which we use to fill missing years. After this augmentation, following Honaker and King (Reference Honaker and King2010), we use the best currently available multiple-imputation methods to fill in the remaining gaps in our data to generate a balanced panel while also allowing for appropriate standard error corrections to account for our imputations.Footnote 20 Second, using our archival state corrections reports, we are also able to construct a state-county-year by race dataset for a subsample of our states (where county refers to the county in which a state prisoner was convicted). To our knowledge, such county-level cross-state admissions data have never before been assembled for this period.
We measure race over multiple decades in which constructions of race were changing. To ensure backward compatibility of our data, we choose to apply the racial categories used in the early years of our data for all periods. While we refer to our primary measure as Black prison admissions, it is actually non-white prison admissions, as early incarceration data simply break admissions into “white” and “non-white” (or “colored”) categories. As the vast majority of the non-white population in our sample was Black (explaining, in part, why records only used the simple differentiation), we feel the gains we make in sample size from being able to use historical data with these coding rules more than offsets the loss of precision in racial coding from this dichotomization.Footnote 21
We consider our focus on the collection of state prison admissions data—as opposed to federal prison admissions—a crucial contribution of this research. It was state—and local officials—who relied on Jim Crow policies prior to 1965. In turn, they were most affected by the VRA. States are also the level of government to whom most criminal justice and law enforcement rights are reserved, whereas local governments are those with the most discretion over policing. Moreover, as we documented above, states are the jurisdictions that are overwhelmingly responsible for mass incarceration.
We use our dataset to measure the carceral response to enfranchisement in terms of new felony admission rates to state prisons by race. If enfranchisement results in the greater use of the carceral state against Black people by any of its constituent institutions, more Black individuals should find themselves admitted to prison.Footnote 22 In addition, many of the most detrimental effects of the carceral state obtain as soon as an individual is imprisoned, regardless of the length of their sentence. Moreover, as our theoretical interest is not in explaining the rise in mass incarceration per se but, rather, the response of carceral institutions in any form, we expect this to be an outcome that is responsive to our treatment. In the ideal case, we would be able to examine both the extensive and intensive margins to construct incarceration rates, but our data sources lack systematic racially disaggregated data on either sentence length or prisoners “on-hand” necessary to do so.
We focus on felonies for similar reasons—while misdemeanor convictions can result in many negative outcomes (White Reference White2019), many of the harshest consequences (e.g., disenfranchisement, employment opportunity loss) obtain with felony convictions. In addition, data on felonies are more consistently reported in our data, as many misdemeanor convictions result in incarceration in local jails rather than state prisons. Nevertheless, we emphasize that “quality of life” crimes and crimes of poverty are likely to be responsive (perhaps even more so) to a similar theoretical argument as we previously laid out.
Empirically Evaluating the Relationship Between the 1965 VRA and Black Incarceration
In this section, we build on the existing qualitative evidence described in previous sections to systematically evaluate the empirical relationship between Black enfranchisement in 1965 and Black incarceration.
The Empirical Approach
Absent an ideal experiment in a historical setting like this, we proceed by leveraging a combination of state-level geographic variation in Black enfranchisement as a result of Section 5 of VRA and temporal variation from before to after the Act’s 1965 passage in a difference-in-differences design. As previously described, although many provisions of the VRA applied universally to the US, the key provision of the Act was Section 5, which required preclearance of changes to voting rules and practices with the Department of Justice. We evaluate changes in Black incarceration between jurisdictions covered by Section 5 and those not, from before to after the 1965 VRA, using three estimation models: (1) a (linear-in-time) difference-in-differences, (2) a two-way fixed effects model, and (3) a long-differences model.
For our linear-in-time difference-in-differences, for state i in year t, we estimate
 $$ {\displaystyle \begin{array}{r}{y}_{it}=\hskip1.5pt {\boldsymbol{\alpha}}_{\boldsymbol{i}}+\tau {T}_t+\eta \mathrm{Post}\hbox{-} {1965}_i+\beta \left({\mathrm{Covered}}_i\times \mathrm{Post}\hbox{-} {1965}_t\right)\\ {} + \theta \left({\mathrm{Covered}}_i\times {T}_t\right)+\nu \left(\mathrm{Post}\hbox{-} {1965}_t\times {T}_t\right)\hskip43pt \\ {} + \omega \left({\mathrm{Covered}}_i\times \mathrm{Post}-{1965}_t\times {T}_t\right)+\psi {X}_{it}+{\varepsilon}_{it}\hskip19pt \end{array}} $$
where yit is one of our two main outcomes of interest: first, the rate of new Black state prison admissions $ (\frac{{\mathrm{BlackAdmit}}_{it}}{{\mathrm{BlackPop}}_{it}}) $
and, second, the difference between the rate of new Black state prison admissions and the rate of new white state prison admissions
$ (\frac{{\mathrm{BlackAdmit}}_{it}}{{\mathrm{BlackPop}}_{it}}) $
and, second, the difference between the rate of new Black state prison admissions and the rate of new white state prison admissions $ (\frac{{\mathrm{BlackAdmit}}_{it}}{{\mathrm{BlackPop}}_{it}}-\frac{{\mathrm{WhiteAdmit}}_{it}}{{\mathrm{WhitePop}}_{it}}) $
, each normalized as the rate per 100,000 to aid interpretability. The second outcome allows us to account for the fact that both theoretical arguments we outline above predict differential incarceration of Blacks relative to whites (effectively, a triple difference). Even if whites are caught up in some secular growth of prison admissions, the effect on Blacks is predicted to be greater.
$ (\frac{{\mathrm{BlackAdmit}}_{it}}{{\mathrm{BlackPop}}_{it}}-\frac{{\mathrm{WhiteAdmit}}_{it}}{{\mathrm{WhitePop}}_{it}}) $
, each normalized as the rate per 100,000 to aid interpretability. The second outcome allows us to account for the fact that both theoretical arguments we outline above predict differential incarceration of Blacks relative to whites (effectively, a triple difference). Even if whites are caught up in some secular growth of prison admissions, the effect on Blacks is predicted to be greater.
To account for observable and unobservable average time-invariant differences (e.g., average crime rates over the period, average carceral resources, and average levels of racial animosity) in the propensity of jurisdictions to incarcerate individuals by race, we include state-level fixed effects ( $ {\boldsymbol{\alpha}}_{\boldsymbol{i}} $
).Footnote
23 The variable Post-1965
t is an indicator for years after the passage of the 1965 VRA, Covered
i is an indicator for states covered by Section 5 in 1965, and T is a linear time trend (set to T = 0 in the calendar year 1965) that captures any general (linear) relationship between time and incarceration. We also account for the time-varying effects of urban population (Xit). We cluster our standard errors by state and further correct standard errors for the estimation uncertainty from our imputation of missing incarceration data.Footnote
24
$ {\boldsymbol{\alpha}}_{\boldsymbol{i}} $
).Footnote
23 The variable Post-1965
t is an indicator for years after the passage of the 1965 VRA, Covered
i is an indicator for states covered by Section 5 in 1965, and T is a linear time trend (set to T = 0 in the calendar year 1965) that captures any general (linear) relationship between time and incarceration. We also account for the time-varying effects of urban population (Xit). We cluster our standard errors by state and further correct standard errors for the estimation uncertainty from our imputation of missing incarceration data.Footnote
24
In Equation 1, we are primarily interested in the parameter ω, which measures the average change in the difference in incarceration admissions’ linear trend after 1965 between states that were covered by Section 5 and those that were not (after accounting for the other time-varying covariates). In line with both theories, we would expect ω to be positive. One might also consider β of interest. It measures whether there was a differential level shift in Black carceral admissions in 1965 by coverage status, as distinct from the trend change. Because of the time it takes to adjust policing, sentencing, and so on, we think an immediate level shift is less likely than a change in trend. However for completeness, we present an estimate of the joint value (and test of significance) of ω and β evaluated at 1980.
To infer that ω estimates a causal effect, we need to assume that in the absence of Section 5, trends in incarceration outcomes in covered jurisdictions would have continued the same as in never-covered jurisdictions.Footnote 25 This counterfactual assumption is inherently untestable. However, we employ the standard evidence in support of that assumption—namely that pre-1965 trends in incarceration were parallel between never-covered and to-be-covered states.
It’s important to note that we do not control for the crime rate in our specification due to significant concerns about endogeneity. Measures of crime are not objective indicators; rather, what gets logged as a crime (or, in many cases, doesn’t get logged) is at the discretion of the very carceral state we seek to study (Black Reference Black1970; Muhammad Reference Muhammad2011).Footnote 26 In addition to the possible endogeneity of crime reporting, there are also endogeneity concerns surrounding “objective” crime rates, could they even be measured as such. Although we empirically focus on incarceration as an outcome, both arguments that we evaluate predict significant changes in policing in response to enfranchisement. As a result, they suggest that passage of the VRA might actually have a causal effect on what crime is able to be observed (and thus recorded) as a function of changes in patterns of policing.
As a result of these types of concerns, an important body of scholarship in effect argues that crime rates are not a valid control variable but rather a mechanism via which racial differences in law enforcement produce end-line carceral outcomes (Beckett, Nyrop, and Pfingst Reference Beckett, Nyrop and Pfingst2006; Lynch and Omori Reference Lynch and Omori2014; Van Cleve and Mayes Reference Van Cleve and Mayes2015).Footnote 27 Viewed in this way, crime levels (and especially changes in crime that occur in 1965) would not exert an independent effect on prison admissions. Instead, we worry that they are likely to introduce posttreatment bias. Finally, we note that for crime rates to drive our results, it must be that covered and uncovered jurisdictions had different potential (incarceration) outcomes as a function of different trends (not merely average levels) in crime (after accounting for trends in urbanization, which we include).
We prefer Equation 1 for three reasons. First, given the relatively small sample of states covered by Section 5 in 1965 (and plausible counterfactual states), imposing a linear functional form on time allows us to maximize our degrees of freedom. Second, as we will show, the post-1965 trends in incarceration appear to be quite linear. Therefore, we do not believe that this functional form assumption obscures meaningful patterns in the data. Finally, unlike a simple two-way fixed effect model, we can separately account for the fact that it appears that states covered by Section 5 did not immediately adjust their behavior (i.e., there was not a single large level shift right at 1965); rather, it appears states took time respond to their new reality.
We also estimate a two-way fixed effects model,
 $$ {y}_{it}={\boldsymbol{\alpha}}_{\boldsymbol{i}}+{\boldsymbol{\gamma}}_{\boldsymbol{t}}+\beta \left({\mathrm{Covered}}_i\times \mathrm{Post}-{1965}_t\right)+\psi {X}_{it}+{\varepsilon}_{it}, $$
in which we use year fixed effects ( γt ) that account for year-specific shocks to incarceration common to all states in the sample (e.g., crime trends, the national economy). This is a more flexible parametric approach, though also one, given our sample size, that significantly reduces our degrees of freedom. In Equation 2, the parameter of interest is β—the average post-1965 difference in incarceration trends between states covered by Section 5 and those not covered.
Finally, following (among others) Cascio and Washington (Reference Cascio and Washington2014) and Facchini, Knight, and Testa (Reference Facchini, Knight and Testa2020), we estimate a long-difference specification in which we again estimate Equation 2, but exclude data from 1965 to 1975. By focusing only on “long-term” differential changes, a long-difference specification like this is well-suited to situations where agents require some time to adapt to changes (here, passage of Section 5) by excluding the adjustment period from estimation.Footnote 28 This allows us to maintain the flexibility of a two-way fixed effect model without our estimates being downwardly biased by averaging over an initial period of adjustment. In our long-difference specification, our estimate of β is the average difference over the “long run”: from pre-1965 to post-1975 between states covered by Section 5 and those not covered.
We estimate these models with ordinary least squares and use a balanced sample of states with (1) a long time series of available incarceration data and (2) comparable historical experiences of racial segregation to, as best as observationally possible, approximate the counterfactual for covered states. We focus on the 20 states defined by Katznelson and Mulroy (Reference Katznelson and Mulroy2012), among others, as having had racially discriminatory “Jim Crow” policies prior to 1965 (15 of which also allowed slavery). Of these 20, we are able to collect data for 18. Our main analysis sample therefore includes Alabama, Georgia, Louisiana, Mississippi, North Carolina, South Carolina, and Virginia,which were covered, and Arizona, Delaware, Florida, Kentucky, Maryland, Missouri, New Mexico, Oklahoma, Tennessee, Texas, and West Virginia, which were not covered.Footnote 29
Results
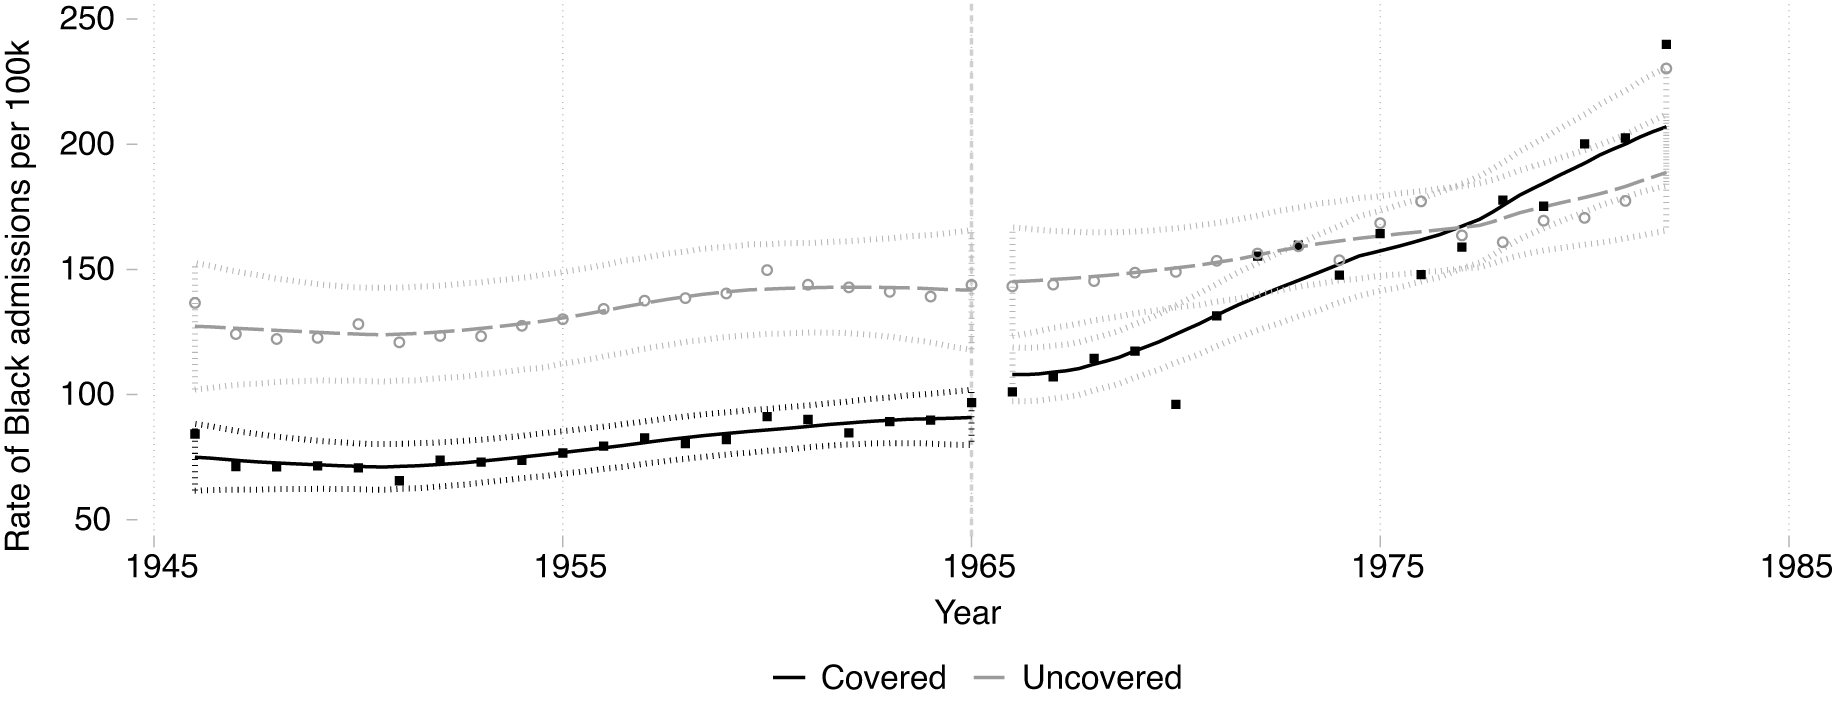
Figure 2 presents the graphical results of the difference-in-differences for the rate of Black state prison admissions.Footnote 30 First, we observe that never-covered states had higher Black admissions rates on average than their to-be-covered counterparts. This descriptive evidence could accord with the notion that Jim Crow institutionalized racial order, negating the need for additional carceral control. But after 1965, as Figure 2 indicates, there was a differential increase in Black prison admissions in states covered by Section 5 relative to those that were not covered. By 1985, Black admission rates in covered states had surpassed those in never-covered states.
Section 5 Coverage and the Black Prison Admissions Rate
Note: The sample of states includes Alabama, Georgia, Louisiana, Mississippi, North Carolina, South Carolina, and Virginia (covered) and Arizona, Delaware, Florida, Kentucky, Maryland, Missouri, New Mexico, Oklahoma, Tennessee, Texas, and West Virginia (not covered). The scatter presents the averages of the raw data for states in each coverage category. The lines are local polynomial fits (bandwidth = 2) and 95% confidence intervals. Note that due to software limitations, standard errors in these plots do not reflect uncertainty due to missing data imputation. See Table 1 for analogous estimates with corrected standard errors.
In terms of the difference between Black and white prison admissions rates, Figure 3 also shows graphical evidence that rates grew faster in covered states after the VRA than in uncovered states.Footnote 31 If there are factors—such as generalized crime, or a generally increasing preference for punitiveness—affecting both sets of prison admissions rates regardless of race, then we would not expect to see these differential trends. Instead, Figure 3 is consistent with the theoretical arguments—that Section 5 caused more incarceration of Black people.
Section 5 Coverage and the Difference between Black and White Admission Rates
Note: The sample of states includes Alabama, Georgia, Louisiana, Mississippi, North Carolina, South Carolina, and Virginia (covered) and Arizona, Delaware, Florida, Kentucky, Maryland, Missouri, New Mexico, Oklahoma, Tennessee, Texas, and West Virginia (not covered). The scatter presents the averages of the raw data for states in each coverage category. The lines are local polynomial fits (bandwidth = 2) and 95% confidence intervals. Note that due to software limitations, standard errors in these plots do not reflect uncertainty due to missing data imputation. See Table 1 for analogous estimates with corrected standard errors.

Both figures also show evidence of parallel trends in admissions rates between to-be-covered and never-covered states in the decades preceding the VRA. Therefore, we gain confidence that in the absence of Section 5 coverage trends in Black admissions would have continued the same between the two types of states.
Table 1 presents formal estimates of the effect of Section 5 coverage on Black and Black-minus-white prison admissions for each of our specifications. Columns 1 and 4 present the results from estimating Equation 1, the linear-in-time model. These results are consistent with the graphical results above—we observe parallel trends in the pre-1965 period (the coefficient on Covered × T is nearly zero), we observe very little immediate differential change in the level of incarceration following passage of Section 5 (the coefficient on Post-1965 × Covered is also nearly zero), but we see a marked differential increase in the trajectory of incarceration among states covered by Section 5 (ω is large and positive). Indeed, evaluated at 1980, this implies a difference-in-difference increase of about 65 Black prison admissions per 100,000 among covered versus never-covered states.
State Results for Section 5 and the Black Admissions Rate
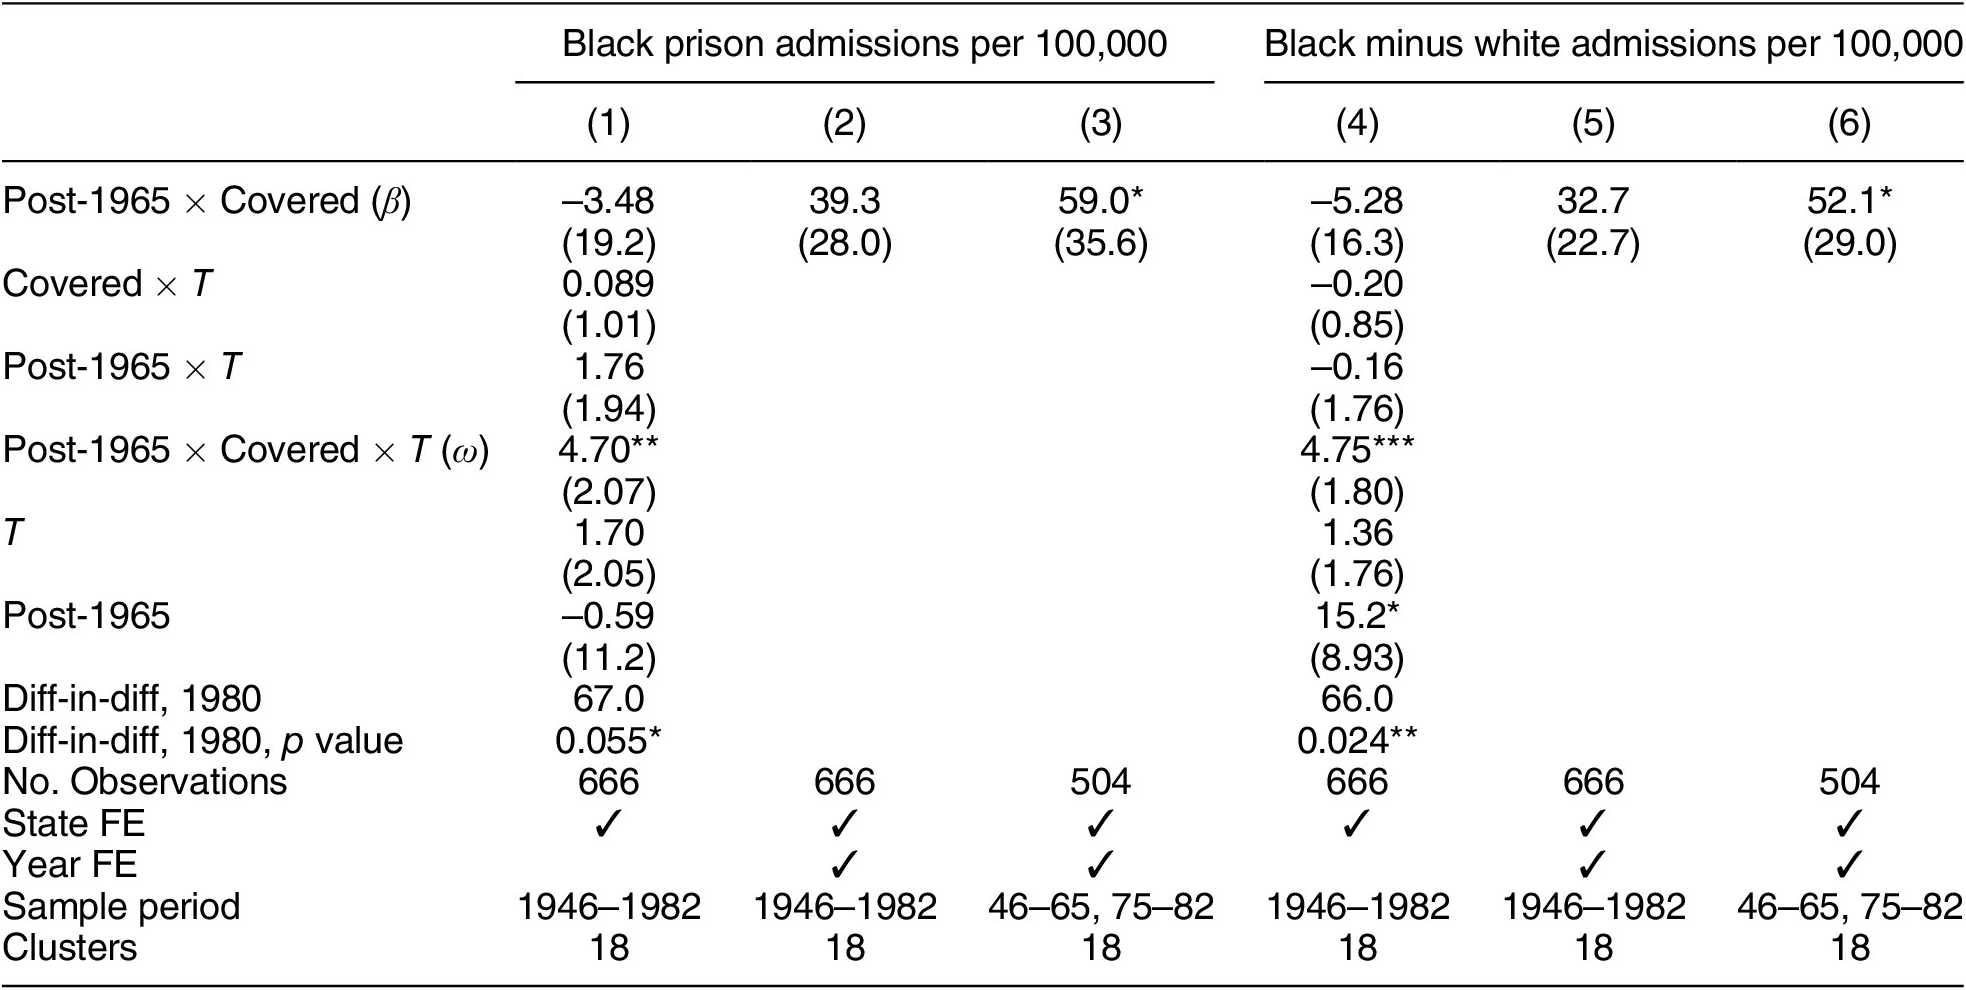
Note: Table 1 shows estimates of the effect of Section 5 coverage on two outcomes: Black prison admission rates per 100,000 people (columns 1–3) and the difference between Black and white prison admission rates (columns 4–6). Columns (1) and (4) present our linear-in-time difference-in-differences including the implied estimate at 1980. Columns (2) and (5) estimate our two-way fixed effects model. Columns (3) and (6) estimate our “long-difference,” with 1965–1975 dropped to account for the fact states may have been slow to respond to passage of the VRA, causing the effect of the VRA to be underestimated if these early years of adjustment are included. All models are estimated using ordinary least squares. Multiple imputation adjustments are made to account for missing data interpolation and associated estimation uncertainty. Errors are also clustered by state. All regressions include a control for share of population living in urban areas. *p < 0.1, **p < 0.05, ***p < 0.01.
Similarly, Columns 2 and 5 present the estimates from our two-way fixed effects model. This estimate is similar but smaller than the estimate of the difference-in-difference in 1980 from Columns 1 and 4—this is to be expected because we know from both the plots above and the estimates in Columns 1 and 4 that prison admissions did not immediately change after 1965 but rather began trending up. Therefore, an average over this entire period will underestimate the difference we see after the carceral state has fully responded to passage of Section 5. This can be seen in our “long-difference” specification in Columns 3 and 6, which includes the same two-way fixed effects as in Columns 2 and 5 but excludes the initial period of transition (1965–1975). As expected, these estimates are larger than those that take into account the entire period and they are in line with the results from Columns 1 and 4 evaluated at 1980.
These estimates constitute substantially large effects. For context, the average Black incarceration rate per 100,000 people in our sample of states was 134.4 with a within-state standard deviation of 49.6. Thus, this effect size of +55 per 100,000 people constitutes more than a one-standard-deviation increase in incarceration rates, an effect about equal to an increase of more than one third of the average incarceration rate.
The magnitude of Black minus white incarceration rates is similar—the average Black minus white incarceration rate in our sample was 94.2 per 100,000, with a within-state standard deviation of 40.3, making the estimated effect size of +50 per 100,000 more than a one-standard-deviation increase, and an effect of more than one half of the average incarceration rate difference.
These results appear quite robust. In Appendix K, we estimate this specification using feasible generalized least squares and get very similar results. In Appendix J, we reestimate the statistical significance of our effect using Fisher randomization tests (Fisher Reference Fisher1935) and get very similar results. Appendix F shows results when we repeatedly fit our model while excluding states one by one and find our treatment effect estimates are quite stable, albeit with slightly lower levels of statistical significance consistent with the smaller sample sizes.
Appendix N presents data on the robustness of our conclusions to maximally influential perturbations (Broderick, Giordano, and Meager Reference Broderick, Giordano and Meager2021). It finds that results do tend to fall below statistical significance with the removal of a relatively small number of the most influential observations (unsurprising given our sample size and significance levels), but we would need to selectively remove at least 19% of our data for the sign of our estimates to change, and no amount of data removal could generate statistically significant results in the other direction.
And finally, in Appendix L we estimate our treatment effect separately for five-year periods to show (1) that prior to 1965 there is no evidence of an “effect” of eventually being covered by Section 5 and (2) that the lag in response to Section 5 seen in Figure 2 that motivates our long-difference specification is also evident in a more rigorous regression framework.
We take both the graphical and econometric results to suggest that Section 5 coverage resulted in more incarceration of Black people (as a rate and relative to whites) after 1965. Though we lack a true randomized experiment, our ability to evaluate parallel pretreatment trends and account for all time-invariant heterogeneity (as well as some observable time-varying factors) that might differently affect potential outcomes under Section 5 lends support to a causal interpretation of the results.
Understanding the Mechanisms
In the previous section, we established a substantively important positive relationship between Black enfranchisement under Section 5 coverage and Black incarceration after the 1965. This evidence is consistent with both our articulation of the New Jim Crow argument and the version of the Self-Policing argument in which newly enfranchised Black voters shifted policy toward the increased use of the carceral state in their own communities. In this section, we set about looking for evidence in support of, or inconsistent with, these theoretical arguments.
In particular, we focus on two questions that are important to understanding whether the rise in incarceration documented above was driven by white response to the VRA or the newfound influence of Black voters: first, was it the case that Black voters consistently preferred the increased use of the carceral state in their own communities, and, second, were Black voters actually de facto empowered by the VRA such that their policy preferences could influence outcomes, or was incarceration primarily observed in areas under white political control.
Black Policy Preferences Regarding the Carceral State
For it to be the case that Black voter demands drove the rise in incarceration (the Self-Policing argument) rather than the actions of the white electorate and white politicians, it must have been the case that a politically influential contingent of Black voters preferred a more punitive carceral state relative to whites such that enfranchisement under the VRA empowered this contingent to push for more punitive policies, resulting in greater incarceration of Black people.
Though it is far from the only model of political influence, the most straightforward model of how enfranchisement might affect electoral outcomes is by changing the electorate’s median voter (Downs Reference Downs1957). If a majority coalition of Black voters held attitudes that were more punitive than the extant median white voter, then their entry into the electorate would have moved the electorate’s median in a punitive direction (all else being equal). Crucially, this majority coalition may have been reflective of Black policy preferences, on average, or it may have reflected a particular politically relevant subgroup—for instance, elite and middle-class voters only.Footnote 32
To see this, consider the pre-1965 period. If the median Black person preferred a more punitive carceral state than the median white voter, then subsequent enfranchisement of Black voters would have shifted the overall electorate’s median toward more punitive outcomes, allowing Black voters the electoral power to (better) translate those preferences into carceral policy outcomes. By contrast, if the median Black person preferred less punitive policies to the median white voter, then enfranchisement should result in a decrease (or slower growth) in incarceration all else equal (conditional, too, on the de facto representation of those preferences). Therefore, even if Black people preferred a “high” degree of punitiveness (setting aside what that would mean, exactly), what matters is how those preferences compared with those of whites who would otherwise have been in power.Footnote 33
As detailed in Appendix I, however, data from pre-1965 Gallup surveys and a 1969 survey specifically on attitudes about violence (Blumenthal, Kahn, and Andrews Reference Blumenthal, Kahn and Andrews2005) do not support the idea that Black voters held more punitive attitudes. According to these surveys, Black respondents were less likely than whites to say that the police should have more power—or that the criminal justice system in general needed more power—and more likely than whites to say that police were too powerful. Blacks were also less likely to say that courts were too lenient or that the courts had made it too difficult to punish criminals, and they also preferred that the state use less “violence” against gangs.
Not only do we find that this is true for Black respondents on average; we also find it to be true if we focus exclusively on ostensibly middle- and upper-class Black respondents. We find some evidence that such respondents may have held more punitive attitudes than their lower-class counterparts, but, crucially, their attitudes were still less punitive than whites who otherwise would have held political power. We also examine attitudes toward drug crime, in particular, under the assumption that drug crime may have driven differential incarceration rates. However, using Gallup data from a 1969 survey of sentencing preferences by crime, we find no evidence that Black respondents held more punitive attitudes on drug crime, specifically, relative to white respondents, nor do we find that middle- and upper-class Blacks held such differentially punitive attitudes on drug crime.
Given this evidence, it is difficult to infer that at the time of the VRA’s passage Black people preferred a more punitive carceral state to whites in a way that would explain our results. Instead, this evidence supports interpreting our results as deriving from the New Jim Crow.
Black Political Empowerment
Despite the lack of evidence that Black people differentially preferred more punitive policies—on average, or in key theorized subpopulations—we separately assess the extent of Black political empowerment and its relation to incarceration. The challenge in doing so is that we are not simply interested in de jure outcomes like registration rates because the path from the franchise to policy outcomes is fraught with difficulty—for example, registered voters may not vote, institutions may malapportion and reduce the effective power of even large voting blocs, or bureaucratic (carceral) actors may be well insulated from elected policy makers.Footnote 34
Therefore, we first evaluate heterogeneity in the effect of Section 5 enfranchisement on incarceration by estimating our long difference-in-differences model from Equation 2 separately for bins of counties with differing Black population shares.Footnote 35 We use county data from Alabama, Georgia, and Tennessee because (1) we have county-level data by race by year and (2) the average effect for these states is comparable to the average effect that we previously found (i.e., they represent “typical” cases (Seawright and Gerring Reference Seawright and Gerring2008).Footnote 36
If it is indeed the case that Section 5 of the VRA contributed to increased prison admissions by empowering Black voters who then pushed for more aggressive use of the carceral state in Black communities, then we should expect to see Black incarceration increasing in the entire range of the Black population distribution. If instead, white elites wielded the carceral state against Black communities as the New Jim Crow predicts, then we would expect differential Black incarceration to increase in the Black population (where the population share constitutes a measure of threat), but only up to the point that Black populations are most likely to fully control political power—that is, where the Black population constitutes a majority. Above that majority threshold, we would expect differential incarceration by race to decline. Thus, although both the New Jim Crow and Self-Policing arguments predict that incarceration should be increasing in the Black population up to a point, we obtain analytic leverage from those places with a greater than 50% Black population.Footnote 37
We report our results in Table 2 where each column represents our estimate of the difference-in-differences parameter for different cuts of the Black population. For counties that are not majority Black, we find that the effect of Section 5 coverage on our incarceration outcomes increases with the size of the Black population. However, the tables provide some suggestive evidence that differential Black incarceration was relatively lower for Black populations above 50%. The results are similar when measuring Black-minus-white incarceration rates (Appendix M).
Heterogeneity in the Effect on the Black Prison Admission Rate by the Black Share of Population

Note: Outcome: Black prison admission rate per 100,000, with each model sample restricted by Black share of population immediately post-VRA. The above models estimate the long-difference version of Equation 2 for different levels of Black population share in the immediate post-VRA period, dropping the years 1965–1974. In Appendix G, we observe similar nonmonotonicities using the Black share of registered voters. The cut points are chosen based on the distribution county Black population, with the constraint of one group above 50%. We note that only two never-covered counties enter into our sample in model 4. We include a control for share of the county that is urban. We exclude counties with less than 5% of the population Black. *p < 0.1, **p < 0.05, ***p < 0.01.
These results indicate that Black political power in this form did not reduce the carceral burden on Black communities after 1965. Instead our estimates suggest that it translated into the ability to limit the growth of racially differentiated incarceration. We focus on comparing the magnitude of the results here, rather than the precision of the estimates, noting the very small sample sizes. Indeed, the meaningful null hypothesis is whether the estimates are different from one another, not zero, which unfortunately we cannot reject. Overall, our results are consistent with the New Jim Crow argument.
Another way of conceptualizing Black political efficacy is by examining descriptive representation. The presence of Black elected officials may be indicative of Black electorates that were able to overcome participatory hurdles and obtain de facto influence. Examining outcomes in communities with Black elected officials is also a reasonable test of the Self-Policing model if one believes in an elite-led model of political influence in which a small portion of the electorate holds disproportionate influence over policy making and implementation, as these are the localities where we would expect that influence to be seen.Footnote 38
Therefore, we also examine county-level heterogeneity in our main effects by the presence of local (i.e., county and municipal) Black elected officials.Footnote 39 We digitize 16 years of data from the Roster of Black Elected Officials and pair it with our county admissions to state-level prison. We find suggestive evidence that in counties with Black elected officials, Black incarceration rates were lower than in counties without any Black elected officials. This provides additional evidence suggesting that increases in incarceration were not driven by the choices of newly empowered Black voters or politicians.
While no individual result presented here is definitive, taken together, we interpret the constellation as evidence that whites did differentially use carceral institutions against Black communities after the VRA (though whether this was the result of top-down intentionality or diffuse actions is unfortunately beyond the scope of this analysis). Overall, we consider the main results we observe to have more likely arisen as a consequence of the New Jim Crow argument.
Conclusion
In this paper, we investigate the link between one of the core components of democracy—the franchise—and the use of the carceral state. We do so in the context of the 1965 Voting Rights Act in the US, which sought to dramatically expand Black political power. Analyzing newly collected state and county-level data on incarceration by race both before and after the VRA, we find that states covered by Section 5 experienced a differential growth in Black incarceration after 1965 relative to states that were not covered.
By examining evidence of Black carceral attitudes, and county-level heterogeneity in our results by each Black population, and Black elected officials, we conclude that our results are most likely to derive from white reaction to the crumbling of the Jim Crow sociopolitical order. Our results represent the first causal test of a prominent theory that the origins of race-based mass incarceration in the US are rooted in the racial struggles of the 1960s and their associated institutional changes (Alexander Reference Alexander2012). They further demonstrate the long legacy of the use of the carceral state as a means of minority social control in the US (Blackmon Reference Blackmon2009; Mazumder Reference Mazumder2019; Muhammad Reference Muhammad2011; Oshinsky Reference Oshinsky1997). The implied perversity of the New Jim Crow argument, and thus our findings, is that even de jure enfranchisement was not enough for Black people to fully escape these legacies.
Our findings have implications for the future study of the relationship between race, enfranchisement, and incarceration in the US. First, our paper contributes a detailed articulation of the New Jim Crow argument and what we consider its two primary potential mechanisms. We currently lack the evidence necessary to evaluate which—or whether both—explains our results, but such evidence would shed light on the conditions under which we would expect a similar use of carceral control to obtain. In addition, we study an important outcome near the end of the carceral process. Further work, in the vein of Facchini, Knight, and Testa (Reference Facchini, Knight and Testa2020), could illuminate which places within this process contribute most to the end result.
Our findings are situated in a particular country case and historical context that has generated significant scholarly debate. Nevertheless, our research addresses the literature on democratization via enfranchisement, more broadly. As noted by scholars such as Key (Reference Key1950) and Mickey (Reference Mickey2015), the US South in the early twentieth century was a collection of one-party authoritarian enclaves in a larger democratic polity. Enfranchisement via the VRA was not so much a transformation of national-level institutions as it was an imposition of enfranchisement from those institutions to the jurisdictions below. Our paper demonstrates one institutional outlet of reification when such democratization is imposed—largely unwillingly—from centers of national power. By virtue of the federal system in the US, states reserved ample scope for reactive policy when national power imposed and enforced subnational democratization, illustrating the challenges of ensuring equality of access to even the most basic rights in a federalist system.Footnote 40 Further work could better understand how endogenous, as opposed to exogenous, enfranchisement shapes elite responses via the carceral state, as well as how these results might be conditioned by the institutional relationship between national and subnational governments.
Our findings also address current debates about mass incarceration in several ways. First, the modern criminal justice system is full of positive feedback loops that carry forward past inequities.Footnote 41 Given that, it is impossible to normatively evaluate the consequences of the modern criminal justice system without understanding the origins of inequities reinforced by the current system. In addition, our study provides yet another demonstration that incarceration rates are not a mechanical reflection of crime; instead, they are politically and socially determined outcomes under the control of the people (Garland Reference Garland1990). In the midcentury US, that fact contributed to the rise of the racially disproportionate incarceration of Blacks. Moving forward, however, it is a reminder that mass incarceration is a fundamentally political problem, and one that can be affected through political change.
Supplementary Materials
To view supplementary material for this article, please visit http://doi.org/10.1017/S0003055421001337.
Data Availability Statement
Research documentation and data that support the findings of this study are openly available at the American Political Science Review Dataverse: https://doi.org/10.7910/DVN/FUFDYH. Limitations on data availability are discussed in the data documentation that is available at the American Political Science Review Dataverse.
Acknowledgments
The authors thank Ran Abramitzky, Joshua Clinton, Florian Hollenbach, Amy Lerman, Trevon Logan, Chris Muller, Jan Pierskalla, Jonathan Rodden, Paul Sniderman, Ariel White, Steven White, Gavin Wright, two groups at Duke University, participants at APSA 2020, and three anonymous reviewers for their comments and feedback on this project. Invaluable research assistance was provided by Aaron Ainsworth, Nicholas Ainsworth, Isaac Gabella, Morgan (Grey) Hollowell, Hannah Rogers, and Michaela (Calee) White.
Funding Statement
This research was supported in part by the Alma Ostrom and Leah Hopkins Awan Civic Education Fund as part of the 2018 APSA Centennial Grant program.
Conflict of Interest
The authors declare no ethical issues or conflicts of interest in this research.
Ethical Standards
The authors affirm that this research did not involve human subjects.


 Open access
Comments
No Comments have been published for this article.