

Sweetened soft drinks are popular in both Europe and the USA, with their intake frequency and portion size increasing markedly over the last three decades( Reference Nielsen and Popkin 1 ). Current figures from the USA indicate mean daily intakes to be approximately 600 ml of soft drinks per person( Reference Nielsen and Popkin 1 ), and the National Diet and Nutrition Survey rolling programme has reported mean daily intakes to be approximately 240 ml of soft drinks per person per d in the UK, with double this intake being found in younger people( Reference Bates, Lennox and Prentice 2 ). The intake of sugar-sweetened soft drinks accounts for over half of the soft drink intake( Reference Bates, Lennox and Prentice 2 ). Sugars such as sucrose and fructose maize syrup are commonly used to sweeten soft drinks, accounting for 7 % of the total energy intake in the USA( Reference Nielsen and Popkin 1 ) and 2 % of the energy intake in the UK( Reference Gibson and Shirreffs 3 ). Artificial, or non-energetic, sweeteners such as aspartame are used in diet soft drink preparation and are becoming increasingly popular. The intake of such artificially sweetened soft drinks, marketed as being healthier alternatives to sugar-sweetened soft drinks, now accounts for nearly half of the total soft drink intake( Reference Bates, Lennox and Prentice 2 , 4 ).
Along with the increased consumption of soft drinks, there has been a rapid and large increase in the reported incidence of type 2 diabetes( 5 ). In the UK, diabetes affects almost 3 million people (90 % with type 2 diabetes)( 6 ) and is estimated to cost the UK £14 billion each year, approximately 10 % of the total health budget( 6 ). Some of this increase is due to an ageing population, but the incidence of type 2 diabetes is also increasing in younger age groups( Reference Rosenbloom, Silverstein and Amemiya 7 ). The intake of sugar-sweetened drinks containing either sucrose or high-fructose maize syrup may be associated with this increase in the incidence of type 2 diabetes either due to the influence of these drinks on the glycaemic or insulinaemic response or due to their contribution to an excessive energy intake, increasing the risk of weight gain, which is a key risk factor for the development of type 2 diabetes( Reference Malik, Popkin and Bray 8 ). Global figures estimate that about 1 billion people are overweight and about 500 million are obese, with associated increases in the incidence of chronic disease and disability( 9 ).
Although several influential studies have reported the intake of sugar-sweetened drinks to be associated with an increased risk of type 2 diabetes, it is unclear whether this is due to the sugar content or related lifestyle factors, such as other dietary practices, sedentary behaviour or lack of physical activity. It is also not known whether similar associations hold for artificially sweetened drinks, with research showing less consistent results. Moreover, it is of interest to determine how these associations are related to the measures of obesity such as BMI. Several reviews of cohorts and trials have reported associations between sugar-sweetened drink intake and weight gain in adults and children( Reference Malik, Schulze and Hu 10 – Reference Malik, Pan and Willett 13 ), supported by evidence from several substantive randomised controlled trials( Reference Ebbeling, Feldman and Chomitz 14 , Reference de Ruyter, Olthof and Seidell 15 ), while other reviews have suggested that no associations exist( Reference Forshee, Anderson and Storey 16 ). It has been suggested that some of this inconsistency lies in how the results are interpreted by different stakeholders( Reference Bes-Rastrollo, Schulze and Ruiz-Canela 17 – Reference Massougbodji, Le Bodo and Fratu 19 ). A previous review of cohorts assessing the association between sugar-sweetened drink intake and type 2 diabetes risk, published in 2010, has reported a 26 % increase in the risk of diabetes in the highest quantile compared with that in the quantiles representing no or rare intake of sugar-sweetened soft drinks( Reference Malik, Popkin and Bray 8 ). However, with the publication of results from four large cohorts in the last year, including artificially sweetened drinks for comparison, and recent suggestions for restricting or taxing the production or sale of sugar-sweetened soft drinks( Reference Michael 20 , Reference Briggs, Mytton and Kehlbacher 21 ), a systematic review of all the latest evidence is urgently required. Therefore, we aimed to conduct a systematic literature review and dose–response meta-analysis of evidence from prospective cohorts to explore these issues.
Methods
Search strategy
Literature searches for articles published between 1 January 1990 and November 2009 were conducted by an information specialist in addition to other members of the research team (V. J. B., D. E. T. and C. L. C.). Searches were carried out with the aim of identifying articles reporting associations between carbohydrate intake, in any form, and any cardiometabolic health outcome. A total of seven electronic databases were used: The Cochrane Library; MEDLINE; MEDLINE In-Process; Embase; CAB Abstracts; ISI Web of Science; BIOSIS. The main search was extended using MEDLINE, MEDLINE In-Process and Embase, as these databases were the main sources of articles identified in the initial search. The update search was conducted on 5 June 2013 and was carried out only for articles reporting associations between sweetened beverage intake and incident diabetes mellitus type 2 risk. The same key search terms were employed for both searches and included relevant Medical Subject Headings (MeSH) terms for sweetened drinks and type 2 diabetes in addition to all combinations of the following terms: soft/soda/carbonated/sweet/sugar with beverage/drink. Full search strategies are summarised in Table S1 (available online). To supplement the electronic searches, hand-searching of selected journals and cross-checking of bibliographies from other published review articles were also carried out. Standard guidelines for conducting and reporting meta-analyses of observational studies were followed( Reference Stroup, Berlin and Morton 22 ). Ethical approval was not required for the present work.
Study selection
The members of the review team initially screened the titles and abstracts of all the identified articles to remove those, where it was immediately apparent, that were not relevant to the review, such as editorials, single case-study reports and therapeutic approach articles. Consistency between individual reviewers was maintained through the use of pre-specified guidelines. The full-text versions of all potentially relevant articles were read independently by two members of the review team, and any disagreement was settled by a third reviewer. Eligibility for study inclusion was determined using a structured flow chart and detailed guidelines.
Eligible articles were published since 1990 and in English language and reported original research from prospective observational studies with ≥ 3-year follow-up duration. Studies had to report incident diabetes mellitus type 2 risk in relation to the intake of either sugar-sweetened or artificially sweetened soft drinks. The results of studies that did not differentiate between sugar and artificial sweeteners were not included in the meta-analyses. The primary aim of the present work was related to the prevention of diabetes mellitus type 2; therefore, studies where participants had been specifically recruited because of ill health or history of disease or where participants were not recruited from a generally healthy population were excluded.
Data extraction
Data were extracted directly into a Microsoft Access database that included pre-defined fields to capture aspects of study design and quality as well as all results. Details on exposure type and quantity, case numbers, and the definition of outcomes and adjustments used in analyses were also extracted. This method was based on the approach used for the World Cancer Research Fund Second Expert Report( 23 ).
Statistical analyses
The included studies used a range of definitions for their soft drink intake categories and we therefore derived an estimated linear dose–response trend for each study before combining these using a random-effects meta-analysis( Reference Greenland and Longnecker 24 ). Study-specific slopes (with 95 % CI), based on the results presented for each category of sweetened drink intake, were generated using this method. Dose–response curves for every study were derived using the distribution of cases and person-years, or cases and non-cases, when relative risks (RR) plus estimates of uncertainty (e.g. CI) were reported in at least three categories of intake. If the total number of cases or person-years was presented but not the distribution, this was estimated based on the definitions of quantiles. The median or mean level of sweetened soft drink intake for each category was then assigned to the corresponding RR. When medians and means were not presented, the category mid-point was used. Where the highest or the lower category was unbounded, we assumed the width of the category to be the same as that of the next adjacent category, so that we could assign a mid-point. Where studies had already reported a linear dose–response trend, with CI or standard error, this was used directly.
For comparability, the various increments (servings/cups per drink per d per week) presented for sweetened soft drink intakes in studies were converted into ml/d. Conversion was carried out according to the definition of the serving/cup per drink size in each study where it was specified or using estimations of serving sizes from studies carried out in the same country where it was not specified in the article (see Table 1).
Characteristics of studies included in the dose–response meta-analyses of sugar-sweetened and artificially sweetened soft drink intake and type 2 diabetes risk
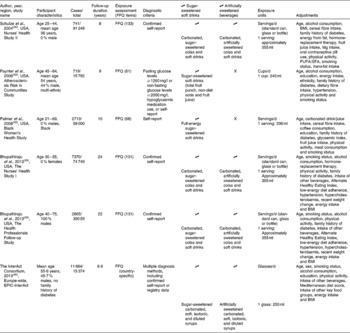
EPIC, European Prospective Investigation into Cancer and Nutrition.
If a study only presented results for men and women separately, then to provide correct measures of heterogeneity, the linear dose–response trends from each sex were first combined into a single overall estimate for that study using a fixed-effects meta-analysis, before being combined with the other studies using a random-effects meta-analysis.
Heterogeneity between the studies was quantified using the proportion of total variation in study estimates that is explained by heterogeneity (I 2)( Reference Higgins and Thompson 25 ). This is presented alongside the results of a formal test of heterogeneity based on Cochran's Q statistic.
Non-linear dose–response curves were plotted using restricted cubic splines for each study presenting results for more than three categories of intake, using knots fixed at percentiles 10, 50 and 90 % through the whole distribution( Reference Harrell, Lee and Pollock 26 , Reference Orsini and Greenland 27 ). Studies presenting fewer categories, or only using a continuous measure of intake, could not contribute to the estimation of non-linear dose–response trends. Contributing studies were then combined using a multivariate meta-analysis( Reference White 28 ). Plots include tick marks to indicate category mean, median or mid-points for the included studies, showing how the data are spread across intakes, on which the curve is based.
The methodological quality of studies was evaluated using the Newcastle–Ottawa scale, presented as a risk of bias table. Aspects of study quality that may contribute to between-study heterogeneity in results, such as follow-up duration, sex of the study participants, geographical location, mean beverage intake in the cohort, and adjustment for pre-specified potential confounders, were also explored through subgroup analyses defined in advance. Given the possibility that BMI may not be a confounder, but may be a mediator in the causal pathway, or an effect modifier, we investigated its role further. To assess the extent to which adjustment for BMI influenced the estimates, meta-analyses were repeated for those studies presenting results both with and without this adjustment on the same data. We also explored estimates in subgroups based on the mean BMI of participants in the cohort (dichotomised at 25 kg/m2), with meta-regression to test for potential effect modification. Small-study effects, such as publication bias, were explored using funnel plots.
The authors of three papers were contacted for further data to allow greater inclusion in the meta-analyses, with two kindly responding in time for inclusion in the analyses( Reference Bhupathiraju, Pan and Malik 29 , Reference Schulze, Manson and Ludwig 30 ). A full study protocol was prepared by the authors and peer-reviewed by the UK Scientific Advisory Committee on Nutrition before conducting the review, but it is not currently available for download( 31 ). All analyses were carried out in Stata 12.1 (StataCorp)( 32 ).
Results
Literature search
In total, eleven relevant publications from nine cohorts that reported data on the association between sweetened soft drink intake and type 2 diabetes risk were identified (Fig. S1, available online)( Reference Bhupathiraju, Pan and Malik 29 , Reference Schulze, Manson and Ludwig 30 , Reference Paynter, Yeh and Voutilainen 33 – Reference Eshak, Iso and Mizoue 41 ). Data from the French arm of the European Prospective Investigation into Cancer and Nutrition (EPIC) study( Reference Fagherazzi, Vilier and Sartorelli 39 ) were included in another publication reporting pan-European data from the EPIC-InterAct study( 40 ), so we excluded data from the French arm from the meta-analyses to avoid duplication. Results obtained in the Health Professionals Follow-up Study are reported in two publications( Reference Bhupathiraju, Pan and Malik 29 , Reference de Koning, Malik and Rimm 38 ), so results obtained in the study with shorter follow-up duration were not included in the meta-analyses( Reference de Koning, Malik and Rimm 38 ). Of these nine cohorts, five were from the USA, two from Europe and two from Asia.
In one of the cohorts, the results for artificially sweetened soft drinks were not presented on their own, but instead were combined with those of some unsweetened soft drinks. This cohort was therefore excluded from the meta-analysis of artificially sweetened drinks( Reference Nettleton, Lutsey and Wang 36 ). Estimates for the association between type 2 diabetes risk and sugar-sweetened beverage intake were not reported by this cohort. Only results obtained for all soft drinks combined, and fruit juice or fruit and vegetable juice, were reported by three cohorts, so these cohorts were excluded from the meta-analysis of all sugar-sweetened or artificially sweetened soft drinks( Reference Montonen, Jarvinen and Knekt 34 , Reference Odegaard, Koh and Arakawa 37 , Reference Eshak, Iso and Mizoue 41 ). The characteristics of studies included in the dose–response meta-analyses are given in Table 1, and the risk of bias for the same studies is summarised in Table S2 (available online).
Sugar-sweetened soft drinks
Data were extracted from five publications on six cohorts investigating the association between sugar-sweetened soft drink intake and type 2 diabetes risk( Reference Bhupathiraju, Pan and Malik 29 , Reference Schulze, Manson and Ludwig 30 , Reference Paynter, Yeh and Voutilainen 33 , Reference Palmer, Boggs and Krishnan 35 , 40 ), using additional information provided by the authors of one publication( Reference Bhupathiraju, Pan and Malik 29 ) (Fig. 1). The estimated category mean intakes ranged from 0 to approximately 1000 ml/d in one study. The pooled estimate of RR from the linear dose–response meta-analysis was 1·20 (95 % CI 1·12, 1·29)/330 ml per d of sugar-sweetened soft drinks (P< 0·001). There was substantial heterogeneity between the cohort studies (I 2= 80 %, 95 % CI 58, 91 %, Q= 26, df = 5, P< 0·001). Much of this heterogeneity was attributable to one study( Reference Paynter, Yeh and Voutilainen 33 ) that, unlike the other studies, included fruit juice in its definition of sugar-sweetened soft drinks. Without this study, the estimate was very similar (RR 1·23, 95 % CI 1·17, 1·30, P< 0·001), but the heterogeneity decreased to 65 (95 % CI 9, 87) %.
Forest plot of sugar-sweetened soft drink intake and type 2 diabetes risk. EPIC, European Prospective Investigation into Cancer and Nutrition; RR, relative risk.

On restricting the meta-analyses to the three cohorts in two publications presenting results both with and without adjustment for BMI( Reference Bhupathiraju, Pan and Malik 29 , 40 ), estimates that were adjusted for BMI (RR 1·16, 95 % CI 1·11, 1·20) were found to be slightly lower (P= 0·02) than those without adjustment (RR 1·23, 95 % CI 1·18, 1·28) (Fig. S2, available online). There was no evidence of any other study characteristics explaining the heterogeneity between the studies (Table S3, available online). In particular, there was no evidence that cohorts with a lower mean BMI reported different results compared with those with a higher mean BMI (Fig. S3, available online). There was no evidence of asymmetry in the funnel plot (Fig. S4, available online) and therefore no evidence of small-study effects such as publication bias.
There was some evidence of mild nonlinearity in the dose–response curve (Fig. 2), though data for higher intakes were based on just one of the included studies.
Non-linear dose–response curve for sugar-sweetened soft drink intake and type 2 diabetes risk. ![]() , Best-fitting cubic spline;
, Best-fitting cubic spline; ![]() , 95 % CI. RR, relative risk.
, 95 % CI. RR, relative risk.

Artificially sweetened soft drinks
Data were extracted from three publications on four cohorts investigating the association between artificially sweetened soft drink intake and type 2 diabetes risk( Reference Bhupathiraju, Pan and Malik 29 , Reference Schulze, Manson and Ludwig 30 , 40 ), using additional information provided by the authors of two publications( Reference Bhupathiraju, Pan and Malik 29 , Reference Schulze, Manson and Ludwig 30 ) (Fig. 3). The estimated category mean intakes ranged from 0 to approximately 500 ml/d. The pooled estimate of RR from the linear dose–response meta-analysis was 1·13 (95 % CI 1·02, 1·25)/330 ml per d of artificially sweetened soft drinks (P= 0·02). There was substantial heterogeneity between the cohort studies (I 2= 87 %, 95 % CI 67, 94 %, Q= 22, df = 3, P< 0·001). There were very few studies to explore sources of heterogeneity through subgroup analyses or to detect small-study effects with a funnel plot.
Forest plot of artificially sweetened soft drink intake and type 2 diabetes risk. EPIC, European Prospective Investigation into Cancer and Nutrition; RR, relative risk.

There was some evidence of mild nonlinearity in the dose–response curve (Fig. 4), though the number of included studies was very small.
Non-linear dose–response curve for artificially sweetened soft drink intake and type 2 diabetes risk. ![]() , Best-fitting cubic spline;
, Best-fitting cubic spline; ![]() , 95 % CI. RR, relative risk.
, 95 % CI. RR, relative risk.

Discussion
We included the results obtained in six large prospective studies, including over 22 000 cases of type 2 diabetes among nearly 280 000 participants, in the meta-analyses carried out in the present work. The results of the meta-analyses demonstrate a clear positive association of the intake of both sugar-sweetened soft drinks and artificially sweetened soft drinks with the increasing incidence of type 2 diabetes. The association was stronger and more consistent for soft drinks sweetened with sugar than for those sweetened with artificial sweeteners, with an increase of 330 ml/d being associated with approximately 20 % increased risk. These results build on those obtained in 2010 by Malik et al. ( Reference Malik, Popkin and Bray 8 ), in whose study the risk of diabetes was found to increase by 26 % in the highest quantile, drinking one to two cans per d, compared with that in non-consumers. The results of the present meta-analyses strengthen these findings by adding four large cohorts, avoiding the well-known problems of comparing extreme categories in different studies by using linear and non-linear dose–response trends( Reference Yu, Schmid and Lichtenstein 42 ) and by comparing results obtained for sugar-sweetened soft drinks with those obtained for artificially sweetened soft drinks.
Despite avoiding some heterogeneity by including only cohort studies, converting all consumption values to ml/d using the serving sizes reported in the papers, where possible, and using linear and non-linear dose–response trends to combine studies using different exposure categorisations, between-study heterogeneity remained high for all the meta-analyses. This high heterogeneity indicates that emphasis should be placed more on the existence and direction of the association than on the exact pooled estimate.
Exploration of this heterogeneity by investigating the estimates in different pre-defined subgroups indicated that adjustment for BMI was potentially important, with studies that did adjust for it having lower estimates for the association between sugar-sweetened soft drink intake and type 2 diabetes risk. This is consistent with the hypothesis that BMI is involved in the causal pathway and should not be adjusted for. However, there was still a substantial association across the studies even after adjusting for BMI, with associations being found across the studies with a range of mean baseline BMI, indicating that other mechanisms may exist for the action of sugar-sweetened drinks or that other lifestyle factors associated with high intakes are involved. In particular, the evidence for an association between the intake of artificially sweetened soft drinks and risk of type 2 diabetes supports the notion of other lifestyle factors being responsible. Alternatively, it may be that overweight or obesity predated the consumption of artificially sweetened drinks in these studies or that individuals on a weight gain trajectory may have adopted the consumption of artificially sweetened drinks in an attempt to minimise further weight gain. Taking the EPIC-InterAct study for example, the authors report that, at the beginning of the study, the initial BMI of frequent consumers of artificially sweetened drinks (28 kg/m2) was substantially higher than that of frequent consumers of sugar-sweetened drinks (26 kg/m2)( 40 ). Therefore, the findings for artificially sweetened soft drinks may be a result of reverse causality. Others have suggested that the uncoupling of the sweet taste from an energy source may stimulate appetite, leading to a positive energy balance resulting in weight gain( Reference Blundell and Hill 43 ), and that this may be the route through which artificially sweetened drinks elevate the risk of type 2 diabetes. However, there is currently limited evidence to support this hypothesis. Alternatively, the use of artificially sweetened soft drinks may be associated with higher sugar intakes elsewhere in the diet( Reference Tellez, Ren and Han 44 ), and it may be that some individuals overcompensate for the perceived loss of energy when they knowingly consume artificially sweetened foods or drinks( Reference Mattes 45 ).
If sugar-sweetened soft drinks are detrimental to health, the glycaemic effect of high sugar consumption may be one mechanism through which they could act( Reference Malik, Popkin and Bray 8 , Reference Malik and Hu 46 ). Additionally, there is limited evidence from randomised trials in human subjects to indicate that greater fructose intakes lead to visceral fat deposits( Reference Maersk, Belza and Stodkilde-Jorgensen 47 , Reference Stanhope, Schwarz and Keim 48 ). Fructose is a major component of sugar-sweetened drinks and is potentially responsible for visceral fat deposits by directly providing substrates for fat development when it is metabolised, principally in the liver( Reference Bray 49 ). A recent trial provided participants with 1000 ml/d of a full-sugar drink, an artificially sweetened drink, semi-skimmed milk or water for 6 months and found that there was no differential change in BMI or total fat mass among the groups after 6 months, but that liver fat, skeletal fat and visceral fat mass was relatively higher in the full-sugar drink group than in the other three groups( Reference Maersk, Belza and Stodkilde-Jorgensen 47 ). However, a recent narrative review by Rippe & Angelopoulos( Reference Rippe and Angelopoulos 50 ) cautions researchers not to place emphasis on the type of sugar consumed, be it sucrose, fructose or high-fructose maize syrup. Thus, a focus on general sugar intake from beverages in future trials may help to provide a better consensus on associations between the intake of sugar-sweetened beverages and risk factors for the development of diabetes, along the lines of recent trials for weight gain( Reference Ebbeling, Feldman and Chomitz 14 , Reference de Ruyter, Olthof and Seidell 15 ). Although our conclusions are consistent with the general consensus for the role of sugar-sweetened soft drinks, the present work is the first to attempt to estimate the strength of the association by examining dose–response trends rather than comparing the extreme consumption levels. In addition, it is the first to explore some of the heterogeneity between the different cohorts and the first to reduce some of this heterogeneity by combining dose–response trends. Our finding of possible non-linear associations should be interpreted cautiously because of the potential for differential measurement errors to occur between studies and is largely consistent with an increasing risk with increasing intake.
We did not review the evidence from randomised controlled trials in the present work. Observational studies are more susceptible to some biases than randomised controlled trials, and the pooled estimates from the meta-analyses are similarly prone to the same biases, to the extent that the studies reviewed are biased. In particular, the self-reported consumption values used by all the cohorts are susceptible to a potentially large degree of measurement errors, which could bias the associations in either direction. Because this review is based on observational evidence, we cannot conclusively prove that any associations are causal, and there may be some uncorrected confounding in some or all of the studies. However, the estimates that we found for sugar-sweetened soft drinks and, to some extent, for artificially sweetened soft drinks show strong dose–response trends, and there was no evidence of any small-study effects such as publication bias.
In conclusion, though the observational nature of the studies included in the meta-analyses means that causal inference cannot be proven, our findings contribute to a growing body of evidence for a positive association between sugar-sweetened soft drink intake and type 2 diabetes risk. We demonstrated this to be attenuated by adjustment for BMI. There was a less consistent trend for artificially sweetened soft drinks, and together with the effect of adjusting for BMI, this may indicate an alternative explanation for the observed association, such as lifestyle factors or reverse causality. The temporal nature of the association between soft drink intake and type 2 diabetes risk and whether BMI modifies or mediates this association are crucial issues, and future studies should attempt to address these and longitudinally assess both BMI and intake trends. Recommendations to limit the consumption of sugar-sweetened soft drinks by promoting the supply of sugar-free alternatives depend, in part, on the nature of the association with obesity and whether alternatives to artificially sweetened soft drinks also have negative consequences.
Supplementary material
To view supplementary material for this article, please visit http://dx.doi.org/10.1017/S0007114514001329
Acknowledgements
The authors thank James Thomas, University of Leeds, for designing the database.
The present work was funded by the Department of Health for England. The funder had no role in the design and analysis or in the writing of this article.
The authors' contributions are as follows: D. C. G. contributed to the study design, manuscript selection, and data extraction, conducted all the statistical analyses, interpreted the results and drafted the manuscript; D. E. T. carried out the literature searches, contributed to data extraction and interpreted the results; V. J. B. was the principal investigator, designed the study, contributed to the literature searches and interpreted the results; C. L. C. contributed to the literature searches and data extraction and interpreted the results; C. E. L. E., C. N. and C. W. contributed to data extraction and interpreted the results. All authors revised the draft critically for important intellectual content and approved the final version. D. C. G. and V. J. B. are joint guarantors of the present work and, as such, had full access to all the data used in the work and take responsibility for the integrity of the data and the accuracy of the data analysis.
D. C. G. has held an unrelated research grant (a study of infant diet) funded by Danone and has received personal fees from the American Institute for Cancer Research/World Cancer Research Fund, outside the submitted work. D. E. T. has held a PhD studentship sponsored by Kellogg's Public Limited Company. There are no other potential conflicts of interest.


