


1 Introduction
Multilevel latent variable models have been widely adopted in psychology, education, and related sciences to analyze hierarchical data while accounting for unobserved effects (Bollen et al., Reference Bollen, Fisher, Lilly, Brehm, Luo, Martinez and Ye2022; Lüdtke et al., Reference Lüdtke, Marsh, Robitzsch, Trautwein, Asparouhov and Muthén2008; Skrondal & Rabe-Hesketh, Reference Skrondal and Rabe-Hesketh2009; Zitzmann, Wagner, et al., Reference Zitzmann, Wagner, Hecht, Helm, Fischer, Bardach and Göllner2022). Unlike traditional multilevel regression models (Raudenbush & Bryk, Reference Raudenbush and Bryk2002; Snijders & Bosker, Reference Snijders and Bosker2012), which rely on observed variables at each level, multilevel latent variable models introduce latent constructs that improve measurement accuracy and reduce bias in parameter estimates (Muthén & Asparouhov, Reference Muthén and Asparouhov2012; Zitzmann et al., Reference Zitzmann, Lüdtke, Robitzsch and Marsh2016). These models allow for more precise estimations of relationships at different levels of analysis by correcting for measurement error and providing a more flexible framework for capturing complex dependencies in nested data.
Over the past two decades, multilevel latent variable models have been widely applied in educational research to model student achievement and classroom effects (Lüdtke et al., Reference Lüdtke, Marsh, Robitzsch, Trautwein, Asparouhov and Muthén2008; Marsh, Reference Marsh1987), psychological research for latent personality and cognitive processes (Bollen et al., Reference Bollen, Fisher, Lilly, Brehm, Luo, Martinez and Ye2022; Muthén & Asparouhov, Reference Muthén and Asparouhov2012), and health sciences for hierarchical patient-reported outcomes (Hamaker & Klugkist, Reference Hamaker, Klugkist, Hox and Roberts2011).
Compared to mixed-effects models (Raudenbush & Bryk, Reference Raudenbush and Bryk2002; Snijders & Bosker, Reference Snijders and Bosker2012), which typically assume that all predictors are observed and measured without error, multilevel latent variable models provide greater flexibility in handling measurement error and latent constructs. This makes them particularly valuable in psychological and educational research, where many key variables (e.g., cognitive ability, motivation, and instructional quality) cannot be directly observed. Moreover, multilevel latent variable models allow researchers to separate within-group and between-group variance more effectively than traditional mixed-effects models, leading to more reliable inferences.
Multilevel models can be classified based on whether variables are assessed at the individual or group level (Croon & van Veldhoven, Reference Croon and van Veldhoven2007; Snijders & Bosker, Reference Snijders and Bosker2012). One relevant example in education is the study of student learning outcomes as a function of class-level characteristics such as class size. The “classic” multilevel models (also called random intercept models) used for this purpose are often estimated using software, such as HLM (Raudenbush et al., Reference Raudenbush, Bryk, Cheong, Congdon and du Toit2011) or lme4 (Bates et al., Reference Bates, Maechler, Bolker and Walker2015).
However, various works (e.g., Asparouhov & Muthén, Reference Asparouhov and Muthén2007; Lüdtke et al., Reference Lüdtke, Marsh, Robitzsch, Trautwein, Asparouhov and Muthén2008) have argued that this type of aggregation can lead to severely biased estimates of the effect of the context characteristic. One possible solution is to use a specialized multilevel model in which the context variable is formed through latent rather than manifest aggregation (for a discussion of latent aggregation, see Lüdtke et al., Reference Lüdtke, Marsh, Robitzsch, Trautwein, Asparouhov and Muthén2008, Reference Lüdtke, Marsh, Robitzsch and Trautwein2011). Unfortunately, such a model with a latent predictor cannot be specified in HLM or lme4 and is therefore often estimated using Mplus (Muthén & Muthén, Reference Muthén and Muthén2012). However, these models place high demands on the data, and convergence problems or inaccurate estimates of effects at the class level (accuracy issues) can occur.
Similar methods also play a role in other modeling contexts, such as regression analysis (Hoerl & Kennard, Reference Hoerl and Kennard1970; Tibshirani, Reference Tibshirani1996; see also McNeish, Reference McNeish2015) and structural equation models (Yuan & Chan, Reference Yuan and Chan2008; see also Yuan & Chan, Reference Yuan and Chan2016). In the latter, a small value is typically added to the estimated variance, and it has been suggested that a similar effect can be achieved by selecting an appropriate prior distribution (e.g., Chung et al., Reference Chung, Gelman, Rabe-Hesketh, Liu and Dorie2015; McNeish, Reference McNeish2016; Zitzmann et al., Reference Zitzmann, Lüdtke, Robitzsch and Marsh2016).
Bayesian approaches have gained increasing popularity in multilevel modeling due to their ability to enhance estimation accuracy by incorporating prior information (Hamaker & Klugkist, Reference Hamaker, Klugkist, Hox and Roberts2011; Lüdtke et al., Reference Lüdtke, Robitzsch, Kenny and Trautwein2013; Muthén & Asparouhov, Reference Muthén and Asparouhov2012; Zitzmann et al., Reference Zitzmann, Lüdtke and Robitzsch2015, Reference Zitzmann, Lüdtke, Robitzsch and Marsh2016). The possibility of adding prior information is a fundamental aspect of Bayesian estimation. It combines information from the data at hand, captured by the likelihood function, with additional information from prior distribution, resulting in inferences based on the posterior distribution (Gelman, Reference Gelman2006). However, specifying priors can pose challenges, particularly in small samples with a low intraclass correlation (ICC), where the choice of prior is crucial (Hox et al., Reference Hox, van de Schoot and Matthijsse2012). Small sample sizes are very common in psychology and related sciences due to limitations in funding and resource constraints (Browne & Draper, Reference Browne and Draper2006). In such cases, between-group estimates may approach zero and become unstable, significantly increasing sensitivity to prior specification. This makes prior misspecification one of the biggest challenges in applying Bayesian approaches to latent variable models (Natarajan & Kass, Reference Natarajan and Kass2000; Zitzmann et al., Reference Zitzmann, Lüdtke and Robitzsch2015). However, this effect of the prior can also be exploited. Recent research by Smid et al. (Reference Smid, McNeish, Miočević and van de Schoot2020) has shed light on the importance of constructing “thoughtful priors” based on previous knowledge to enhance estimation accuracy (see also Zitzmann, Lüdtke, et al., Reference Zitzmann, Lüdtke, Robitzsch and Hecht2021). In the Bayesian approach proposed in this article, the prior parameters are determined through a theoretically derived automated procedure that minimizes the estimated mean squared error (MSE). This removes the need for the user to manually specify a prior, thereby eliminating the risk of user-induced misspecification.
While Smid et al. (Reference Smid, McNeish, Miočević and van de Schoot2020) focused on addressing small-sample bias, it has been argued that evaluating the quality of a method should consider not only bias but also the variability of the estimator, particularly in small samples with low ICCs (Greenland, Reference Greenland2000; Zitzmann, Lüdtke, et al., Reference Zitzmann, Lüdtke, Robitzsch and Hecht2021). In cases of low ICCs, within-group variability dominates, and small sample sizes lead to unstable group-level estimates, resulting in higher variance when estimating between-group slopes. This highlights a crucial point—approaches solely dedicated to minimizing bias may, in fact, perform less optimally than those focused on reducing variability alone. Thus, it is important to consider both bias and variability in optimizing analytical strategies. In this regard, alternative suggestions for specifying priors have aimed at reducing the MSE, which combines both bias and variability (e.g., Zitzmann et al., Reference Zitzmann, Lüdtke and Robitzsch2015, Reference Zitzmann, Lüdtke, Robitzsch and Marsh2016). Note that in cases of small samples and low ICCs, MSE is largely driven by the variability of the estimator. Therefore, minimizing variability remains an important goal when optimizing MSE.
In the same spirit, in this article, we derive a distribution for the Bayesian estimator of between-group slopes, building on the model originally established by Lüdtke et al. (Reference Lüdtke, Marsh, Robitzsch, Trautwein, Asparouhov and Muthén2008). Specifically, we use this distribution to develop an optimally regularized Bayesian estimator that automatically selects priors to minimize MSE, thereby avoiding misspecification caused by user-specified priors. We then report the results from computational simulations conducted across a broad spectrum of conditions to evaluate the estimator. They demonstrate the advantages of this approach compared to ML estimation, particularly in scenarios of small samples and a low ICC.
2 Theoretical derivation
Before delving into detailed aspects, we will briefly summarize Lüdtke et al.’s (Reference Lüdtke, Marsh, Robitzsch, Trautwein, Asparouhov and Muthén2008) model, which we use to exemplify our approach. This model was proposed as one way to provide unbiased estimates of between-group slopes in contextual studies. It proposes predicting the dependent variable Y at the group level by using a latent variable. This latent variable represents a group’s latent mean, offering a more reliable alternative than the traditional manifest mean approach. Known as the “multilevel latent covariate model,” this model allows for the integration of latent group means into the more complex frameworks of multilevel structural equation models, which are prevalent in psychological research and related research (see also Zitzmann, Lohmann et al., Reference Zitzmann, Lohmann, Krammer, Helm, Aydin and Hecht2022).
Zitzmann, Lüdtke, et al. (Reference Zitzmann, Lüdtke, Robitzsch and Hecht2021) have proposed and discussed a Bayesian estimator for the between-group slope in this model (see also Zitzmann & Helm, Reference Zitzmann and Helm2021). Their approach introduced a method for incorporating prior information in estimating between-group slopes. However, this method required manual specification of prior distributions, which could be challenging, particularly in small samples where misspecified priors may lead to biased or unstable estimates. In contrast, our approach extends this work by upgrading their Bayesian estimator to a regularized Bayesian estimator that automatically selects optimal priors, thereby preventing user misspecification and improving estimation stability.
Since our method regularizes the estimator introduced by Zitzmann, Lüdtke, et al. (Reference Zitzmann, Lüdtke, Robitzsch and Hecht2021), we maintain their notation for consistency. More precisely, in the model, it is assumed that the individual-level predictor X is decomposed into two independent, normally distributed components: $X_b$
, representing the latent group mean, and
$X_b$
, representing the latent group mean, and $X_w$
, representing individual deviations from
$X_w$
, representing individual deviations from $X_b$
. Thus, for an individual
$X_b$
. Thus, for an individual $i = 1, \dots n$
within a group
$i = 1, \dots n$
within a group $j = 1,\dots J$
, the decomposition can be stated:
$j = 1,\dots J$
, the decomposition can be stated:
 $$ \begin{align} & X_{ij} = X_{b,j} + X_{w,ij} \end{align} $$
 $$ \begin{align} & X_{b,j} \sim N(\mu_X, \tau_X^2) \end{align} $$
 $$ \begin{align} & X_{w,ij} \sim N(0, \sigma_X^2). \end{align} $$
Note that further, we assume that each of J groups includes n persons, therefore the overall sample size is $nJ$
.
$nJ$
.
Hereafter, we will refer to $\sigma _X^2$
and
$\sigma _X^2$
and $\tau _X^2$
as the within-group and between-group variances of X, respectively. Similarly,
$\tau _X^2$
as the within-group and between-group variances of X, respectively. Similarly, $\sigma _Y^2$
and
$\sigma _Y^2$
and $\tau _Y^2$
are the within-group and between-group variances of Y, respectively.
$\tau _Y^2$
are the within-group and between-group variances of Y, respectively.
The individual-level and group-level regressions read:
 $$ \begin{align} &\text{Level 1: } Y_{ij}= \beta_{0j} + \beta_w X_{w,ij} + \varepsilon_{ij} \end{align} $$
 $$ \begin{align} &\text{Level 2: } \beta_{0j} = \alpha + \beta_b X_{b,j} + \delta_j. \end{align} $$
In Equation (4), $\beta _w$
represents the within-group slope that characterizes the relationship between the predictor and the dependent variable at the individual level, while
$\beta _w$
represents the within-group slope that characterizes the relationship between the predictor and the dependent variable at the individual level, while $\beta _{0j}$
describes the random intercept. Normally distributed residuals are denoted as
$\beta _{0j}$
describes the random intercept. Normally distributed residuals are denoted as $\varepsilon _{ij} \sim N(0,\sigma _\varepsilon ^2)$
.
$\varepsilon _{ij} \sim N(0,\sigma _\varepsilon ^2)$
.
Moreover, we denote between-group slope in Equation (5) as $\beta _b$
and the overall intercept as
$\beta _b$
and the overall intercept as $\alpha $
.
$\alpha $
. ${\delta _j \sim N(0, \tau _\delta ^2)}$
represents normally distributed residuals. See Figure 1 for a visual representation of the model. Note that the between-group component
${\delta _j \sim N(0, \tau _\delta ^2)}$
represents normally distributed residuals. See Figure 1 for a visual representation of the model. Note that the between-group component $Y_b$
in Figure 1 corresponds to the random intercept
$Y_b$
in Figure 1 corresponds to the random intercept $\beta _{0j}$
in Equation (4), whereas the within-group component
$\beta _{0j}$
in Equation (4), whereas the within-group component $Y_w$
in Figure 1 corresponds to
$Y_w$
in Figure 1 corresponds to $(\beta _w X_{w,ij} + \varepsilon _{ij})$
in Equation (4).
$(\beta _w X_{w,ij} + \varepsilon _{ij})$
in Equation (4).
A multilevel structural equation model using the within-between framework that decomposes the variables X and Y into within-group and between-group components.
Note: The within-group components are denoted by subscript w, and the between-group components are denoted by subscript b. The between-group components ( $X_b$
and
$X_b$
and $Y_b$
) are connected through a regression, where
$Y_b$
) are connected through a regression, where $Y_b$
serves as the dependent variable and
$Y_b$
serves as the dependent variable and $X_b$
as the predictor. Similarly, the within-group components (
$X_b$
as the predictor. Similarly, the within-group components ( $X_w$
and
$X_w$
and $Y_w$
) are related to each other in an analogous manner. The notation includes
$Y_w$
) are related to each other in an analogous manner. The notation includes $\beta _b$
for the between-group slope and
$\beta _b$
for the between-group slope and $\beta _w$
for the within-group slope.
$\beta _w$
for the within-group slope.

We focus on the between-group slope $\beta _b$
, which is the most important parameter in numerous multilevel model applications, such as when analyzing contextual effects. For balanced data (where each group has an equal number of individuals), the maximum likelihood (ML) estimator of
$\beta _b$
, which is the most important parameter in numerous multilevel model applications, such as when analyzing contextual effects. For balanced data (where each group has an equal number of individuals), the maximum likelihood (ML) estimator of $\beta _b$
is given by:
$\beta _b$
is given by:
 $$ \begin{align} \hat{\beta}_b = \frac{\hat{\tau}_{YX}}{\hat{\tau}_X^2}. \end{align} $$
In this equation, $\hat {\tau }_X^2$
and
$\hat {\tau }_X^2$
and $\hat {\tau }_{YX}$
are sample estimators of the group-level variance of X and the group-level covariance between X and Y, respectively.
$\hat {\tau }_{YX}$
are sample estimators of the group-level variance of X and the group-level covariance between X and Y, respectively.
While the asymptotic properties of the ML estimator (6) are advantageous, it tends to exhibit bias in finite sample sizes and displays significant variability, leading to a substantial MSE in such scenarios (as demonstrated by, e.g., McNeish (Reference McNeish2016)). This poses a challenge to the practical utility of the ML estimator for rather small samples with low ICCs, as results from individual studies could be notably imprecise. Consequently, researchers have recommended alternative estimators that demonstrate lower variability, leading to increased accuracy and a reduced MSE, although potentially at the cost of some more bias compared to the ML estimator. Notable among these are the estimators proposed by Chung et al. (Reference Chung, Rabe-Hesketh, Dorie, Gelman and Liu2013), Zitzmann et al. (Reference Zitzmann, Lüdtke and Robitzsch2015), and Zitzmann, Lüdtke, et al. (Reference Zitzmann, Lüdtke, Robitzsch and Hecht2021); see also Zitzmann & Helm (Reference Zitzmann and Helm2021). Next, we will develop a regularized version of Zitzmann, Lüdtke, et al.’s Bayesian estimator for the between-group slope, drawing on the so-called indirect strategy approach of constructing the estimator outlined by Zitzmann, Lüdtke, et al. (Reference Zitzmann, Lüdtke, Robitzsch and Hecht2021). The details of this development are provided in Appendix A.
Zitzmann, Lüdtke, et al.’s (Reference Zitzmann, Lüdtke, Robitzsch and Hecht2021) Bayesian estimator starts with the prior gamma distribution and its two parameters, $\nu _0$
and
$\nu _0$
and $\tau _0^2$
(see Appendix A). A specific choice of prior parameters is not required, as our forthcoming Bayesian estimator is designed to find the optimal values to minimize MSE. Combining priors with the ML estimator, Zitzmann, Lüdtke, et al. (Reference Zitzmann, Lüdtke, Robitzsch and Hecht2021) derived the Bayesian estimator as
$\tau _0^2$
(see Appendix A). A specific choice of prior parameters is not required, as our forthcoming Bayesian estimator is designed to find the optimal values to minimize MSE. Combining priors with the ML estimator, Zitzmann, Lüdtke, et al. (Reference Zitzmann, Lüdtke, Robitzsch and Hecht2021) derived the Bayesian estimator as
 $$ \begin{align} \tilde{\beta}_b = \frac{\hat{\tau}_{YX}}{(1 - \omega) \tau_0^2 + \omega \hat{\tau}_X^2}, \end{align} $$
where $\omega $
is the weighting parameter defined as a function of the gamma-distributed priors. The denominator in Equation (7) accounts for both the prior variance
$\omega $
is the weighting parameter defined as a function of the gamma-distributed priors. The denominator in Equation (7) accounts for both the prior variance $\tau _0^2$
and the observed between-group variance
$\tau _0^2$
and the observed between-group variance $\tau _X^2$
, with weights adjusted by
$\tau _X^2$
, with weights adjusted by $\omega $
to control the influence of prior information as J increases.
$\omega $
to control the influence of prior information as J increases.
Practically, $\omega \in [0,1]$
can be interpreted as the relative weight given to the prior versus the data-based estimate:
$\omega \in [0,1]$
can be interpreted as the relative weight given to the prior versus the data-based estimate: $\omega =1$
corresponds to the standard ML estimator (Equation (6)),
$\omega =1$
corresponds to the standard ML estimator (Equation (6)), $\omega =0$
corresponds to full shrinkage toward the prior mean, and intermediate values balance the two sources of information.
$\omega =0$
corresponds to full shrinkage toward the prior mean, and intermediate values balance the two sources of information.
The derivation of the Bayesian estimator (Equation (7)) is described in detail in Appendix A. Note that Equation (7) is essentially a Stein-type estimator (Stein, Reference Stein and Neyman1956).
We specify the weighting parameter (prior) $\omega $
in a manner similar to that of Zitzmann, Lüdtke, et al. (Reference Zitzmann, Lüdtke, Robitzsch and Hecht2021):
$\omega $
in a manner similar to that of Zitzmann, Lüdtke, et al. (Reference Zitzmann, Lüdtke, Robitzsch and Hecht2021):
 $$ \begin{align} \omega = \frac{\frac{J-1}{2}}{\frac{\nu_0}{2} + \frac{J}{2} - 1}. \end{align} $$
So $\omega $
is defined as a function of the gamma-distributed prior
$\omega $
is defined as a function of the gamma-distributed prior $\nu _0$
and the number of groups J. The weighting factor
$\nu _0$
and the number of groups J. The weighting factor $\omega $
is derived such that as
$\omega $
is derived such that as $J\rightarrow \infty $
,
$J\rightarrow \infty $
, $\omega $
approaches 1, ensuring that the Bayesian estimator converges to the ML estimator. Note that the weighting parameter
$\omega $
approaches 1, ensuring that the Bayesian estimator converges to the ML estimator. Note that the weighting parameter $\omega $
in Equation (8) differs from the one introduced by Zitzmann, Helm, and Hecht (Reference Zitzmann, Helm and Hecht2021) because we further optimize it (see Appendix A).Footnote
1
$\omega $
in Equation (8) differs from the one introduced by Zitzmann, Helm, and Hecht (Reference Zitzmann, Helm and Hecht2021) because we further optimize it (see Appendix A).Footnote
1
The Bayesian estimator $\tilde {\beta }_b$
is not yet regularized. To this end, the two parameters
$\tilde {\beta }_b$
is not yet regularized. To this end, the two parameters $\tau _0^2$
and
$\tau _0^2$
and $\omega $
need to be identified. As mentioned,
$\omega $
need to be identified. As mentioned, $\omega $
is defined as a function of sample size and converges to 1 when
$\omega $
is defined as a function of sample size and converges to 1 when $J \rightarrow \infty $
. Therefore, the Bayesian estimator
$J \rightarrow \infty $
. Therefore, the Bayesian estimator $\tilde {\beta }_b$
is asymptotically unbiased and coincides with the ML estimator
$\tilde {\beta }_b$
is asymptotically unbiased and coincides with the ML estimator $\hat {\beta }_b$
in Equation (6) when samples are sufficiently large. In finite samples, however, the Bayesian estimator is biased.
$\hat {\beta }_b$
in Equation (6) when samples are sufficiently large. In finite samples, however, the Bayesian estimator is biased.
To obtain the optimally regularized $\tilde {\beta }_b$
, it is essential to find the values for
$\tilde {\beta }_b$
, it is essential to find the values for $\tau _0^2$
and
$\tau _0^2$
and $\omega $
based on an optimality criterion. The MSE serves as the natural choice for this criterion. It is defined as
$\omega $
based on an optimality criterion. The MSE serves as the natural choice for this criterion. It is defined as
 $$ \begin{align} MSE (\tilde{\beta}_b) = Var(\tilde{\beta}_b) + (E(\tilde{\beta}_b) - \beta_b)^2. \end{align} $$
As can be seen from the equation, this measure is simply the sum of the variance and the squared bias of the estimator. As the ML estimator in Equation (6) is unbiased in theory, its MSE shortens just to the variance of this estimator. The Bayesian estimator as defined in Equation (7) does not share the same unbiasedness property. Rather, it reduces the MSE by reducing its variance at the cost of some bias. We will show how to construct the estimator in such a way that a substantially reduced MSE is achieved compared to the ML estimator $\hat {\beta }_b$
in small samples with low ICCs. In infinite samples, the MSE of
$\hat {\beta }_b$
in small samples with low ICCs. In infinite samples, the MSE of $\hat {\beta }_b$
reaches its global minimum of
$\hat {\beta }_b$
reaches its global minimum of $0$
(as both variance and bias converge to
$0$
(as both variance and bias converge to $0$
), and due to the weighting parameter
$0$
), and due to the weighting parameter $\omega $
, the Bayesian estimator
$\omega $
, the Bayesian estimator $\tilde {\beta }_b$
achieves the same outcome.
$\tilde {\beta }_b$
achieves the same outcome.
To find the optimal values of the parameters $\tau _0^2$
and
$\tau _0^2$
and $\omega $
, it is necessary to express the between-group (co)variance estimators from Equation (7),
$\omega $
, it is necessary to express the between-group (co)variance estimators from Equation (7), $\hat {\tau }_X^2$
and
$\hat {\tau }_X^2$
and $\hat {\tau }_{YX}^2$
, in terms of the normal distributions of the between- and within-group components of the predictor and the dependent variable, namely,
$\hat {\tau }_{YX}^2$
, in terms of the normal distributions of the between- and within-group components of the predictor and the dependent variable, namely, $X_b$
,
$X_b$
, $X_w$
,
$X_w$
, $Y_b$
, and
$Y_b$
, and $Y_w$
(see Appendix B for more details). We derived the expression for
$Y_w$
(see Appendix B for more details). We derived the expression for $\hat {\tau }_X^2$
under the restriction that it should have an easily definable distribution. For the derivation, see Appendix B. This resulted in
$\hat {\tau }_X^2$
under the restriction that it should have an easily definable distribution. For the derivation, see Appendix B. This resulted in
 $$ \begin{align} \hat{\tau}_X^2 = H_X' S_X V_X' A V_X S_X H_X, \end{align} $$
where $H_X \sim N(0,\mathbf {I}_{nJ+J+1})$
. The coefficient matrix A is defined in Equation (F.1) of Appendix F. Additionally, matrices
$H_X \sim N(0,\mathbf {I}_{nJ+J+1})$
. The coefficient matrix A is defined in Equation (F.1) of Appendix F. Additionally, matrices $V_X$
and
$V_X$
and $S_X$
are the matrices of eigenvectors and eigenvalues, respectively. They are defined in Equation (B.30) of Appendix B. The internal part of Equation (10),
$S_X$
are the matrices of eigenvectors and eigenvalues, respectively. They are defined in Equation (B.30) of Appendix B. The internal part of Equation (10), $S_X V_X' A V_X S_X$
, is a diagonal coefficient matrix. This means that in Equation (10), we express
$S_X V_X' A V_X S_X$
, is a diagonal coefficient matrix. This means that in Equation (10), we express $\tau _X^2$
as a weighted sum of squares of independent normally distributed random variables, that is, a weighted sum of
$\tau _X^2$
as a weighted sum of squares of independent normally distributed random variables, that is, a weighted sum of $\chi ^2_1$
-distributed random variables, which are transformed from
$\chi ^2_1$
-distributed random variables, which are transformed from $X_b$
,
$X_b$
, $X_w$
,
$X_w$
, $Y_b$
, and
$Y_b$
, and $Y_w$
.
$Y_w$
.
To express $\hat {\tau }_{YX}$
, we use a similar transformation as for
$\hat {\tau }_{YX}$
, we use a similar transformation as for $\hat {\tau }_{X}^2$
. This transformation is described in detail in Appendix C. The result is
$\hat {\tau }_{X}^2$
. This transformation is described in detail in Appendix C. The result is
 $$ \begin{align} \hat{\tau}_{YX} = H_2' S_H V_H' Q V_H S_H H_2, \end{align} $$
where $H_2 \sim N (0, \mathbf {I}_{2(nJ+J+1)})$
is a multivariate standard normally distributed random vector. Coefficient matrix Q is computed in Equation (C.15) of Appendix C. Matrices
$H_2 \sim N (0, \mathbf {I}_{2(nJ+J+1)})$
is a multivariate standard normally distributed random vector. Coefficient matrix Q is computed in Equation (C.15) of Appendix C. Matrices $V_H$
and
$V_H$
and $S_H$
are the matrices of eigenvectors and eigenvalues, respectively. They are defined in Equation (C.12) of Appendix C. Furthermore, the internal part of Equation (11),
$S_H$
are the matrices of eigenvectors and eigenvalues, respectively. They are defined in Equation (C.12) of Appendix C. Furthermore, the internal part of Equation (11), $S_H V_H' Q V_H S_H$
, is a diagonal coefficient matrix. With Equation (11), the estimator of the group-level covariance
$S_H V_H' Q V_H S_H$
, is a diagonal coefficient matrix. With Equation (11), the estimator of the group-level covariance $\hat {\tau }_{YX}$
is represented as a weighted sum of squares of independent normally distributed random variables, that is, a weighted sum of
$\hat {\tau }_{YX}$
is represented as a weighted sum of squares of independent normally distributed random variables, that is, a weighted sum of $\chi ^2_1$
-distributed random variables.
$\chi ^2_1$
-distributed random variables.
As a consequence, we express each of the estimators of group-level (co)variances $\hat {\tau }_X^2$
and
$\hat {\tau }_X^2$
and $\hat {\tau }_{YX}$
as a sum of squares of independent and identically distributed normal random variables in Equations (10) and (11), respectively. Every term of these sums is
$\hat {\tau }_{YX}$
as a sum of squares of independent and identically distributed normal random variables in Equations (10) and (11), respectively. Every term of these sums is $\chi ^2_1$
-distributed, thus following the Gamma
$\chi ^2_1$
-distributed, thus following the Gamma $\left (\frac {1}{2}, 2 \right )$
distribution. Notice that a gamma distribution can be scaled: if a variable
$\left (\frac {1}{2}, 2 \right )$
distribution. Notice that a gamma distribution can be scaled: if a variable $\psi $
follows the Gamma
$\psi $
follows the Gamma $(k,\theta )$
distribution, then
$(k,\theta )$
distribution, then $c\star\psi $
is Gamma
$c\star\psi $
is Gamma $(k,c\star\theta )$
-distributed. Therefore, we can represent the estimators of group covariances,
$(k,c\star\theta )$
-distributed. Therefore, we can represent the estimators of group covariances, $\hat {\tau }_X^2$
and
$\hat {\tau }_X^2$
and $\hat {\tau }_{YX}$
, as gamma-distributed random variables:
$\hat {\tau }_{YX}$
, as gamma-distributed random variables:
 $$ \begin{align} \hat{\tau}_X^2 & \sim \text{Gamma} (k_{sum1}, \theta_{sum1}) \nonumber\\k_{sum1} & = \frac{ \left(\sum_{i}\theta_{X,i} \right)^2 }{2 \sum_{i} \theta_{X,i}^2}, \theta_{sum1} = \frac{\sum_{i} \theta_{X,i}^2}{ \sum_{i} \theta_{X,i} } \end{align} $$
 $$ \begin{align} \hat{\tau}_{YX} & \sim \text{Gamma} (k_{sum2}, \theta_{sum2}) \nonumber\\k_{sum2} &= \frac{ \left(\sum_{i}\theta_{YX,i} \right)^2 }{2 \sum_{i} \theta_{YX,i}^2}, \theta_{sum2} = \frac{\sum_{i} \theta_{YX,i}^2}{ \sum_{i} \theta_{YX,i} }. \end{align} $$
The scales $\theta _{X,i}$
and
$\theta _{X,i}$
and $\theta _{YX,i}$
are the elements of the diagonal matrices
$\theta _{YX,i}$
are the elements of the diagonal matrices $S_X V_X' A V_X S_X$
(for
$S_X V_X' A V_X S_X$
(for $\hat {\tau }_X^2$
) and
$\hat {\tau }_X^2$
) and $S_H V_H' Q V_H S_H$
(for
$S_H V_H' Q V_H S_H$
(for $\hat {\tau }_{YX}$
) in Equations (10) and (11).
$\hat {\tau }_{YX}$
) in Equations (10) and (11).
In the next step, we make use of the distributions of the sample covariances $\hat {\tau }_X^2$
and
$\hat {\tau }_X^2$
and $\hat {\tau }_{YX}$
to calculate the distributions of the ML estimator
$\hat {\tau }_{YX}$
to calculate the distributions of the ML estimator $\tilde {\beta }_b$
and the Bayesian estimator
$\tilde {\beta }_b$
and the Bayesian estimator $\hat {\beta }_b$
. The estimators
$\hat {\beta }_b$
. The estimators $\tilde {\beta }_b$
and
$\tilde {\beta }_b$
and $\hat {\beta }_b$
are defined using an F distribution, because ratios of gamma-distributed random variables follow F distributions. The full procedures of deriving the distributions of
$\hat {\beta }_b$
are defined using an F distribution, because ratios of gamma-distributed random variables follow F distributions. The full procedures of deriving the distributions of $\hat {\beta }_b$
and
$\hat {\beta }_b$
and $\tilde {\beta }_b$
are presented in Appendix D. The results of these derivations are the following distributions:
$\tilde {\beta }_b$
are presented in Appendix D. The results of these derivations are the following distributions:
 $$ \begin{align} \frac{k_{sum1} \theta_{sum1}} { k_{sum2} \theta_{sum2} } \hat{\beta}_b \sim & F(2 k_{sum2},2 k_{sum1} ) \end{align} $$
 $$ \begin{align} \kern-12pt \frac{k_B(\omega,\tau_0^2) \theta_B(\omega,\tau_0^2)} { k_{sum2} \theta_{sum2} } \tilde{\beta}_b \sim & F(2 k_{sum2},2 k_B(\omega,\tau_0^2) ), \end{align} $$
where the coefficients $k_{sum1}$
,
$k_{sum1}$
, $\theta _{sum1}$
,
$\theta _{sum1}$
, $k_{sum2}$
,
$k_{sum2}$
, $\theta _{sum2}$
,
$\theta _{sum2}$
, $k_B$
, and
$k_B$
, and $\theta _B$
are defined and fully described in Equations (D.3), (D.4), (D.9), and (D.10) of Appendix D. Note that
$\theta _B$
are defined and fully described in Equations (D.3), (D.4), (D.9), and (D.10) of Appendix D. Note that $k_B$
and
$k_B$
and $\theta _B$
are functions of the prior parameters
$\theta _B$
are functions of the prior parameters $\omega $
and
$\omega $
and $\tau _0^2$
. Using these distributions, we compute the variances and expected values of both estimators and combine them into the final formulas for their MSEs:
$\tau _0^2$
. Using these distributions, we compute the variances and expected values of both estimators and combine them into the final formulas for their MSEs:
 $$ \begin{align} MSE(\hat{\beta}_b) = \frac{k_{sum2} \theta_{sum2}^2 (k_{sum1} + k_{sum2} - 1)} { \theta_{sum1}^2 (k_{sum1} - 1)^2 (k_{sum1}-2) } + \left( \frac{ k_{sum2} \theta_{sum2} }{ (k_{sum1} - 1) \theta_{sum1} } - \beta_b \right)^2 \end{align} $$
 $$ \begin{align} \begin{aligned} MSE(\tilde{\beta}_b) = \frac{k_{sum2} \theta_{sum2}^2 (k_B(\omega,\tau_0^2) + k_{sum2} - 1)} { \theta_B^2(\omega,\tau_0^2) (k_B(\omega,\tau_0^2) - 1)^2 (k_B(\omega,\tau_0^2)-2) } & + \left( \frac{ k_{sum2} \theta_{sum2} }{ (k_B(\omega,\tau_0^2) - 1) \theta_B(\omega,\tau_0^2) } - \beta_b \right)^2. \end{aligned} \end{align} $$
As a byproduct, we obtain their standard errors from the estimators’ distributions as
 $$ \begin{align} SE\left({\hat{\beta}}_b\right)&= \frac{\theta_{sum2}}{\theta_{sum1}\left(k_{sum1}-1\right)}\ \sqrt{\frac{k_{sum2}\left(k_{sum1}+k_{sum2}-1\right)}{k_{sum1}-2}} \end{align} $$
 $$ \begin{align} SE\left({\widetilde{\beta}}_b\right)&= \frac{\theta_{sum2}}{\theta_B(\omega,\tau_0^2)\left(k_B(\omega,\tau_0^2)-1\right)}\ \sqrt{\frac{k_{sum2}\left(k_B(\omega,\tau_0^2)+k_{sum2}-1\right)}{k_B(\omega,\tau_0^2)-2}}. \end{align} $$
Using these standard errors, one can describe the uncertainty associated with the estimation or use them for statistical testing. However, when samples are rather small, we recommend to use resampling procedures for obtaining standard errors, such as the delete-d jackknife (Shao & Wu, Reference Shao and Wu1989; for applications in multilevel modeling, see Zitzmann, Reference Zitzmann2018; Zitzmann et al., Reference Zitzmann, Lohmann, Krammer, Helm, Aydin and Hecht2022; Zitzmann et al., Reference Zitzmann, Weirich and Hecht2023, Reference Zitzmann, Nagengast, Hübner and Hecht2024).
Having obtained the MSE of $\tilde {\beta }_b$
(Equation (17)), we can minimize it with respect to the parameters
$\tilde {\beta }_b$
(Equation (17)), we can minimize it with respect to the parameters $\omega $
and
$\omega $
and $\tau _0^2$
in order to obtain our regularized Bayesian estimator. To find the optimal choices for the prior parameters, we employ a numerical approach, which is algorithmic in nature, making it well-suited for implementation in software platforms like R or MATLAB. The algorithm is a grid search over the parameters, with
$\tau _0^2$
in order to obtain our regularized Bayesian estimator. To find the optimal choices for the prior parameters, we employ a numerical approach, which is algorithmic in nature, making it well-suited for implementation in software platforms like R or MATLAB. The algorithm is a grid search over the parameters, with $0 \leq \omega \leq 1$
and
$0 \leq \omega \leq 1$
and $0>\tau _0^2>d\star\hat {\tau }_X^2$
. Since it is impossible to find the global minimum in the general case (Lakshmanan, Reference Lakshmanan2019), the algorithm we implement performs only a local optimum search. We propose to choose parameter d to be at least five times the standard deviation of the estimated group-level variance of X, that is,
$0>\tau _0^2>d\star\hat {\tau }_X^2$
. Since it is impossible to find the global minimum in the general case (Lakshmanan, Reference Lakshmanan2019), the algorithm we implement performs only a local optimum search. We propose to choose parameter d to be at least five times the standard deviation of the estimated group-level variance of X, that is, $5 \star \sqrt {Var(\hat {\tau }_X^2)}$
. The value of
$5 \star \sqrt {Var(\hat {\tau }_X^2)}$
. The value of $Var(\hat {\tau }_X^2)$
may be obtained from the derived distribution of
$Var(\hat {\tau }_X^2)$
may be obtained from the derived distribution of $\hat {\tau }_X^2$
in Equation (D.3) of Appendix D, or even more exactly, by using the procedures of Mathai (Reference Mathai1993) or Fateev et al. (Reference Fateev, Shaidurov, Garin, Dmitriev and Tyapkin2016). This 5-sigma region guarantees that the minimum estimated MSE falls inside this region with high probability. The probability of the minimum estimated MSE being within this interval is at least
$\hat {\tau }_X^2$
in Equation (D.3) of Appendix D, or even more exactly, by using the procedures of Mathai (Reference Mathai1993) or Fateev et al. (Reference Fateev, Shaidurov, Garin, Dmitriev and Tyapkin2016). This 5-sigma region guarantees that the minimum estimated MSE falls inside this region with high probability. The probability of the minimum estimated MSE being within this interval is at least $0.9857$
for
$0.9857$
for $J=3$
,
$J=3$
, $0.9996$
for
$0.9996$
for $J=5$
, and
$J=5$
, and $>0.99998$
for
$>0.99998$
for $J\geq 7$
. In this case, our grid search will find the inner solution for the optimal values of
$J\geq 7$
. In this case, our grid search will find the inner solution for the optimal values of $\omega $
and
$\omega $
and $\tau _0^2$
that minimize the estimated MSE. Note that the grid search algorithm minimizes the estimated MSE but not the unknown true MSE.
$\tau _0^2$
that minimize the estimated MSE. Note that the grid search algorithm minimizes the estimated MSE but not the unknown true MSE.
It is important to note that the MSE in Equations (16) and (17) incorporates the unknown between-group coefficient $\beta _b$
. We propose using its ML estimate,
$\beta _b$
. We propose using its ML estimate, $\hat {\beta }_b$
, as a substitute, thereby giving our technique an empirical Bayes flavor. Such uses of “plug-in estimates” are not uncommon in statistics and often very useful (Liang & Tsou, Reference Liang and Tsou1992; see also Zitzmann et al., Reference Zitzmann, Nagengast, Hübner and Hecht2024).
$\hat {\beta }_b$
, as a substitute, thereby giving our technique an empirical Bayes flavor. Such uses of “plug-in estimates” are not uncommon in statistics and often very useful (Liang & Tsou, Reference Liang and Tsou1992; see also Zitzmann et al., Reference Zitzmann, Nagengast, Hübner and Hecht2024).
We have demonstrated an approach for minimizing the MSE of the between-group parameter, leading to what we refer to as the optimally regularized Bayesian estimator $\tilde {\beta }_b$
for this parameter. Notice that our estimator uses the ML estimator
$\tilde {\beta }_b$
for this parameter. Notice that our estimator uses the ML estimator $\hat {\beta }_b$
during MSE optimization and even includes ML as a special case when
$\hat {\beta }_b$
during MSE optimization and even includes ML as a special case when $\omega =1$
. This means, in small samples, we can do better than the ML estimator in terms of MSE. However, when working with large sample sizes, the costs due to using approximate distributions and the plug-in procedure to compute the regularized Bayesian estimator may be larger than the benefits. Such a scenario is likely to occur with larger group sample sizes combined with high levels of the ICC of the predictor. In the next section, we demonstrate some of these properties using simulated data.
$\omega =1$
. This means, in small samples, we can do better than the ML estimator in terms of MSE. However, when working with large sample sizes, the costs due to using approximate distributions and the plug-in procedure to compute the regularized Bayesian estimator may be larger than the benefits. Such a scenario is likely to occur with larger group sample sizes combined with high levels of the ICC of the predictor. In the next section, we demonstrate some of these properties using simulated data.
3 Simulation studies
We begin with the description of the data-generating mechanism, including its parameters, such as group size n, number of groups J, ICC coefficient ICC $_X$
, and the coefficients
$_X$
, and the coefficients $\beta _b$
and
$\beta _b$
and $\beta _w$
. We utilized the generated data to compute estimates using both the proposed optimally regularized Bayesian estimator and, for benchmarking purposes, also the ML estimator. The full algorithm used to actually yield
$\beta _w$
. We utilized the generated data to compute estimates using both the proposed optimally regularized Bayesian estimator and, for benchmarking purposes, also the ML estimator. The full algorithm used to actually yield $\tilde {\beta }_b$
is detailed in Appendix E. Finally, we present the results graphically. Detailed results can be found in Appendix G, which allows for a more comprehensive evaluation of the estimation accuracy under varying input parameters.
$\tilde {\beta }_b$
is detailed in Appendix E. Finally, we present the results graphically. Detailed results can be found in Appendix G, which allows for a more comprehensive evaluation of the estimation accuracy under varying input parameters.
3.1 Data generation
Next, we detail the data generation process and outline the specifics of our simulation setup. We base our simulations on the data-generating process used by Zitzmann, Helm, and Hecht (Reference Zitzmann, Helm and Hecht2021) and Zitzmann, Lüdtke, et al. (Reference Zitzmann, Lüdtke, Robitzsch and Hecht2021). Specifically, we conducted simulations for each unique combination of the following parameters:
-
• ICC $_X$
: Intraclass Correlation (0.05, 0.1, 0.3, 0.5).
$_X$
: Intraclass Correlation (0.05, 0.1, 0.3, 0.5). -
• J: Number of groups (5, 10, 20, 30, 40).
-
• n: Number of individuals per group (5, 15, 30).
-
•
$\beta _b$
: Between-group parameter (0.2, 0.5, 0.6). -
•
$\beta _w$
: Within-group parameter (0.2, 0.5, 0.7).


In total, this resulted in $4\times 5\times 3\times 3\times 3 = 540$
scenarios, each of which was replicated 5,000 times. The relatively small number of groups was chosen to reflect reasonable two-level scenarios in the social sciences (i.e., typically
$4\times 5\times 3\times 3\times 3 = 540$
scenarios, each of which was replicated 5,000 times. The relatively small number of groups was chosen to reflect reasonable two-level scenarios in the social sciences (i.e., typically $<30$
students per class,
$<30$
students per class, $<30$
schools per district), and to align with examples from Gelman & Hill (Reference Gelman and Hill2006).
$<30$
schools per district), and to align with examples from Gelman & Hill (Reference Gelman and Hill2006).
The values of $\beta _b$
and
$\beta _b$
and $\beta _w$
follow ranges used in prior simulation studies on the multilevel latent covariate framework and related models. For example, Lüdtke et al. (Reference Lüdtke, Marsh, Robitzsch, Trautwein, Asparouhov and Muthén2008) used values
$\beta _w$
follow ranges used in prior simulation studies on the multilevel latent covariate framework and related models. For example, Lüdtke et al. (Reference Lüdtke, Marsh, Robitzsch, Trautwein, Asparouhov and Muthén2008) used values $\{0.2, 0.7\}$
, Grilli & Rampichini (Reference Grilli, Rampichini, Kenett and Salini2011) considered values including
$\{0.2, 0.7\}$
, Grilli & Rampichini (Reference Grilli, Rampichini, Kenett and Salini2011) considered values including $\{0.25, 0.5, 0.75, 1, 1.5\}$
, and Zitzmann & Helm (Reference Zitzmann and Helm2021) used the value of
$\{0.25, 0.5, 0.75, 1, 1.5\}$
, and Zitzmann & Helm (Reference Zitzmann and Helm2021) used the value of $0.7$
. The combination
$0.7$
. The combination $\beta _b = \beta _w = 0.7$
is infeasible under our fixed ICC
$\beta _b = \beta _w = 0.7$
is infeasible under our fixed ICC $_Y = 0.2$
design, so
$_Y = 0.2$
design, so $\beta _b$
was reduced to
$\beta _b$
was reduced to $0.6$
in that case. Similarly, near-zero
$0.6$
in that case. Similarly, near-zero $\beta _b$
values were not included because for ICC
$\beta _b$
values were not included because for ICC $_Y$
= 0.2, they would violate ICC constraints:
$_Y$
= 0.2, they would violate ICC constraints:
 $$ \begin{align} \frac{ICC_Y}{\beta_b^2}> ICC_X > 1 - \frac{1 - ICC_Y}{\beta_w^2}. \end{align} $$
The ICC of the dependent variable, denoted as ICC $_Y$
, was preset to 0.2 within the code to study scenarios with ICC values that lie at the center of the typical ICC range observed in empirical studies (Gulliford et al., Reference Gulliford, Ukoumunne and Chinn1999). Additionally, we incorporated another validity check in order to identify and exclude incorrectly specified inputs, such as non-integer values for J or n.
$_Y$
, was preset to 0.2 within the code to study scenarios with ICC values that lie at the center of the typical ICC range observed in empirical studies (Gulliford et al., Reference Gulliford, Ukoumunne and Chinn1999). Additionally, we incorporated another validity check in order to identify and exclude incorrectly specified inputs, such as non-integer values for J or n.
3.2 Evaluation criteria
The goal of our simulations was to assess how well the regularized Bayesian estimator can estimate the true parameter value $\beta _b$
across various scenarios. To this end, we assessed its performance in terms of the MSE and bias. Note that in addition to the presented estimator, a variant thereof was studied. Both variants were compared against the ML estimator.
$\beta _b$
across various scenarios. To this end, we assessed its performance in terms of the MSE and bias. Note that in addition to the presented estimator, a variant thereof was studied. Both variants were compared against the ML estimator.
We consider the following variants of the regularized Bayesian estimator: our proposed Bayesian estimator with the MSE optimization based on plugged-in ML-estimate $\hat {\beta }_b$
; Bayesian estimator with MSE optimization based on the true value of
$\hat {\beta }_b$
; Bayesian estimator with MSE optimization based on the true value of $\beta _b$
.
$\beta _b$
.
It is important to note that only the variant-1 Bayesian estimator (with MSE optimization based on the ML estimate $\hat {\beta }_b$
) and the ML estimator are practically applicable to real data. In contrast, the second Bayesian estimator (with MSE optimization based on the true
$\hat {\beta }_b$
) and the ML estimator are practically applicable to real data. In contrast, the second Bayesian estimator (with MSE optimization based on the true $\beta _b$
) serves only as a theoretical benchmark.
$\beta _b$
) serves only as a theoretical benchmark.
Further, as evaluation measures, we use the square root of the MSE, denoted as RMSE, and the relative bias. First, MSE is computed as the mean of the squared differences between the estimated parameter and the true between-group parameter, $\beta _b$
. Second, the square root is taken to obtain RMSE from MSE. RMSE then allows for comparisons similar to those made with MSEFootnote
2
while presenting the error in the original units of measurement. Our preference for RMSE over MSE stems from its scalability and straightforward interpretability. These attributes enhance the visualization of our analysis, facilitating clearer insights into the estimators’ performance. The RMSE describes the overall accuracy of parameter estimation, indicating the proximity of estimated values to the true parameter values. Relative bias, in contrast, assesses the average deviation of the estimated parameters from the true value. It is computed as the ratio of the mean difference between the estimated parameter and the true between-group parameter to the true between-group parameter,
$\beta _b$
. Second, the square root is taken to obtain RMSE from MSE. RMSE then allows for comparisons similar to those made with MSEFootnote
2
while presenting the error in the original units of measurement. Our preference for RMSE over MSE stems from its scalability and straightforward interpretability. These attributes enhance the visualization of our analysis, facilitating clearer insights into the estimators’ performance. The RMSE describes the overall accuracy of parameter estimation, indicating the proximity of estimated values to the true parameter values. Relative bias, in contrast, assesses the average deviation of the estimated parameters from the true value. It is computed as the ratio of the mean difference between the estimated parameter and the true between-group parameter to the true between-group parameter, $\beta _b$
. The mean difference is calculated over repeated replications of each scenario in our simulation study. A small relative bias indicates that the estimator produces results that, on average, are closer to the true parameter value, while a larger relative bias suggests systematic overestimation or underestimation.
$\beta _b$
. The mean difference is calculated over repeated replications of each scenario in our simulation study. A small relative bias indicates that the estimator produces results that, on average, are closer to the true parameter value, while a larger relative bias suggests systematic overestimation or underestimation.
3.3 Simulation results
Here, we report the results of our simulation study, focusing on the characteristics of the simulated data, their alignment with theoretical expectations, and the comparisons between our proposed estimator, the variant thereof, and the ML estimator. To facilitate a better understanding, we present visual analyses in Figures 2–4, which illustrate the differential behaviors of the estimators as a function of the group-level sample size and the ICC. For a better differentiation between methods, we chose to show the logged RMSE in Figures 2 and 3. Note that log is a monotone increasing function for RMSE $>0$
.
$>0$
.
Log of root MSE (RMSE) in estimating the between-group slope $\beta _b$
for the ML and the two Bayesian estimators as a function of the sample size at the group level (J) and the ICC of the predictor ICC
$\beta _b$
for the ML and the two Bayesian estimators as a function of the sample size at the group level (J) and the ICC of the predictor ICC $_X$
.
$_X$
.
Note: The scale of the y-axis differs between the four subplots. Results are shown for $n = 15$
people per group, and constant within-group and between-group slopes of
$n = 15$
people per group, and constant within-group and between-group slopes of $\beta _w = 0.5$
and
$\beta _w = 0.5$
and $\beta _b = 0.2$
, respectively.
$\beta _b = 0.2$
, respectively.

Log of root MSE (RMSE) in estimating the between-group slope $\beta _b$
for the two Bayesian estimators as a function of the sample size at the group level (J) and the ICC of the predictor ICC
$\beta _b$
for the two Bayesian estimators as a function of the sample size at the group level (J) and the ICC of the predictor ICC $_X$
.
$_X$
.
Note: The scale of the y-axis differs between the four subplots. Results are shown for $n = 15$
people per group, and constant within-group and between-group slopes of
$n = 15$
people per group, and constant within-group and between-group slopes of $\beta _w = 0.5$
and
$\beta _w = 0.5$
and $\beta _b = 0.2$
, respectively.
$\beta _b = 0.2$
, respectively.

Relative bias in estimating the between-group slope $\beta _b$
for the ML and the two Bayesian estimators as a function of the sample size at the group level (J) and the ICC of the predictor ICC
$\beta _b$
for the ML and the two Bayesian estimators as a function of the sample size at the group level (J) and the ICC of the predictor ICC $_X$
.
$_X$
.
Note: The scale of the y-axis differs between the four subplots. Results are shown for $n = 15$
people per group, and constant within- and between-group slopes of
$n = 15$
people per group, and constant within- and between-group slopes of $\beta _w = 0.5$
and
$\beta _w = 0.5$
and $\beta _b = 0.2$
, respectively.
$\beta _b = 0.2$
, respectively.

For more details about the RMSE and relative bias across 540 unique scenarios, see Tables 2–9 (see Appendix G).
Figure 2 provides a visual representation of the log of the RMSE patterns for the three estimators of the slope. The first line (blue dashed line) in Figure 2 is from the second alternative variant of the Bayesian estimator; that is, the Bayesian estimator based on the true value of $\beta _b$
and thus the direct implementation of Equation (17). As mentioned, this estimator cannot be used on the real data, as the
$\beta _b$
and thus the direct implementation of Equation (17). As mentioned, this estimator cannot be used on the real data, as the $\beta _b$
is unknown, but it works as a benchmark for comparison with our proposed Bayesian estimator. This latter estimator (red solid line) is the Bayesian estimator with the plug-in ML estimate
$\beta _b$
is unknown, but it works as a benchmark for comparison with our proposed Bayesian estimator. This latter estimator (red solid line) is the Bayesian estimator with the plug-in ML estimate $\hat {\beta }_b$
in place of
$\hat {\beta }_b$
in place of $\beta _b$
. The third estimator (black dash-dot line) is the ML estimator. Recall that among the three estimators, only the second and third are applicable to the real data.
$\beta _b$
. The third estimator (black dash-dot line) is the ML estimator. Recall that among the three estimators, only the second and third are applicable to the real data.
Our theoretical expectations align with the observed trends, as both Bayesian estimators exhibit lower RMSE compared to the ML estimator. This RMSE reduction is more pronounced for smaller group sizes (J), with the effect amplified by lower intraclass correlations (ICC $_X$
). Additionally, RMSE consistently decreases with increasing J for all methods and ICC levels. However, an exception is observed for the ML estimator in the upper left plot of Figure 2, where RMSE does not follow this expected trend. At low ICC
$_X$
). Additionally, RMSE consistently decreases with increasing J for all methods and ICC levels. However, an exception is observed for the ML estimator in the upper left plot of Figure 2, where RMSE does not follow this expected trend. At low ICC $_X$
and small J, between-group variance
$_X$
and small J, between-group variance $\hat {\tau }_X^2$
is often estimated near zero, causing the ML estimator (Equation (6)) to inflate and produce occasional extreme values. This yields a finite-sample distribution that mixes regular estimates with such extremes. Because RMSE is highly sensitive to these rare events, the population RMSE can display non-monotonic patterns across adjacent J values even with very large numbers of replications. In contrast, the regularized Bayesian estimators replace
$\hat {\tau }_X^2$
is often estimated near zero, causing the ML estimator (Equation (6)) to inflate and produce occasional extreme values. This yields a finite-sample distribution that mixes regular estimates with such extremes. Because RMSE is highly sensitive to these rare events, the population RMSE can display non-monotonic patterns across adjacent J values even with very large numbers of replications. In contrast, the regularized Bayesian estimators replace $\hat {\tau }_X^2$
with
$\hat {\tau }_X^2$
with $(1-\omega )\tau _0^2 + \omega \hat {\tau }_X^2$
in the denominator, bounding it away from zero and producing smooth, strictly decreasing RMSE curves. Despite this, the overall comparison remains valid, as ML consistently underperforms the regularized Bayesian estimators across all analyzed scenarios in Figure 2.
$(1-\omega )\tau _0^2 + \omega \hat {\tau }_X^2$
in the denominator, bounding it away from zero and producing smooth, strictly decreasing RMSE curves. Despite this, the overall comparison remains valid, as ML consistently underperforms the regularized Bayesian estimators across all analyzed scenarios in Figure 2.
Figure 3 further adds to the understanding of the performance differences. This figure demonstrates that the differences in RMSE between Bayesian estimators based on inserting the true versus estimated values of $\beta _b$
are only negligible, speaking for the usefulness of the Bayesian estimator with the plugged-in ML estimate of
$\beta _b$
are only negligible, speaking for the usefulness of the Bayesian estimator with the plugged-in ML estimate of $\beta _b$
.
$\beta _b$
.
Figure 4 shows the behavior of the estimators with respect to the relative bias. The first thing to mention is that both variants of the Bayesian estimator (blue dashed and red solid lines) do not converge to a bias of zero with an increasing, but finite number of groups J, while the ML estimator does (black dash-dot line). This bias is not due to misspecified priors but is the intended result of MSE-optimal shrinkage in the Bayesian estimator (Equation (7)), where bias is deliberately traded for reduced variability. However, as $J \to \infty $
and
$J \to \infty $
and $\omega \to 1$
, the regularized Bayesian estimator converges to ML, and the bias disappears. Secondly, with an increasing intraclass correlation ICC
$\omega \to 1$
, the regularized Bayesian estimator converges to ML, and the bias disappears. Secondly, with an increasing intraclass correlation ICC $_X$
, the relative bias of all three estimators decreases (plots 1–4 of Figure 4). Thirdly, despite being asymptotically unbiased, the ML estimator exhibits small-sample bias, especially for small ICC values (see upper left plot in Figure 4). This bias is inherent to ML estimation and results from denominator instabilities when
$_X$
, the relative bias of all three estimators decreases (plots 1–4 of Figure 4). Thirdly, despite being asymptotically unbiased, the ML estimator exhibits small-sample bias, especially for small ICC values (see upper left plot in Figure 4). This bias is inherent to ML estimation and results from denominator instabilities when $\hat {\tau }_X^2$
(Equation (6)) is estimated near zero under low ICC, which can lead to sporadic extreme values and a heavy-tailed error distribution. This effect occurs only with the ML estimator, whereas the regularized Bayesian approaches remain stable across all scenarios because the denominator uses the weighted sum
$\hat {\tau }_X^2$
(Equation (6)) is estimated near zero under low ICC, which can lead to sporadic extreme values and a heavy-tailed error distribution. This effect occurs only with the ML estimator, whereas the regularized Bayesian approaches remain stable across all scenarios because the denominator uses the weighted sum $(1-\omega )\tau _0^2 + \omega \hat {\tau }_X^2$
(Equation (7)).
$(1-\omega )\tau _0^2 + \omega \hat {\tau }_X^2$
(Equation (7)).
Table 1 presents RMSE and relative bias values computed across all 540 scenarios and averaged within each combination of group size n and number of groups J. It consolidates information from Tables 2–9 in Appendix G. Specifically, Table 1 compares three estimators: maximum likelihood (ML), regularized Bayesian with $\beta _b$
, and regularized Bayesian with
$\beta _b$
, and regularized Bayesian with $\hat {\beta }_b$
. Highlighted cells identify the estimator with the smallest RMSE (and therefore the smallest MSE) and the smallest relative bias. Results clearly illustrate that, across all examined cases, the regularized Bayesian estimators consistently provide lower RMSE values compared to the ML approach. However, as both group size and the number of groups increase, the relative bias of the ML estimator approaches zero, as it is a consistent estimator. At the same time, the relative bias of the regularized Bayesian estimators remains around
$\hat {\beta }_b$
. Highlighted cells identify the estimator with the smallest RMSE (and therefore the smallest MSE) and the smallest relative bias. Results clearly illustrate that, across all examined cases, the regularized Bayesian estimators consistently provide lower RMSE values compared to the ML approach. However, as both group size and the number of groups increase, the relative bias of the ML estimator approaches zero, as it is a consistent estimator. At the same time, the relative bias of the regularized Bayesian estimators remains around $60\%$
. Consequently, for larger n, the ML estimator often has the smallest highlighted relative bias. Nevertheless, even when the ML estimator exhibits less bias than both regularized Bayesian estimators, the regularized Bayesian estimators achieve a substantial reduction in MSE and RMSE values, especially when n and J are small. Thus, Table 1 emphasizes that, according to our simulation studies, regularized Bayesian estimation—where only the regularized Bayesian estimator with
$60\%$
. Consequently, for larger n, the ML estimator often has the smallest highlighted relative bias. Nevertheless, even when the ML estimator exhibits less bias than both regularized Bayesian estimators, the regularized Bayesian estimators achieve a substantial reduction in MSE and RMSE values, especially when n and J are small. Thus, Table 1 emphasizes that, according to our simulation studies, regularized Bayesian estimation—where only the regularized Bayesian estimator with $\hat {\beta }_b$
is applicable in the real world—may deliver more biased estimations, compared to ML, but is highly preferable in terms of MSE, especially in scenarios with small n and J.
$\hat {\beta }_b$
is applicable in the real world—may deliver more biased estimations, compared to ML, but is highly preferable in terms of MSE, especially in scenarios with small n and J.
Average RMSE and relative bias values of the ML (RMSE $_{\text {ML}}$
and Bias
$_{\text {ML}}$
and Bias $_{\text {ML}}$
, respectively), the Bayesian estimator with
$_{\text {ML}}$
, respectively), the Bayesian estimator with $\beta _b$
(RMSE
$\beta _b$
(RMSE $_{\text {Bay}}$
and Bias
$_{\text {Bay}}$
and Bias $_{\text {Bay}}$
, respectively), and the Bayesian estimator with
$_{\text {Bay}}$
, respectively), and the Bayesian estimator with $\hat {\beta }_b$
(RMSE
$\hat {\beta }_b$
(RMSE $_{\text {BML}}$
and Bias
$_{\text {BML}}$
and Bias $_{\text {BML}}$
, respectively) for different values of n and J. Values in bold indicate the smallest RMSE and the smallest relative bias for each combination of n and J
$_{\text {BML}}$
, respectively) for different values of n and J. Values in bold indicate the smallest RMSE and the smallest relative bias for each combination of n and J

In conclusion, our optimally regularized Bayesian estimator with the ML estimate plugged in demonstrates its power to refine the accuracy of estimators for the between-group slope $\beta _b$
in small samples. While acknowledging inherent bias (see Table 3 in Appendix G for details), this estimator generated through our approach demonstrates enhanced accuracy when juxtaposed with the ML estimator, particularly in situations characterized by a finite sample size. Next, we provide a summary of our introduced approach, reflect on the theoretical advancements, highlight new findings, address limitations, and offer insights into the broader implications of our work.
$\beta _b$
in small samples. While acknowledging inherent bias (see Table 3 in Appendix G for details), this estimator generated through our approach demonstrates enhanced accuracy when juxtaposed with the ML estimator, particularly in situations characterized by a finite sample size. Next, we provide a summary of our introduced approach, reflect on the theoretical advancements, highlight new findings, address limitations, and offer insights into the broader implications of our work.
4 Step-by-step tutorial using MLOB R package
To illustrate the practical application of the newly developed estimator, we created the MultiLevelOptimalBayes (MLOB) package, which includes the estimation function mlob(). In this section, we provide step-by-step instructions on using the regularized Bayesian estimator with the MLOB package in R. The estimator is applied to the PASSNYC dataset—a real-world dataset on educational equity in New York City that includes data from 1,272 schools across 32 districts.
4.1 Loading MLOB package
First, install and load the MLOB package, which is available on CRAN:
Alternatively, the development version can be installed from GitHub:

4.2 Loading and preparing the dataset
As mentioned earlier, we demonstrate how to use the MLOB package based on the PASSNYC dataset. The PASSNYC dataset is available on Kaggle.Footnote 3 In the next step, load, clean, and convert the relevant variables of the PASSNYC dataset to numeric values:

4.3 Estimating the between-group effect
We seek to obtain the contextual effect of economic need on average math proficiency using the regularized Bayesian estimator. For user convenience, the mlob() function follows a similar notation and works as simply as the linear regression function lm() in R. We specify District as the grouping variable. To ensure reproducibility, we set a random seed before processing the dataset. Since the dataset is unbalanced (i.e., the number of individuals per group varies), our procedure balances the data by randomly removing entities from larger groups to achieve equal group sizes. Setting a seed ensures that the same entities are removed each time the procedure is run, making the results fully replicable.

Warnings may indicate that the data are unbalanced and that a balancing procedure has been applied. The function also alerts the user if estimates may be unreliable due to a highly unbalanced structure. By default, if more than 20% of the data would need to be deleted to achieve balance (threshold adjustable via the $balancing.limit$
parameter), the function stops and issues a warning. While this procedure preserves the estimator’s assumptions, removing many observations or groups may affect the generalizability of the results.
$balancing.limit$
parameter), the function stops and issues a warning. While this procedure preserves the estimator’s assumptions, removing many observations or groups may affect the generalizability of the results.
4.4 Summary of results
The output of the customized summary() function follows the format of the summary(lm()) function and provides the estimated between-group effect ( $\beta _b$
) obtained with the regularized Bayesian estimator. For comparison, the summary() function also includes ML estimation results:
$\beta _b$
) obtained with the regularized Bayesian estimator. For comparison, the summary() function also includes ML estimation results:

4.5 Interpretation
The results indicate that the regularized Bayesian estimator provides an estimate with a significantly lower standard error compared to the ML estimator. Notably, the between-group coefficient estimated by the regularized Bayesian estimator ( $\tilde {\beta }_b = -1.0379$
) is smaller in absolute terms than the one estimated by ML (
$\tilde {\beta }_b = -1.0379$
) is smaller in absolute terms than the one estimated by ML ( $\hat {\beta }_b = -1.7415$
). The reduction in absolute magnitude suggests that ML may overestimate the effect due to its higher variance, whereas the regularized Bayesian estimator produces more reliable estimates, particularly in small samples. The between-group effect in this context represents how economic need, averaged at the district level, influences math proficiency across the districts of New York City. The negative coefficient suggests that districts with higher economic need tend to have lower average math proficiency. Given that the PASSNYC dataset is relatively small, containing 1,272 schools across 32 districts, the primary small-sample issue arises from the limited number of districts rather than the total number of schools. Since hierarchical models rely on the number of groups to estimate between-group effects, a small number of districts leads to increased variance in the estimated between-group coefficient. In this setting, the lower variance of the Bayesian estimator is particularly beneficial, as it enhances the reliability of the estimates. This highlights the advantages of the regularized Bayesian estimator in two-level latent variable models, especially with small datasets such as PASSNYC.
$\hat {\beta }_b = -1.7415$
). The reduction in absolute magnitude suggests that ML may overestimate the effect due to its higher variance, whereas the regularized Bayesian estimator produces more reliable estimates, particularly in small samples. The between-group effect in this context represents how economic need, averaged at the district level, influences math proficiency across the districts of New York City. The negative coefficient suggests that districts with higher economic need tend to have lower average math proficiency. Given that the PASSNYC dataset is relatively small, containing 1,272 schools across 32 districts, the primary small-sample issue arises from the limited number of districts rather than the total number of schools. Since hierarchical models rely on the number of groups to estimate between-group effects, a small number of districts leads to increased variance in the estimated between-group coefficient. In this setting, the lower variance of the Bayesian estimator is particularly beneficial, as it enhances the reliability of the estimates. This highlights the advantages of the regularized Bayesian estimator in two-level latent variable models, especially with small datasets such as PASSNYC.
To draw a parallel with the previous section, we refer to Table 1, which summarizes the average RMSE and relative bias across different n and J and illustrates when regularized Bayesian or ML estimation is the preferable choice. A green color code is used to indicate the superior estimator for each scenario. Notably, in all analyzed cases, the newly developed estimator outperformed ML in terms of RMSE, further demonstrating its reliability in multilevel latent variable modeling. Therefore, even when the sample is sufficiently large, we recommend using our MLOB package, which offers both ML and regularized Bayesian estimations, allowing users to select the most appropriate method for their data. It is also important to consider degenerate cases where either the between-group or within-group effect is zero. In such cases, the mlob() function recommends using simpler models, such as ordinary least squares (OLS) or ML.
5 Discussion and conclusion
In this article, we thoroughly described and analyzed a regularized Bayesian estimator for multilevel latent variable models, which we optimized with respect to MSE performance, using the multilevel latent covariate model as an example. In addition, we derived an analytical expression for the standard error.
However, given our specific focus on small sample size, rather than using this standard error, it might be more reasonable to employ a resampling technique for accurately determining the standard error. As mentioned, one such effective method is a delete-d jackknife procedure. The main achievement lies in deriving an optimally regularized Bayesian estimator by seamlessly integrating the minimization of MSE with respect to the parameters of the prior distribution. Through graphical representations of the results, we highlighted the pronounced improvements that our approach garners over ML estimation, particularly in small samples.
The following contributions to the theoretical landscape are noteworthy. Primarily, we derived a distribution of the Bayesian estimator, enabling us to achieve further optimization of the MSE with respect to the parameters of the prior distribution for this estimator. Moreover, we proposed an algorithm to construct our optimally regularized Bayesian estimator. These theoretical achievements are mirrored by the results from our simulation study as detailed in the previous section. In a nutshell, from these results, significant performance improvements emerged for the optimally regularized Bayesian estimator compared to the ML estimator, particularly in situations characterized by small sample sizes and low ICCs. These advantages can be attributed to the way the estimator is constructed, which allows for some bias while actively minimizing the MSE.
Although our work focuses on Bayesian estimation, the utilization of prior information to enhance estimation is not exclusive to Bayesian methods. Similar means are taken by frequentist approaches. For example, the Bayesian estimator’s weighting parameter $\omega $
in Equation (8) achieves an effect analogous to the penalty in regularized structural equation modeling, as seen in Jacobucci et al. (Reference Jacobucci, Grimm and McArdle2016). Similarly, the weighting parameter in the denominator of Equation (7) aligns with the concept of regularized consistent partial least squares estimation (e.g., Jung & Park, Reference Jung and Park2018).
$\omega $
in Equation (8) achieves an effect analogous to the penalty in regularized structural equation modeling, as seen in Jacobucci et al. (Reference Jacobucci, Grimm and McArdle2016). Similarly, the weighting parameter in the denominator of Equation (7) aligns with the concept of regularized consistent partial least squares estimation (e.g., Jung & Park, Reference Jung and Park2018).
While our research offers significant contributions, we also acknowledge limitations. The advantages of our method over ML estimation become less pronounced with larger sample sizes, indicating that our approach may be most beneficial in contexts with smaller samples. Another limitation of our approach lies in the locality of the search for the optimal MSE. Our optimization strategy within a $5\star\sigma $
region ensures that the minimum MSE falls within this region with almost
$5\star\sigma $
region ensures that the minimum MSE falls within this region with almost $100\%$
probability, although this is not guaranteed. Additionally, since the true MSE remains unknown, we rely on the estimated MSE, which provides a reliable approximation within the defined bound. However, the extrema of the real and estimated MSE do not always coincide. As a result, misspecification of the regularized Bayesian estimation is possible but extremely unlikely. Moreover, by reducing the
$100\%$
probability, although this is not guaranteed. Additionally, since the true MSE remains unknown, we rely on the estimated MSE, which provides a reliable approximation within the defined bound. However, the extrema of the real and estimated MSE do not always coincide. As a result, misspecification of the regularized Bayesian estimation is possible but extremely unlikely. Moreover, by reducing the $5\star\sigma $
search region, we can control bias and select an optimal estimator within the reduced region. While this decreases the probability of finding the globally optimal MSE, it ensures that the estimator has a relative bias within a predefined threshold. In the degenerate case where the search region is zero, we obtain an exact ML estimator. This is a potential area for future research.
$5\star\sigma $
search region, we can control bias and select an optimal estimator within the reduced region. While this decreases the probability of finding the globally optimal MSE, it ensures that the estimator has a relative bias within a predefined threshold. In the degenerate case where the search region is zero, we obtain an exact ML estimator. This is a potential area for future research.
One more limitation is the assumption of equal group sizes, which simplifies the statistical problem. However, in practice, group sizes often vary (e.g., the number of students in classes). While our current approach does not directly account for unequal group sizes, one possible solution would be to average the group sizes and apply our estimator. It is important to note that our regularized Bayesian estimator formulas extend to non-integer values of n, allowing for this flexibility. This is also a potential area for future research. Nevertheless, our MLOB R package includes a built-in data-balancing mechanism that provides a practical solution for handling unequal group sizes. Notably, if more than 20% of the data would need to be deleted to achieve balance, the function stops and alerts the user.
Beyond these limitations, the regularized Bayesian estimator can be extended to three- and higher-level models. While our estimator has not yet been fully developed for such multilevel structures, these models could be implemented through an iterative application of the two-level estimator. One approach is to iteratively apply the regularized Bayesian estimator by reducing the model to two levels at a time, computing estimates, and then proceeding to the next pair of levels.
An extension for future simulation work is to explore a broader range of between-group parameter values, including near-zero $\beta _b$
settings, to more fully assess performance under weak between-group effects. Future designs could also relax the constraints on ICC
$\beta _b$
settings, to more fully assess performance under weak between-group effects. Future designs could also relax the constraints on ICC $_Y$
to investigate the estimator’s behavior in such scenarios.
$_Y$
to investigate the estimator’s behavior in such scenarios.
Another possible extension is incorporating time as a predictor, enabling a longitudinal modeling framework for analyzing time-related trends. For example, the application of our regularized Bayesian estimator to the longitudinal dataset ChickWeight is included as a standard example in the MLOB R package. Such extensions provide promising directions for future research and further refinement of the regularized Bayesian estimator.
To conclude, our optimized Bayesian estimator, which sophistically balances bias reduction and variance minimization, offers improved precision in parameter estimation, particularly in small samples. Thus, our findings hold promising implications for multilevel latent variable modeling, and the demonstrated accuracy improvements due to optimized regularization underscore the practical value of our estimator. We aspired to empower researchers in psychology and related fields to utilize the benefits of our proposed estimator and use the newly developed mlob package in R, as demonstrated in the Section Step-by-Step Tutorial when dealing with small samples in fitting multilevel latent variable models.
By highlighting the efficacy of Bayesian strategies, we hope to inspire a paradigm shift in estimation techniques for small-sample scenarios. This shift could lead to more robust and informed modeling practices in the research community.
Funding statement
Funded by the Deutsche Forschungsgemeinschaft (DFG, German Research Foundation)—471861494.
Competing interests
The authors declare none.
Appendix A
To derive a Bayesian estimator following Zitzmann, Helm, and Hecht (Reference Zitzmann, Helm and Hecht2021) indirect strategy, we start by adopting a gamma prior distribution for the inverse of the group-level variance of the predictor variable $\tau _X^2$
:
$\tau _X^2$
:
 $$ \begin{align} \frac{1}{\tau_X^2} \sim \text{Gamma}(a,b), \end{align} $$
where a and b are the parameters of the Gamma distribution. For better interpretability, we employ a reparameterization of $a = \frac {\nu _0}{2}$
and
$a = \frac {\nu _0}{2}$
and $b = \frac {\nu _0 \tau _0^2}{2}$
leading to
$b = \frac {\nu _0 \tau _0^2}{2}$
leading to
 $$ \begin{align} \frac{1}{\tau_X^2} \sim \text{Gamma} \left( \frac{\nu_0}{2},\frac{\nu_0 \tau_0^2}{2} \right). \end{align} $$
Similarly, the likelihood for the inverse of the group-level variance is
 $$ \begin{align} \frac{1}{\tau_X^2} \sim \text{Gamma} \left( \frac{J}{2},\frac{J \hat{\tau}_X^2}{2} \right) \end{align} $$
with $\hat {\tau }_X^2$
being an estimate of the group-level variance. To get an inverse-gamma posterior, we combine Equations (A.2) and (A.3) and yield
$\hat {\tau }_X^2$
being an estimate of the group-level variance. To get an inverse-gamma posterior, we combine Equations (A.2) and (A.3) and yield
 $$ \begin{align} \frac{1}{\tau_X^2} \sim \text{Gamma} \left( \frac{\nu_0 + J}{2},\frac{\nu_0 \tau_0^2 + J \hat{\tau}_X^2}{2} \right). \end{align} $$
As demonstrated by Zitzmann, Lüdtke, et al. (Reference Zitzmann, Lüdtke, Robitzsch and Hecht2021) in Appendix C, an approximation for the mean of this distribution can be derived as follows:
 $$ \begin{align} \overline{\tau}_X^2 \approx (1 - \omega) \tau_0^2 + \omega \hat{\tau}_X^2. \end{align} $$
With Equation (A.5), the Bayesian expected a posteriori (EAP) estimate is defined. We specify the weighting parameter $\omega $
from Equation (A.5) as
$\omega $
from Equation (A.5) as
 $$ \begin{align} \omega = \frac{\frac{J-1}{2}}{\frac{\nu_0}{2} + \frac{J}{2} - 1}. \end{align} $$
This formula minimizes the total error of the approximation of $\overline {\tau }_X^2$
from Equation (A.5), making it optimal.
$\overline {\tau }_X^2$
from Equation (A.5), making it optimal.
Note that $\omega $
is defined in Equation (A.6) as a function of sample size, or more precisely, as a function of the number of groups J.
$\omega $
is defined in Equation (A.6) as a function of sample size, or more precisely, as a function of the number of groups J.
Asymptotically, when $J\rightarrow \infty $
,
$J\rightarrow \infty $
, $\omega $
converges to 1. Thus,
$\omega $
converges to 1. Thus, $\overline {\tau }_X^2$
becomes equal to
$\overline {\tau }_X^2$
becomes equal to $\hat {\tau }_X^2$
in this case.
$\hat {\tau }_X^2$
in this case.
To derive the new estimator, we take Equation (6) and replace $\hat {\tau }_X^2$
, with its Bayesian EAP as defined in Equation (A.5). This gives
$\hat {\tau }_X^2$
, with its Bayesian EAP as defined in Equation (A.5). This gives
 $$ \begin{align} \tilde{\beta}_b = \frac{\hat{\tau}_{YX}}{(1 - \omega) \tau_0^2 + \omega \hat{\tau}_X^2}. \end{align} $$
Appendix B
To compute an estimate of the group-level covariances, we apply the formulas from Zitzmann, Lüdtke, et al. (Reference Zitzmann, Lüdtke, Robitzsch and Hecht2021), starting from the decompositions:
 $$ \begin{align} X_{ij} & = X_{b,j} + X_{w,ij} \end{align} $$
 $$ \begin{align} Y_{ij} & = Y_{b,j} + Y_{w,ij}. \end{align} $$
We assume that $X_{b,j}$
and
$X_{b,j}$
and $X_{w,ij}$
are uncorrelated and both independently identically normally distributed. The same assumptions are considered for Y.
$X_{w,ij}$
are uncorrelated and both independently identically normally distributed. The same assumptions are considered for Y.
Next, we define (manifest) group means for both X and Y as
 $$ \begin{align} \overline{X}_{\bullet j} & = \frac{1}{n} \sum_{i=1}^{n} (X_{b,j} + X_{w,ij}) = X_{b,j} + \frac{1}{n} \sum_{i=1}^{n} X_{w,ij}, \end{align} $$
 $$ \begin{align} \overline{Y}_{\bullet j} & = \frac{1}{n} \sum_{i=1}^{n} (Y_{b,j} + Y_{w,ij}) = Y_{b,j} + \frac{1}{n} \sum_{i=1}^{n} Y_{w,ij}. \end{align} $$
Then, the overall means are
 $$ \begin{align} \overline{X}_{\bullet \bullet} & = \frac{1}{nJ} \sum_{j=1}^{J} \sum_{i=1}^{n} (X_{b,j} + X_{w,ij}) = \frac{1}{J} \sum_{j=1}^{J} X_{b,j} + \frac{1}{nJ} \sum_{j=1}^{J} \sum_{i=1}^{n} X_{w,ij}, \end{align} $$
 $$ \begin{align} \overline{Y}_{\bullet \bullet} & = \frac{1}{nJ} \sum_{j=1}^{J} \sum_{i=1}^{n} (Y_{b,j} + Y_{w,ij}) = \frac{1}{J} \sum_{j=1}^{J} Y_{b,j} + \frac{1}{nJ} \sum_{j=1}^{J} \sum_{i=1}^{n} Y_{w,ij}. \end{align} $$
The sums of squared deviations of the group means from the overall mean (SSA) and of the individual values from the group means (SSD) for X are
 $$ \begin{align} & SSA = n \sum_{j=1}^{J} (\overline{X}_{\bullet j} - \overline{X}_{\bullet \bullet})^2 = n \sum_{j=1}^{J} \overline{X}_{\bullet j}^2 - nJ \overline{X}_{\bullet \bullet}^2 \end{align} $$
 $$ \begin{align} & SSD = \sum_{j=1}^{J} \sum_{i=1}^{n} (X_{ij} - \overline{X}_{\bullet j})^2 = \sum_{j=1}^{J} \sum_{i=1}^{n} X_{ij}^2 - n \sum_{j=1}^{J} \overline{X}_{\bullet j}^2. \end{align} $$
The same equations hold for Y. And the cross products of Y and X are
 $$ \begin{align} \kern-1pt & SPA = n \sum_{j=1}^{J} (\overline{Y}_{\bullet j} - \overline{Y}_{\bullet \bullet}) (\overline{X}_{\bullet j} - \overline{X}_{\bullet \bullet})= n \sum_{j=1}^{J} \overline{Y}_{\bullet j} \overline{X}_{\bullet j} - nJ \overline{Y}_{\bullet \bullet} \overline{X}_{\bullet \bullet} \end{align} $$
 $$ \begin{align} SPD = \sum_{j=1}^{J} \sum_{i=1}^{n} (Y_{ij} - \overline{Y}_{\bullet j}) (X_{ij} - \overline{X}_{\bullet j}) = \sum_{j=1}^{J} & \sum_{i=1}^{n} Y_{ij} X_{ij} - n \sum_{j=1}^{J} \overline{Y}_{\bullet j} \overline{X}_{\bullet j}. \end{align} $$
Zitzmann, Lüdtke, et al. (Reference Zitzmann, Lüdtke, Robitzsch and Hecht2021) derived the relations between the sum of squared deviations of X and the within- and between-group variances as
 $$ \begin{align} SSA &= n(J-1) \hat{\tau}_X^2 - (J-1) \hat{\sigma}_X^2 \end{align} $$
 $$ \begin{align} SSD &= (n-1)J \hat{\sigma}_X^2. \end{align} $$
Combining Equations (B.11) and (B.12) with Equations (B.7) and (B.8), we yield an estimate of the group-level variance of X:
 $$ \begin{align} \hat{\tau}_X^2 = - \frac{1}{n(n-1)J} \sum_{j=1}^{J} \sum_{i=1}^{n} X_{ij}^2 + \frac{nJ-1}{(n-1)(J-1)J} \sum_{j=1}^{J} \overline{X}_{\bullet j}^2 - \frac{J}{J-1} \overline{X}_{\bullet \bullet}^2. \end{align} $$
Note that this estimator may not be optimal, because estimates may not be positive. To address this issue, Chung et al. (Reference Chung, Rabe-Hesketh, Dorie, Gelman and Liu2013) introduced a maximum penalized likelihood (MPL) approach for estimating this parameter. This method mitigates the problem of boundary estimates, specifically preventing the occurrence of negative estimated group-level variances. In our approach, we used the estimator from Equation (B.13), due to the transformation in the further steps and no anomalies were found during the extensive simulations.
Zitzmann, Lüdtke, et al. (Reference Zitzmann, Lüdtke, Robitzsch and Hecht2021) also derived how the sum of squared deviations of cross products of X and Y can be expressed in terms of their within- and between-group covariances:
 $$ \begin{align} SPA &= n(J-1)\hat{\tau}_{YX} + (J-1)\hat{\sigma}_{YX} \end{align} $$
 $$ \begin{align} SPD &= (n-1)J\hat{\sigma}_{YX.} \end{align} $$
This means that the estimator for the group-level covariance $\hat {\tau }_{YX}$
can be obtained from Equations (B.9), (B.10), (B.14), and (B.15) as
$\hat {\tau }_{YX}$
can be obtained from Equations (B.9), (B.10), (B.14), and (B.15) as
 $$ \begin{align} \hat{\tau}_{YX} = - \frac{1}{n(n-1)J} \sum_{j=1}^{J} \sum_{i=1}^{n} Y_{ij} X_{ij} + \frac{nJ-1}{(n-1)(J-1)J} \sum_{j=1}^{J} \overline{Y}_{\bullet j} \overline{X}_{\bullet j} - \frac{J}{J-1} \overline{Y}_{\bullet \bullet} \overline{X}_{\bullet \bullet}. \end{align} $$
So far, we have derived both the numerator and the denominator of the ML estimator and, partly, of the Bayesian estimator in Equation (7). But how can we use these derivations? Our aim is to minimize the MSE of the Bayesian estimator, and to do this, we need to know the mean and the variance of the estimator. One way to find them is to compute the estimator’s distribution.
We begin with the derivation of the distributions of group-level variance of X and the group-level covariance between X and Y. To this end, two new variables are defined. The $Z_X$
merges all the elements of predictor sample together with its means into one vector of length
$Z_X$
merges all the elements of predictor sample together with its means into one vector of length $(nJ+J+1)$
, and
$(nJ+J+1)$
, and $Z_Y$
combines all the elements of the dependent variable and its means:
$Z_Y$
combines all the elements of the dependent variable and its means:
 $$ \begin{align} & Z_X = \left( X_{11}, \dots X_{n1}, X_{12}, \dots X_{nJ}, \overline{X}_{\bullet 1}, \dots \overline{X}_{\bullet J}, \overline{X}_{\bullet \bullet} \right)' \end{align} $$
 $$ \begin{align} & Z_Y = \left( Y_{11}, \dots Y_{n1}, Y_{12}, \dots Y_{nJ}, \overline{Y}_{\bullet 1}, \dots \overline{Y}_{\bullet J}, \overline{Y}_{\bullet \bullet} \right)'. \end{align} $$
Using these newly defined variables, we can rewrite the estimators for the group-level variance and the covariance $\hat {\tau }_{YX}$
in matrix form:
$\hat {\tau }_{YX}$
in matrix form:
 $$ \begin{align} & \hat{\tau}_X^2 = Z_X' A Z_X \end{align} $$
 $$ \begin{align} & \hat{\tau}_{YX} = Z_X' A Z_Y. \end{align} $$
With the same coefficient matrix A for both defined in Equation (F.1) of Appendix F. Note that matrix A is diagonal.
Thus, $\hat {\tau }_{YX}$
and
$\hat {\tau }_{YX}$
and $\hat {\tau }_X^2$
are quadratic forms of the sample elements and their means. If the equations consist only of second-order terms of normally distributed random variables, we can interpret
$\hat {\tau }_X^2$
are quadratic forms of the sample elements and their means. If the equations consist only of second-order terms of normally distributed random variables, we can interpret $\hat {\tau }_{YX}$
and
$\hat {\tau }_{YX}$
and $\hat {\tau }_X^2$
as the weighted sums of
$\hat {\tau }_X^2$
as the weighted sums of $\chi ^2$
, and thus gamma-distributed random variables. However, the distribution of such a quadratic form is highly complicated in the general case. Therefore, we apply a transformation to yield weighted sum of squares (without interaction terms) of iid normal random variables.
$\chi ^2$
, and thus gamma-distributed random variables. However, the distribution of such a quadratic form is highly complicated in the general case. Therefore, we apply a transformation to yield weighted sum of squares (without interaction terms) of iid normal random variables.
Firstly, we compute the distribution of $Z_X$
and
$Z_X$
and $Z_Y$
, using the previously made assumptions about X and Y:
$Z_Y$
, using the previously made assumptions about X and Y:
Where ![]() is a vector of ones of size
is a vector of ones of size $(nJ+J+1)$
. Also, note the following important facts:
$(nJ+J+1)$
. Also, note the following important facts:
-
• each element of
$Z_X$
and
$Z_Y$
has the same mean; -
• the sum of coefficients defined by matrix A in Equation (F.1) of Appendix F is zero.


As a result, when we demean Equations (B.19) and (B.20), these means sum up to zero. To demonstrate it, define $Z_X^*$
and
$Z_X^*$
and $Z_Y^*$
and all their elements as the demeaned counterparts of
$Z_Y^*$
and all their elements as the demeaned counterparts of $Z_X$
and
$Z_X$
and $Z_Y$
, respectively:
$Z_Y$
, respectively:

Show that ![]() and
and ![]() are both zeros:
are both zeros:


Plug the expressions from Equation (B.23) into Equations (B.19) and (B.20), and remind that the sum of coefficients of matrix A is zero:


Hence, it is irrelevant for $\hat {\tau }_X^2$
and
$\hat {\tau }_X^2$
and $\hat {\tau }_{YX}$
whether
$\hat {\tau }_{YX}$
whether $Z_X$
and
$Z_X$
and $Z_Y$
have non-zero means or not, they always cancel out. So, we do not lose generality by assuming
$Z_Y$
have non-zero means or not, they always cancel out. So, we do not lose generality by assuming $\mu _X = 0$
and
$\mu _X = 0$
and $\mu _Y = 0$
.
$\mu _Y = 0$
. $\Sigma _X$
and
$\Sigma _X$
and $\Sigma _Y$
are defined in Equations (F.3) and (F.4) of Appendix F. These matrices are symmetric and positive semi-definite as covariance matrices. Therefore, their square roots will have only real entries (Horn & Johnson, Reference Horn and Johnson2013). Using the matrices, we can transform
$\Sigma _Y$
are defined in Equations (F.3) and (F.4) of Appendix F. These matrices are symmetric and positive semi-definite as covariance matrices. Therefore, their square roots will have only real entries (Horn & Johnson, Reference Horn and Johnson2013). Using the matrices, we can transform $\hat {\tau }_X^2$
to
$\hat {\tau }_X^2$
to
 $$ \begin{align} \hat{\tau}_X^2 = Z_X' A Z_X = Z_X' \Sigma_X^{-1/2} \Sigma_X^{1/2} A \Sigma_X^{1/2} \Sigma_X^{-1/2} Z_X = W_X' \Sigma_X^{1/2} A \Sigma_X^{1/2} W_X. \end{align} $$
Where $W_X = \Sigma _X^{-1/2} Z_X \sim N(0, \mathbf {I}_{nJ+J+1})$
follows the standard (multivariate) normal distribution, which has the identity matrix
$W_X = \Sigma _X^{-1/2} Z_X \sim N(0, \mathbf {I}_{nJ+J+1})$
follows the standard (multivariate) normal distribution, which has the identity matrix $\mathbf {I}$
as the covariance matrix. Following the rationale that led to Equation (B.28), we define a square root of the covariance matrix
$\mathbf {I}$
as the covariance matrix. Following the rationale that led to Equation (B.28), we define a square root of the covariance matrix $\Sigma _X$
by using its spectral decomposition as
$\Sigma _X$
by using its spectral decomposition as
 $$ \begin{align} \Sigma_X = V_X D_X V_X'. \end{align} $$
Where $V_X$
is a matrix of eigenvectors and it is orthogonal (
$V_X$
is a matrix of eigenvectors and it is orthogonal ( $V_X' = V_X^{-1}$
), because
$V_X' = V_X^{-1}$
), because $\Sigma _X$
is a real symmetric matrix by its nature (Horn & Johnson, Reference Horn and Johnson2013). Matrix
$\Sigma _X$
is a real symmetric matrix by its nature (Horn & Johnson, Reference Horn and Johnson2013). Matrix $D_X$
is a diagonal matrix of eigenvalues. These eigenvalues are non-negative, because
$D_X$
is a diagonal matrix of eigenvalues. These eigenvalues are non-negative, because $\Sigma _X$
is positive-semidefinite (Horn & Johnson, Reference Horn and Johnson2013). Thus, we may denote the square root of
$\Sigma _X$
is positive-semidefinite (Horn & Johnson, Reference Horn and Johnson2013). Thus, we may denote the square root of $D_X$
as
$D_X$
as $S_X$
, which is just a diagonal matrix with real square roots of each element of
$S_X$
, which is just a diagonal matrix with real square roots of each element of $D_X$
. This helps us to define the matrix
$D_X$
. This helps us to define the matrix $\Sigma _X^{1/2}$
:
$\Sigma _X^{1/2}$
:
 $$ \begin{align} \Sigma_X^{1/2} = V_X S_X V_X'. \end{align} $$
Indeed, we have
 $$ \begin{align} \Sigma_X^{1/2} \Sigma_X^{1/2} = V_X S_X \overbrace{V_X' V_X}^{=\mathbf{I}} S_X V_X' = V_X \overbrace{S_X S_X}^{=D_X} V_X' = V_X D_X V_X' = \Sigma_X. \end{align} $$
The eigenvalues of $\Sigma _X$
are as follows:
$\Sigma _X$
are as follows:
-
•
$\lambda _i=0$
,
$(J+1)$
eigenvalues; -
•
$\lambda _i = \sigma _X^2$
,
$((n-1)J)$
eigenvalues; -
•
$\lambda _i = (n+1)\left ( \tau _X^2 + \frac {1}{n} \sigma _X^2 \right )$
,
$(J-1)$
eigenvalues; -
•
$\lambda _{nJ+J+1} = \frac {nJ+J+1}{J} \left ( \tau _X^2 + \frac {1}{n} \sigma _X^2 \right )$
, 1 eigenvalue.


 $D_X$
, a diagonal matrix, is composed of the eigenvalues in this order. Matrix
$D_X$
, a diagonal matrix, is composed of the eigenvalues in this order. Matrix $V_X = V$
is presented in Equation (F.2) of Appendix F. Due to its bulkiness, we provide
$V_X = V$
is presented in Equation (F.2) of Appendix F. Due to its bulkiness, we provide $V_X$
for the case
$V_X$
for the case $n=3$
and
$n=3$
and $J=4$
, but it could be expanded upon demand.
$J=4$
, but it could be expanded upon demand.
We can now plug the decomposition of $\Sigma _X$
into Equation (B.28) so that it becomes
$\Sigma _X$
into Equation (B.28) so that it becomes
 $$ \begin{align} \hat{\tau}_X^2 &= W_X' \Sigma_X^{1/2} A \Sigma_X^{1/2} W_X = W_X' V_X S_X V_X' A V_X S_X V_X' W_X \end{align} $$
 $$ \begin{align} \hat{\tau}_X^2 &= H_X' S_X V_X' A V_X S_X H_X, \end{align} $$
where $H_X = V_X' W_X \sim N (0, V_X' \mathbf {I}_{nJ+J+1} V_X) = N(0,\mathbf {I}_{nJ+J+1})$
. Thus, the orthogonality of matrix
$H_X = V_X' W_X \sim N (0, V_X' \mathbf {I}_{nJ+J+1} V_X) = N(0,\mathbf {I}_{nJ+J+1})$
. Thus, the orthogonality of matrix $V_X$
kept the standard normal distribution of the new variable
$V_X$
kept the standard normal distribution of the new variable $H_X$
. Since the internal right-hand side of Equation (B.33),
$H_X$
. Since the internal right-hand side of Equation (B.33), $S_X V_X' A V_X S_X$
, is diagonal, we indeed managed to represent
$S_X V_X' A V_X S_X$
, is diagonal, we indeed managed to represent $\tau _X^2$
as a weighted sum of squares of independent normally distributed random variables, that is, a weighted sum of
$\tau _X^2$
as a weighted sum of squares of independent normally distributed random variables, that is, a weighted sum of $\chi ^2_1$
-distributed random variables.
$\chi ^2_1$
-distributed random variables.
Appendix C
Similarly to the transformation of the group-level variance of X, which was introduced in Appendix B, we continue with the description of the transformation of the group-level covariance of X and Y as this is partially similar. We start from Equation (B.20) in Appendix B and use the previously defined covariance matrices $\Sigma _X$
and
$\Sigma _X$
and $\Sigma _Y$
(Equations (B.21) and (B.22) in Appendix B):
$\Sigma _Y$
(Equations (B.21) and (B.22) in Appendix B):
 $$ \begin{align} \hat{\tau}_{YX} = Z_X' A Z_Y = Z_X' \Sigma_X^{-1/2} \Sigma_X^{1/2} A \Sigma_Y^{1/2} \Sigma_Y^{-1/2} Z_Y = W_X' \Sigma_X^{1/2} A \Sigma_Y^{1/2} W_Y, \end{align} $$
where $W_Y = \Sigma _Y^{-1/2} Z_Y \sim N(0, \mathbf {I}_{nJ+J+1})$
is a new random vector that follows the multivariate standard normal distribution. For further transformation, we also introduce the spectral decomposition of covariance matrix
$W_Y = \Sigma _Y^{-1/2} Z_Y \sim N(0, \mathbf {I}_{nJ+J+1})$
is a new random vector that follows the multivariate standard normal distribution. For further transformation, we also introduce the spectral decomposition of covariance matrix $\Sigma _Y$
and its square root as
$\Sigma _Y$
and its square root as
 $$ \begin{align} \Sigma_Y &= V_Y D_Y V_Y' \end{align} $$
 $$ \begin{align} \Sigma_Y^{1/2} &= V_Y S_Y V_Y', \end{align} $$
where $V_Y$
is a matrix of eigenvectors of
$V_Y$
is a matrix of eigenvectors of $\Sigma _Y$
. It turns out to be equal to
$\Sigma _Y$
. It turns out to be equal to $V_X$
, therefore sharing its property of orthogonality. We will further refer to them as
$V_X$
, therefore sharing its property of orthogonality. We will further refer to them as $V = V_X = V_Y$
(see Equation (F.2) in Appendix F).
$V = V_X = V_Y$
(see Equation (F.2) in Appendix F).
Matrix $D_Y$
consists of (non-negative) eigenvalues of
$D_Y$
consists of (non-negative) eigenvalues of $\Sigma _Y$
on the diagonal (because of the positive-semidefiniteness of
$\Sigma _Y$
on the diagonal (because of the positive-semidefiniteness of $\Sigma _Y$
). Its square root matrix,
$\Sigma _Y$
). Its square root matrix, $S_Y$
, is also diagonal, with non-negative square roots of eigenvalues on the main diagonal. We can compute the eigenvalues of
$S_Y$
, is also diagonal, with non-negative square roots of eigenvalues on the main diagonal. We can compute the eigenvalues of $\Sigma _Y$
in closed form and thus define matrix
$\Sigma _Y$
in closed form and thus define matrix $D_Y$
by
$D_Y$
by
-
•
$\lambda _i=0$
,
$(J+1)$
eigenvalues; -
•
$\lambda _i = \sigma _Y^2$
,
$((n-1)J)$
eigenvalues; -
•
$\lambda _i = (n+1)\left ( \tau _Y^2 + \frac {1}{n} \sigma _Y^2 \right )$
,
$(J-1)$
eigenvalues; -
•
$\lambda _{nJ+J+1} = \frac {nJ+J+1}{J} \left ( \tau _Y^2 + \frac {1}{n} \sigma _Y^2 \right )$
, 1 eigenvalue.


For the next step, we plug in the decompositions Equation (B.30) of Appendix B and Equation (C.3) into Equation (C.1) and obtain
 $$ \begin{align} \hat{\tau}_{YX} &= W_X' \Sigma_X^{1/2} A \Sigma_Y^{1/2} W_Y = W_X' V S_X V' A V S_Y V' W_Y \end{align} $$
 $$ \begin{align} \hat{\tau}_{YX} &= H_X' S_X V' A V S_Y H_Y, \end{align} $$
where $H_Y = V' W_Y \sim N (0, V' \mathbf {I}_{nJ+J+1} V) = N(0,\mathbf {I}_{nJ+J+1})$
. Thus, the distribution of the new variable
$H_Y = V' W_Y \sim N (0, V' \mathbf {I}_{nJ+J+1} V) = N(0,\mathbf {I}_{nJ+J+1})$
. Thus, the distribution of the new variable $H_Y$
is standard normal because of the orthogonality of the matrix V. Additionally, the inner right-hand side of Equation (C.5),
$H_Y$
is standard normal because of the orthogonality of the matrix V. Additionally, the inner right-hand side of Equation (C.5), $S_X V' A V S_Y$
, is diagonal due to its construction. Comparing Equations (B.33) and (C.5), one might be inclined to see the distinct similarities and the claim to also represent
$S_X V' A V S_Y$
, is diagonal due to its construction. Comparing Equations (B.33) and (C.5), one might be inclined to see the distinct similarities and the claim to also represent $\tau _{YX}$
as a weighted sum of squares of independent normally distributed random variables. However, this is not true.
$\tau _{YX}$
as a weighted sum of squares of independent normally distributed random variables. However, this is not true. $H_X$
and
$H_X$
and $H_Y$
are different random vectors, and thus, we continue the transformation by defining a new aggregated variable:
$H_Y$
are different random vectors, and thus, we continue the transformation by defining a new aggregated variable:
 $$ \begin{align} H = \begin{pmatrix} H_X\\ H_Y \end{pmatrix} \end{align} $$
with the distribution of H being $N(0,\Sigma _H)$
. Its covariance matrix
$N(0,\Sigma _H)$
. Its covariance matrix $\Sigma _H$
is defined as follows:
$\Sigma _H$
is defined as follows:
 $$ \begin{align} \Sigma_H = \begin{pmatrix} Var(H_X) & Cov(H_X,H_Y) \\ Cov(H_X,H_Y) & Var(H_Y) \end{pmatrix}. \end{align} $$
We already showed that $Var(H_X) = \mathbf {I}_{nJ+J+1}$
and
$Var(H_X) = \mathbf {I}_{nJ+J+1}$
and $Var(H_Y) = \mathbf {I}_{nJ+J+1}$
as well. Before calculation of
$Var(H_Y) = \mathbf {I}_{nJ+J+1}$
as well. Before calculation of $Cov(H_X,H_Y)$
, we additionally define
$Cov(H_X,H_Y)$
, we additionally define $\Sigma _{YX}$
in Equation (F.5) of Appendix F in a manner similar to Equations (F.3) and (F.4). Then, the spectral decomposition of
$\Sigma _{YX}$
in Equation (F.5) of Appendix F in a manner similar to Equations (F.3) and (F.4). Then, the spectral decomposition of $\Sigma _{YX}$
becomes
$\Sigma _{YX}$
becomes
 $$ \begin{align} & \Sigma_{YX} = V D_{YX} V' \end{align} $$
 $$ \begin{align} & \Sigma_{YX}^{1/2} = V S_{YX} V', \end{align} $$
where matrix V is the same as in decompositions of $\Sigma _X$
in Equation (B.29) from Appendix B and
$\Sigma _X$
in Equation (B.29) from Appendix B and $\Sigma _Y$
in Equation (C.2). Matrix
$\Sigma _Y$
in Equation (C.2). Matrix $D_{YX}$
is diagonal with non-negative eigenvalues of positive-semidefinite matrix
$D_{YX}$
is diagonal with non-negative eigenvalues of positive-semidefinite matrix $\Sigma _{YX}$
(Horn & Johnson, Reference Horn and Johnson2013). Thus, the square root matrix,
$\Sigma _{YX}$
(Horn & Johnson, Reference Horn and Johnson2013). Thus, the square root matrix, $S_{YX}$
, is diagonal with non-negative square roots of eigenvalues on the main diagonal. The eigenvalues of
$S_{YX}$
, is diagonal with non-negative square roots of eigenvalues on the main diagonal. The eigenvalues of $\Sigma _{YX}$
that define matrix
$\Sigma _{YX}$
that define matrix $D_{YX}$
are in the closed form:
$D_{YX}$
are in the closed form:
-
•
$\lambda _i=0$
,
$(J+1)$
eigenvalues; -
•
$\lambda _i = \sigma _{YX}$
,
$((n-1)J)$
eigenvalues; -
•
$\lambda _i = (n+1)\left ( \tau _{YX} + \frac {1}{n} \sigma _{YX} \right )$
,
$(J-1)$
eigenvalues; -
•
$\lambda _{nJ+J+1} = \frac {nJ+J+1}{J} \left ( \tau _{YX} + \frac {1}{n} \sigma _{YX} \right )$
, 1 eigenvalue.


Next, we use the generalized inverses of matrices $S_X$
and
$S_X$
and $S_Y$
, as described by Penrose (Reference Penrose1955), since they include zero eigenvalues and are not invertible. These matrices are denoted as
$S_Y$
, as described by Penrose (Reference Penrose1955), since they include zero eigenvalues and are not invertible. These matrices are denoted as $S_X^+$
and
$S_X^+$
and $S_Y^+$
and include the inverse of diagonal elements that are invertible and zeros otherwise.
$S_Y^+$
and include the inverse of diagonal elements that are invertible and zeros otherwise.
Using all this, the covariance $Cov(H_X,H_Y)$
is computed as
$Cov(H_X,H_Y)$
is computed as
 $$ \begin{align*} & Cov(H_X,H_Y) = Cov(V'W_X, V'W_Y) = V' Cov(W_X,W_Y) V = \\ & V' Cov(\Sigma_X^{-1/2} Z_X, \Sigma_Y^{-1/2} Z_Y) V = V' \Sigma_X^{-1/2} \underbrace{Cov(Z_X, Z_Y)}_{\Sigma_{YX}} \Sigma_Y^{-1/2} V =\\ & V' \Sigma_X^{-1/2} \Sigma_{YX} \Sigma_Y^{-1/2} V = V' V S_X^+ V' V D_{YX} V' V S_Y^+ V' V \rightarrow \end{align*} $$
 $$ \begin{align} Cov(H_X,H_Y) = S_X^+ D_{YX} S_Y^+. \end{align} $$
This result is used to fully define the covariance matrix of H:
 $$ \begin{align} \Sigma_H = \begin{pmatrix} \mathbf{I} & S_X^+ D_{YX} S_Y^+ \\ S_X^+ D_{YX} S_Y^+ & \mathbf{I} \end{pmatrix} \end{align} $$
and its spectral decomposition:
 $$ \begin{align} \Sigma_H = V_H D_H V_H', \end{align} $$
where the closed-form solutions for both the matrix of eigenvalues $D_H$
and the orthogonal matrix of eigenvectors
$D_H$
and the orthogonal matrix of eigenvectors $V_H$
.
$V_H$
. $D_H$
is
$D_H$
is
 $$ \begin{align} D_H = \begin{pmatrix} \mathbf{I} + S_X^+ D_{YX} S_Y^+ & 0 \\ 0 & \mathbf{I} - S_X^+ D_{YX} S_Y^+ \end{pmatrix}. \end{align} $$
Matrix $V_H$
is defined in Equation (F.6) of Appendix F. Both matrices follow the same properties as their predecessor:
$V_H$
is defined in Equation (F.6) of Appendix F. Both matrices follow the same properties as their predecessor: $D_H$
is diagonal with non-negative eigenvalues, and
$D_H$
is diagonal with non-negative eigenvalues, and $V_H$
is orthogonal.
$V_H$
is orthogonal.
After exposing the new composite vector H and its covariance matrix $\Sigma _H$
, we can rewrite Equation (C.5) as
$\Sigma _H$
, we can rewrite Equation (C.5) as
 $$ \begin{align} \hat{\tau}_{YX} = H' Q H \end{align} $$
with coefficient matrix Q defined as
 $$ \begin{align} Q = \begin{pmatrix} 0 & \frac{1}{2} S_X V' A V S_Y \\ \frac{1}{2} S_X V' A V S_Y & 0 \end{pmatrix}. \end{align} $$
Note that Q is designed to keep the symmetry of Equation (C.14). Including the square root of the covariance matrix leads to
 $$ \begin{align} \hat{\tau}_{YX} = H' Q H = H' \Sigma_H^{-1/2} \Sigma_H^{1/2} Q \Sigma_H^{1/2} \Sigma_H^{-1/2} H = H_1' \Sigma_H^{1/2} Q \Sigma_H^{1/2} H_1, \end{align} $$
where $H_1 = \Sigma _H^{-1/2} H \sim N(0,\mathbf {I}_{2(nJ+J+1)})$
is a vector of independent normally distributed variables. Using the decomposition of
$H_1 = \Sigma _H^{-1/2} H \sim N(0,\mathbf {I}_{2(nJ+J+1)})$
is a vector of independent normally distributed variables. Using the decomposition of $\Sigma _H$
from Equation (C.12), denoting a square root of
$\Sigma _H$
from Equation (C.12), denoting a square root of $D_H$
as
$D_H$
as $S_H$
, and plugging both terms into Equation (C.16) yields:
$S_H$
, and plugging both terms into Equation (C.16) yields:
 $$ \begin{align} \hat{\tau}_{YX} &= H_1' \Sigma_H^{1/2} Q \Sigma_H^{1/2} H_1 = H_1' V_H S_H V_H' Q V_H S_H V_H' H_1 \end{align} $$
 $$ \begin{align} \hat{\tau}_{YX} &= H_2' S_H V_H' Q V_H S_H H_2 \end{align} $$
with $H_2 = V_H' H_1 \sim N (0, \mathbf {I}_{2(nJ+J+1)})$
—a multivariate standard normally distributed random vector, as
$H_2 = V_H' H_1 \sim N (0, \mathbf {I}_{2(nJ+J+1)})$
—a multivariate standard normally distributed random vector, as $V_H$
is orthogonal. Furthermore, since matrix
$V_H$
is orthogonal. Furthermore, since matrix $S_H V_H' Q V_H S_H$
is diagonal, the estimator of the group-level covariance
$S_H V_H' Q V_H S_H$
is diagonal, the estimator of the group-level covariance $\hat {\tau }_{YX}$
is now represented as a weighted sum of squares of independent normally distributed random variables, that is, a weighted sum of
$\hat {\tau }_{YX}$
is now represented as a weighted sum of squares of independent normally distributed random variables, that is, a weighted sum of $\chi ^2_1$
-distributed random variables. Thus, at this point, we achieved our aim of transforming
$\chi ^2_1$
-distributed random variables. Thus, at this point, we achieved our aim of transforming $\hat {\tau }_{YX}$
.
$\hat {\tau }_{YX}$
.
Appendix D
Here, we derive the distributions of the ML and the Bayesian estimator. To this end, we start by calculating the distributions of sample group-level covariances $\hat {\tau _X}^2$
and
$\hat {\tau _X}^2$
and $\hat {\tau }_{YX}$
in Equations (10) and (11), respectively. According to Welch (Reference Welch1947) and Satterthwaite (Reference Satterthwaite1946), we can approximate these sums as a generic Gamma distribution with parameters:
$\hat {\tau }_{YX}$
in Equations (10) and (11), respectively. According to Welch (Reference Welch1947) and Satterthwaite (Reference Satterthwaite1946), we can approximate these sums as a generic Gamma distribution with parameters:
 $$ \begin{align} k_{sum} &= \frac{\left(\sum_{i}\theta_i k_i \right)^2}{ \sum_{i} \theta_i^2 k_i } \end{align} $$
 $$ \begin{align} \theta_{sum} &= \frac{\sum_{i} \theta_i k_i }{k_{sum}}. \end{align} $$
Notice that each element in the sums $\hat {\tau }_X^2$
and
$\hat {\tau }_X^2$
and $\hat {\tau }_{YX}$
is scaled. The scales are defined by diagonal matrices
$\hat {\tau }_{YX}$
is scaled. The scales are defined by diagonal matrices $S_X V_X' A V_X S_X$
(for
$S_X V_X' A V_X S_X$
(for $\hat {\tau }_X^2$
) and
$\hat {\tau }_X^2$
) and $S_H V_H' Q V_H S_H$
(for
$S_H V_H' Q V_H S_H$
(for $\hat {\tau }_{YX}$
). Let us denote their diagonal elements as
$\hat {\tau }_{YX}$
). Let us denote their diagonal elements as $\theta _{X,i}$
and
$\theta _{X,i}$
and $\theta _{YX,i}$
, respectively. Then, we can express the distributions of
$\theta _{YX,i}$
, respectively. Then, we can express the distributions of $\hat {\tau }_X^2$
and
$\hat {\tau }_X^2$
and $\hat {\tau }_{YX}$
as
$\hat {\tau }_{YX}$
as
 $$ \begin{align} \hat{\tau}_X^2 &\sim \text{Gamma} (k_{sum1}, \theta_{sum1}) \end{align} $$
 $$ \begin{align} k_{sum1} &= \frac{ \left(\sum_{i}\theta_{X,i} \right)^2 }{2 \sum_{i} \theta_{X,i}^2}, \theta_{sum1} = \frac{\sum_{i} \theta_{X,i}^2}{ \sum_{i} \theta_{X,i} } \nonumber\\\hat{\tau}_{YX} &\sim \text{Gamma} (k_{sum2}, \theta_{sum2}) \\k_{sum2} &= \frac{ \left(\sum_{i}\theta_{YX,i} \right)^2 }{2 \sum_{i} \theta_{YX,i}^2}, \theta_{sum2} = \frac{\sum_{i} \theta_{YX,i}^2}{ \sum_{i} \theta_{YX,i} }. \nonumber \end{align} $$
Using these distributions, we can find the distribution of the ML estimator. It is well known that the ratio of two independent gamma-distributed random variables follows F distribution. The independence of $\hat {\tau }_X^2$
and
$\hat {\tau }_X^2$
and $\hat {\tau }_{YX}$
is not directly clear, but it follows from the approximation of the sum of Gamma-distributions. Therefore, the ML estimator’s distribution is
$\hat {\tau }_{YX}$
is not directly clear, but it follows from the approximation of the sum of Gamma-distributions. Therefore, the ML estimator’s distribution is
 $$ \begin{align} \frac{k_{sum1} \theta_{sum1}} { k_{sum2} \theta_{sum2} } \hat{\beta}_b \sim F(2 k_{sum2},2 k_{sum1} ). \end{align} $$
Next, we derive the distribution of the Bayesian estimator. Since it includes the two parameters $\tau _0^2$
and
$\tau _0^2$
and $\omega $
, we need to adjust the process of derivation and find the distribution of the denominator first.
$\omega $
, we need to adjust the process of derivation and find the distribution of the denominator first.
The denominator is $(1 - \omega ) \tau _0^2 + \omega \hat {\tau }_X^2$
and consists of a stochastic part
$(1 - \omega ) \tau _0^2 + \omega \hat {\tau }_X^2$
and consists of a stochastic part $\omega \hat {\tau }_X^2$
and deterministic part
$\omega \hat {\tau }_X^2$
and deterministic part $(1 - \omega ) \tau _0^2$
. To sum them up, we replace the deterministic part with the sequence of random variables
$(1 - \omega ) \tau _0^2$
. To sum them up, we replace the deterministic part with the sequence of random variables $t_m$
, which converges (in probability) to this deterministic part:
$t_m$
, which converges (in probability) to this deterministic part:
 $$ \begin{align} t_m \sim \text{Gamma} \left( m \tau_0^2, \frac{1}{m} \right). \end{align} $$
Further, we substitute $\tau _0^2$
with
$\tau _0^2$
with $t_m$
and yield a sum of gamma-distributed random variables. Using once more the approach from Welch (Reference Welch1947) and Satterthwaite (Reference Satterthwaite1946), we compute a sum as a new sequence of random variables that follows a Gamma distribution with parameters
$t_m$
and yield a sum of gamma-distributed random variables. Using once more the approach from Welch (Reference Welch1947) and Satterthwaite (Reference Satterthwaite1946), we compute a sum as a new sequence of random variables that follows a Gamma distribution with parameters $k_{B,m}$
and
$k_{B,m}$
and $\theta _{B,m}$
:
$\theta _{B,m}$
:
 $$ \begin{align} k_{B,m} &= \frac{ (\omega \theta_{sum1} k_{sum1} + (1-\omega) \tau_0^2)^2 }{ \omega^2 \theta_{sum1}^2 k_{sum1} + \frac{(1 - \omega)^2}{m^2} m \tau_0^2} \end{align} $$
 $$ \begin{align} \theta_{B,m} &= \frac{\omega \theta_{sum1} k_{sum1} + (1-\omega) \tau_0^2 }{k_{B,m}}. \end{align} $$
The limit is the Gamma $(k_B,\theta _B)$
distribution with parameters:
$(k_B,\theta _B)$
distribution with parameters:
 $$ \begin{align} k_B &= \lim_{m \rightarrow \infty} k_{B,m} = \frac{ (\omega \theta_{sum1} k_{sum1} + (1-\omega) \tau_0^2)^2 }{ \omega^2 \theta_{sum1}^2 k_{sum1} } \end{align} $$
 $$ \begin{align} \theta_B &= \lim_{m \rightarrow \infty} \theta_{B,m} = \frac{\omega^2 \theta_{sum1}^2 k_{sum1} } { \omega \theta_{sum1} k_{sum1} + (1-\omega) \tau_0^2 }. \end{align} $$
Using the derived distribution of the denominator, similarly to the ML estimator, we yield the total distribution of the Bayesian estimator:
 $$ \begin{align} \frac{k_B \theta_B} { k_{sum2} \theta_{sum2} } \tilde{\beta}_b \sim F(2 k_{sum2},2 k_B ). \end{align} $$
After computing the distributions of the ML estimator (Equation (D.5)) and the Bayesian estimator (Equation (D.11)), we use them to calculate biases and variances of the estimators and thus their MSEs as
 $$ \begin{align} & MSE(\hat{\beta}_b) = \frac{k_{sum2} \theta_{sum2}^2 (k_{sum1} + k_{sum2} - 1)} { \theta_{sum1}^2 (k_{sum1} - 1)^2 (k_{sum1}-2) } + \left( \frac{ k_{sum2} \theta_{sum2} }{ (k_{sum1} - 1) \theta_{sum1} } - \beta_b \right)^2 \end{align} $$
 $$ \begin{align} & MSE(\tilde{\beta}_b) = \frac{k_{sum2} \theta_{sum2}^2 (k_B + k_{sum2} - 1)} { \theta_B^2 (k_B - 1)^2 (k_B-2) } + \left( \frac{ k_{sum2} \theta_{sum2} }{ (k_B - 1) \theta_B } - \beta_b \right)^2. \end{align} $$
Appendix E: Estimation algorithm
Finally, we introduce a novel and practical algorithm based on the theoretical investigations made in the main part of the article. This algorithm aims to provide an efficient and effective solution for computing the regularized Bayesian estimator:
-
1. Input data: n, J,
$X_{ij}$
, and
$Y_{ij.}$
-
2. Define matrix A from Equation (F.1) of Appendix F.
-
3. Calculate the (manifest) group means:
$\overline {X}_{\bullet j}$
of X from Equation (B.3) in Appendix B and
$\overline {Y}_{\bullet j}$
of Y from Equation (B.4) in Appendix B. -
4. Calculate the overall means:
$\overline {X}_{\bullet \bullet }$
of X from Equation (B.5) in Appendix B and
$\overline {Y}_{\bullet \bullet }$
of Y from Equation (B.6) in Appendix B. -
5. Compute
$\hat {\tau }_X^2$
from Equation (B.13) in Appendix B and
$\hat {\tau }_{YX}^2$
from Equation (B.16) in Appendix B as well as (E.1)
$$ \begin{align} \hat{\tau}_Y^2 &= - \frac{1}{n(n-1)J} \sum_{j=1}^{J} \sum_{i=1}^{n} Y_{ij}^2 + \frac{nJ-1}{(n-1)(J-1)J} \sum_{j=1}^{J} \overline{Y}_{\bullet j}^2 - \frac{J}{J-1} \overline{Y}_{\bullet \bullet}^2 \end{align} $$
(E.2)
$$ \begin{align} \hat{\sigma}_X^2 &= \frac{1}{(n-1)J} \sum_{j=1}^{J} \sum_{i=1}^{n} X_{ij}^2 - \frac{n}{(n-1)J} \sum_{j=1}^{J} \overline{X}_{\bullet j}^2 \end{align} $$
(E.3)
$$ \begin{align} \hat{\sigma}_{YX} &= \frac{1}{(n-1)J} \sum_{j=1}^{J} \sum_{i=1}^{n} X_{ij} Y_{ij} - \frac{n}{(n-1)J} \sum_{j=1}^{J} \overline{X}_{\bullet j} \overline{Y}_{\bullet j} \end{align} $$
(E.4)
$$ \begin{align} \hat{\sigma}_Y^2 &= \frac{1}{(n-1)J} \sum_{j=1}^{J} \sum_{i=1}^{n} Y_{ij}^2 - \frac{n}{(n-1)J} \sum_{j=1}^{J} \overline{Y}_{\bullet j}^2. \end{align} $$
-
6. Find the ML estimator
$\hat {\beta }_b$
from Equation (6). -
7. Compute diagonal matrices of eigenvalues
$D_X$
(page 44),
$D_Y$
(page 46),
$D_{YX}$
(page 48), and matrix of eigenvectors V from Equation (F.2) of Appendix F. -
8. Calculate the square root matrices
$S_X = \sqrt {D_X}$
and
$S_Y = \sqrt {D_Y}$
. -
9. Compute the diagonal matrix of coefficients
$L_1 = S_X V' A V S_X.$
-
10. Calculate matrix Q from Equation (C.15) in Appendix C.
-
11. Compute the diagonal matrix of eigenvalues
$D_H$
from Equation (C.13) of Appendix C and eigenvectors matrix
$V_H$
from Equation (F.6) of Appendix F. -
12. Calculate the square root matrix
$S_H = \sqrt {D_H.}$
-
13. Compute the diagonal matrix of coefficients
$L_2 = S_H V_H' Q V_H S_H.$
-
14. Compute the coefficients
$k_{sum1}$
,
$\theta _{sum1}$
,
$k_{sum2,}$
and
$\theta _{sum2}$
(note that is a vector of ones): (E.5)(E.6)(E.7)(E.8) -
15. Define vectors W and
$T_{02}$
, with the values of
$\omega $
and
$\tau _0^2$
that specify grid search region. For example, W goes from
$0$
to
$1$
by steps of
$0.01$
, and
$T_{02}$
goes from
$0.1$
to
$10$
by steps of
$0.1$
-
16. Compute the MSE for each value of W and
$T_{02}$
, whereby
$\beta _b$
should be substituted with
$\hat {\beta }_b$
. The final formula is delineated as (E.9) -
17. Find the minimum MSE and indexes
$i^*$
and
$j^*$
that provide this minimum. -
18. Define the optimal parameters
$\omega ^* = W(i^*)$
and
$\tau _0^{2*} = T_{02}(j^*).$
-
19. Compute the optimally regularized Bayesian estimator as
(E.10)
$$ \begin{align} \tilde{\beta}_b = \frac{\hat{\tau}_{YX}}{(1-\omega^*) \tau_0^{2*} + \omega^* \hat{\tau}_X^2}. \end{align} $$


Appendix F: Matrices
 $$ \begin{align} A = \begin{pmatrix} - \frac{1}{n(n-1)J} & \dots & 0 & 0 & \dots & 0 & 0\\ 0 & \ddots& 0 & 0 & \dots & 0 & 0\\ 0 & \dots & - \frac{1}{n(n-1)J} & 0 & \dots & 0 & 0\\ 0 & \dots & 0 &\frac{nJ-1}{(n-1)(J-1)J} & \dots & 0 & 0\\ 0 & \dots & 0 & 0 & \ddots & 0 & 0\\ 0 & \dots & 0 & 0 & \dots & \frac{nJ-1}{(n-1)(J-1)J} & 0\\ 0 &\dots & 0 & 0 & \dots & 0 & - \frac{J}{J-1} \end{pmatrix} \end{align} $$
 $$ \begin{align} \begin{aligned} V = \left( \begin{matrix} -\frac{1}{\sqrt{n\,\left(n+1\right)}} & 0 & 0 & 0 & -\frac{1}{\sqrt{\left(J+J\,n\right)\,\left(J+J\,n+1\right)}} & -\frac{\sqrt{2}}{2} & -\frac{\sqrt{6}}{6} & 0 & \dots \\ 0 & 0 & 0 & 0 & 0 & 0 & -\frac{\sqrt{2}}{2\,\sqrt{n+1}} & -\frac{\sqrt{6}}{6\,\sqrt{n+1}} & \dots \\ -\frac{1}{\sqrt{n\,\left(n+1\right)}} & 0 & 0 & 0 & -\frac{1}{\sqrt{\left(J+J\,n\right)\,\left(J+J\,n+1\right)}} & \frac{\sqrt{2}}{2} & -\frac{\sqrt{6}}{6} & 0 & \dots \\ 0 & -\frac{1}{\sqrt{n\,\left(n+1\right)}} & 0 & 0 & -\frac{1}{\sqrt{\left(J+J\,n\right)\,\left(J+J\,n+1\right)}} & 0 & 0 & -\frac{\sqrt{2}}{2} & \dots \\ 0 & -\frac{1}{\sqrt{n\,\left(n+1\right)}} & 0 & 0 & -\frac{1}{\sqrt{\left(J+J\,n\right)\,\left(J+J\,n+1\right)}} & 0 & 0 & \frac{\sqrt{2}}{2} & \dots \\ 0 & -\frac{1}{\sqrt{n\,\left(n+1\right)}} & 0 & 0 & -\frac{1}{\sqrt{\left(J+J\,n\right)\,\left(J+J\,n+1\right)}} & 0 & 0 & 0 & \dots \\ 0 & 0 & -\frac{1}{\sqrt{n\,\left(n+1\right)}} & 0 & -\frac{1}{\sqrt{\left(J+J\,n\right)\,\left(J+J\,n+1\right)}} & 0 & 0 & 0 & \dots \\ 0 & 0 & -\frac{1}{\sqrt{n\,\left(n+1\right)}} & 0 & -\frac{1}{\sqrt{\left(J+J\,n\right)\,\left(J+J\,n+1\right)}} & 0 & 0 & 0 & \dots \\ 0 & 0 & -\frac{1}{\sqrt{n\,\left(n+1\right)}} & 0 & -\frac{1}{\sqrt{\left(J+J\,n\right)\,\left(J+J\,n+1\right)}} & 0 & 0 & 0 & \dots \\ 0 & 0 & 0 & -\frac{1}{\sqrt{n\,\left(n+1\right)}} & -\frac{1}{\sqrt{\left(J+J\,n\right)\,\left(J+J\,n+1\right)}} & 0 & 0 & 0 & \dots \\ 0 & 0 & 0 & -\frac{1}{\sqrt{n\,\left(n+1\right)}} & -\frac{1}{\sqrt{\left(J+J\,n\right)\,\left(J+J\,n+1\right)}} & 0 & 0 & 0 & \dots \\ 0 & 0 & 0 & -\frac{1}{\sqrt{n\,\left(n+1\right)}} & -\frac{1}{\sqrt{\left(J+J\,n\right)\,\left(J+J\,n+1\right)}} & 0 & 0 & 0 & \dots \\ \sqrt{\frac{n}{n+1}} & 0 & 0 & 0 & -\frac{1}{\sqrt{\left(J+J\,n\right)\,\left(J+J\,n+1\right)}} & 0 & 0 & 0 & \dots \\ 0 & \sqrt{\frac{n}{n+1}} & 0 & 0 & -\frac{1}{\sqrt{\left(J+J\,n\right)\,\left(J+J\,n+1\right)}} & 0 & 0 & 0 & \dots \\ 0 & 0 & \sqrt{\frac{n}{n+1}} & 0 & -\frac{1}{\sqrt{\left(J+J\,n\right)\,\left(J+J\,n+1\right)}} & 0 & 0 & 0 & \dots \\ 0 & 0 & 0 & \sqrt{\frac{n}{n+1}} & -\frac{1}{\sqrt{\left(J+J\,n\right)\,\left(J+J\,n+1\right)}} & 0 & 0 & 0 & \dots \\ 0 & 0 & 0 & 0 & \sqrt{\frac{J+J\,n}{J+J\,n+1}} & 0 & 0 & \dots \end{matrix} \right.\\ \left. \begin{matrix} 0 & 0 & 0 & 0 & -\frac{\sqrt{2}}{2\,\sqrt{n+1}} & -\frac{\sqrt{6}}{6\,\sqrt{n+1}} & -\frac{\sqrt{3}}{6\,\sqrt{n+1}} & \frac{1}{\sqrt{J+J\,n+1}}\\ 0 & 0 & 0 & 0 & 0 & -\frac{\sqrt{2}}{2\,\sqrt{n+1}} & -\frac{\sqrt{6}}{6\,\sqrt{n+1}} & -\frac{\sqrt{3}}{6\,\sqrt{n+1}} & \frac{1}{\sqrt{J+J\,n+1}}\\ 0 & 0 & 0 & 0 & 0 & -\frac{\sqrt{2}}{2\,\sqrt{n+1}} & -\frac{\sqrt{6}}{6\,\sqrt{n+1}} & -\frac{\sqrt{3}}{6\,\sqrt{n+1}} & \frac{1}{\sqrt{J+J\,n+1}}\\ -\frac{\sqrt{6}}{6} & 0 & 0 & 0 & 0 & \frac{\sqrt{2}}{2\,\sqrt{n+1}} & -\frac{\sqrt{6}}{6\,\sqrt{n+1}} & -\frac{\sqrt{3}}{6\,\sqrt{n+1}} & \frac{1}{\sqrt{J+J\,n+1}}\\ -\frac{\sqrt{6}}{6} & 0 & 0 & 0 & 0 & \frac{\sqrt{2}}{2\,\sqrt{n+1}} & -\frac{\sqrt{6}}{6\,\sqrt{n+1}} & -\frac{\sqrt{3}}{6\,\sqrt{n+1}} & \frac{1}{\sqrt{J+J\,n+1}}\\ \frac{\sqrt{2}\,\sqrt{3}}{3} & 0 & 0 & 0 & 0 & \frac{\sqrt{2}}{2\,\sqrt{n+1}} & -\frac{\sqrt{6}}{6\,\sqrt{n+1}} & -\frac{\sqrt{3}}{6\,\sqrt{n+1}} & \frac{1}{\sqrt{J+J\,n+1}}\\ 0 & -\frac{\sqrt{2}}{2} & -\frac{\sqrt{6}}{6} & 0 & 0 & 0 & \frac{\sqrt{6}}{3\,\sqrt{n+1}} & -\frac{\sqrt{3}}{6\,\sqrt{n+1}} & \frac{1}{\sqrt{J+J\,n+1}}\\ 0 & \frac{\sqrt{2}}{2} & -\frac{\sqrt{6}}{6} & 0 & 0 & 0 & \frac{\sqrt{6}}{3\,\sqrt{n+1}} & -\frac{\sqrt{3}}{6\,\sqrt{n+1}} & \frac{1}{\sqrt{J+J\,n+1}}\\ 0 & 0 & \frac{\sqrt{2}\,\sqrt{3}}{3} & 0 & 0 & 0 & \frac{\sqrt{6}}{3\,\sqrt{n+1}} & -\frac{\sqrt{3}}{6\,\sqrt{n+1}} & \frac{1}{\sqrt{J+J\,n+1}}\\ 0 & 0 & 0 & -\frac{\sqrt{2}}{2} & -\frac{\sqrt{6}}{6} & 0 & 0 & \frac{\sqrt{3}}{2\,\sqrt{n+1}} & \frac{1}{\sqrt{J+J\,n+1}}\\ 0 & 0 & 0 & \frac{\sqrt{2}}{2} & -\frac{\sqrt{6}}{6} & 0 & 0 & \frac{\sqrt{3}}{2\,\sqrt{n+1}} & \frac{1}{\sqrt{J+J\,n+1}}\\ 0 & 0 & 0 & 0 & \frac{\sqrt{2}\,\sqrt{3}}{3} & 0 & 0 & \frac{\sqrt{3}}{2\,\sqrt{n+1}} & \frac{1}{\sqrt{J+J\,n+1}}\\ 0 & 0 & 0 & 0 & 0 & -\frac{\sqrt{2}}{2\,\sqrt{n+1}} & -\frac{\sqrt{6}}{6\,\sqrt{n+1}} & -\frac{\sqrt{3}}{6\,\sqrt{n+1}} & \frac{1}{\sqrt{J+J\,n+1}}\\ 0 & 0 & 0 & 0 & 0 & \frac{\sqrt{2}}{2\,\sqrt{n+1}} & -\frac{\sqrt{6}}{6\,\sqrt{n+1}} & -\frac{\sqrt{3}}{6\,\sqrt{n+1}} & \frac{1}{\sqrt{J+J\,n+1}}\\ 0 & 0 & 0 & 0 & 0 & 0 & \frac{\sqrt{6}}{3\,\sqrt{n+1}} & -\frac{\sqrt{3}}{6\,\sqrt{n+1}} & \frac{1}{\sqrt{J+J\,n+1}}\\ 0 & 0 & 0 & 0 & 0 & 0 & 0 & \frac{\sqrt{3}}{2\,\sqrt{n+1}} & \frac{1}{\sqrt{J+J\,n+1}}\\ 0 & 0 & 0 & 0 & 0 & 0 & 0 & 0 & \frac{1}{\sqrt{J+J\,n+1}} \end{matrix} \right) \end{aligned}\\[100pt]\nonumber \end{align} $$
 $$ \begin{align} \Sigma_X = \begin{pmatrix} \tau_X^2+\sigma_X^2 & \tau_X^2 & 0 & \dots & 0 & 0 & \tau_X^2+\frac{1}{n}\sigma_X^2 & 0 & \frac{1}{J}\tau_X^2+\frac{1}{nJ}\sigma_X^2 \\ \dots & \dots & \dots & \dots & \dots & \dots & \dots & \dots & \dots \\ \tau_X^2 & \tau_X^2+\sigma_X^2 & 0 & \dots & 0 & 0 & \tau_X^2+\frac{1}{n}\sigma_X^2 & 0 & \frac{1}{J}\tau_X^2+\frac{1}{nJ}\sigma_X^2 \\ 0 & 0 & \tau_X^2+\sigma_X^2 & \dots & \tau_X^2 & 0 & 0 & 0 & \frac{1}{J}\tau_X^2+\frac{1}{nJ}\sigma_X^2 \\ \dots & \dots & \dots & \dots & \dots & \dots & \dots & \dots & \frac{1}{J}\tau_X^2+\frac{1}{nJ}\sigma_X^2 \\ 0 & 0 & \tau_X^2 & \dots & \tau_X^2+\sigma_X^2 & 0 & 0 & 0 & \frac{1}{J}\tau_X^2+\frac{1}{nJ}\sigma_X^2 \\ \dots & \dots & \dots & \dots & \dots & \dots & \dots & \dots & \dots & \dots \\ 0 & 0 & 0 & \dots & 0 & \tau_X^2+\sigma_X^2 & 0 & \tau_X^2+\frac{1}{n}\sigma_X^2 & \frac{1}{J}\tau_X^2+\frac{1}{nJ}\sigma_X^2 \\ \tau_X^2+\frac{1}{n}\sigma_X^2 & \tau_X^2+\frac{1}{n}\sigma_X^2 & 0 & \dots & 0 & 0 & \tau_X^2+\frac{1}{n}\sigma_X^2 & 0 & \frac{1}{J}\tau_X^2+\frac{1}{nJ}\sigma_X^2 \\ \dots & \dots & \dots & \dots & \dots & \dots & \dots & \dots & \dots & \dots \\ 0 & 0 & 0 & \dots & 0 & \tau_X^2+\frac{1}{n}\sigma_X^2 & 0 & \tau_X^2+\frac{1}{n}\sigma_X^2 & \frac{1}{J}\tau_X^2+\frac{1}{nJ}\sigma_X^2 \\ \frac{1}{J}\tau_X^2+\frac{1}{nJ}\sigma_X^2 & \frac{1}{J}\tau_X^2+\frac{1}{nJ}\sigma_X^2 & \frac{1}{J}\tau_X^2+\frac{1}{nJ}\sigma_X^2 & \dots & \frac{1}{J}\tau_X^2+\frac{1}{nJ}\sigma_X^2 & \frac{1}{J}\tau_X^2+\frac{1}{nJ}\sigma_X^2 & \frac{1}{J}\tau_X^2+\frac{1}{nJ}\sigma_X^2 & \frac{1}{J}\tau_X^2+\frac{1}{nJ}\sigma_X^2 & \frac{1}{J}\tau_X^2+\frac{1}{nJ}\sigma_X^2 \end{pmatrix} \end{align} $$
 $$ \begin{align} \Sigma_Y = \begin{pmatrix} \tau_Y^2+\sigma_Y^2 & \tau_Y^2 & 0 & \dots & 0 & 0 & \tau_Y^2+\frac{1}{n}\sigma_Y^2 & 0 & \frac{1}{J}\tau_Y^2+\frac{1}{nJ}\sigma_Y^2 \\ \dots & \dots & \dots & \dots & \dots & \dots & \dots & \dots & \dots \\ \tau_Y^2 & \tau_Y^2+\sigma_Y^2 & 0 & \dots & 0 & 0 & \tau_Y^2+\frac{1}{n}\sigma_Y^2 & 0 & \frac{1}{J}\tau_Y^2+\frac{1}{nJ}\sigma_Y^2 \\ 0 & 0 & \tau_Y^2+\sigma_Y^2 & \dots & \tau_Y^2 & 0 & 0 & 0 & \frac{1}{J}\tau_Y^2+\frac{1}{nJ}\sigma_Y^2 \\ \dots & \dots & \dots & \dots & \dots & \dots & \dots & \dots & \frac{1}{J}\tau_Y^2+\frac{1}{nJ}\sigma_Y^2 \\ 0 & 0 & \tau_Y^2 & \dots & \tau_Y^2+\sigma_Y^2 & 0 & 0 & 0 & \frac{1}{J}\tau_Y^2+\frac{1}{nJ}\sigma_Y^2 \\ \dots & \dots & \dots & \dots & \dots & \dots & \dots & \dots & \dots & \dots \\ 0 & 0 & 0 & \dots & 0 & \tau_Y^2+\sigma_Y^2 & 0 & \tau_Y^2+\frac{1}{n}\sigma_Y^2 & \frac{1}{J}\tau_Y^2+\frac{1}{nJ}\sigma_Y^2 \\ \tau_Y^2+\frac{1}{n}\sigma_Y^2 & \tau_Y^2+\frac{1}{n}\sigma_Y^2 & 0 & \dots & 0 & 0 & \tau_Y^2+\frac{1}{n}\sigma_Y^2 & 0 & \frac{1}{J}\tau_Y^2+\frac{1}{nJ}\sigma_Y^2 \\ \dots & \dots & \dots & \dots & \dots & \dots & \dots & \dots & \dots & \dots \\ 0 & 0 & 0 & \dots & 0 & \tau_Y^2+\frac{1}{n}\sigma_Y^2 & 0 & \tau_Y^2+\frac{1}{n}\sigma_Y^2 & \frac{1}{J}\tau_Y^2+\frac{1}{nJ}\sigma_Y^2 \\ \frac{1}{J}\tau_Y^2+\frac{1}{nJ}\sigma_Y^2 & \frac{1}{J}\tau_Y^2+\frac{1}{nJ}\sigma_Y^2 & \frac{1}{J}\tau_Y^2+\frac{1}{nJ}\sigma_Y^2 & \dots & \frac{1}{J}\tau_Y^2+\frac{1}{nJ}\sigma_Y^2 & \frac{1}{J}\tau_Y^2+\frac{1}{nJ}\sigma_Y^2 & \frac{1}{J}\tau_Y^2+\frac{1}{nJ}\sigma_Y^2 & \frac{1}{J}\tau_Y^2+\frac{1}{nJ}\sigma_Y^2 & \frac{1}{J}\tau_Y^2+\frac{1}{nJ}\sigma_Y^2 \end{pmatrix} \end{align} $$
 $$ \begin{align} \Sigma_{YX} = \begin{pmatrix} \tau_{YX}+\sigma_{YX} & \tau_{YX} & 0 & \dots & 0 & 0 & \tau_{YX}+\frac{1}{n}\sigma_{YX} & 0 & \frac{1}{J}\tau_{YX}+\frac{1}{nJ}\sigma_{YX} \\ \dots & \dots & \dots & \dots & \dots & \dots & \dots & \dots & \dots \\ \tau_{YX} & \tau_{YX}+\sigma_{YX} & 0 & \dots & 0 & 0 & \tau_{YX}+\frac{1}{n}\sigma_{YX} & 0 & \frac{1}{J}\tau_{YX}+\frac{1}{nJ}\sigma_{YX} \\ 0 & 0 & \tau_{YX}+\sigma_{YX} & \dots & \tau_{YX} & 0 & 0 & 0 & \frac{1}{J}\tau_{YX}+\frac{1}{nJ}\sigma_{YX} \\ \dots & \dots & \dots & \dots & \dots & \dots & \dots & \dots & \frac{1}{J}\tau_{YX}+\frac{1}{nJ}\sigma_{YX} \\ 0 & 0 & \tau_{YX} & \dots & \tau_{YX}+\sigma_{YX} & 0 & 0 & 0 & \frac{1}{J}\tau_{YX}+\frac{1}{nJ}\sigma_{YX} \\ \dots & \dots & \dots & \dots & \dots & \dots & \dots & \dots & \dots & \dots \\ 0 & 0 & 0 & \dots & 0 & \tau_{YX}+\sigma_{YX} & 0 & \tau_{YX}+\frac{1}{n}\sigma_{YX} & \frac{1}{J}\tau_{YX}+\frac{1}{nJ}\sigma_{YX} \\ \tau_{YX}+\frac{1}{n}\sigma_{YX} & \tau_{YX}+\frac{1}{n}\sigma_{YX} & 0 & \dots & 0 & 0 & \tau_{YX}+\frac{1}{n}\sigma_{YX} & 0 & \frac{1}{J}\tau_{YX}+\frac{1}{nJ}\sigma_{YX} \\ \dots & \dots & \dots & \dots & \dots & \dots & \dots & \dots & \dots & \dots \\ 0 & 0 & 0 & \dots & 0 & \tau_{YX}+\frac{1}{n}\sigma_{YX} & 0 & \tau_{YX}+\frac{1}{n}\sigma_{YX} & \frac{1}{J}\tau_{YX}+\frac{1}{nJ}\sigma_{YX} \\ \frac{1}{J}\tau_{YX}+\frac{1}{nJ}\sigma_{YX} & \frac{1}{J}\tau_{YX}+\frac{1}{nJ}\sigma_{YX} & \frac{1}{J}\tau_{YX}+\frac{1}{nJ}\sigma_{YX} & \dots & \frac{1}{J}\tau_{YX}+\frac{1}{nJ}\sigma_{YX} & \frac{1}{J}\tau_{YX}+\frac{1}{nJ}\sigma_{YX} & \frac{1}{J}\tau_{YX}+\frac{1}{nJ}\sigma_{YX} & \frac{1}{J}\tau_{YX}+\frac{1}{nJ}\sigma_{YX} & \frac{1}{J}\tau_{YX}+\frac{1}{nJ}\sigma_{YX} \end{pmatrix} \end{align} $$
 $$ \begin{align} V_H = \frac{\sqrt{2}}{2} \begin{pmatrix} 1 & 1 & 0 & 0 & 0 & 0 & \dots & 0 & 0\\ 0 & 0 & 1 & 1 & 0 & 0 & \dots & 0 & 0\\ 0 & 0 & 0 & 0 & 1 & 1 & \dots & 0 & 0\\ 0 & 0 & 0 & 0 & 0 & 0 & \dots & 1 & 1\\ \dots & \dots & \dots & \dots & \dots & \dots & \ddots & \dots & \dots\\ 1 &-1 & 0 & 0 & 0 & 0 & \dots & 0 & 0\\ 0 & 0 & 1 &-1 & 0 & 0 & \dots & 0 & 0\\ 0 & 0 & 0 & 0 & 1 &-1 & \dots & 0 & 0\\ 0 & 0 & 0 & 0 & 0 & 0 & \dots & 0 & 0\\ 0 & 0 & 0 & 0 & 0 & 0 & \dots & 1 &-1 \end{pmatrix} \end{align} $$
Appendix G: Tables
RMSE values of the ML (RMSE $_{\text {ML}}$
) and the Bayesian estimators (RMSE
$_{\text {ML}}$
) and the Bayesian estimators (RMSE $_{\text {Bay}}$
represents the Bayesian with
$_{\text {Bay}}$
represents the Bayesian with $\beta _b$
and RMSE
$\beta _b$
and RMSE $_{\text {BML}}$
represents the Bayesian with
$_{\text {BML}}$
represents the Bayesian with $\hat {\beta }_b$
) for ICC
$\hat {\beta }_b$
) for ICC $_X=0.05$
and different values of n, J,
$_X=0.05$
and different values of n, J, $\beta _b$
, and
$\beta _b$
, and $\beta _w$

RMSE values of the ML (RMSE $_{\text {ML}}$
) and the Bayesian estimators (RMSE
$_{\text {ML}}$
) and the Bayesian estimators (RMSE $_{\text {Bay}}$
represents the Bayesian with
$_{\text {Bay}}$
represents the Bayesian with $\beta _b$
and RMSE
$\beta _b$
and RMSE $_{\text {BML}}$
represents the Bayesian with
$_{\text {BML}}$
represents the Bayesian with $\hat {\beta }_b$
) for ICC
$\hat {\beta }_b$
) for ICC $_X=0.1$
and different values of n, J,
$_X=0.1$
and different values of n, J, $\beta _b$
, and
$\beta _b$
, and $\beta _w$

RMSE values of the ML (RMSE $_{\text {ML}}$
) and the Bayesian estimators (RMSE
$_{\text {ML}}$
) and the Bayesian estimators (RMSE $_{\text {Bay}}$
represents the Bayesian with
$_{\text {Bay}}$
represents the Bayesian with $\beta _b$
and RMSE
$\beta _b$
and RMSE $_{\text {BML}}$
represents the Bayesian with
$_{\text {BML}}$
represents the Bayesian with ${\hat {\beta }}_b$
) for ICC
${\hat {\beta }}_b$
) for ICC $_X=0.3$
and different values of n, J,
$_X=0.3$
and different values of n, J, $\beta _b$
, and
$\beta _b$
, and $\beta _w$

RMSE values of the ML (RMSE $_{\text {ML}}$
) and the Bayesian estimators (RMSE
$_{\text {ML}}$
) and the Bayesian estimators (RMSE $_{\text {Bay}}$
represents the Bayesian with
$_{\text {Bay}}$
represents the Bayesian with $\beta _b$
and RMSE
$\beta _b$
and RMSE $_{\text {BML}}$
represents the Bayesian with
$_{\text {BML}}$
represents the Bayesian with $\hat {\beta }_b$
) for ICC
$\hat {\beta }_b$
) for ICC $_X=0.5$
and different values of n, J,
$_X=0.5$
and different values of n, J, $\beta _b$
, and
$\beta _b$
, and $\beta _w$

Relative bias in % of the ML (BiasML) and the Bayesian estimators (BiasBay represents the Bayesian with $\beta _b$
and BiasBML represents the Bayesian with
$\beta _b$
and BiasBML represents the Bayesian with $\hat {\beta }_b$
) for ICC
$\hat {\beta }_b$
) for ICC $_X=0.05$
and different values of n, J,
$_X=0.05$
and different values of n, J, $\beta _b$
, and
$\beta _b$
, and $\beta _w$

Relative bias in % of the ML (Bias $_{\text {ML}}$
) and the Bayesian estimators (Bias
$_{\text {ML}}$
) and the Bayesian estimators (Bias $_{\text {Bay}}$
) represents the Bayesian with
$_{\text {Bay}}$
) represents the Bayesian with $\beta _b$
and Bias
$\beta _b$
and Bias $_{\text {BML}}$
represents the Bayesian with
$_{\text {BML}}$
represents the Bayesian with $\hat {\beta }_b$
) for ICC
$\hat {\beta }_b$
) for ICC $_X=0.1$
and different values of n, J,
$_X=0.1$
and different values of n, J, $\beta _b$
, and
$\beta _b$
, and $\beta _w$

Relative bias in % of the ML (Bias $_{\text {ML}}$
) and the Bayesian estimators (Bias
$_{\text {ML}}$
) and the Bayesian estimators (Bias $_{\text {Bay}}$
represents the Bayesian with
$_{\text {Bay}}$
represents the Bayesian with $\beta _b$
and BiasBML represents the Bayesian with
$\beta _b$
and BiasBML represents the Bayesian with $\hat {\beta }_b$
) for ICC
$\hat {\beta }_b$
) for ICC $_X=0.3$
and different values of n, J,
$_X=0.3$
and different values of n, J, $\beta _b$
, and
$\beta _b$
, and $\beta _w$

Relative bias in % of the ML (Bias $_{\text {ML}}$
) and the Bayesian estimators (Bias
$_{\text {ML}}$
) and the Bayesian estimators (Bias $_{\text {Bay}}$
represents the Bayesian with
$_{\text {Bay}}$
represents the Bayesian with $\beta _b$
and Bias
$\beta _b$
and Bias $_{\text {BML}}$
represents the Bayesian with
$_{\text {BML}}$
represents the Bayesian with $\hat {\beta }_b$
) for ICC
$\hat {\beta }_b$
) for ICC $_X=0.5$
and different values of n, J,
$_X=0.5$
and different values of n, J, $\beta _b$
, and
$\beta _b$
, and $\beta _w$


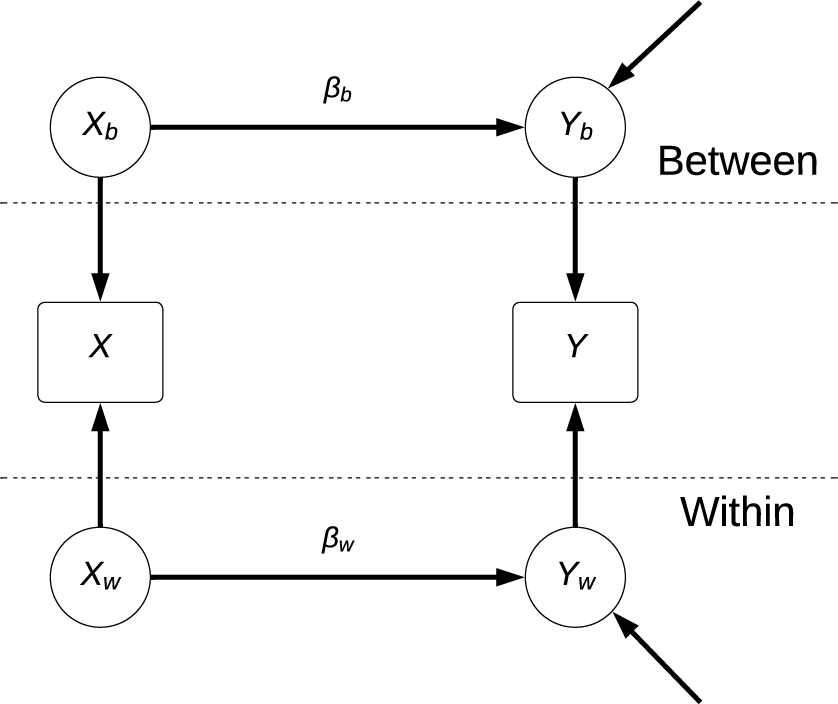


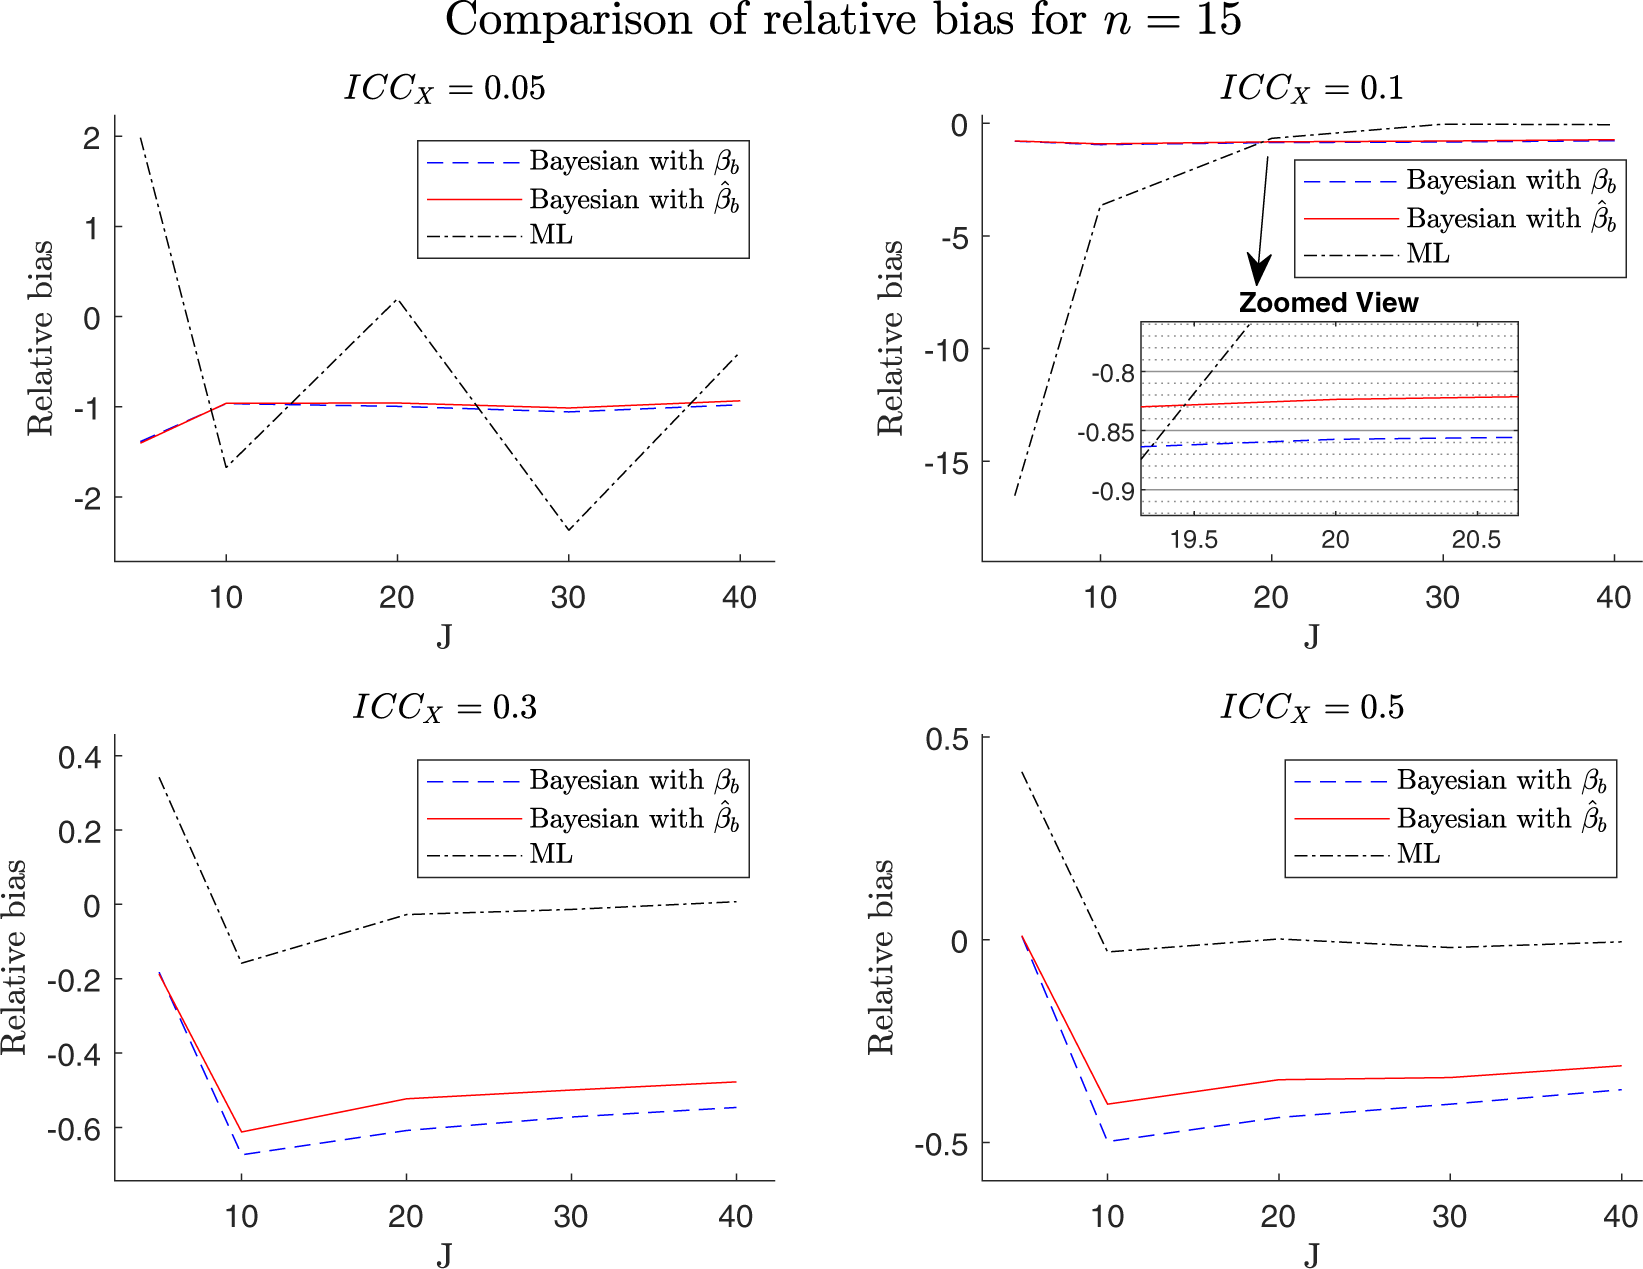


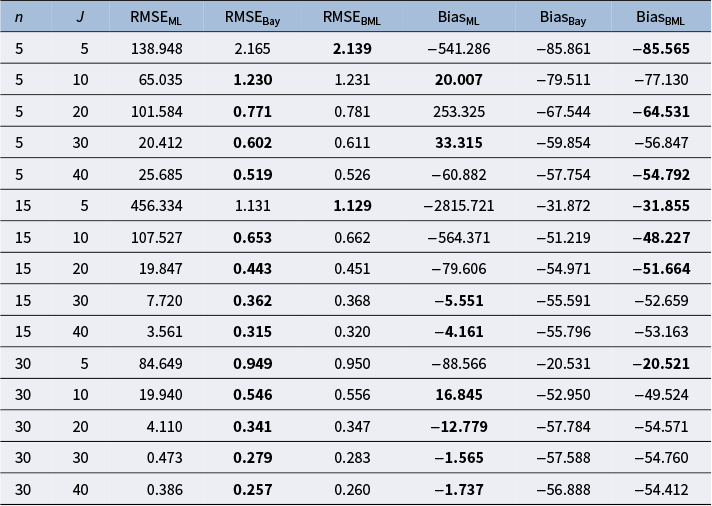


 Open access