

Postprandial lipaemia, a delayed clearance of postprandial TAG, is considered a CVD risk factor(Reference Stanner1). Recent reviews(Reference Gill and Hardman2, Reference Petitt and Cureton3) have indicated that aerobic exercise has favourable effects on the attenuation of elevated postprandial TAG concentrations.
The majority of previous studies have employed a meal of high-fat content (over 60 % total energy) to examine the effect of exercise on postprandial TAG concentrations (for a review of these studies see Gill & Hardman(Reference Gill and Hardman2) and Petitt & Cureton(Reference Petitt and Cureton3)). This is not surprising since a greater amount of fat ingested induces a greater increase in postprandial TAG response(Reference Dubois, Beaumier, Juhel, Armand, Portugal, Pauli, Borel, Latge and Lairon4) which makes it easier to examine the magnitude of exercise effect, if any, on a reduction in postprandial TAG concentrations compared with the control (no exercise). However, such high-fat test meals usually do not reflect real-life situations.
To date, six studies have examined the effect of aerobic exercise on postprandial TAG concentrations after a meal(s) of moderate-fat content in young adults. Two of these reported a lowering(Reference Kolifa, Petridou and Mougios5, Reference Kokalas, Petridou, Nikolaidis and Mougios6) and four reported no change(Reference Petridou, Gerkos, Kolifa, Nikolaidis, Simos and Mougios7–Reference James, Slivkoff-Clark and Mamo10) in postprandial TAG concentrations after a single bout of aerobic exercise. These discrepant findings may be related to the energy expenditure during exercise and the timing of exercise (exercise performed the day before the consumption of the test meal or on the same day as the test meal(s) are consumed) since these are thought to be related to the exercise-induced reduction in postprandial TAG concentrations(Reference Gill and Hardman2). However, out of three studies using a 2 d model (i.e. exercise on day 1 and postprandial testing on day 2) and a large volume of exercise, two(Reference Kolifa, Petridou and Mougios5, Reference Kokalas, Petridou, Nikolaidis and Mougios6) have shown a lowering in postprandial TAG concentrations with an exercise energy expenditure of 2·3 and 4·2 MJ, respectively), whereas another(Reference James, Slivkoff-Clark and Mamo10) has failed to show an exercise-induced postprandial TAG lowering effect with an energy expenditure of 2·4 MJ. It is not known why such discrepant findings were observed between the studies in which the volume of exercise performed was similar(Reference Kolifa, Petridou and Mougios5, Reference James, Slivkoff-Clark and Mamo10). On the basis of current literature, the effects of aerobic exercise performed on postprandial TAG concentrations after a meal of moderate-fat content are unclear, and therefore further research is required to investigate the effect of exercise on postprandial lipaemia after a meal of moderate-fat content. Moreover, with respect to physical activity guidelines for health(Reference Pate, Pratt and Blair11, 12), further research is needed to determine whether prior exercise with short duration and lower intensity is effective for lowering postprandial TAG concentrations after a meal of moderate-fat content. Such research implication would be useful from a public health viewpoint.
Therefore, the purpose of the study was to examine the effect of 30 min of moderate-intensity exercise on postprandial TAG concentrations after subjects consumed a meal of moderate-fat content. In addition, serum pre-heparin lipoprotein lipase (LPL) concentration (LPL concentration measured in serum without intravenous injection of heparin) was measured since it has significant relationships with serum TAG concentration and the development of coronary atherosclerosis(Reference Kobayashi, Nohara, Kawashiri, Inazu, Koizumi, Nakajima and Mabuchi13), and no studies are available to examine the effect of an acute bout of exercise on pre-heparin LPL concentration.
Experimental methods
Subjects
After approval from the University of Tsukuba Ethics Committee, twelve healthy males aged 20–28 years gave their written informed consent to participate in the present study. All subjects were recreationally active and had been weight stable ( ± 2·5 kg) for at least 3 months before the study. To minimise risks, subjects were only recruited if they met the following criteria: were non-smoking, were free of known CVD or cardiovascular abnormalities, were not taking any medication known to influence lipid or carbohydrate metabolism, and had resting arterial blood pressure < 140/90 mmHg. The physical characteristics of the subjects were as follows: age 23·7 (sem 0·7) years, height 172·4 (sem 1·0) cm, body mass 71·2 (sem 4·6) kg, BMI 23·9 (sem 1·4) kg/m2 and waist circumference 77·0 (sem 2·9) cm.
Preliminary exercise test
Seven days before the first trial, each subject attended the laboratory for a submaximal-incremental exercise test performed on a cycle ergometer (Monark Exercise AB; Ergomedic 874E, Vansbro, Sweden). This test was to determine the steady-state relationship between power and heart rate. The test was 16 min in duration and was continuous in nature but was divided into four 4 min stages. The initial power was set between 25 and 30 W depending upon each subject's fitness level. The power was increased by 25 or 30 W at the end of each 4 min period depending upon each subject's fitness level. The cadence was maintained at 60 rpm and heart rate was monitored throughout the test using short-range telemetry (Polar FS1, Kempele, Finland). Ratings of perceived exertion were assessed periodically during the test by using the Borg scale(Reference Borg14). At the end of the test the power at each stage was plotted against heart rate at each stage to illustrate the power–heart rate relationship. This regression line was used together with each subject's predicted maximal heart rate (220 − age) to estimate the power eliciting 65 % of predicted maximal heart rate. This power was used in the main trial.
Main trials
Each subject underwent two 2 d trials (exercise and control) separated by an interval of at least 7 d in a randomised, counterbalanced design. Two-day trials were used because skeletal muscle LPL activity is thought to peak >8 h after exercise(Reference Seip, Mair, Cole and Semenkovich15), and this enzyme facilitates the removal of TAG from the blood(Reference Seip and Semenkovich16). Each main trial began at 17.00 hours (day 1) and finished at 13.00 hours the following day (day 2).
On day 1 of each trial, the subjects reported to the laboratory at 17.00 hours having eaten lunch at 13.00 hours. For both trials, a baseline blood sample was collected in a supine position by venepuncture at 17.25 hours (i.e. baseline). For the exercise trial, the subjects cycled on the ergometer for 30 min (17.30–18.00 hours) at the power predicted to elicit 65 % of maximal heart rate in the laboratory. Heart rate was measured every 15 s at 4–5, 9–10, 14–15, 19–20, 24–25 and 29–30 min during the exercise using short-range telemetry. The subjects were blinded to their heart rate so as not to influence their ratings of perceived exertion. Ratings of perceived exertion were assessed simultaneously with the heart rate measurements during the exercise. The cadence was maintained at 60 rpm. Energy expenditure was estimated using the subject body mass and power(17). After the exercise, the subjects rested (sitting reading, writing, working at a computer or watching television) in a room furnished with a bed, desk, chair, computer, telephone, intercom, sink and toilet which was located next to the laboratory, and consumed a standardised evening meal (21·6 g fat, 121·5 g carbohydrate and 28·6 g protein which provided 3·38 MJ energy for each subject, i.e. the meal was not prescribed according to body mass; energy derived was 24 % from fat, 62 % from carbohydrate and 14 % from protein) at 19.30 hours in the room. Thereafter, the subjects were instructed to rest for the remainder of the evening and to sleep at 23.00 hours in the room. For the control trial, the subjects rested from 17.00 to 23.00 hours, consumed an identical standardised evening meal to that consumed during the exercise trial at 19.30 hours, and slept at 23.00 hours in the room.
On day 2 of each trial, after an overnight stay with an 11 h fast (no food or drink except water), the subjects awoke at 06.30 hours but they were asked to remain inactive in the room. A fasting blood sample was collected in a supine position by venepuncture at 07.00 hours. The subjects then consumed a standardised test meal for breakfast. A clock was started when subjects began eating, and they were required to rest (sitting reading, writing, working at a computer or watching television) in the room for 6 h following the initiation of breakfast. Further venous blood samples were collected at 2, 4 and 6 h after the start of the test meal for the measurement of serum TAG, insulin, NEFA, pre-heparin LPL and plasma glucose.
Standardisation of diet and exercise
The subjects weighed and recorded all food and drink consumed during the day before each trial and on day 1 of each trial, except an evening meal provided on day 1 of each trial. The subjects abstained from drinking alcohol during this time. The subjects were asked to replicate their intake from their first trial on their second trial. In addition, the subjects were asked to remain inactive on the day before day 1 of each trial and throughout the main trials (other than the exercise performed as part of the experiment). Food diaries were analysed using computerised software (Excel Eiyou-kun Version 4.0; Kenpakusha, Tokyo, Japan) to determine energy intake and macronutrient content.
Test meal
The test meal consisted of white bread, sliced cheese, butter, mayonnaise, lettuce, tomato, ham, whole milk, cocoa powder and yogurt. The meal was prescribed according to body mass and provided 0·61 g fat, 1·34 g carbohydrate, 0·37 g protein and 51 kJ energy/kg body mass. The macronutrient content of the test meal was 43·4 (sem 2·8) g fat, 95·4 (sem 6·2) g carbohydrate and 26·4 (sem 1·7) g protein which provided 3·63 (sem 0·24) MJ energy (energy derived was 45 % from fat, 43 % from carbohydrate and 12 % from protein). The subjects were asked to consume the test meal within 20 min. The time taken to consume the test meal was recorded and replicated in subsequent trials. The time taken to consume the test meal was 11·8 (sem 0·9) min. None of the subjects reported nausea or any gastrointestinal discomfort during or after the meal. The subjects consumed water ad libitum during the first trial and the volume ingested was replicated in subsequent trials.
Analytical methods
For serum TAG, insulin, NEFA and pre-heparin LPL measurements, venous blood samples were collected into 10 ml syringes and were then transferred into tubes containing clotting activators for isolation of serum. Thereafter samples were allowed to clot for 30 min at room temperature and then centrifuged at 1861 g for 10 min at 4°C. Serum was removed, divided into aliquots and stored at − 35°C for later analysis.
For plasma glucose measurements, venous blood samples were collected into 10 ml syringes and were then transferred into tubes containing sodium fluoride–EDTA. Thereafter samples were immediately centrifuged and treated as described earlier.
TAG (Pure Auto S YG-N; Daiichi Pure Chemicals Co. Ltd, Tokyo, Japan), NEFA (NEFA-SS Eiken; Eiken Chemical Co. Ltd, Tokyo, Japan) and glucose (Melcriauid Glu kit; Kanto Chemical Co. Inc., Tokyo, Japan) concentrations were determined by enzymatic, colorimetric methods. Insulin was measured by chemiluminescent enzyme immunoassay (Lumipulse Insulin-N; Fujirebio Inc., Tokyo, Japan). Pre-heparin LPL was measured by ELISA (LPL-ELISA Daiichi; Daiichi Pure Chemicals Co. Ltd, Tokyo, Japan). All samples from the same individual were assayed in a single run. Intra-assay CV were 1·6 % for TAG, 1·6 % for NEFA, 1·1 % for glucose, 3·0 % for insulin and 2·9 % for pre-heparin LPL.
Calculations and statistical analysis
Data were analysed using the Statistical Package for the Social Science (SPSS) software version 14.0 for Windows (SPSS Japan Inc., Tokyo, Japan). The Shapiro–Wilk test was used to check for normality of distribution. The distribution of all parameters was found not to differ significantly from normal. Six-hour total area under the plasma or serum concentrations v. time curves were calculated using the trapezium rule; 6 h incremental area under the plasma or serum concentrations v. time curves were calculated using the same method after correcting for fasting (0 h) concentrations. Student's t tests for correlated data with a two-tailed hypothesis were used to assess trial differences between baseline plasma or serum concentrations, fasting plasma or serum concentrations and 6 h areas under the curve values for TAG, glucose, insulin, NEFA and pre-heparin LPL on the exercise and control trials. Two-factor (trial × time) ANOVA with repeated measures was used to examine differences between the two trials over time (i.e. baseline, 0, 2, 4 and 6 h) for TAG, glucose, insulin, NEFA and pre-heparin LPL. Where a significant interaction was detected, post hoc pair-wise comparisons were performed using the Bonferroni method. The Pearson product moment correlation coefficient was used to examine the relationship between the change in total area under the curve for serum TAG concentrations and the change in total area under the curve for serum pre-heparin LPL concentrations (calculated by subtracting total area under the curve value on the exercise trial from the value on the control trial). Statistical significance was accepted at the 5 % level. Results are presented as means with their standard errors.
Results
The estimated gross energy expenditure and power output during exercise were 0·9 (sem 0·1) MJ and 82 (sem 6) W, respectively. The heart rate attained during exercise was 129 (sem 1) beats/min. This corresponded to an exercise intensity of 66·7 (sem 0·4) % of maximum heart rate. The median rating of perceived exertion during exercise was 12 (midway between ‘fairly light’ and ‘fairly hard’).
Analysis of food diaries revealed that energy intake did not differ significantly in the 48 h preceding day 2 of the control and exercise trials. Energy intake for the day prior to the trials and day of the trials were 11·8 (sem 0·8) MJ (energy was derived 23 (sem 2) % from fat, 62 (sem 2) % from carbohydrate and 15 (sem 1) % from protein) and 9·5 (sem 0·5) MJ (energy was derived 24 (sem 1) % from fat, 61 (sem 1) % from carbohydrate and 15 (sem 1) % from protein), respectively.
Baseline plasma and serum concentrations on day 1 of each trial are shown in Table 1. There was no difference in baseline TAG, insulin, NEFA, glucose and pre-heparin LPL between the exercise and control trials. Plasma and serum concentrations in the fasted state prior to the test meal on day 2 of each trial are shown in Table 2. There was no difference in fasting TAG, insulin, NEFA, glucose and pre-heparin LPL between the exercise and control trials.
Circulating concentrations of TAG, insulin, NEFA, glucose and pre-heparin lipoprotein lipase (LPL) on day 1 (baseline) of the exercise and control trials* (Mean values with their standard errors for twelve subjects)
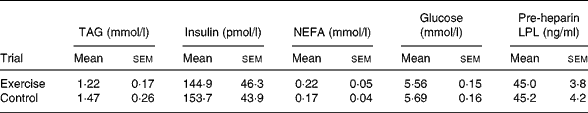
* There were no significant differences between the trials (Student's t test for correlated data).
Circulating concentrations of TAG, insulin, NEFA, glucose and pre-heparin lipoprotein lipase (LPL) on day 2 (fasting) of the exercise and control trials* (Mean values with their standard errors for twelve subjects)
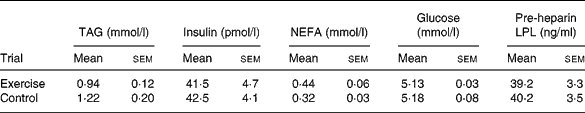
* There were no significant differences between the trials (Student's t test for correlated data).
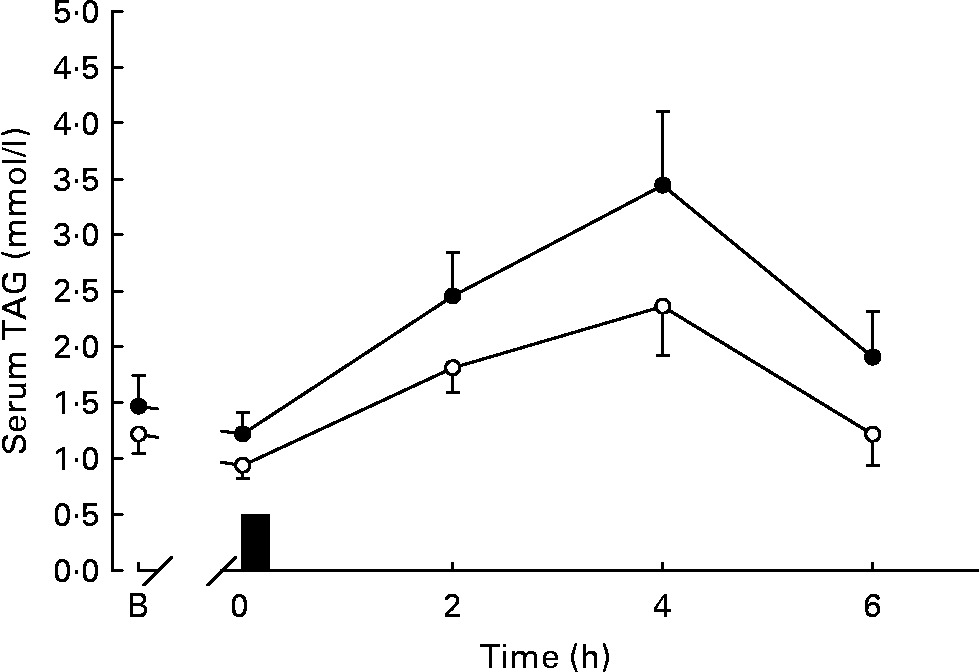
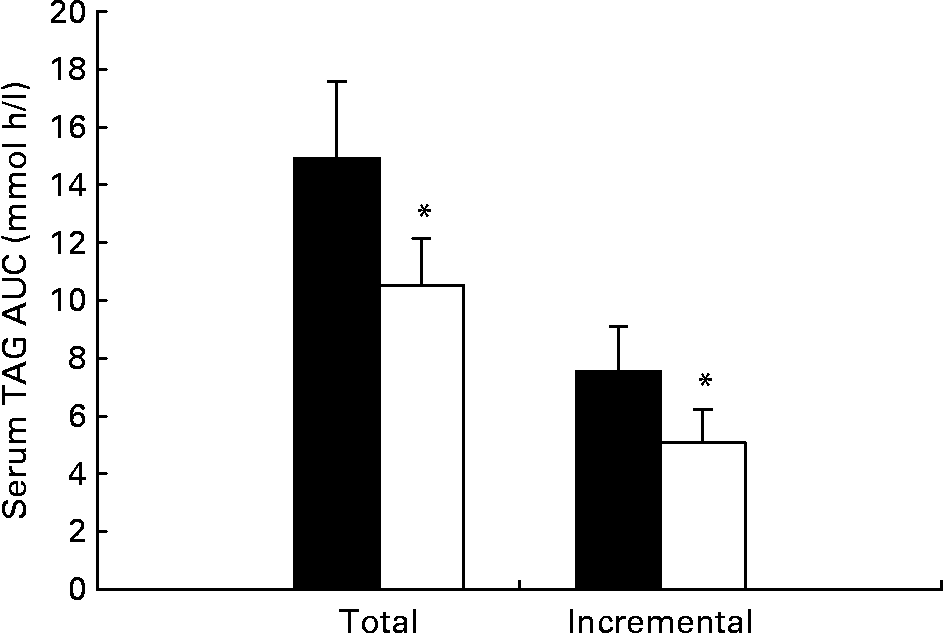
Serum TAG concentrations during the trials are shown in Fig. 1 and the total and incremental areas under the TAG concentration v. time curve are given in Fig. 2. Serum TAG concentrations were lower on the exercise than the control trial throughout the postprandial period (Fig. 1). Post hoc analysis did not reveal any pair-wise differences between trials. The total area under the serum TAG v. time curve was 30 % lower on the exercise trial compared with the control trial (effect size, 0·58; Fig. 2). The incremental area under the serum TAG v. time curve was 33 % lower on the exercise trial compared with the control trial (effect size, 0·52; Fig. 2).
Serum TAG concentrations during the exercise (○) and control (●) trials. Values are means with their standard errors depicted by vertical bars (n 12). Data were analysed using two-factor (trial × time) ANOVA with repeated measures: main effect of trial (P = 0·046), main effect of time (P < 0·0005), trial × time interaction (P = 0·028). ■, Consumption of the test meal; B, baseline.
Total and incremental serum TAG area under the curve (AUC) for 6 h after the consumption of the test meal in the exercise (□) and control (■) trials. Values are means with their standard errors depicted by vertical bars (n 12). Mean values were significantly different from those of the control trial (Student's t tests for correlated data): *P = 0·039 (total AUC), P = 0·012 (incremental AUC).
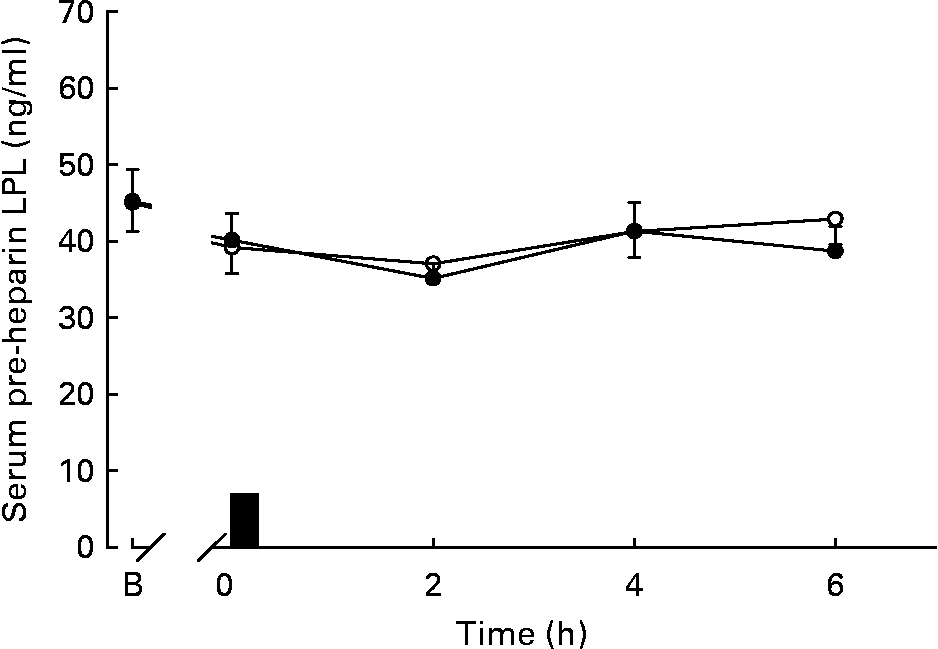
Serum pre-heparin LPL concentrations during the trials are shown in Fig. 3. Serum pre-heparin LPL concentrations did not differ between trials (Fig. 3). There were no significant differences in the total area under the serum pre-heparin LPL concentration v. time curve between the exercise and control trials. There was no significant relationship between the change in total area under the curve for serum TAG concentrations and the change in total area under the curve for serum pre-heparin LPL concentrations.
Serum pre-heparin lipoprotein lipase (LPL) concentrations during the exercise (○) and control (●) trials. Values are means with their standard errors depicted by vertical bars (n 12). Data were analysed using two-factor (trial × time) ANOVA with repeated measures: main effect of trial (P = 0·385), main effect of time (P = 0·014), trial × time interaction (P = 0·330). ■, Consumption of the test meal; B, baseline.
Serum insulin, NEFA and plasma glucose concentrations during the trials are shown in Fig. 4. Serum insulin and plasma glucose concentrations did not differ between trials (Fig. 4 (A, C)). Serum NEFA concentrations were higher on the exercise than the control trial throughout the postprandial period (Fig. 4 (B)).
Serum insulin (A), serum NEFA (B) and plasma glucose (C) concentrations during the exercise (○) and control (●) trials. Values are means with their standard errors depicted by vertical bars (n 12). Data were analysed using two-factor (trial × time) ANOVA with repeated measures. For serum insulin there is a main effect of time (P < 0·0005). For serum NEFA there is a main effect of trial (P = 0·048), main effect of time (P < 0·0005). ■, Consumption of the test meal; B, baseline.

Discussion
The present study demonstrates that postprandial TAG concentrations are lowered when a single bout of moderate-intensity cycling is performed the day before the consumption of a moderate-fat meal. In addition, to our knowledge, the present study is the first to examine serum pre-heparin LPL concentrations following exercise, and the finding indicates that prior moderate-intensity cycling does not affect serum pre-heparin LPL concentrations measured in the following day at the fasted and postprandial states.
Our findings are consistent with the findings of Kolifa et al.(Reference Kolifa, Petridou and Mougios5) that a prior single bout of cycling reduces postprandial TAG concentrations after a meal of moderate-fat content. Moreover, the present results extend the findings of the previous studies(Reference Kolifa, Petridou and Mougios5, Reference Kokalas, Petridou, Nikolaidis and Mougios6) by showing that 30 min of moderate-intensity cycling (0·9 MJ), as previously demonstrated for 1 h of high-intensity cycling (2·3 MJ) and 80 min of high-intensity rowing (4·2 MJ), performed the day before a meal of moderate-fat content is effective at lowering postprandial TAG concentrations. The present finding is based on a lower habitual dietary fat intake (23–24 % of total energy) by the subjects compared with the subjects in most of the previous studies conducted in Europe and North America (i.e. daily dietary fat intake usually exceeding 30 % of total energy). It would be speculated that postprandial TAG responses to exercise may differ between individuals with low and high habitual fat intakes. This may explain why we found reductions in postprandial TAG concentrations in the present study whereas the study by Tsetsonis & Hardman(Reference Tsetsonis and Hardman18) did not observe such an effect (daily dietary fat intake was 34 % of total energy) although the estimated total energy expenditure was higher (1·7 MJ) than that in the present study (0·9 MJ). However, we have no direct data to support this, and such speculation requires further study.
The present findings demonstrate that 30 min of cycling performed the day before postprandial testing reduces postprandial TAG concentrations whereas other studies have failed to show this effect when exercise was performed the same day as postprandial testing despite performing a similar total volume of cycling (1·1 MJ(7); 0·9 MJ(9)) or walking (0·9 MJ(8)). These different lipaemic responses to the timing of exercise may be explained partly by the activity of skeletal muscle LPL since skeletal muscle LPL activity is maximised more than 8 h after exercise(Reference Seip, Mair, Cole and Semenkovich15). This is perhaps why the studies by Kolifa et al.(Reference Kolifa, Petridou and Mougios5) and Kokalas et al.(Reference Kokalas, Petridou, Nikolaidis and Mougios6) have observed an attenuation in postprandial TAG concentration similar to the one observed in the present study. However, another study by James et al.(Reference James, Slivkoff-Clark and Mamo10) has failed to show an exercise-induced postprandial TAG lowering effect when exercise was performed the day before the consumption of a test meal of moderate-fat content. The reason for the different results between the studies is not apparent since the estimated total energy expenditure in the study by Kolifa et al.(Reference Kolifa, Petridou and Mougios5) (2·3 MJ) and James et al.(Reference James, Slivkoff-Clark and Mamo10) (2·4 MJ) were similar, and such exercise volume is relatively effective in reducing postprandial TAG concentrations(Reference Petitt and Cureton3). However, it could be speculated that there may be a threshold fat intake for exercise to exert a postprandial TAG lowering effect since the study by James et al.(Reference James, Slivkoff-Clark and Mamo10) used only 0·44 g fat/kg body mass whereas Kolifa et al.(Reference Kolifa, Petridou and Mougios5) and Kokalas et al.(Reference Kokalas, Petridou, Nikolaidis and Mougios6) used 0·66 g fat/kg body mass, and the present study used 0·61 g fat/kg body mass. It seems that the timing and volume of exercise responsible for the reductions in postprandial TAG concentrations after meals containing moderate-fat are unclear. Further research needs to investigate other factors, if any, involved in the exercise-induced lowering in postprandial TAG concentrations.
To our knowledge, the present study is the first to examine serum pre-heparin LPL concentration in response to exercise. Pre-heparin LPL is the LPL protein naturally detached from the endothelial surface into the circulation and has a positive correlation with post-heparin LPL concentration in hyperlipidaemic patients(Reference Kobayashi, Saito, Fukamachi, Taira, Takahashi, Bujo and Saito19). Recent findings reported an inverse relationship between serum pre-heparin LPL concentration and serum TAG concentration in both healthy individuals and hyperlipidaemic patients(Reference Watanabe, Miyashita, Murano, Hiroh, Ito and Shirai20). These findings were one factor that led us to hypothesise that serum pre-heparin LPL concentration may respond to exercise, since exercise increases LPL in skeletal muscle(Reference Seip, Mair, Cole and Semenkovich15) and LPL activity measured in post-heparin plasma is elevated after prolonged exercise(Reference Furguson, Alderson, Trost, Essig, Burke and Durstine21). In addition, the previous study has shown that exercise-induced reductions in both fasting and postprandial TAG concentrations were significantly correlated with the increases in post-heparin LPL activity(Reference Gill and Hardman22). We therefore decided to investigate whether pre-heparin LPL concentration increases after exercise and it is correlated with changes in postprandial TAG concentrations. We chose to measure pre-heparin LPL rather than post-heparin LPL, because the activity level of post-heparin LPL is known to be dependent on the dose of heparin injection and the time. Pre-heparin LPL can be measured using the serum (i.e. a more frequent sample collection is available), thus pre-heparin LPL may be measured more physiologically than post-heparin LPL, and may reflect more the physiological condition of LPL metabolism. In the present study, however, serum pre-heparin LPL concentrations did not differ between the trials despite a reduction in postprandial TAG concentrations observed in the exercise trial compared with the control trial. The present findings may indicate that reductions in postprandial TAG concentrations are not related to serum pre-heparin LPL concentrations. It is important to note, however, that pre-heparin LPL only represents a small fraction of total LPL and is catalytically inactive, and therefore it is unlikely that pre-heparin LPL is directly involved in the hydrolysis of TAG-rich lipoproteins in the blood.
The present study had limitations. First, the present findings may be difficult to generalise for the public at large since the subjects in this study were young, recreationally active men. Additional research will be required to determine whether similar findings can be evidenced with inactive, older individuals at risk of CVD. Exercise-induced lowering of postprandial TAG concentrations have been observed in a study of women of postmenopausal age(Reference Gill and Hardman23) but not in a study of young adults(Reference Tsetsonis and Hardman18), despite the subjects performing a comparable exercise (1·73 MJ) in both studies. Thus, further research is warranted regarding the effective dose of exercise for the subjects varying age and varying habitual activity patterns. Nonetheless, the volume of cycling performed in the present study is attainable for most individuals regardless of age. Moreover, it may be postulated that, since TAG concentrations were low in this group, the potential for reduction was limited, and greater reductions may be seen in individuals with hypertriacylglycerolaemia. Second, the test meal does not reflect that in a typical Japanese diet which is based on carbohydrate-rich meals (i.e. white rice, noodles). However, we chose this test meal in terms of fat content since a recent report has revealed that 38 % of Japanese adults aged between 20 and 29 consumed daily meals containing over 30 % of energy as fat(24). It is worth noting, however, that the present subjects consumed a recommended amount of fat during their food recording days. Further studies are required to determine if the lowering of postprandial TAG concentrations observed in the present study also occurs after meals typically consumed by Japanese populations.
In summary, 30 min of moderate-intensity cycling the day before the consumption of a meal of moderate-fat content reduced serum TAG concentrations but did not affect serum pre-heparin LPL concentrations in healthy young men. The present findings extend the results of previous studies(Reference Kolifa, Petridou and Mougios5, Reference Kokalas, Petridou, Nikolaidis and Mougios6) by showing exercise-induced lowering of TAG concentrations with aerobic exercise of even lower energy expenditure (less than half the energy expenditure in the study by Kolifa et al.(Reference Kolifa, Petridou and Mougios5)) on the day before the consumption of a meal of moderate-fat content. This effect may be related to the unusually low habitual fat intake by the participants in the present study. Although an exercise volume in the present study was consistent with guidelines regarding exercise and health(Reference Pate, Pratt and Blair11, 12), the subjects were young, recreationally active males. Therefore, further research will be required to determine if these findings can be generalised to the public at large (i.e. older individuals, sedentary individuals).
Acknowledgements
This study was supported by grants from the Ministry of Education, Culture, Sports Science and Technology of Japan. M. M. was involved in study design and implementation, data collection and analysis, and writing the manuscript. K. T. obtained the funding and wrote the manuscript. Neither of the authors had any conflict of interest regarding any aspect of this research.


