

The prevalence of obesity is rapidly increasing worldwide, constituting an important health issue. Obesity is the result of a positive imbalance between energy intake and energy expenditure over a long period and is related to the development of other disorders such as diabetes, dyslipaemia and CVD. Obesity is also associated with complications during pregnancy and at delivery for women and with increased health risks in newborns(Reference Ehrenberg, Durnwald and Catalano1–Reference Jain, Denk and Kruse3).
There are several genetic and environmental factors, such as diet, cultural behaviour and socio-economic status, that influence obesity(Reference Hill and Trowbridge4, Reference Jouret, Ahluwalia and Cristini5). In addition, recent reports suggest that the nature and composition of the intestinal microbiota are altered in obesity(Reference Ley, Turnbaugh and Klein6, Reference Turnbaugh, Ley and Mahowald7). Lean individuals have more Bacteroidetes, while obese individuals have more Firmicutes, including Clostridium clusters, in their intestinal microbiota(Reference Ley, Turnbaugh and Klein6, Reference Turnbaugh, Ley and Mahowald7). It has been proposed that such bacterial composition improves the ability of the host to extract energy from the diet and to store this energy in the adipose tissue(Reference Turnbaugh, Ley and Mahowald7). The gut microbiota has also been related to body weight and body-weight loss under a lifestyle intervention in human subjects(Reference Nadal, Santacruz and Marcos8, Reference Santacruz, Marcos and Wärnberg9). Although obesity is an important health issue during pregnancy, the relationships between the gut microbiota composition and obesity have been scarcely studied in pregnant women(Reference Collado, Laitinen and Isolauri10).
The aim of the present study was to analyse the microbiota composition of pregnant women and establish its possible relationships with body weight, weight gain and biochemical parameters to progress in the understanding of the role of the microbiota in the health status of pregnant women.
Experimental methods
Study participants
The pregnant women were recruited at 20 weeks of pregnancy at the Clinical University Hospital ‘San Cecilio’ de Granada, Spain. Women were classified according to their pre-pregnancy BMI into two groups: overweight women (n 16) with BMI>25 kg/m2 and normal-weight women (n 34) with BMI < 25 kg/m2 (Table 1). Signed informed consent was obtained from the studied women after a full explanation of the study had been given by a member of the team at the first visit. Participants were assured of anonymity and confidentiality. After the visit at the first trimester, women were examined by the obstetrician again at 24 (second trimester) and 34 weeks (third trimester) and clinical parameters were recorded. At 24 weeks of pregnancy, faecal and blood samples were obtained for microbiological and biochemical analysis. Data on weight before pregnancy were used to calculate weight gain during pregnancy. Normal weight gain ranges were from 11·5 to 16·0 kg for normal-weight women (BMI 19·8–25·0 kg/m2) and from 7·0 to 11·5 kg for overweight women (BMI>25 kg/m2), respectively, over pregnancy according to the Institute of Medicine (IOM) criteria(11). Total weight gains above these values, >16 kg for normal-weight women and>11·5 kg for overweight women, were considered excessive weight gains. Data on gestation time and birth weights of the newborns were also collected. The present study was conducted according to the guidelines laid down in the Declaration of Helsinki and all procedures involving human subjects were approved by the ethics committee of the Hospital involved in the study. Written informed consent was obtained from all subjects before their inclusion in the study.
(Median values and interquartile ranges (IQR))

* Significant differences were calculated using the Mann–Whitney U test. A significant difference between the groups was considered at P < 0·050.
Dietary assessment
Food diary records of pregnant women were kept for 72 h (two weekdays and one weekend day) at 24 weeks of pregnancy. Detailed information on how to record food and drink consumed using common household measures was provided. Food diary records were returned to each woman's dietitian, and analysed for energy, water and nutrient content based on the CESNID (Centre d'Ensenyament Superior de Nutrició Humana i Dietètica; Centre for Human Nutrition and Dietetics Education) food composition database of Spanish foods(Reference Farran, Zamora and Cervera12).
Biochemical parameters
Fasting plasma glucose, total cholesterol, HDL-cholesterol, TAG, urea, creatinine, uric acid, bilirubin and Fe were measured by enzyme-colorimetric automated methods for clinical chemistry (Modular Analytics EVO, Roche, Neuilly sur Seine Cedex, France). LDL-cholesterol was calculated using Friedwald's formula(Reference Friedewald, Levy and Fredrickson13). Ferritin, transferrin, folate and thyroid-stimulating hormone levels were measured by using the automatic analyser Elecsys 2010 with modular analytics E170 (Roche, Neuilly sur Seine Cedex, France). The transferrin saturation index (TSI) was calculated using the following formula:
Sample preparation and DNA extraction
Faecal samples were frozen immediately at − 20°C and kept until processing. Faeces (1 g) were diluted 1:10 (w/v) in PBS (pH 7·2), homogenised and used for DNA extraction. DNA from pure cultures of reference bacterial strains and faecal samples was extracted using the QIAamp DNA stool Mini kit (Qiagen, Hilden, Germany) following the manufacturer's instructions. The concentration of DNA was determined with a Nanodrop-1000 spectrophotometer (Nanodrop, Wilmington, DE, USA).
Analysis of faecal microbiota composition
Quantitative real-time PCR was used to characterise the microbiota by using specific primers targeting different bacterial groups and the SYBR® Green PCR Master Mix (SuperArray Bioscience Corporation, Frederick, MD, USA), as previously described(Reference Santacruz, Marcos and Wärnberg9, Reference Collado, Laitinen and Isolauri10). PCR amplification and detection were performed with an ABI PRISM 7000-PCR sequence detection system (Applied Biosystems, Warrington, Ches, UK). Bacterial concentration from each sample was calculated by comparing the Ct (cycle threshold) values obtained from standard curves. Standard curves were created using serial 10-fold dilution of pure culture DNA corresponding to 102 to 109 cell equivalents/ml (genome equivalents/ml). Conversion of the amount of bacteria DNA in samples determined by quantitative real-time PCR to theoretical genome equivalents required the assumption that the genome size and 16S rRNA gene copy number for each bacterial group analysed were similar. The following genome sizes were used in the study: 2·3 Mb for Bifidobacterium (using Bif. longum as standard); 2·9 Mb for Lactobacillus (L. casei); 5·2 Mb for Bacteroides (Bact. fragilis); 4 Mb for Clostridium coccoides group; 3·3 Mb for C. leptum group; 4·6 Mb for Enterobacteriaceae and Escherichia coli; 2·8 Mb for Staphylococcus (Staph. aureus); 2·7 Mb for Akkermansia muciniphila. Genome sizes were obtained from the National Center for Biotechnology Information (NCBI) database (Genome project). Standard curves were created using the following reference strains: Bif. longum subsp. longum CECT 4503; Bact. fragilis DSMZ 2451; C. coccoides DSMZ 933; C. leptum DSMZ 935; Staph. aureus CECT 86; L. casei ATCC 393; E. coli CECT 45; A. muciniphila strain MucT (ATCC BAA-835T).
Statistical analyses
Statistical analyses were done using SPSS 11.0 software (SPSS Inc., Chicago, IL, USA). Data distribution was analysed by applying the Kolmogorov–Smirnov test and creating a Gaussian curve. Due to non-normal distribution, microbial data are expressed as medians with interquartile ranges. The Mann–Whitney U test was applied for comparisons between bacterial numbers of normal-weight and overweight women and between women with excessive and normal weight gain over pregnancy. Differences in prevalence of bacterial groups were established by applying the χ2 test. Correlations between variables were determined by applying the Spearman's rank correlation. P < 0·050 was considered statistically significant for all tests.
Results
Body weight, BMI and weight gain over pregnancy
Clinical characteristics of the studied women at recruitment time were similar in both groups (Table 1) except for BMI and body weight. The body weight of the overweight women was significantly higher than that of normal-weight women during pregnancy, although no significant differences (P = 0·120) in weight gain were detected between the groups over time. BMI was significantly different (P < 0·050) between normal-weight and overweight women and increased in both groups over pregnancy. The infants were born at term and the infants' birth weights of the overweight women were higher than those of the normal-weight women (P = 0·028).
Dietary intakes
Dietary data of normal-weight and overweight pregnant women at 24 weeks of pregnancy are shown in Table 2. No significant differences in dietary intake of energy, macronutrients or in food group level were found between the two groups of women. Only the intake of fibre was slightly higher (P = 0·057) in normal-weight than in overweight women. When the women were grouped according to the total weight gain over pregnancy into two groups (excessive and normal weight gain), no significant differences in dietary intake of energy, macronutrients or in food group level were found between the two groups. No correlations were found between dietary intakes, body weight and body-weight gain.
(Median values and interquartile ranges (IQR))

CHO, carbohydrates.
* Significant differences were calculated using the Mann–Whitney U test. A significant difference between the groups was considered at P < 0·050.
Biochemical parameters
Biochemical parameters of pregnant women at 24 weeks subdivided according to their BMI into normal-weight and overweight women are shown in Table 3. Bilirubin, Fe and folic acid levels were significantly higher in normal-weight than in overweight women (P = 0·021, P = 0·021 and P = 0·042, respectively). HDL-cholesterol was higher (P = 0·050) in normal-weight than in overweight women, whereas total cholesterol and TAG levels were significantly higher in overweight than in normal-weight women (P = 0·019 and P = 0·034, respectively). Moreover, increased levels of TAG (R 0·30; P = 0·033) and total cholesterol (R 0·43; P = 0·002) and reduced levels of bilirubin (R − 0·36; P = 0·019) and Fe (R − 0·33; P = 0·019) correlated with overweight women.
(Median values and interquartile ranges (IQR))

TSH, thyroid-stimulating hormone.
* Significant differences were calculated using the Mann–Whitney U test. A significant difference between the groups was considered at P < 0·050.
When women were grouped according to the total weight gain over pregnancy into two groups (excessive and normal weight gain), correlations with some biochemical parameters were also detected. Increased levels of total cholesterol (R 0·33; P = 0·020) and ferritin (R 0·45, P = 0·001) correlated with women with excessive weight gain over pregnancy.
Microbiota composition in normal-weight and overweight women
The bacterial numbers detected in faecal samples of normal-weight and overweight women are shown in Table 4. Bifidobacterium and Bacteroides numbers were significantly higher (P>0·001 and P = 0·035, respectively) in normal-weight women than in overweight women, whereas Enterobacteriaceae (P = 0·001), E. coli (P = 0·005) and Staphylococcus (P = 0·006) numbers were lower in normal-weight than in overweight women. C. coccoides group numbers were slightly higher in overweight women than in normal-weight women, but not significantly (P = 0·088).
(Median values and interquartile ranges (IQR))

* Significant differences were calculated using the Mann–Whitney U test. A significant difference between the groups was considered at P < 0·050.
† Prevalence reflects the number of positive amplifications from total samples analysed by PCR (n = number of samples analysed).
The ratio of Bifidobacterium to C. coccoides group was significantly higher (P < 0·001) in normal-weight than in overweight women. The ratio of Bifidobacterium to both Clostridium groups (C. coccoides plus C. leptum) was also significantly higher (P < 0·001) in normal-weight than in overweight women.
Increased numbers of Bifidobacterium (R − 0·56; P < 0·001) and Bacteroides (R − 0·34; P = 0·020) correlated with normal-weight women, while a different trend was found for Staphylococcus (R 0·67; P = 0·003), Enterobacteriaceae (R 0·46, P < 0·001) and E. coli (R 0·40; P = 0·004) (Fig. 1). An increased ratio of Bifidobacterium to C. coccoides correlated with lower BMI (R − 0·60; P < 0·001). Similarly, an increased Bifidobacterium to C. coccoides plus C. leptum ratio was positively related to normal-weight women (R − 0·54; P < 0·001).
Relationships between numbers of faecal bacterial groups and weight. Data represent the positive samples. The line in the box is the median (50 % percentile), with the lower line being the lower 25 % border (25 % percentile) and the upper line the 75 % (75 % percentile) border. The end of the upper vertical line is the maximum data value, outliers not considered. The end of the lower vertical line is the lowest value, outliers not considered. The separate dots or asterisks indicate outliers. Lines show the Spearman correlation (linear adjustment). (a) Staphylococcus (R 0·67; P = 0·003); (b) Enterobacteriaceae (R 0·46; P < 0·001); (c) Escherichia coli (R 0·40; P = 0·004); (d) Bifidobacterium (R − 0·56; P < 0·001); (e) Bacteroides (R − 0·34; P = 0·020).

Microbiota composition according to weight gain over pregnancy
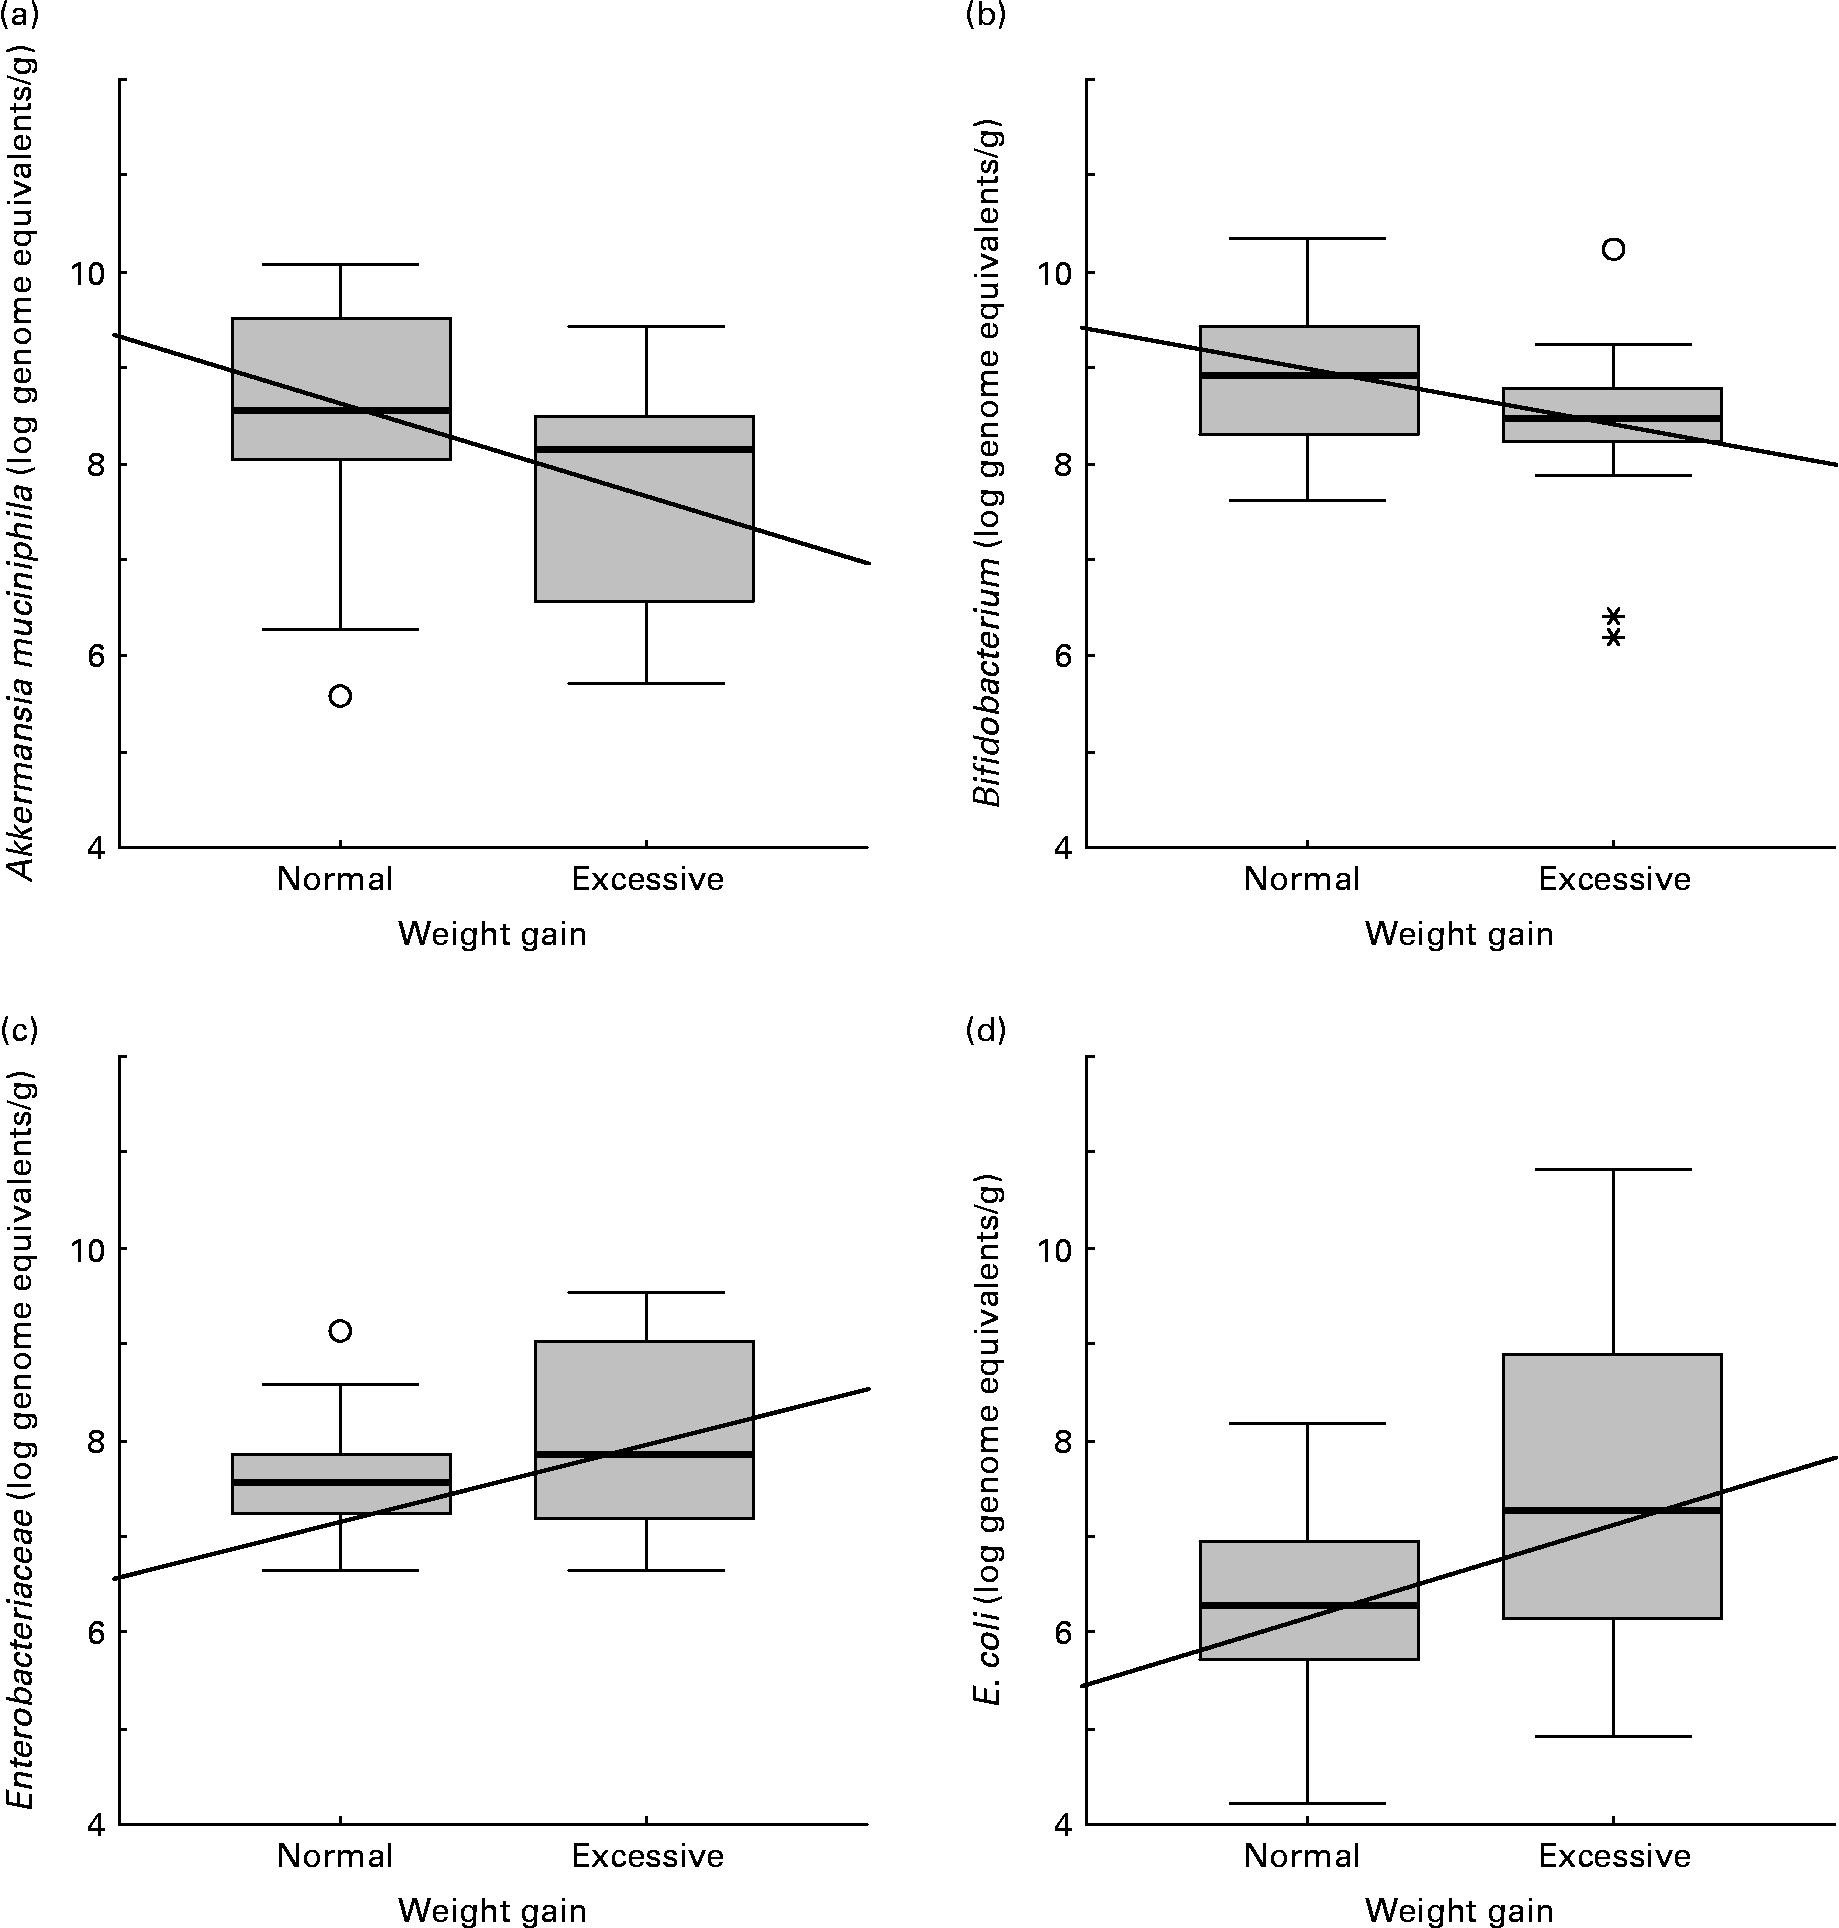
Faecal microbiota composition of women showing normal or excessive weight gain over pregnancy is shown in Table 5. E. coli numbers were significantly higher (P = 0·045) in women with excessive weight gain than in women with normal weight gain over pregnancy. A similar trend was found for Enterobacteriaceae numbers although the differences were not significant (P = 0·142). Contrary to this tendency, A. muciniphila and Bifidobacterium numbers were higher (P = 0·020 and P = 0·078, respectively) in women with normal weight gain than in those with excessive weight gain.
(Median values and interquartile ranges (IQR))

* Significant differences were calculated using the Mann–Whitney U test. A significant difference between the groups was considered at P < 0·050.
† Normal weight gains over pregnancy according to the Institute of Medicine are < 16·0 kg (BMI < 25 kg/m2) and < 11·5 kg (BMI>25 kg/m2).
‡ Prevalence reflects the number of positive amplifications from total samples analysed by PCR (n = number of samples analysed).
The prevalence of C. leptum group and Staphylococcus was higher in women with excessive weight gain than in women with normal weight gain over pregnancy (P = 0·545 and P = 0·124, respectively).
Increased numbers of Bifidobacterium (R − 0·31; P = 0·029), Bacteroides (R − 0·36; P = 0·019) and A. muciniphila (R − 0·34; P = 0·017) correlated significantly with normal weight gain over pregnancy (Fig. 2). On the contrary, increased numbers of Enterobacteriaceae (R 0·28; P = 0·050) and E. coli (R 0·42; P = 0·002) correlated with excessive weight gain over pregnancy (Fig. 2).
Relationships between numbers of faecal bacterial groups and weight gain over pregnancy. Data represent the positive samples. The line in the box is the median (50 % percentile), with the lower line being the lower 25 % border (25 % percentile) and the upper line the 75 % (75 % percentile) border. The end of the upper vertical line is the maximum data value, outliers not considered. The end of the lower vertical line is the lowest value, outliers not considered. The separate dots or asterisks indicate outliers. Lines show the Spearman correlation (linear adjustment). (a) Akkermansia muciniphila (R − 0·34; P = 0·017); (b) Bifidobacterium (R − 0·31; P = 0·029); (c) Enterobacteriaceae (R 0·28; P = 0·050); (d) Escherichia coli (R 0·42; P = 0·002).
Relationships between microbiota composition and dietary intakes
In the whole population of women, only increased numbers of total bacteria correlated with reduced energy (R − 0·71; P < 0·001), animal protein (R − 0·66; P = 0·001), cholesterol (R − 0·57; P = 0·007) and PUFA (R − 0·52; P < 0·015) intakes. The same trend was detected between total bacteria and energy (R − 0·78, P < 0·001 and R − 0·07, P = 0·002), animal protein (R − 0·61, P < 0·015 and R − 0·75, P = 0·001) and cholesterol (R − 0·52, P < 0·043 and R − 0·58, P = 0·018) intakes in the normal-weight group and in the normal weight gain group.
Relationships between microbiota composition and biochemical parameters
In the whole population of women, total bacteria positively correlated with cholesterol (R 0·350; P = 0·013). Increased numbers of Staphylococcus were related to increased levels of cholesterol (R 0·68; P = 0·003). Increased numbers of Enterobacteriaceae and E. coli counts were significantly correlated with increased levels of ferritin (R 0·324, P = 0·023 and R 0·425, P = 0·002) and saturation transferrin index (R 0·302, P = 0·035 and R 0·439, P = 0·002) and reduced levels of transferrin (R − 0·353, P = 0·013 and R − 0·341, P = 0·017). In contrast, increased numbers of Bifidobacterium were related to reduced levels of ferritin (R − 0·420; P = 0·003) and saturation transferrin index (R − 0·388; P = 0·006) and to increased levels of transferrin (R 0·348; P = 0·014). In addition, increased numbers of Bifidobacterium were related to increased levels of folic acid (R 0·308; P = 0·032). Increased numbers of Bacteroides were related to increased levels of HDL-cholesterol (R 0·518; P < 0·001) and folic acid (R 0·333; P = 0·020) and to reduced levels of TAG (R − 0·371; P = 0·009).
In normal-weight women, increased numbers of total bacteria correlated with increased levels of cholesterol (R 0·383; P = 0·025), while in overweight women the correlations were not significant.
In normal weight gain women, increased levels of total bacteria were related to increased levels of total cholesterol (R 0·390; P = 0·019), HDL-cholesterol (R 0·335; P = 0·046) and folic acid (R 0·338; P = 0·044). Increased numbers of Staphylococcus correlated with increased levels of total cholesterol (R 0·881; P < 0·001). Moreover, increased numbers of Bacteroides correlated with higher levels of HDL-cholesterol (R 0·620; P = 0·002). In women with excessive weight gain over pregnancy, increased numbers of Bifidobacterium were related to increased levels of HDL-cholesterol (R 0·572; P = 0·042) and reduced levels of total TAG (R − 0·682; P = 0·010). Increased Bacteroides numbers were related to reduced levels of TAG (R − 0·809; P = 0·001).
Relationships between maternal microbiota composition and infant birth weight
In the whole population of women, significant positive correlations were found between E. coli (R 0·331; P = 0·039) and C. coccoides (R 0·323; P = 0·045) numbers and infant birth weight. In overweight women, positive correlations were also found between E. coli numbers and infant birth weight (R 0·673; P = 0·035). In excessive weight gain women, significant negative correlations were found between numbers of Lactobacillus group and infant birth weight (R − 0·917; P = 0·001).
Discussion
The present study reports differences in the intestinal microbiota of normal-weight and overweight pregnant women, associated with body weight and weight gain over pregnancy, suggesting that the intestinal microbiota is a relevant target to weight management in pregnancy. Moreover, newborns from overweight pregnant women had higher birth weights than those from normal-weight pregnant women, suggesting the transference of the mother's features to their newborns. In this context, the results can also be of relevance to the transference of the aberrant microbiota to the newborns, which use the maternal microbiota as inoculums for microbiota development(Reference Kalliomäki, Collado and Salminen14). In fact, a positive relationship between the maternal intestinal E. coli numbers and infant birth weight was demonstrated, which could be related to infant body weight regulation. In contrast, in women with excessive weight gain, increased Lactobacillus numbers were related to reduced weight gain over pregnancy, suggesting a positive role of this bacterial group in infant body weight regulation.
In the present study, increased numbers of Bacteroides, which belong to the Bacteroidetes phylum, were detected in normal-weight compared with overweight women. In previous studies, the faecal microbiota of lean human subjects was characterised by having increased numbers of Bacteroidetes compared with that of obese subjects. Moreover, weight loss under dietary intervention was associated with increases in Bacteroidetes and Bact. fragilis group numbers in adults and adolescents(Reference Ley, Turnbaugh and Klein6, Reference Nadal, Santacruz and Marcos8, Reference Santacruz, Marcos and Wärnberg9). Therefore, the association of Bacteroidetes with a lean phenotype established in previous studies has also been confirmed in pregnant women included in the present study. Nevertheless, Bacteroides numbers were significantly higher in overweight than in normal-weight women and associated with excessive weight gain over pregnancy in the only previous study carried out in pregnant women(Reference Collado, Laitinen and Isolauri10). These results contradict all previous findings on the role of Bacteroides in obesity and highlight the importance of the new evidence provided by the present study in this regard.
Increased numbers of Bifidobacterium were also related to normal-weight women compared with overweight women, and a similar trend was detected in women with normal weight gain compared with those with excessive weight gain over pregnancy. This is in agreement with recent studies, which showed that levels of Bifidobacterium were reduced in infants who developed overweight at 7 years old, compared with normal-weight children(Reference Kalliomäki, Collado and Salminen14); however, this association was not established in the previous study conducted in pregnant women(Reference Collado, Laitinen and Isolauri10). In animal models, a role has also been attributed to Bifidobacterium in obesity. Obese Zucker rats (fa/fa) and mice fed a high-fat diet showed reduced Bifidobacterium counts(Reference Waldram, Holmes and Wang15, Reference Cani, Neyrinck and Fava16). Moreover, the administration of prebiotics to mice fed a high-fat diet increased the intestinal Bifidobacterium numbers, which positively correlated with improved glucose tolerance and glucose-induced insulin secretion and with the normalisation of the inflammatory tone(Reference Cani, Neyrinck and Fava16).
In addition, the ratio of Bifidobacterium to either C. coccoides or to C. coccoides plus C. leptum group numbers was also significantly higher in normal-weight than in overweight women, suggesting a negative role of Clostridium in obesity. In agreement, obese human subjects were shown to have increased numbers of Firmicutes in their faecal microbiota as compared with lean subjects(Reference Ley, Turnbaugh and Klein6). Moreover, weight loss under dietary intervention has also been associated with reduction in Firmicutes or C. coccoides and C. histolyticum group proportions(Reference Ley, Turnbaugh and Klein6, Reference Nadal, Santacruz and Marcos8, Reference Santacruz, Marcos and Wärnberg9). Altogether, these results confirm that increases in the relative abundance of members of Firmicutes and, in particular, of some Clostridium clusters is associated with excessive body weight.
Staphylococcus numbers were also increased in overweight compared with normal-weight women in agreement with a previous study conducted in pregnant women(Reference Collado, Laitinen and Isolauri10). Moreover, children becoming overweight at 7 years old showed a greater number of Staph. aureus in faeces during infancy(Reference Kalliomäki, Collado and Salminen14). In addition, Enterobacteriaceae and E. coli were significantly higher in overweight than in normal-weight women and also in women with excessive weight gain over pregnancy. Increased levels of Gram-negative bacteria, which could include Enterobacteriaceae and E. coli, could be related to the endotoxaemia and inflammatory tone associated with obesity as evidenced in animal models(Reference Cani, Neyrinck and Fava16).
Total cholesterol and TAG levels were significantly higher in overweight than in normal-weight women and increased cholesterol levels correlated with excessive weight gain over pregnancy, as expected. In addition, folic acid, which is a nutrient involved in the correct differentiation of the neural tube during fetal organogenesis, was significantly lower in overweight than in normal-weight women. In fact, obesity is a risk factor for neural tube defects(Reference Ray, Thompson and Vermeulen17). Moreover, Fe levels were also lower in overweight than in normal-weight women and increased levels of ferritin correlated with higher weight gain in the whole population and in the excessive weight gain group. A relationship has been described between obesity and Fe deficiency, which can be reflected in reduced plasma levels of Fe and transferrin and increased plasma levels of ferritin and saturation transferrin index(Reference Nead, Halterman and Kaczorowski18–Reference Lecube, Hernández and Pelegrí22). The Fe deficiency associated with obesity has a multifactorial aetiology and could be due to impairment of intestinal Fe uptake and Fe release from stores, and to inadequate Fe bioavailability because of inflammation. In particular, abnormal ferritin concentrations have been explained by the chronic low-grade inflammation associated with obesity, the metabolic syndrome and gestational and type 2 diabetes(Reference Zafon, Lecube and Simó20–Reference Lecube, Hernández and Pelegrí22). Increases in serum ferritin concentrations early in gestation also constitute a risk of gestational diabetes, partly mediated by the maternal fat mass and obesity(Reference Chen, Scholl and Stein21).
The present study also reports interesting relationships between biochemical parameters and specific intestinal bacterial groups in pregnant women. While Bacteroides numbers seemed to have a positive association with plasma biomarkers of lipid metabolism, Staphylococcus numbers seemed to have a negative association, particularly with plasma cholesterol. Cholesterol and other sterols have been shown to stimulate the growth of at least S. aureus (Reference Shine, Silvany and McCulley23); however, in the present study no correlation was found between cholesterol intake and Staphylococcus numbers, which could explain a link with plasma cholesterol levels. Other mechanisms have been proposed to justify the influence of the intestinal microbiota on lipid metabolism, including the generation of different SCFA and regulation of the host gene expression(Reference Ley, Turnbaugh and Klein6, Reference Turnbaugh, Ley and Mahowald7, Reference Wolever, Spadafora and Cunnane24, Reference Pouteau, Nguyen and Ballèvre25), but the specific relationships found in the present study remain to be elucidated.
Bifidobacterium numbers were positively related to plasma folic acid levels in the whole population, which may be due to the ability of some strains of this genus to synthesise and secrete folates in the human intestinal environment, providing a complementary endogenous source of this vitamin(Reference Strozzi and Mogna26). This metabolic trait of Bifidobacterium strains could contribute to improving the nutritional status of the pregnant woman and the fetus.
Enterobacteriaceae/E. coli and Bifidobacterium showed inverse relationships with transferrin, saturation transferrin index and ferritin, as well as with body weight in the whole population. Increases in serum transferrin saturation index, because of a transferrin decrease and ferritin increase, have been associated with a decrease in antibacterial activity of serum against enterobacteria, such as Salmonella enterica, which could contribute to favouring the survival of this bacterial group(Reference Jolivet-Gougeon, Loréal and Ingels27). In fact, infections are one of the conditions that can depress transferrin levels. The possibility that the overgrowth of Enterobacteriaceae in the gut environment might favour their translocation to some extent and cause a similar effect could not be disregarded. By contrast, the administration of inulin to pigs led to increased Lactobacillus and Bifidobacterium numbers and to up-regulating the expression of genes encoding for Fe transporters in the enterocytes, which suggest a connection between these bacterial groups and/or the prebiotic, and improved Fe absorption(Reference Tako, Glahn and Welch28). Therefore, the relative abundance of Bifidobacterium and Enterobacteriaceae may differently influence Fe metabolism and, in turn, exert opposite effects on the nutritional status of pregnant women. Unlikely the present study, a previous report on microbiota of pregnant women did not provide any data on biochemical parameters and their possible associations with the microbiota(Reference Collado, Laitinen and Isolauri10).
In summary, specific bacterial groups are oppositely related to overweight and weight gain during pregnancy, pointing to a beneficial role of Bacteroides and Bifidobacterium in body-weight regulation. In addition, novel associations between these bacterial groups and beneficial changes in metabolic biomarkers are provided, suggesting a connection between the gut microbiota and the host metabolism. Altogether, these findings open new possibilities for the management of body weight and of the nutritional status of pregnant women through modulation of the intestinal microbiota, which may have consequences on later infant health, and deserve further investigation.
Acknowledgements
The present study was supported by grants AGL2008-01440/ALI, Consolider Fun-C-Food CSD2007-00063 from the Spanish Ministry of Science and Innovation, AP-124/09 from Consellería de Sanitat (Valencia, Spain) and P06-CTS-02341 (Excellence Project PREOBE) from Consejería de Innovación, Ciencia y Empresa de la Junta de Andalucía. (Spain). M. C. C. was recipient of I3P fellowships from CSIC (Spain). A. muciniphila strain MucT ( = ATCC BAA-835T = CIP 107961T) was kindly provided by Molecular Microbial Ecology Group, Laboratory of Microbiology, Department of Agrotechnology and Food Sciences, Wageningen University, Wageningen, The Netherlands.
Y. S. conceived of and coordinated the microbiological study, and drafted the manuscript. A. S. and M. C. C. carried out the microbiological and statistical analyses. C. C. coordinated the clinical follow-up of pregnant women. L. G.-V., M. T. S., J. A. M.-L. and T. A. collected clinical and biochemical data. M. M.-R., R. M. L. and J. F. recruited and followed-up pregnant woman. All authors read, reviewed and approved the final version of the manuscript.
The authors do not have any conflict of interest.


