


Introduction
Outburst flooding from Late Pleistocene and Early Holocene paleolakes has shaped the steep, sinuous river networks at the southeastern margin of the Tibetan Plateau (Montgomery et al., Reference Montgomery, Hallet, Yuping, Finnegan, Anders, Gillespie and Greenberg2004; Korup and Montgomery, Reference Korup and Montgomery2008; Song et al., Reference Song, Zhenhan, Xitao, Jianping and Hua2012; Lang et al., Reference Lang, Huntington and Montgomery2013; Guo et al., Reference Guo, Montgomery, Zhang, Zhong, Fan, Wu, Yang, Ding, Jin and Yan2020; Panda et al., Reference Panda, Kumar, Das, Devrani, Rai, Prakash and Srivastava2020; Morey et al., Reference Morey, Shobe, Huntington, Lang, Johnson and Duvall2024; P. Wang et al., Reference Wang, Wang, Liu, Hu, Qin and Yuan2024b; Fig. 1). The failure of landslide dams in this region has produced some of the largest natural outburst floods ever recorded (Evans and Delaney, Reference Evans, Delaney, Evans, Hermanns, Strom and Scarascia-Mugnozza2011; Delaney and Evans, Reference Delaney and Evans2015; Turzewski et al., Reference Turzewski, Huntington and LeVeque2019; Hu et al., Reference Hu, Wu, Wei, Zhang, Zhang, Liu and Yanites2021), and outburst floods remain a persistent hazard for communities in the eastern Himalaya (Chen et al., Reference Chen, Zhang, Xiao and He2020; Veh et al., Reference Veh, Korup and Walz2020; Shen et al., Reference Shen, Shi, Peng, Zheng, Yang and Zhang2024). To understand the impact of outburst floods on landscapes and communities, geologists rely on interpretations of paleoflood deposits to reconstruct flood hydrodynamics (e.g., Gilbert, Reference Gilbert1890; Baker et al., Reference Baker, Kochel, Patton, Pickup, Collinson and Lewin1983; O’Connor, Reference O’Connor1993; Carrivick et al., Reference Carrivick and Rushmer2006; Carling, Reference Carling2013). The search for paleoflood deposits in rapidly eroding mountain landscapes presents significant challenges, especially in the eastern Himalaya, where exhumation rates and landslide erosion rates are both rapid (Larsen and Montgomery, Reference Larsen and Montgomery2012). Despite these challenges, comprehensive mapping of paleoflood deposits is critical to accurately reconstruct past events and anticipate the impact of future outburst floods.
Map and longitudinal stream profile of the Yarlung-Siang River where it flows across the margin of the Tibetan plateau and crosses the eastern Himalaya. Outburst flood deposits (white circles) are well documented downstream of the Yarlung Tsangpo Grand Canyon (e.g., Lang et al., Reference Lang, Huntington and Montgomery2013; Turzewski et al., Reference Turzewski, Huntington, Licht and Lang2020; P. Wang et al., Reference Wang, Wang, Hu, Xu, Yuan, Shi and Ding2024b; also called the Yarlung Tsangpo Gorge) and widely interpreted to result from failure of lakes impounded behind moraine and landslide dams (black circles; Korup and Montgomery, Reference Korup and Montgomery2008) upstream. Our study focuses on deposits in the low-gradient lower reaches of the Siyom River valley (see inset map), a tributary that was inundated during outburst floods from an 81 km3 paleolake dammed by the Zelongnong Glacier (Morey et al., Reference Morey, Huntington, Turzewski, Mangipudi and Montgomery2022). Inset map of the Siyom River valley illustrates the location of potentially active faults (Acharyya and Saha, Reference Acharyya and Saha2008; Misra and Srivastava Reference Misra and Srivastava2009) including the dextral strike-slip Tuting-Basar Fault. Hillshade and slope map derived from the Advanced Land Observing Satellite Phase Array type L-band Synthetic Aperture Radar Radiometric terrain correction digital elevation map (ALOS PALSAR RTC DEM; ASF DAAC, 2014). Tibetan (pink shading) and Himalayan (blue shading) detrital zircon (DZ) U-Pb age domains illustrated for reference to Figure 7.

Slack-water deposits from ancient and historical outburst floods are well documented in the eastern Himalaya along the Siang River drainage, Arunachal Pradesh, India (e.g., Lang et al., Reference Lang, Huntington and Montgomery2013; Srivastava et al., Reference Srivastava, Kumar, Chaudhary, Meena, Sundriyal, Rawat and Rana2017; Borgohain et al., Reference Borgohain, Mathew, Chauhan, Jain and Singhvi2020; Panda et al., Reference Panda, Kumar, Das, Devrani, Rai, Prakash and Srivastava2020; Turzewski et al., Reference Turzewski, Huntington, Licht and Lang2020; P. Wang et al., Reference Wang, Wang, Liu, Hu, Qin and Yuan2024b; Fig.1). These deposits primarily reflect localized slack-water deposition in hydraulically sheltered areas along the primary flood route; however, numerical simulations of outburst floods also predict that low-gradient tributaries to the Siang River were extensively backflooded (Turzewski et al., Reference Turzewski, Huntington and LeVeque2019; Morey et al., Reference Morey, Huntington, Turzewski, Mangipudi and Montgomery2022). Tributary backflooding is an important mechanism of slack-water deposition (e.g., Waitt, Reference Waitt1980; Baker et al., Reference Baker, Kochel, Patton, Pickup, Collinson and Lewin1983; Smith, Reference Smith1993; Carling, Reference Carling2013), but backflooded tributaries remain a potentially underexplored archive of outburst flood slack-water deposits in the eastern Himalaya. Here we expand the search for outburst flood deposits to the Siyom River, a low-gradient tributary to the Siang River with a confluence 45 km from the mountain front (Fig. 1). Through an analysis of terrace sedimentology and stratigraphy, including new radiocarbon dating and detrital zircon (U-Th)/Pb provenance geochronology, we present new evidence for Late Pleistocene slack-water deposition along the Siyom River. We interpret these slack-water deposits to have originated from backflooding during Quaternary megafloods that routed through the Siang River valley, and not from localized damming of the Siyom River (cf. Misra and Srivastava, Reference Misra and Srivastava2009).
Background
Evidence for Quaternary outburst floods along the Yarlung–Siang River network comes from paleolake terraces and deposits upstream of the Yarlung Tsangpo Gorge (e.g., Montgomery et al., Reference Montgomery, Hallet, Yuping, Finnegan, Anders, Gillespie and Greenberg2004; Huang et al., Reference Huang, Chen, Burr, Jaiswal, Lin, Yin, Liu, Zhao and Cao2014; Liu et al., Reference Liu, Lai, Hu, Ge, Cui, Zhang and Liu2015; Xu et al., Reference Xu, Ji, Zhong, Hu, Deino, Chen, Tu, Liu, Wang and Sun2020; M. Wang et al., Reference Wang, Wang, Hu, Ge, Liu and Xu2023; P. Wang et al., Reference Wang, Wang, Hu, Ge, Liu and Xu2023; H. Wang et al., Reference Wang, Wang, Hu, Xu, Yuan, Shi and Ding2024; also called the Yarlung Tsangpo Grand Canyon) and paleoflood deposits within and downstream of the Yarlung Tsangpo Gorge (e.g., Lang et al., Reference Lang, Huntington and Montgomery2013; Srivastava et al., Reference Srivastava, Kumar, Chaudhary, Meena, Sundriyal, Rawat and Rana2017; Borgohain et al., Reference Borgohain, Mathew, Chauhan, Jain and Singhvi2020; Panda et al., Reference Panda, Kumar, Das, Devrani, Rai, Prakash and Srivastava2020; Turzewski et al., Reference Turzewski, Huntington, Licht and Lang2020; Guo et al., Reference Guo, Ge, Mao, Liu, Fu and Wu2023; Mao et al., Reference Mao, Guo and Liu2023; P. Wang et al., Reference Wang, Wang, Hu, Liu, Li, Qin and Ge2024a, Reference Wang, Wang, Liu, Hu, Qin and Yuan2024b). Depositional ages constrained by luminescence and radiocarbon dating of both paleolake and paleoflood deposits range from 1 to >50 ka, with ages concentrated in the Late Holocene (ca. <2 ka), Early Holocene (ca. 10–4 ka), and the Late Pleistocene (ca. 50–20 ka). Paleoflood deposits in the Himalayan mountain flood pathway downstream of the Yarlung Tsangpo Gorge are primarily well-sorted, laminated sands interpreted to reflect slack-water deposition (Lang et al., Reference Lang, Huntington and Montgomery2013; Turzewski et al., Reference Turzewski, Huntington, Licht and Lang2020; Guo et al., Reference Guo, Ge, Mao, Liu, Fu and Wu2023; Mao et al., Reference Mao, Guo and Liu2023; P. Wang et al., Reference Wang, Wang, Hu, Liu, Li, Qin and Ge2024a). Provenance analysis, including detrital zircon (U-Th)/Pb geochronology, confirms a nonlocal source in southeastern Tibet for slack-water deposits in the Siang River valley (Lang et al., Reference Lang, Huntington and Montgomery2013; Turzewski et al., Reference Turzewski, Huntington, Licht and Lang2020).
Scaling relationships (Montgomery et al., Reference Montgomery, Hallet, Yuping, Finnegan, Anders, Gillespie and Greenberg2004; P. Wang et al., Reference Wang, Wang, Liu, Hu, Qin and Yuan2024b) and numerical simulations (Morey et al., Reference Morey, Huntington, Turzewski, Mangipudi and Montgomery2022; Guo et al., Reference Guo, Ge, Mao, Liu, Fu and Wu2023) indicate that some paleolake outburst flood discharges exceeded 10⁶ m3/s, reaching the status of “megaflood” (Baker, Reference Baker, Martini, Baker and Garzón2002). Simulation of catastrophic drainage of a reconstructed 81 km3 paleolake predicts peak flood stages exceeding 150 m depth in the lower Siang River valley, with extensive backflooding of adjoining tributaries (Morey et al., Reference Morey, Huntington, Turzewski, Mangipudi and Montgomery2022). In particular, modeling results suggest that the Siyom River, the largest Siang tributary, backflooded more than 50 river kilometers upstream of its confluence and sustained more than 100 m of flood depth for over 40 h as continued flooding of the Siang River impeded drainage of backflooded water (Morey et al., Reference Morey, Huntington, Turzewski, Mangipudi and Montgomery2022; Fig. 2). This period of low flood power and near-zero basal shear stress (Fig. 2) should have resulted in slack-water deposition of suspended load sediments across the Siyom River valley (Carling et al., Reference Carling, Martini, Herget, Borodavko, Parnachov, Burr, Carling and Baker2009; Denlinger and O’Connell, Reference Denlinger and O’Connell2010). However, no slack-water deposits have been reported from alluvial deposits in this area.
Numerical simulation of outburst megaflood backflooding of the Siyom River. Annotated model frames of results originally published in Morey et al. (Reference Morey, Huntington, Turzewski, Mangipudi and Montgomery2022). The megaflood rapidly inundated the Siyom River valley approximately 14 h after the breach of the Zelongnong Glacier dam, flowing more than 50 river kilometers upstream of the Siyom confluence. The Siyom valley reached its maximum inundation level approximately 22 h after the breach, at which time flow velocity and basal shear stresses dropped to near zero despite high basal shear stresses maintained along the adjoining Siang River. Near-zero shear stresses were maintained for at least an additional 40 h after maximum inundation as the elevated Siang River stage impeded Siyom River drainage, leading to localized ponding throughout the Siyom River valley.

Previous workers have ascribed alluvial deposits in the low-gradient lower reaches of the Siyom River valley to tectonic controls. Misra and Srivastava (Reference Misra and Srivastava2009) used optically stimulated luminescence (OSL) to date aggradational terraces to <13 ka and attributed fluviolacustrine aggradation of terrace units to active faulting across the Siyom valley. Previous researchers (Acharyya and Saha, Reference Acharyya and Saha2008; Misra and Srivastava, Reference Misra and Srivastava2009) have identified active faults crossing the river, including the regionally-extensive dextral strike-slip Tuting-Basar Fault (Fig. 1). However, Hooker (Reference Hooker2022) and Salvi et al. (Reference Salvi, Mathew, Pande and Kohn2021) present more recent mapping and find no direct evidence for active faulting downstream of aggradational terraces and alternatively interpret those features previously believed to be faults as lithologic contacts between folded thrust sheets. The relationship between faulting and aggradation remains ambiguous.
We hypothesize that backflooding from Quaternary megafloods similar to the floods simulated by Morey et al. (Reference Morey, Huntington, Turzewski, Mangipudi and Montgomery2022) contributed to aggradation in the Siyom River valley through slack-water deposition, and consequently, slack-water megaflood deposits may remain unidentified within aggradational terraces. We test this hypothesis with new topographic analysis and stratigraphic descriptions of aggradational terraces, including new constraints on the depositional age and provenance of aggradational units.
Methods
We test a possible megaflood origin for particular sedimentary units in the Siyom River valley by mapping terrace surfaces, describing stratigraphic sections of terraces exposures, and performing radiocarbon dating and detrital zircon (U-Th)/Pb provenance geochronology of terrace deposits.
Terrace surfaces
Terrace surfaces were mapped on a 12.5-m-resolution radiometric terrain-corrected digital elevation model (DEM) produced from the Advanced Land Observing Satellite Phased Array L-band Synthetic Aperture Radar (ALOS PALSAR RTC DEM; ASF DAAC, 2014). We combined DEM analysis with field-informed geomorphic mapping to delineate terrace surfaces. We extracted the drainage network using standard hydrologic flow routing (ArcGIS Spatial Analysist Tools: Fill, Flow Direction, Flow Accumulation) and applied a flow accumulation threshold of 105 cells to define the stream network. Strahler stream ordering identified the main channel (order 4; Fig. 3, Siyom River). We interpolated Siyom main channel elevations across the study area using inverse distance weighting (power = 2, search radius = 5 km) to ensure complete spatial coverage, including areas distal from the main channel but proximal to tributaries. Relative elevation (height above channel) was calculated by subtracting this interpolated surface from the DEM. Terrace surfaces were defined as areas meeting three criteria: (1) low slope (0.1–7°); (2) proximity to the drainage network (within 2 km of any channel); and (3) elevation 0–300 m above the modern main channel, based on field observations. We removed pixels that were within 5 m elevation of the Siyom main channel or 2 m elevation of the main tributary channels (stream order = 3), as these surfaces likely represent the modern floodplain. To identify terraces above the modern floodplain, we used statistical analysis of the height distribution of elevation on a pixel-by-pixel basis near Aalo village (also called Aalong; Fig. 3). This allowed us to identify peaks in the elevation data, map those peak elevations back to the DEM, and then use geomorphic mapping informed by fieldwork to map realistic terrace surfaces.
Analysis of terrace surfaces in the Siyom River valley. We identified four regionally extensive terrace surfaces by filtering and clustering pixels from an Advanced Land Observing Satellite Phase Array type L-band Synthetic Aperture Radar Radiometric terrain correction digital elevation map (ALOS PALSAR RTC DEM). Terraces are illustrated on a longitudinal profile of the lower Siyom River and in an inset map of the Aalo village area and its tributary. Terraces around Aalo village are clearly visible from the western side of the valley, as shown in a panoramic field photograph looking eastward from Site 2.

Terrace stratigraphy and sedimentology
In November 2019, we described sedimentary features of terrace deposits in eight sections from two exposures (Sites 4 and 5; Figs. 1, 4, and 5). Site 4 is ca. 70 m west and stratigraphically below Site 5 by ca. 10 m (Figs. 3, 4, and 5). Sections were measured with a fiberglass tape from a vertically excavated face. The grain size of terrace deposits was estimated in the field by visual comparison with a transparent grain-size card, and 80 approximately 100 g subsamples were collected for quantitative grain-size analysis at the Georgia Institute of Technology using a Malvern Mastersizer 3000 laser diffraction particle size analyzer equipped with a HydroEV wet dispersion unit. Subsamples collected for grain-size analyses were pre-sieved with a 1.4 mm (−0.4 φ) mesh, and analysis was performed on the finer size fraction (Fig. 6).
Radiocarbon dating
We collected 13 samples from 7 locations for radiocarbon dating. Sampling targeted bulk organic carbon from organic-rich and carbonaceous silt horizons. Samples were visually inspected for rootlet or other modern organic contamination in the field, then dried, lightly disaggregated, and rechecked for contaminants with a stereomicroscope before analysis. Radiocarbon dating was performed at the University of Georgia Center for Applied Isotope Studies accelerator mass spectrometry facility. Samples were pretreated with hot HCl to remove carbonate contamination. Three aliquots of each sample were measured to determine age uncertainty. Radiocarbon ages were calibrated using CALIB Rev8.2 (calibration dataset: IntCal20 14C; Stuiver and Reimer, Reference Stuiver and Reimer1993; Reimer et al., Reference Reimer, Austin, Bard, Bayliss, Blackwell, Bronk Ramsey and Butzin2020). To compare our new results with previously published ages of paleolakes on the Tibetan Plateau, we recalibrated radiocarbon ages from Montgomery et al. (Reference Montgomery, Hallet, Yuping, Finnegan, Anders, Gillespie and Greenberg2004) using the same calibration dataset (Table 1).
Radiocarbon data for sediment samples in the Siyom River valley and recalibrations of ages from Montgomery et al. (Reference Montgomery, Hallet, Yuping, Finnegan, Anders, Gillespie and Greenberg2004).

a An asterisk (*) indicates a bulk organic carbon sample.
Detrital zircon (U-Th)/Pb geochronology
To constrain sedimentary provenance, we collected four new samples for detrital zircon (U-Th)/Pb geochronology: three samples of sands from terrace exposures and one sample of sand from an active bar in the Siyom River (Fig. 7, Supplementary Table S2). Detrital zircon (U-Th)/Pb geochronology is a well-established method for interpreting the provenance of sedimentary deposits in the eastern Himalaya (e.g., Zhang et al., Reference Zhang, Yin, Liu, Wu, Lin and Grove2012; Lang et al., Reference Lang, Huntington and Montgomery2013; Lang and Huntington, Reference Lang and Huntington2014; Turzewski et al., Reference Turzewski, Huntington, Licht and Lang2020; Betka et al., Reference Betka, Thomson, Sincavage, Zoramthara, Lalremruatfela, Lang, Steckler, Bezbaruah, Borgohain and Seeber2021). Zircons were separated using standard magnetic and heavy mineral separation procedures (Licht et al., Reference Licht, Dupont-Nivet, Win, Swe, Kaythi, Roperch and Ugrai2018; Shekut and Licht, Reference Shekut and Licht2020), mounted and polished to reveal mineral zonation, and imaged with scanning electron microscopy backscatter and cathodoluminescence detectors to identify and target mineral cores during laser ablation. Zircons were ablated with a suit of reference standards (R33, FC−1, SL, Plesovice, and 91500) in two locations using two different analytical instruments. Duplicate analyses of the Zelongong glacier tributary and Siyom River (DZ1) samples at both processing locations illustrate that analytical instrumentation does not change our primary interpretations (Fig. 7). Samples were analyzed at Arizona LaserChron Center (black lines in Fig. 7) using a Photon Machines Analyte G2 excimer laser coupled to a Nu Plasma multi-collector inductively coupled plasma–mass spectrometer (ICP-MS). Analytical protocol for isotope measurements follows Gehrels et al. (Reference Gehrels, Valencia and Ruiz2008), Gehrels and Pecha (Reference Gehrels and Pecha2014), and Pullen et al. (Reference Pullen, Ibanez-Mejia, Gehrels, Giesler and Pecha2018). The (U-Th)/Pb data were reduced using E2AgeCalc (Gehrels et al., Reference Gehrels, Valencia and Ruiz2008). Samples were analyzed at the Georgia Tech Materials Characterization Facility (gray lines in Fig. 7) using a Teledyne Iridia laser ablation system coupled to a Thermo iCAP RQ ICP-MS. The analytical protocol for isotope measurements is based on Chew et al. (Reference Chew, Petrus and Kamber2014), and (U-Th)/Pb data were reduced using iolite v. 4 IsoplotR (Vermeesch, Reference Vermeesch2018). Final results from both methods were visualized using Density Plotter (Vermeesch, Reference Vermeesch2012).
Results
Terrace surfaces
DEM analysis and field mapping reveal four terrace surfaces with distinct elevation peaks above the modern Siyom River floodplain (Fig. 3). DEM elevation distributions show clear peaks corresponding to: Terrace 1 (T1, 218–230 m above sea level [m asl]), Terrace 2 (T2, 249–256 m asl), Terrace 3 (T3, 275–280 m asl), and Terrace 4 (T4, 300–305 m asl) (Fig. 3). Geomorphic mapping confirms these surfaces are laterally continuous along the lower Siyom valley, with the most extensive development near Aalo.
T1 is a dissected aggradational terrace best exposed at Sites 4 and 5 (Fig. 3), where we conducted detailed stratigraphic and sedimentological analysis (described later). T2 is a laterally expansive surface near Aalo, but we were unable to identify suitable exposures within this terrace for detailed stratigraphic description; we collected samples at Site 6 for chronology and provenance (Fig. 1). T3 is exposed at Site 1 south of the main Aalo valley, where we sampled for radiocarbon dating (Figs. 1 and 3). T4 is exposed at Sites 2 and 3, where we documented stratigraphy and collected samples (Supplementary Fig. S2).
Terrace stratigraphy and sedimentology
We focused systematic description on exposures at Sites 4 and 5 within T1. We described the sedimentology of T4 at Site 3. While we observed the T4 terrace at Site 2, we did not systematically describe its exposure at this location, where it is a deeply weathered, meter-thick fine-medium sand and locally derived conglomerate deposit that directly overlies a bedrock strath (Supplementary Fig. S1). No grain size or sections were taken at Site 6. This site consists of a road cut where cobbles fine into gravel/coarse sand into a silty sand, which then transitions into a clay. Radiocarbon and detrital zircon samples were taken from the sand-rich portion of this site. It is possible this site is laterally continuous with the Wak section outlined by Misra and Srivastava (Reference Misra and Srivastava2009). The T4 terrace is defined by two units: a >50-m-thick matrix-supported cobble–boulder conglomerate overlain by ∼5 m of weathered silts (Supplementary Fig. S2). Clasts in the lower conglomerate unit are well sorted and well rounded and primarily skolithos-bearing tan, blue-white, and gray Buxa Group quartzite with minor amounts of other metasedimentary rocks from the Buxa Group (including marble, schist, and phyllite; Hooker, Reference Hooker2022). Boulder imbrication at Site 3 suggests a primarily northward paleo-flow direction, similar to the modern Aalo tributary flow direction (Fig. 3). Weathering, pedogenesis, and bioturbation in the overlying silts have obscured primary stratification.
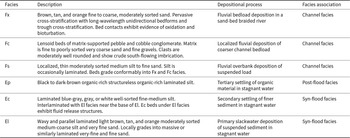
The T1 terrace was described in 10 stratigraphic sections at Site 4 (Fig. 4), as well as in 7 stratigraphic sections at Site 5 (Fig. 5), which lies ca. 70 m west and ca. 10 m above Site 4. From observations at both sites, we defined six sedimentary facies based on a combination of grain size, sedimentary structures, and contact relationship to other facies. Facies include (Table 2): Fx, cross-stratified, well-sorted fine to medium sand; Fs, moderately well-sorted fine medium to coarse silt; Fc, matrix-supported gravel–cobble conglomerate; El, laminated well-sorted medium to coarse silt; Ec, well-sorted medium to fine silt; and Ep, organic-rich silt and detrital organic material layers.
Stratigraphic relationships between fluvial and event deposit facies in T1 at Site 4. Details of contact relationships are illustrated in annotated field photographs. We interpret the contact between fluvial and event deposit facies (Fx to El) as a subhorizontal disconformity with a spatially restricted Ec layer within El deposits. D10, D50, and D90 represent 10th, 50th, and 90th grain-size deciles, indicated by the position of quantitative grain-size measurements; see key for decile explanation. Locations of radiocarbon and detrital zircon (U-Th)/Pb samples are indicated on Sections 3 and 5.

Stratigraphic relationships between fluvial and event deposit facies in T1 at Site 5. Details of contact relationships are illustrated in annotated field photographs. We interpret the contact between fluvial and event deposit facies (Fx to El or Ec) as a low-angle onlap unconformity and the contact between Ec and El as subhorizontal disconformity. D10, D50, and D90 represent 10th, 50th, and 90th grain-size deciles, indicated by the position of quantitative grain-size measurements; see key for decile explanation. Locations of radiocarbon and detrital zircon (U-Th)/Pb samples are indicated for Sections 1 and 4.

Sedimentary facies defined from T1 terrace deposits exposed at Sites 4 and 5 in the Siyom River valley.a

a We interpret both fluvial facies (Fx, Fc, Fs) and event deposit facies (Ep, Ec, El), and describe the interpreted depositional environment for each facies.
Results of quantitative grain-size analysis of ∼100 g subsamples from each facies type are illustrated in Figure 6, and the data are available in Supplementary Table S1. Although facies were not defined solely by grain-size variations throughout the section, both median grain-size and variance in grain size were diagnostic of individual facies.
Cumulative grain-size distributions of ∼100 g subsamples of fluvial and event deposit facies in T1 at Sites 4 and 5. Individual sample measurements are plotted as thin lines and the means of n samples are plotted as thick darker lines with n, the number of samples in the mean, specified. Fluvial facies include moderately well-sorted coarse silt (Fs) and well-sorted medium sand (Fx). Event deposit facies include well-sorted medium to fine silt (Ec) and well-sorted medium to coarse silt (El). Conglomeratic channel facies (Fc) and structureless organic-rich facies (Ep) were not sampled for quantitative grain-size analysis. For each facies, 10th, 50th, and 90th deciles (i.e., D10, D50, and D90) are indicated for the mean distribution.

Radiocarbon dating
We obtained radiocarbon ages from 11 samples from T1, T3, and T4 terrace exposures (Table 1). Sample RC3A of the T4 terrace collected from Site 3 has a median probability calibrated age of 10,640 cal yr BP (10,735−10,564 2σ range; Table 1). Two samples were collected from the T3 terrace surface at Site 1, south of Aalo. Sample RC2A has a radiocarbon age >50,193 yr BP and sample RC2B has a median probability calibrated age of 34,020 cal yr BP (34,287–33,278 2σ range).
Two samples of the T4 terrace collected from Site 3 have median probability calibrated ages of: 18,750 cal yr BP (RC4A, 18,819−18,665 2σ range) and 24,240 cal yr BP (RC4B, 24,511–24,046 2σ range) (Supplementary Fig. S2). Samples are in stratigraphic order. One sample of the T2 terrace collected from Site 6 has a median probability calibrated age of 17,280 cal yr BP (RC4C, 17,410−17,104 2σ range).
Two samples of the T1 terrace collected from Section 5 at Site 4 (Fig. 4) have median probability calibrated ages of 13,010 cal yr BP (RC5B, 13,088−12,910 2σ range) and 15,240 cal yr BP (RC5A, 15,392−15,099 2σ range). Five additional samples of bulk organic carbon from organic-rich layers and carbonaceous silt were collected from stratigraphic Sections 1 and 4 at Site 5 (Fig. 5). Three samples of the T1 terrace from Section 1 have median probability calibrated ages of 10,630 cal yr BP (RC6A, 10,713−10,556 2σ range), 11,080 cal yr BP (RC6B, 11,187−11,067 2σ range), and 12,600 cal yr BP (RC6C, 12,682−12,590 2σ range). Two additional T1 samples from Section 4 have median probability calibrated ages of 10,780 cal yr BP (RC6D, 10,820−10,660 2σ range) and 11,720 cal yr BP (RC6E, 11,834−11,602 2σ range). Samples from all three sections are in stratigraphic order.
Detrital zircon (U-Th)/Pb geochronology
We analyzed one sample from an active channel bar in the Siyom River upstream from the maximum inundation predicted by Morey et al. (Reference Morey, Huntington, Turzewski, Mangipudi and Montgomery2022) (location of sample DZ1 in Fig. 1), and three samples from T1 terrace outcrops: sample DZ2 from Section 3 at Site 4, DZ3 from Section 4 at Site 5, and DZ4 from Section 3 at Site 5 (Figs. 4 and 5). Figure 7 compares the distribution of (U-Th)/Pb ages from these four samples to published data from the Siang River, Zelongnong Glacier tributary on Namche Barwa, and a compilation of previously identified megaflood deposits from the Siang River valley (Lang et al., Reference Lang, Huntington and Montgomery2013; Turzewski et al., Reference Turzewski, Huntington, Licht and Lang2020).
All four samples have similar crystallization age distributions with a primary ca. 500 Ma age component, a subordinate ca. 800 Ma age component, and a few 30–20 Ma discordant zircons. Sample DZ4 also contains <300 Ma zircons (Fig. 7). For sample DZ1 (n = 166 run at Arizona and 148 run at Georgia Tech), 6% of zircon ages are less than 300 Ma, 60% are between 300 and 700 Ma, and 34% are >700Ma. Ten grains are <30 Ma. For sample DZ2 (n = 150, all run at Arizona), 1% of ages are less than 300 Ma, 41% are between 300 and 700 Ma, and 57% are between >700 Ma. Two grains (1%) are less than 30 Ma, both have >30% discordance. For sample DZ3 (n = 150, all run at Arizona), 7% of ages are less than 300 Ma, 50% are between 300 and 700 Ma, and 43% are between >700 Ma. Ten grains are less than 30 Ma, all but two have >30% discordance. For sample DZ4 (n = 302, all run at Georgia Tech), 26% of ages are less than 300 Ma, 33% are between 300 and 700 Ma, ad 41% are >700 Ma. Sixteen grains are less than 30 Ma, all but one have >30% discordance.
Comparison of detrital zircon (U-Th)/Pb crystallization ages between new samples (labeled in bold text) and previously published samples from (1) Lang et al. (Reference Lang, Huntington and Montgomery2013), (2) Turzewski et al. (Reference Turzewski, Huntington, Licht and Lang2020), and (3) Clarke et al. (Reference Clarke, Bhowmik, Ireland, Aitchison, Chapman and Kent2016). Curves are probability density plots created using DensityPlotter (Vermeesch, Reference Vermeesch2012). Left and right columns show two different age ranges for the same dataset. Samples DZ2 and DZ3 from T1 deposits contain 30–20 Ma, ca. 500 Ma, and ca. 800 Ma age components consistent with a local source provenance in Siyom River bedrock units, as illustrated in sample DZ1 and bedrock analyses from Clarke et al. (Reference Clarke, Bhowmik, Ireland, Aitchison, Chapman and Kent2016). DZ4 also contains <30 Ma but largely discordant zircons sourced from the Namche Barwa Massif and 150–30 Ma zircons sourced from Transhimalayan plutons in Tibet. Duplication analyses of the same samples at both the Arizona LaserChron Center (black lines) and Georgia Tech (gray lines) illustrate that varying analytical instrumentation produces very similar age distributions.

Discussion
Evidence for megaflood slack-water deposition along the Siyom River valley may include three criteria: (1) depositional ages that overlap with the existence of paleolakes upstream along the Yarlung River, (2) unique sedimentary facies consistent with megaflood depositional processes during tributary backflooding, and (3) detrital zircon ages indicating a nonlocal provenance in the Yarlung River drainage area. Our observations are consistent with all three criteria, suggesting that there is at least one instance of megaflood backflooding recorded within the Siyom River valley. We argue that evidence for megaflood backflooding is stronger than for temporary damming of the Siyom River.
Depositional ages of Siyom River valley deposits
Although our radiocarbon ages are most useful for constraining the depositional age of the T1 terrace, our results and previous data also provide limited chronological constraints on the modern floodplain, T2, T3, and T4 terraces. We did not sample the modern floodplain for radiocarbon dating, but a 3 ± 1 ka depositional age for deposits underlying this surface has previously been constrained by OSL dating done by Misra and Srivastava (Reference Misra and Srivastava2009), who dated alluvial cover of terraces at four different locations using OSL of separated quartz (with ages of 3 ± 1 ka to 13 ± 1 ka). Our sample at Site 6 from T2 is geographically close to their Wak section (13 ± 1 ka), and they sampled the banks of the Aalo tributary (3 ± 1 ka) and terraces on either side of the channel (7 ± 1 ka and 5 ± 1 ka), which correlate to either T2 or T3. While exact sample locations were not reported, our radiocarbon ages are broadly similar to the Holocene ages from that study. Systematic comparison of radiocarbon and OSL ages is challenging, because the two methods date fundamentally different materials and processes. Radiocarbon ages reflect the timing of carbon fixation in organic matter, which may be older or younger than the enclosing sediment due to reworking, delayed incorporation, or postdepositional contamination (Murray et al., Reference Murray, Arnold, Buylaert, Guérin, Qin, Singhvi, Smedley and Thomsen2021). In contrast, OSL dates the last exposure of quartz grains to sunlight, a process that depends on transport dynamics and bleaching efficiency; incomplete bleaching during high-turbidity flood events or rapid deposition can yield OSL ages that predate the true depositional age (Kalińska et al., Reference Kalińska, Weckwerth, Alexanderson, Piotrowski and Wysota2025). As a result, radiocarbon and OSL commonly bracket different parts of the sediment’s history, making direct comparison of sample ages difficult without independent constraints on reworking, bleaching, and depositional context (Wallinga, Reference Wallinga2002; Rittenour, Reference Rittenour2008). We therefore focus our discussion of depositional ages in the Siyom River valley on interpretation of self-consistent calibrated radiocarbon ages.
Depositional ages of the T2 and T3 terraces near Aalo are not well constrained. Our T2 sample RC4C provides a maximum depositional age constraint of 17,280 cal yr BP (Site 6; Table 1). T3 sample RC2A’s radiocarbon age is beyond the limit of radiocarbon dating (>50 ka) and thus cannot be used (Site 1; Table 1). The other T3 sample (RC2B; Site 1; 34,020 cal yr BP) indicates that T3 may have a Late Pleistocene depositional age (Fig. 3, Table 1).
Radiocarbon analyses from the T4 terrace are all bulk sediment samples, which may be influenced by detrital carbon recycling (e.g., Fowler et al., Reference Fowler, Gillespie and Hedges1986; Nelson et al., Reference Nelson, Carter and Robinson1988; Strunk et al., Reference Strunk, Olsen, Sanei, Rudra and Larsen2020). The T4 terrace sample RC3A (10,640 cal yr BP; Site 2) is younger than the other T4 terrace sample and most of the T1 terrace samples, yet rests at an elevation ca. 20 and 100 m higher than the other T4 and T1 samples, respectively (Fig. 3). We therefore consider T4 sample RC3A (Site 2; 10,640 cal yr BP) to be unreliable and potentially contaminated by younger detrital carbon unobserved in our pre-screening. The two other samples from the T4 terrace (RC4A and RC4B; 18,750 and 24, 240 cal yr BP, respectively) do not overlap within 2σ uncertainty. We attribute this age variation within the same sampling site to differing contributions of detrital carbon recycling.
Our best radiocarbon constraints come from the T1 terrace (Fig. 3). Radiocarbon ages at Site 4 are not in stratigrpahic order, but are consistently older than those at Site 5, which are in stratigraphic order, most overlapping within 2σ uncertainty. We consider ages on the detrital organic material layer at Site 5 (RC6A and RC6D; Ep; Fig. 5) to be least influenced by detrital carbon recycling and consequently our best depositional age constraints. These samples reveal mean calibrated ages of 10,630 and 10,780 cal yr BP, respectively, indicating an Early Holocene age for the deposition of this organic-rich layer at Site 5. The clay/silt Ec unit samples (RC6B, RC6C, and RC6E; Fig. 5) below the organic-rich layer have slightly older Holocene ages (11,080, 12,600, and 11,720 cal yr BP; Table 1). As Site 4 is stratigraphically below Site 5 and has a repeated stratigraphic succession of an El–Ec sequence, we interpret the older ages at Site 4 to reflect a prior, independent event deposit sequence with a maximum depositional age of 13,010 cal yr BP, constrained by sample RC5B (from El Site 4; Fig. 4). Sites 4 and 5 represent the lower elevations of T1—their ages indicating that T1 has mid-Holocene depositional age ca. 15−10 ka.
The timing of Siyom River valley terrace deposition overlaps with the existence and drainage of paleolakes along the Yarlung River in southeastern Tibet. A compilation by M. Wang et al. (Reference Wang, Wang, Hu, Ge, Liu and Xu2023) estimates that major Yarlung paleolake drainages occurred at ca. 4 ka, 12−11 ka, and 17 ka, the latter two of which may correlate to the T1 (15−10 ka) and T2 (17 ka) terraces observed in the Siyom River valley. In particular, our best age constraints from the organic-rich layer (Ep; ca. 10 ka) from T1 are similar in age to radiocarbon samples from two different sites on the Tibetan Plateau with paleolake deposits—a lacustrine terrace from Montgomery et al. (Reference Montgomery, Hallet, Yuping, Finnegan, Anders, Gillespie and Greenberg2004) (9,990 cal yr BP and 11,270 cal yr BP; Table 1) and lacustrine deposits from P. Wang et al. (Reference Wang, Wang, Hu, Ge, Liu and Xu2023) (8,708 cal yr BP and 10,190 cal yr BP). Morey et al. (Reference Morey, Huntington, Turzewski, Mangipudi and Montgomery2022) used the lower-elevation terrace that Montgomery et al. (Reference Montgomery, Hallet, Yuping, Finnegan, Anders, Gillespie and Greenberg2004) dated to 1.22 ka to define the initial lake level in their megaflood simulation.
Depositional environments of T1 terrace facies
We interpret sedimentary deposits of the T1 terrace to include both common fluvial facies as well as unique event deposit facies consistent with backflooding depositional processes. We group these into three facies associations representing distinct depositional environments (Table 2): (1) channel facies (Fx, Fc, Fs) deposited during normal fluvial conditions, (2) syn-flood facies (El, Ec) representing slack-water deposition during valley inundation, and (3) post-flood facies (Ep) representing organic accumulation in residual ponded waters after the flood.
Fluvial deposits in T1
Fluvial facies include cross-stratified sands (Fx) with both inferred flow direction parallel to the modern Siyom River and chaotic flow structures laterally adjacent to one another (Fig. 4). Grain size in these facies (fine to coarse, moderately sorted sand; Table 2) are similar to what was visually observed in depositional point bars within the modern Siyom River channel (Figs. 4 and 5) and what was observed in terraces near Aalo by Misra and Srivastava (Reference Misra and Srivastava2009). Laterally discontinuous, interbedded lenses of pebble conglomerates (Fc) and thin silts (Fs) are common in the lower portions of both Sites 4 and 5 within T1 (Figs. 4 and 5). Clasts in Fc facies in T1 show loose imbrication consistent with modern Aalo tributary channel flow. The T4 terrace conglomerates also exhibit weak imbrication that shows south-to-north paleo-flow (Supplementary Fig. S2). We interpret Fc to reflect localized deposition of coarse channel lag deposits similar to what is found in the bed in the modern Siyom River channel. Fs might represent finer suspended sediment in low-velocity areas of a multichannel stream or in regularly refreshed floodplains. Grain sizes in Fs are finer than anything observed in the modern Siyom River channel. However, tributaries to the Siyom River (in particular the Aalo tributary in Fig. 3) have lower slopes and finer grain sizes than the main channel. We interpret the vertical and lateral heterogeneity of facies Fx, Fc, and Fs in T1 as a record of a dynamic braided mountain river system, similar to the modern Siyom River and its tributaries. These facies deposits are overlain at Sites 4 and 5 by El and Ec facies (Figs. 4 and 5), indicating that they are older than the radiocarbon dates reported for El and Ec at their respective Site. While we do not have a detailed sedimentary section from Site 6 in T2, the upward fining sequence described potentially represents a transition at that location from a channel thalweg to a lower-energy, peripheral fluvial environment.
Event deposits in T1
Above the fluvial deposits observed at Sites 4 and 5 are a series of fine-grained deposits we call “event deposits.” We define an event deposit as a deposit that records a departure from the expected mountain river depositional environment observed throughout the Siang River valley and its tributaries in the eastern Himalaya. These event deposits comprise a fining upward series of three facies—El, Ec, and Ep (Figs. 4 and 5, Table 2, Supplementary Fig. S3)—which we interpret to reflect different depositional stages of valley inundation.
El facies (wavy and parallel laminated silt and very fine sand) records primary settling of suspended sediment during initial inundation of the Siyom River valley. Ec facies (laminated blue-gray clay) records secondary settling of even finer inorganic particles in stagnant or very low-energy water at or after maximum valley inundation. Ep facies (structureless organic-rich layer) records post-flooding deposition, where low-density organic material accumulated in residual ponded waters after the flood event subsided rather than during active inundation.
At each site we observe an erosional contact that records a sharp transition from the fluvial deposits described earlier to the base of the El facies (Figs. 4 and 5). The El unit is at least 0.1 m thick and grades upward into the blue-gray clay of Ec. The transition between El and Ec is often interbedded and exhibits fluid-release structures between layers (Supplementary Fig. S3). The transition from Ec to Ep at Site 5 is a flat, horizontal surface marking the shift to the structureless organic-rich layer. The repetition of El facies at Sites 4 and 5 (with Site 4 stratigraphically lower) may reflect either two separate flood events or discontinuous surges within the same flood event. Outburst megafloods may exhibit complex hydrographs with multiple local discharge peaks that result from ice damming or internal flow dynamics during the flood (Carling, Reference Carling2013; Morey et al. Reference Morey, Huntington, Turzewski, Mangipudi and Montgomery2022). Rhythmically bedded deposits consistent with flow pulsing have been previously observed along the primary flood route (e.g., Lang et al., Reference Lang, Huntington and Montgomery2013; P. Wang et al., Reference Wang, Wang, Liu, Hu, Qin and Yuan2024b) and similar deposits are associated with the Missoula flood slack-water sequences (Smith, Reference Smith1993) and the Bonneville flood (O’Connor, Reference O’Connor1993), and so multiple flood inundation pulses are not unreasonable to expect in a single event.
By combining estimates of the inundation duration from numerical simulations with measurements of the thickness and mean grain size of event deposit facies, we can further estimate the suspended sediment concentration of floodwaters in the Siyom River valley. Using a mass balance approach we calculate the depth-averaged suspended sediment concentration  ${c_s}$ for a single particle size as:
 \begin{equation}c_s^{} = {\text{ }}\frac{{h\rho _b^{}}}{{w_s^{}t}}\end{equation}
where h is the thickness of the resulting deposit,  $\rho _b$ is the bulk density of the deposit, ws is the particle settling velocity and t is the particle settling time. We calculate ws by balancing the drag and gravitational forces on a spherical particle of size d, producing:
 \begin{equation}w_s^{} = {\text{ }}\sqrt {\frac{{\left( {\rho _s^{} - \rho _w^{}} \right)g\frac{4}{3}d}}{{C_D^{}\rho _w^{}}}} \end{equation}
where  $\rho _s^{} - \rho _w^{}$ is the density difference between the sediment particle and fluid, g is acceleration due to gravity, and CD is the drag coefficient.
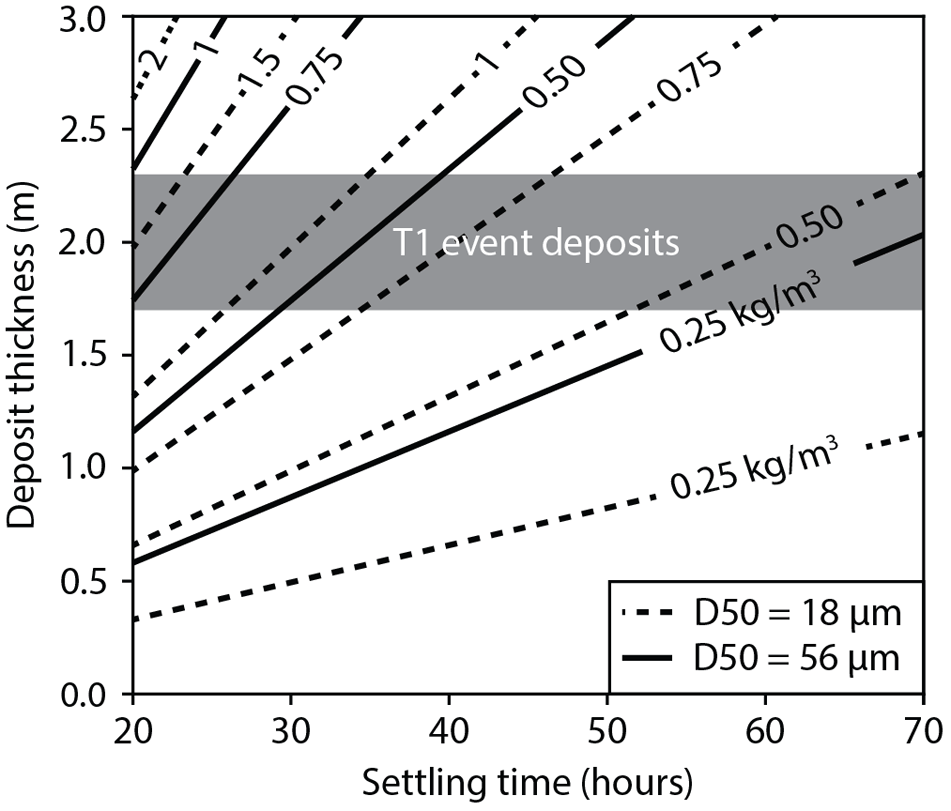
We constrain the time during which settling could have occurred t using the numerical simulation of Morey et al. (Reference Morey, Huntington, Turzewski, Mangipudi and Montgomery2022). This simulation predicts that the Siyom River valley was inundated to a depth of over 150 m (elevation of 372 m) and near-zero basal shear-stress (i.e., stagnant water) conditions within 22 h of the dam breach. These stagnant conditions were sustained for at least an additional 40 h thereafter. This simulation likely overestimates inundation depth due to assumptions of instantaneous dam failure, clear water, and fixed bed topography (Morey et al., Reference Morey, Huntington, Turzewski, Mangipudi and Montgomery2022). The maximum observed terrace elevation at Site 5 (230 m) is substantially lower than the simulated peak inundation elevation (372 m). This 142 m difference could reflect either: (1) actual maximum flood stage was lower than modeled, or (2) the observed deposits settled from suspension in deep water beneath the peak flood surface. Figure 8 illustrates that during stagnant conditions, suspended sediment concentrations between ca. 0.5 to 1.5 kg/m3 can explain the measured thickness of event facies deposits observed in T1 terraces given the inundation time predicted by Morey et al. (Reference Morey, Huntington, Turzewski, Mangipudi and Montgomery2022). These concentrations are similar to measurements from rivers experiencing outburst floods (e.g., Marín et al., Reference Marín, Tironi, Paredes and Contreras2013; Bailey et al., Reference Bailey, Shugar, Tilston, Hubbard, Giesbrecht, Del Bel Belluz and Jackson2025) and 5 to 15 times higher than total suspended-solid measurements collected from the modern Siang River (∼0.1 kg/m3; Das et al., Reference Das, Boruah and Kar2014). Elevated suspended sediment concentrations are typical of outburst floods (e.g., Sattar et al., Reference Sattar, Cook, Rai, Berthier, Allen, Rinzin and Van Wyk de Vries2025) and may even last for weeks after the flood event (e.g., Cook et al., Reference Cook, Andermann, Gimbert, Adhikari and Hovius2018). While not diagnostic of backflooding itself, these suspended sediment concentrations combined with the stratigraphic relationships between the fluvial deposits and event deposits provide two points of evidence that support a backflooding origin for the event deposits at these two sites within T1.
Contour plot illustrating the relationship between settling time and deposit thickness for a column of stagnant water with various suspended sediment concentrations. Solid line contours show predictions for 56 μm particles, corresponding to the D50 of El facies. Dashed line contours show predictions for 18 μm particles, corresponding to the D50 of Ec facies. Gray box outlines the range of conditions necessary to explain the total thickness of Ec and El facies observed in T1 terraces at Sites 4 and 5 given the potential duration of stagnant water inundation in the Siyom valley predicted by Morey et al. (Reference Morey, Huntington, Turzewski, Mangipudi and Montgomery2022).

Sedimentary provenance of T1 deposits
Detrital zircon (U-Th)/Pb geochronology is consistent with a local source provenance for the sandy, fluvial Fx deposits and a Tibetan provenance for the silty sand El deposits at Site 5 (Fig. 7). The ca. 500 Ma age components observed in all three samples originate from Greater and Lesser Himalayan source rocks within the eastern Himalaya (e.g., Cina et al., Reference Cina, Yin, Grove, Dubey, Shukla, Lovera, Kelty, Gehrels, Foster and Thomas2009; Yin et al., Reference Yin, Dubey, Kelty, Webb, Harrison, Chou and Celerier2010; Gehrels, et al., Reference Gehrels, Kapp, DeCelles, Pullen, Blakey, Weislogel and Ding2011; Webb et al., Reference Webb, Yin and Dubey2013). The 30–20 Ma zircons observed in all T1 samples are likely derived from localized granitic units within the Greater Himalayan Sequence (e.g., Clarke et al., Reference Clarke, Bhowmik, Ireland, Aitchison, Chapman and Kent2016). The 800 Ma age component, which is similarly observed in Himalayan source rocks, seen in the two Fx samples (DZ2 and DZ3), is absent in the El sample (DZ4). This uppermost El unit at Site 5 (Fig. 5) notably has a significant component of both (1) Paleogene–Cretaceous ages originating from Tethyan Himalayan and Transhimalayan plutonic units in upstream reaches of the Yarlung River (e.g., Zhang et al., Reference Zhang, Yin, Liu, Wu, Lin and Grove2012; Lang and Huntington, Reference Lang and Huntington2014) and (2) <30 Ma metamorphic zircons with U/Th ratios >10 derived from the Namche Barwa Massif (Booth et al., Reference Booth, Zeitler, Kidd, Wooden, Liu, Idleman, Hren and Chamberlain2004) and observed in a detrital sample from the Zelongnong Glacier catchment (Lang et al., Reference Lang, Huntington and Montgomery2013) (Fig. 7). These young age components in DZ4 show a distinctly different provenance than those observed in the modern Siyom River (DZ1) and the stratigraphically lower fluvial deposits (DZ2 and DZ3; Figs. 4, 5, and 7). In fact, the age components of DZ4 are remarkably similar to the age components of other megaflood samples from the Siang River. The presence of these young Tibetan zircons in the El deposits within T1 conclusively link the Siyom River valley to a source on the Tibetan Plateau. Critically, this provenance evidence is independent of numerical modeling assumptions and provides a direct link between Tibetan-sourced floodwaters and Siyom valley deposits regardless of uncertainties in simulated inundation depths or durations. This evidence, combined with the coincidence of ages with paleolake deposits on the Tibetan Plateau and the stratigraphic relationships between our fluvial and event deposits, provide strong evidence for a megaflood origin for some T1 deposits.
Alternative mechanisms for Siyom River impoundment
Misra and Srivastava (Reference Misra and Srivastava2009) proposed that aggradation of the Siyom River valley may have been due, at least in part, to temporary damming of the river by active faulting downstream of terraces. Recent mapping of this region has not identified active faults that cross the Siyom River downstream of aggradational terraces (Salvi et al., Reference Salvi, Mathew, Pande and Kohn2021; Hooker, Reference Hooker2022). Instead, new observations reveal that fault contacts in this region are extinct, folded Lesser Himalayan thrust sheets with a common late Cenozoic exhumation history controlled by regional back-tilting on the western flank of the Siang Antiform (Salvi et al., Reference Salvi, Mathew, Pande and Kohn2021). Even the Tuting-Basar Fault, which cuts across these Lesser Himalayan thrust sheets and forms the topographic lineaments defining the angular drainage of the lower Siyom River, does not cut across late Cenozoic Siwalik units at the mountain front and thus is not considered to be active (Acharyya and Saha, Reference Acharyya and Saha2008).
Alternatively, a landslide near the Siang River confluence or downstream of Aalo (downstream-most location of inset map in Fig. 3) may have temporarily dammed the Siyom River. Landslide damming is well documented in this region (Shang et al., Reference Shang, Yang, Li, Liu, Liao and Wang2003; Delaney and Evans, Reference Delaney and Evans2015; Liu et al., Reference Liu, Cui, Ge and Yi2018), where remnants of large landslide scars or debris dams can be preserved in the landscape for thousands of years (e.g., Korup and Montgomery, Reference Korup and Montgomery2008). Given the low gradient of the lower Siyom River, a landslide dam exceeding 85 m tall would have been required to explain T1 terrace deposits in the vicinity of Aalo. There is no evidence from either remote sensing or field observations for landslide dam remnants or landslide scars of this magnitude in the lowest reaches of the Siyom River or near Aalo. Rather, additional outburst flood deposits have been observed along the Siyom River immediately upstream of the Siang River confluence (Lang et al., Reference Lang, Huntington and Montgomery2013; Turzewski et al., Reference Turzewski, Huntington, Licht and Lang2020), indicating that there was at least a kilometer of backflow up the Siyom tributary.
Conclusions
This study presents new evidence for megaflood slack-water deposition within aggradational terraces of the Siyom River, a major tributary of the Siang River in the eastern Himalaya. Based on terrace mapping, detailed field observations, and stratigraphic analysis of 17 sections from two sites, we defined six sedimentary facies and interpret a suite of laminated, well-sorted silt and structureless organic-rich units as the products of slack-water deposition during tributary backflooding events. These slack-water facies (El, Ec, Ep) overlie fluvial deposits and appear to record a fining upward sequence consistent with progressive settling of sediment from temporarily impounded waters, likely during glacial lake outburst megafloods sourced from southeastern Tibet. Repetition of the El facies within T1 suggests multiple flood events or pulsed flow during a single flood.
Radiocarbon dating indicates that major phases of Siyom River valley aggradation occurred from the Late Pleistocene to the mid-Holocene (∼34 to 5 ka), with best-constrained event deposit ages from the T1 terrace (∼10.8−10.6 cal ka BP) overlapping with published age constraints for paleolake deposits in southeastern Tibet (Montgomery et al., Reference Montgomery, Hallet, Yuping, Finnegan, Anders, Gillespie and Greenberg2004; P. Wang et al., Reference Wang, Wang, Hu, Ge, Liu and Xu2023). Detrital zircon (U-Th)/Pb provenance data provide independent evidence for this connection: while fluvial sand facies show local Himalayan provenance, event deposit silts contain young Tibetan zircons, demonstrating that megaflood water transported fine-grained Tibetan-sourced sediment upstream into the Siyom River valley. This provenance evidence combined with temporal overlap and distinctive slack-water sedimentology conclusively links Siyom terrace aggradation to Tibetan megafloods. Our analysis rules out local damming of the Siyom River by landslides or faulting, respectively, as the cause of terrace aggradation. Instead, we propose that the sedimentary facies, geomorphic setting, and chronologic context of these deposits support an interpretation that flood slack-water deposits in the Siyom River valley resulted from hydraulic impoundment during one or more outburst floods. Grain size and facies thickness are broadly consistent with the sedimentation patterns predicted by numerical simulations of a megaflood outburst from the Zelongnong Glacier–dammed lake (Morey et al., Reference Morey, Huntington, Turzewski, Mangipudi and Montgomery2022), providing further evidence that this interpretation is reasonable.
These findings demonstrate that slack-water deposits in the Siyom River preserve a valuable archive of past megaflood events. The data provide a sedimentologic and chronologic framework for identifying similar flood-related deposits in other tributaries of the Siang River and offer insights into the paleoflood history of the eastern Himalaya. As outburst floods continue to pose a hazard to communities in this tectonically and climatically dynamic region, documenting the sedimentary record and processes of past outburst flood events can help shed light on both past landscape evolution and future flood risk.
Supplementary material
The supplementary material for this article can be found at https://doi.org/10.1017/qua.2026.10089.
Acknowledgments
The authors acknowledge funding support from the Quaternary Research Center and Department of Earth and Space Sciences at the University of Washington, the School of Earth and Atmospheric Sciences, and Georgia Tech, NSF EAR 2220335 to KAL, 2220336 and 1349279 to KWH, and 2220337 to CMS; field assistance from Monica Hill, Toni Bagra, and John Tayeng; and logistical support from Aborcountry Travels. We thank Senior Editor Nicholas Lancaster, Associate Editor Jim O’Connor, as well as two anonymous reviewers for their constructive reviews. The findings and conclusions in this publication are those of the authors and should not be construed to represent any official USDA or U.S. Government determination or policy.


 Open access