

Introduction
The development of large-scale urban centres has long been a research focus for archaeologists, especially in areas of the world where complex societies are considered to have arisen ex nihilis to form ‘pristine’ civilisations. A key debate in this research has centred on the efficacy of neo-evolutionary approaches to social change and their relationship with more historically contingent models. Neo-evolutionary theory argues that societies pass through defined stages of increasing complexity (bands, tribes, chiefdoms and states, although there may be significant sub-divisions and variations in terminology within each of these categories) in a process that is both unilinear and non-reversible. The central tenets of the theory are considered universal, allowing for the comparison and categorisation of all societies across both time and space, and resulting in the investigation of cross-cultural regularities at a global scale (Flannery Reference Flannery1999). This approach has come under sustained attack from scholars who highlight the variation in the types of complex society visible in the archaeological record and who reject the idea of a single trajectory of increasing complexity as both mechanistic and teleological (McIntosh Reference McIntosh1999; Yoffee Reference Yoffee2005; Blanton & Fargher Reference Blanton and Fargher2008). Rather than looking for cross-cultural ‘laws’ that are generally applicable, emphasis is instead placed on the unique nature of social and political developments in a given region over a particular period and, consequently, the variety of possible routes to different forms of ‘complexity’. However, there is still a tendency among scholars to generalise at the regional level, so that we may talk of ‘African states’, ‘Mesoamerican chiefdoms’ or ‘Mesopotamian cities’ as sets of unified and uniform entities. More importantly, even within this literature, few explicit alternatives to neo-evolutionary models have been proposed.
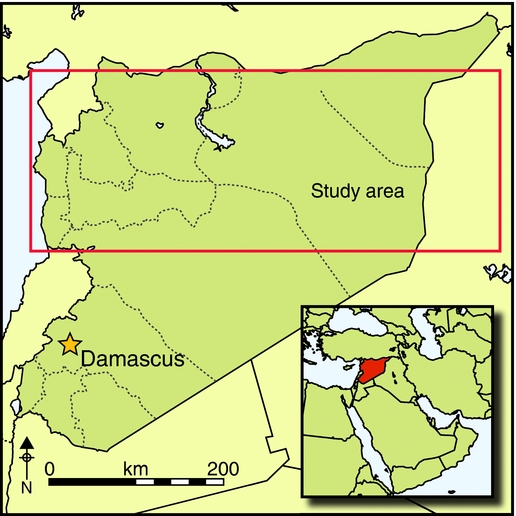
This paper demonstrates the existence of multiple pathways to urbanised societies within northern Mesopotamia during the late fifth, fourth and third millennia BC, and it provides models through which these trajectories may be understood. We make use of excavation data, historical information derived from texts and archaeological surveys to examine the relationship between urban centres and their hinterlands through time. This approach draws on a growing body of theory that emphasises the relatively simple relationships that may exist for cities at a variety of different scales, focusing on population density, occupied areas and technological constraints (Fletcher Reference Fletcher1995, 2004; Batty Reference Batty2013; Bettencourt Reference Bettencourt2013). Evidence is drawn from surveys conducted over the past 30 years in the vicinity of a range of centres across the northern Fertile Crescent (Figure 1 & Table 1). The approach is explicitly regional in scope and incorporates evidence from an area only slightly smaller than the United Kingdom, some 130000km2, including a range of terrains, precipitation regimes and environmental circumstances.
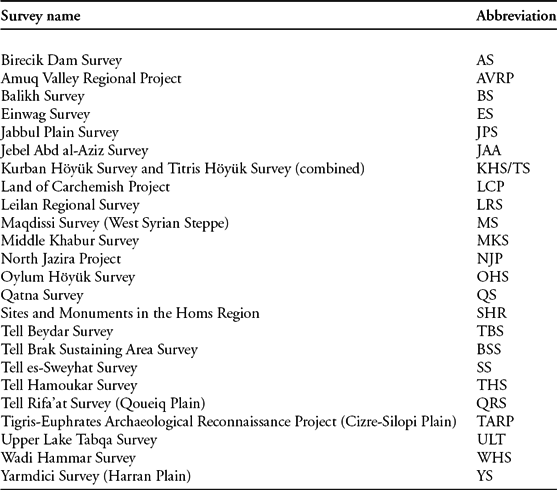
Names and abbreviations of surveys mentioned in the text or included in the wider dataset. Note that where no formal project name is available surveys have been labelled after their director or central site with their geographic location in parentheses.
Sites and surveys used: 1) Nebi Mend; 2) Tell es-Sour; 3) Qatna; 4) Tell She’ir; 5) Hama; 6) Tell Aachane; 7) Tell Qarqur; 8) Ebla; 9) Tell Atchana; 10) Tell Ta’yinat; 11) Tell Imar; 12) Al-Rawda; 13) Oylum Höyük; 14) Umm el-Marra; 15) Tilbeshar; 16) Carchemish; 17) Tell Banat/Bazi; 18) Tell Hadidi; 19) Tell es-Sweyhat; 20) Selenkehiye; 21) Emar; 22) Samsat; 23) Titris Höyük; 24) Kazane Höyük; 25) Tell Hammam et-Turkman; 26) Tell es-Seman; 27) Tell Bia; 28) Tell Chuera; 29) Tell Zeidan; 30) Tell Mabtuh al-Sharqi; 31) Tell Beydar; 32) Tell Brak; 33) Tell Mozan; 34) Tell Leilan; 35) Hamoukar; 36) Tell al-Hawa; 37) Tell Khoshi; 38) Tell Taya; 39) Mari.

Emerging complexity in the Late Chalcolithic
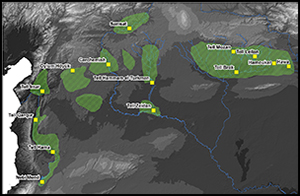
We can distinguish two phases of urbanisation in northern Mesopotamia during the period in question: firstly, during the Late Chalcolithic period (4400–3000 BC); and secondly, during the latter part of the Early Bronze Age (2600–2000 BC), punctuated by a period of ruralisation (Ur 2010b). Our understanding of the dynamics of settlement change in the Late Chalcolithic is hampered by the relatively unrefined chronological schema available. The most widely used ceramic chronology sub-divides the 1400-year period of the Late Chalcolithic into five phases, labelled LC 1–5 (Rothman Reference Rothman2001; Schwartz 2001). The majority of surveys conducted before the publication of the LC chronology did not sub-divide the Late Chalcolithic beyond noting the presence of southern Mesopotamian Uruk types, which we now know to be restricted to the LC 4 and 5 phases. Given this chronological uncertainty, it is difficult to make nuanced statements about the nature of Late Chalcolithic urbanism. However, within this phase small-scale centres of between 10 and 20ha emerged, along with evidence for craft specialisation, monumental architecture and long-distance trade. Occasional sites of this size had existed before, notably at Domuztepe during the Halaf period (Carter et al. Reference Carter, Campbell and Gauld2003) and Tell Zeidan and Tell al-Hawa during the Ubaid (Ball et al. Reference Ball, Tucker and Wilkinson1989; Stein 2012), but by the Late Chalcolithic at least 10 sites across the region had reached 10ha. These sites are generally high tells or citadel mounds with steep sides, suggesting that they developed gradually through successive building phases. Three sites in the central and eastern Khabur Basin, however, reached much larger sizes, including Tell al-Hawa at 50ha (Ball et al. Reference Ball, Tucker and Wilkinson1989), Tell Brak, initially 55ha during LC 1–2, growing to 130ha during the LC 3 and Uruk periods (Ur et al. Reference Ur, Karsgaard and Oates2011), and Khirbet al Fakhar at Tell Hamoukar, which might have been over 300ha and was at least 30ha during the early part of the period (Ur Reference Ur2010a; Al-Quntar et al. Reference Al-Quntar, Khalidi and Ur2011). All three of these sites included an occupational mound as well as wider scatters of dispersed settlement in the surrounding area.
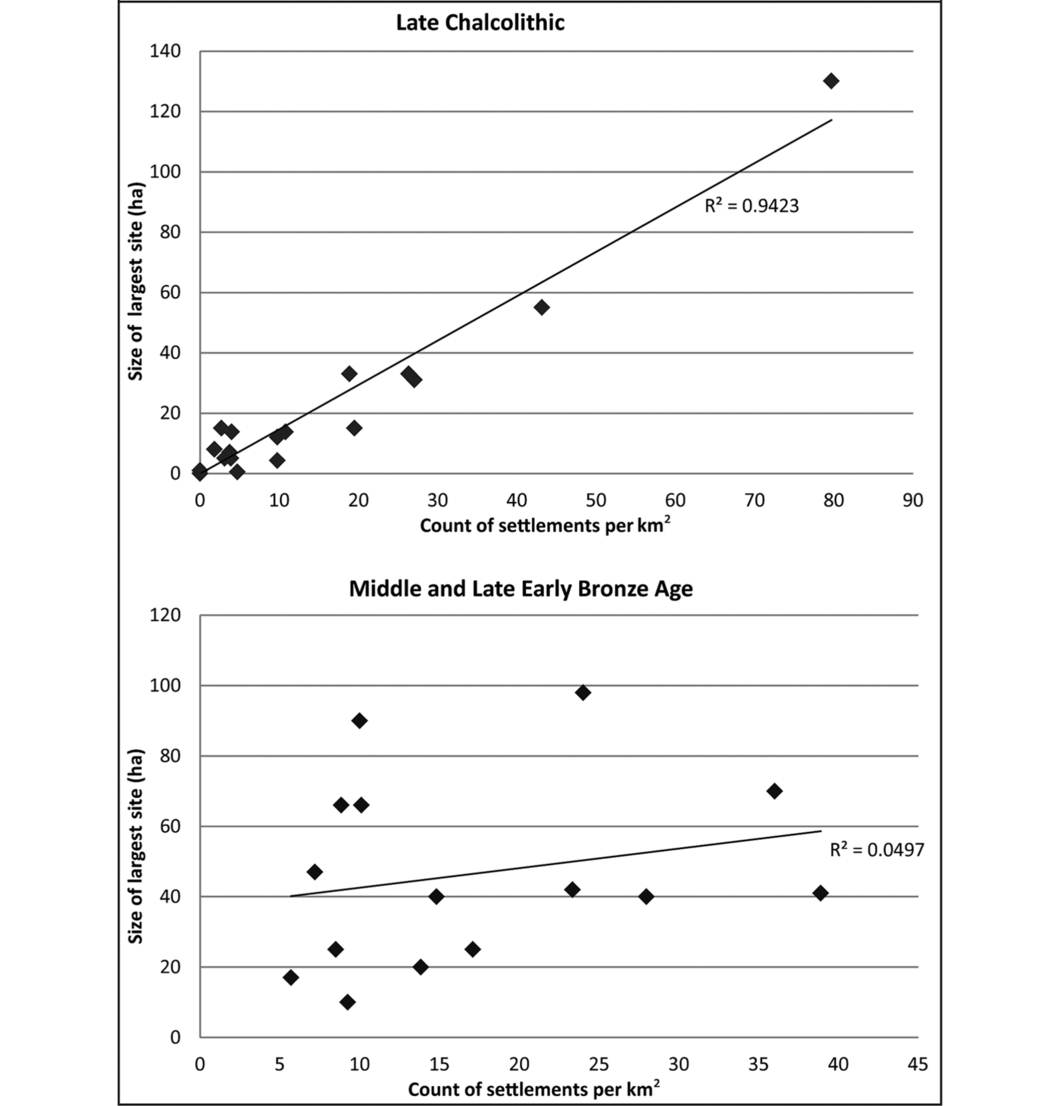
Late Chalcolithic settlement is spatially discontinuous: sites are concentrated in a series of well-watered lowlands and basins along major rivers, with large swathes of intervening steppe and upland being more sparsely inhabited (Figure 2). With the exception of the Khabur Triangle, each basin contains a single ‘centre’. Evidence from multiple archaeological surveys suggests an absence of settlement hierarchies of more than two tiers, with centres surrounded by a number of smaller sites of similar size and a gradual increase in settlement density over time. There is also a strong positive correlation between the size of the largest site within a survey and the density of occupation in the surrounding landscape (Figure 3). These data are computed by dividing the published site counts from each survey by the area of the survey, which is in turn adjusted to compensate for the differences in the length of the Late Chalcolithic phases used (Wilkinson et al. Reference Wilkinson, Philip, Bradbury, Dunford, Donoghue, Galiatsatos, Lawrence, Ricci and Smith2014). This model helps to mitigate the ‘problem of contemporaneity’, where longer phases result in the amalgamation of successive settlement patterns (Ammerman Reference Ammerman1981; Schact Reference Schact1984). If we take settlement density as a proxy for population density, this pattern has significant consequences for understanding early urban development. Most clearly, it suggests a relationship between population size and urban growth that holds for both the relatively small centres and the three larger centres in the Jazira. The three largest sites, Tell Brak, Khirbet al Fakhar and Tell al-Hawa, may therefore result from the same sorts of processes as the smaller centres.
Location of Late Chalcolithic sites and major agricultural basins.

Scatter plots showing size of largest site in survey against number of settlements per km2.
High population density reduces the ‘costs’ of social interaction, as the physical distance between individuals is necessarily decreased (Drennan & Peterson Reference Drennan and Peterson2012). This holds true regardless of the specific form such interaction takes, and it therefore includes negative interactions such as conflict and warfare, as well as more positive collective action and movements of goods and ideas. Evidence for conflict during this period comes from mass graves at Tell Brak (McMahon et al. Reference McMahon, Soltysiak and Weber2011) and destruction levels at Tell Hamoukar (Reichel Reference Reichel2009). However, the longevity of the Late Chalcolithic centres contradicts models that rely on conflict alone as the prime mover in urban development as argued by Carneiro (Reference Carneiro1970) and Flannery (Reference Flannery1999). If we assume that a higher population density results in higher levels of conflict, we would expect greater instability in the settlement pattern as different individuals and groups became dominant. As well as local competition resulting in conflict and violent incorporation of territory and population, we argue that the larger centres that emerged in the Late Chalcolithic were a response to regional level exchange networks and competition (Stein 2012). Many Late Chalcolithic centres are situated at locations favourable for controlling both long-distance movement and the dissemination of goods in their local area, while those in the Khabur and north-western Iraq are situated within a dense network of hollow-way routes that, although primarily of Early Bronze Age date, were probably developing in the Late Chalcolithic (Wilkinson et al. Reference Wilkinson, French, Ur and Semple2010). Both Khirbet al Fakhar and Tell Brak were centres for the trade and manufacture of obsidian derived from the Anatolian highlands (Khalidi et al. Reference Khalidi, Gratuze and Boucetta2009; Al-Quntar et al. Reference Al-Quntar, Khalidi and Ur2011). Other prestige goods, including lapis lazuli from Afghanistan, copper and chlorite from southern Turkey and cowrie shells from the Mediterranean, were also in circulation in a highly integrated regional system (Stein 2012). At the same time, evidence of large-scale feasting from trench TW at Tell Brak and at Arslantepe in Anatolia may be interpreted as an integrative strategy of social bonding performed by local elites (Emberling & McDonald Reference Emberling and McDonald2001; D’Anna & Guarino Reference D’Anna and Guarino2010). We could characterise the Late Chalcolithic centres, therefore, as hubs in both regional exchange and local political networks.
Rapid urban development in the Early Bronze Age
The later phase of urbanisation, commonly termed the ‘second urban revolution’, included “the full-fledged adoption of urban life and its associated institutions” (Akkermans & Schwartz Reference Akkermans and Schwartz2003: 233). ‘Urban’ centres of between 40 and 120ha, several times larger than the modal Late Chalcolithic centre, emerged across the northern Fertile Crescent to include large public buildings, city walls, and evidence for social differentiation and the mass production of goods such as pottery, stone tools and textiles. Writing also appeared in the region for the first time during the later Early Bronze Age (2600–2000 BC), allowing the reconstruction of political events and socio-economic organisation. The Early Bronze Age urban centres differ from those of the Late Chalcolithic in size, spatial organisation, settlement layout and developmental trajectories. While the Khabur triangle remained a locus of settlement, with sites such as Tells Hamoukar, Mozan and Leilan reaching in excess of 90ha, similar sites grew up in the Euphrates Valley and the plains to the east and west, resulting in a more even distribution (Figure 4).
Hub and upstart sites across the northern Fertile Crescent: 1) Nebi Mend; 2) Tell es-Sour; 3) Qatna; 4) Tell She’ir; 5) Hama; 6) Tell Aachane; 7) Tell Qarqur; 8) Ebla; 9) Tell Atchana; 10) Tell Ta’yinat; 11) Tell Imar; 12) Al-Rawda; 13) Oylum Höyük; 14) Umm el-Marra; 15) Tilbeshar; 16) Carchemish; 17) Tell Banat/Bazi; 18) Tell Hadidi; 19) Tell es-Sweyhat; 20) Selenkehiye; 21) Emar; 22) Samsat; 23) Titris Höyük; 24) Kazane Höyük; 25) Tell Hammam et-Turkman; 26) Tell es-Seman; 27) Tell Bia; 28) Tell Chuera; 29) Tell Zeidan; 30) Tell Mabtuh al-Sharqi; 31) Tell Beydar; 32) Tell Brak; 33) Tell Mozan; 34) Tell Leilan; 35) Hamoukar; 36) Tell al-Hawa; 37) Tell Khoshi; 38) Tell Taya; 39) Mari.

Three-tiered site hierarchies are visible in some areas, such as the North Jazira and Karababa dam surveys, but are by no means universal. In contrast to the Late Chalcolithic, there is no clear relationship between settlement density around a centre and the size of that centre (Figure 3), suggesting that regional population density was not a significant factor in urban development. A further difference between the urbanisation process in the Late Chalcolithic and the Early Bronze Age is that the latter appears to have been rapid, occurring within 200–300 years during the middle of the third millennium BC. The decline of these settlements was similarly rapid and has been attributed to a variety of factors, including catastrophic climate change (Weiss Reference Weiss1997), structural instability in food provision (Wilkinson Reference Wilkinson1994), insecurity as a result of invasions from southern Mesopotamia (Sertok et al. Reference Sertok, Kulakoğlu and Squadrone2007) and new cultural groups (Wossink Reference Wossink2009). We have labelled these types of settlement ‘upstarts’ due to the speed of their initial expansion and what appear in some cases to be their counterintuitive locations.
Urbanism as a process: comparative settlement trends
The divergent modes of urban development in the Late Chalcolithic and Early Bronze Age can be investigated by comparing the relationship between urban centres and their surrounding rural settlement. Here, we employ a series of intensive surveys conducted over the past 30 years contained within the database of the Fragile Crescent Project at Durham University. These surveys used similar methods, allowing us to circumvent some of the common problems in the comparison of survey datasets (Alcock & Cherry Reference Alcock and Cherry2004); together, they provide a broad sample coverage of regional settlement. Unfortunately, there are differences in the precision of the ceramic chronologies used in each survey. In order to display the data in the same format, we used the Fragile Crescent Project database to convert each phase into time blocks of 100 years (see Lawrence Reference Lawrence2012; Lawrence et al. Reference Lawrence, Bradbury and Dunford2012). Figure 5 shows the relationship between the size of five large sites (columns) and the total combined occupied area of all of the other sites in the surveys carried out around them (lines). The surveys surrounding Samsat and Titrish Höyüks in the Karababa region (Figure 1) have been combined because they overlap and are spatially contiguous. The difference between the long-lived Late Chalcolithic sites represented by Tell al-Hawa and Samsat and the rapid expansions and contractions at Tell Hamoukar, Tell Sweyhat and Titrish Höyük is immediately clear. Although there appears to be an increase in rural population at the end of the Ubaid, the Late Chalcolithic itself is quite stable. Settlement around the Early Bronze Age urban centres is rather more volatile. In the Tell Hamoukar Survey, rural settlement declined dramatically at the same time as the expansion of Tell Hamoukar, suggesting that local populations might have been drawn into the emerging centre. In fact, the pull of Tell Hamoukar might have extended into the adjacent North Jazira Project survey area where the western half of the survey area was abandoned. Sweyhat and Titrish exhibit precisely the opposite trend: growth at the centre coincided with growth in the hinterland.
Size of urban centre and combined settled area of hinterland survey for the period between 5500 and 1500 BC for five sample surveys.

We can examine this trend at a regional level for the later Early Bronze Age by comparing the percentage change in rural settlement from the pre-urban phase to the urban phase for all of the surveys that included an Early Bronze Age urban centre (Figure 6). It is clear from these data that two fundamentally different types of centre are visible: those in which settlement decreased, or remained unchanged, through the urbanisation process and those in which the expansion of the largest site coincided with an expansion in rural settlement.
Percentage change in hinterland settled area in the pre-urban (Late Chalcolithic) and urban (Mid–Late Early Bronze Age) phases for all surveys containing Early Bronze Age centres.
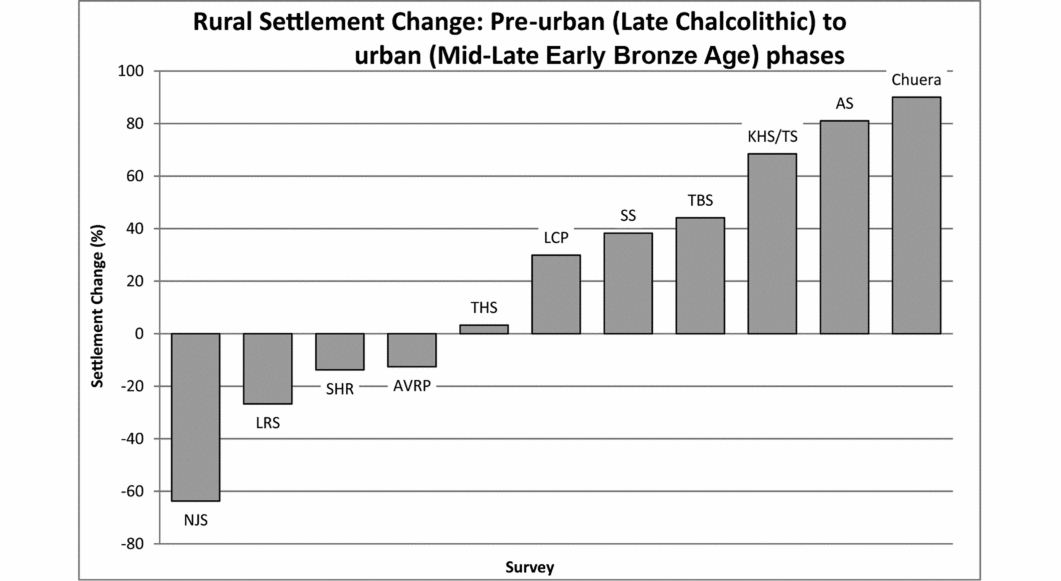
Within the category of ‘upstarts’, we therefore recognise a further sub-division between centres that could have expanded through the reorganisation of their local settlement pattern and those that must have required external population reservoirs to sustain their growth. We call these endogenous upstarts and exogenous upstarts. Quite where these populations might have been coming from requires more research, but it is notable that very few surveys report a decline in settlement during the later Early Bronze Age. One exception to this is a recently published survey of the Cizre-Silopi plain in the Upper Tigris region to the north of the Khabur Basin, which does experience a significant decline in settlement (Algaze et al. Reference Algaze, Hammer and Parker2012). It is possible that certain under-surveyed areas, such as the foothills of the Taurus mountain range, might have experienced population decline as people moved into the plains and steppe to the south, but more data are required to test this hypothesis.
The spatial distribution of the two types of upstart provides the starting point for a model of their development. Endogenous upstarts are located in the same fertile basins as the Late Chalcolithic hubs; in fact, some hub sites, such as Tell Leilan, became enlarged upper towns for the Early Bronze Age cities. Exogenous upstarts, by contrast, are located in previously marginal areas, especially in the steppe, where subsistence based solely on rain-fed agriculture carries a greater risk (Smith et al. Reference Smith, Wilkinson and Lawrence2014). Moreover, the later part of the Early Bronze Age across the northern Fertile Crescent saw a substantial expansion of settlement into more marginal environments. This process was linked to changes in agricultural practices, animal husbandry and social organisation (Lawrence Reference Lawrence2012; Wilkinson et al. Reference Wilkinson, Philip, Bradbury, Dunford, Donoghue, Galiatsatos, Lawrence, Ricci and Smith2014). The widespread uptake of wool-bearing sheep and the attendant trade in textiles meant large tracts of land that could not be used to support agriculture reliably became productive, whereas land in more fertile areas that had previously been used to grow flax became available for other crops. This ‘fibre revolution’ might have resulted in an economic boom, but it must have had profound social implications for labour organisation, specialisation and perhaps gender roles (McCorriston Reference McCorriston1997), while the development of institutions capable of bearing and manipulating the risks inherent in practising agriculture in more marginal environments might also have played a role (Wilkinson et al. Reference Wilkinson, Galiatsatos, Lawrence, Ricci, Philip and Dunford2012). The transportable nature of both sheep and goat flocks and manufactured textiles would have allowed for trade and exchange on a scale altogether different from that seen in earlier periods. A key constraint in the development of urbanism in northern Mesopotamia compared with that in southern Mesopotamia might have been the inability to transport bulk staple products such as cereals, due to the lack of navigable canals (Algaze Reference Algaze2005, 2008). Large-scale sheep and goat herding, the commodification of durable lightweight textiles and the widespread use of equids as pack animals, first domesticated in the fourth millennium (Grigson Reference Grigson1995, 2006: 233), provided a less efficient alternative to waterborne trade in staples.
Urban morphology in the Early Bronze Age
The distinction between endogenous and exogenous upstarts is all the more significant because, once established, both types exhibit similar formal properties in urban morphology and landscape signature. In contrast to the gradually developing high mounds of the Late Chalcolithic, the Early Bronze Age centres, which included a small upper town and an extensive fortified lower town, account for the vast majority of the new ‘urban’-sized settlements (Figure 7). In general, upper towns were occupied in preceding periods, and in some cases might have been reasonably sized settlements prior to the Early Bronze Age expansion. For example, the step trench at Tell Leilan revealed a sequence dating back to at least the early part of the Late Chalcolithic (Schwartz Reference Schwartz1988).
Schematic outlines of several Early Bronze Age centres. Black lines represent city walls, dark grey shows the bottom of tell, light grey illustrates the top of tell. From top left to bottom right: Kazane Höyük; Tell Hadidi; Tilbeshar; Tell es-Sweyhat; Tell Banat/Bazi; Carchemish; Titris Höyük and Tell es-Seman.
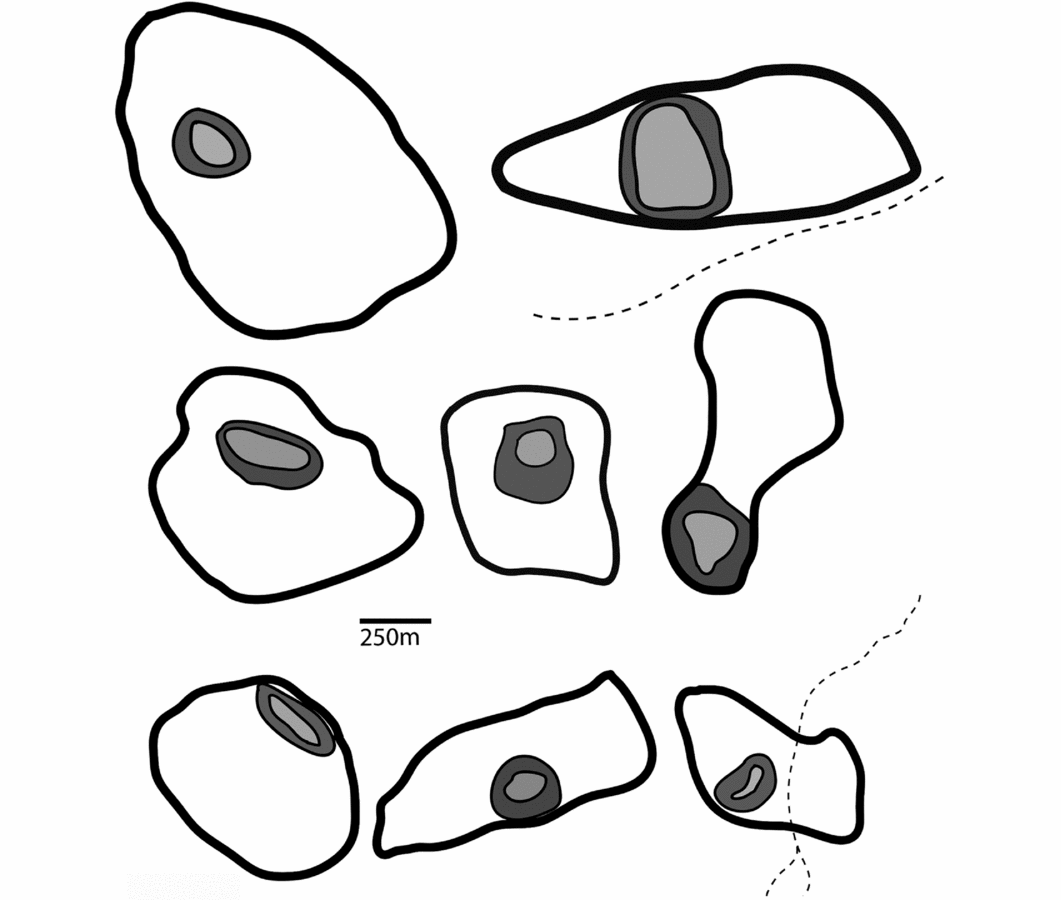
Tell Hamoukar, Tell Mozan and Carchemish have also revealed similar LC 3 layers, along with isolated Ubaid and even Halaf sherds (Woolley Reference Woolley1934; Buccellati & Kelly-Buccellati Reference Buccellati and Kelly-Buccellati1988; Gibson et al. Reference Gibson, Al-Azam, Reichel, Al-Quntar, Franke, Khalidi, Hritz, Coyle, Colantoni, Tenney, Abdul Aziz and Hartnell2002), whereas Tell es-Sweyhat and Titrish Höyük were founded in the first half of the Early Bronze Age (Zettler Reference Zettler1997; Algaze et al. Reference Algaze, Dinckan, Hartenberger, Matney, Pournelle, Rainville, Rosen, Rupley, Schlee and Vallet2001). Once expansion had occurred, these tells became the focal part of the settlement, often including palaces and other monumental buildings. Lower towns have attracted less archaeological attention, and it is unclear to what degree these new areas of occupation resulted from the emergent logic of simultaneous settlement by a large number of people or, as some have argued, the imposition of a unified urban plan by elites or institutions (Meyer Reference Meyer2007; Ristvet Reference Ristvet2011). Excavation and geophysical prospection reveal dense occupation and a certain amount of organisation, particularly visible in patterns of long-lived avenues or streets (Nishimura Reference Nishimura2008; Creekmore Reference Creekmore2010; Pfälzner Reference Pfälzner2010). We also know from later textual sources that the inhabitants of both northern and southern Mesopotamian cities had a clear conception of their own urban environment, which included upper and lower cities and fortification walls, all of which had individual names (Van de Mieroop Reference van de Mieroop2007 [1997]; Rey Reference Rey2012). This does not preclude a model in which growth occurred as a piecemeal or random process, but it is probably more appropriate to speak of degrees of urban planning (Smith Reference Smith2007) rather than a simple emergent-versus-planned dichotomy. In the context of the low-density urbanism of the lowland Maya, Christian Isendahl used the term “planned organic growth” to articulate the idea of “intentional convention” in urban form (Isendahl Reference Isendahl2012: 1122). Applying this concept to the densely occupied lower towns of the northern Fertile Crescent, we suggest that pragmatic and functional choices in house location made at an individual or household level by large numbers of new settlers led to a coordinated system of local rules. Once in place, the built environment, land tenure and property rights were key structuring principles in the ongoing development of the city as a whole.
Discussion: multiple pathways to urbanism
It has been argued that the growth of urban centres in the northern Fertile Crescent was constrained by a size ceiling of around 100ha (Wilkinson Reference Wilkinson1994), later revised to 120ha by Stein (Reference Stein2004). This ceiling, and its estimated population, could be supported by the modelled agricultural yields from the centre and its surrounding settlements, along with the attendant transport costs in moving bulk volumes of staple products. The 100ha figure is also cited by Roland Fletcher as an ‘operational ceiling’ for agrarian urban centres in general (Fletcher Reference Fletcher1995). The above data suggest that urban sites could not transgress the 100–120ha ‘operational ceiling’ without significant changes in organisation or increased risk of instability and size reduction. Tell Brak exceeded the limit by some 10ha during the second half of the Late Chalcolithic, while Khirbet al Fakhar might have reached 300ha. However, the surface collection evidence from both Tell Brak and Khirbet al Fakhar reveal a pattern of dispersed clusters of settlement unlike either the high-mounded Late Chalcolithic hubs or the contiguous upper and lower town formations of the Early Bronze Age upstarts, and neither site maintained this size for more than a few hundred years. However, below this ‘urban’ ceiling, broad categories can be distinguished based on differences in their rate of growth and the source of the population for that growth.
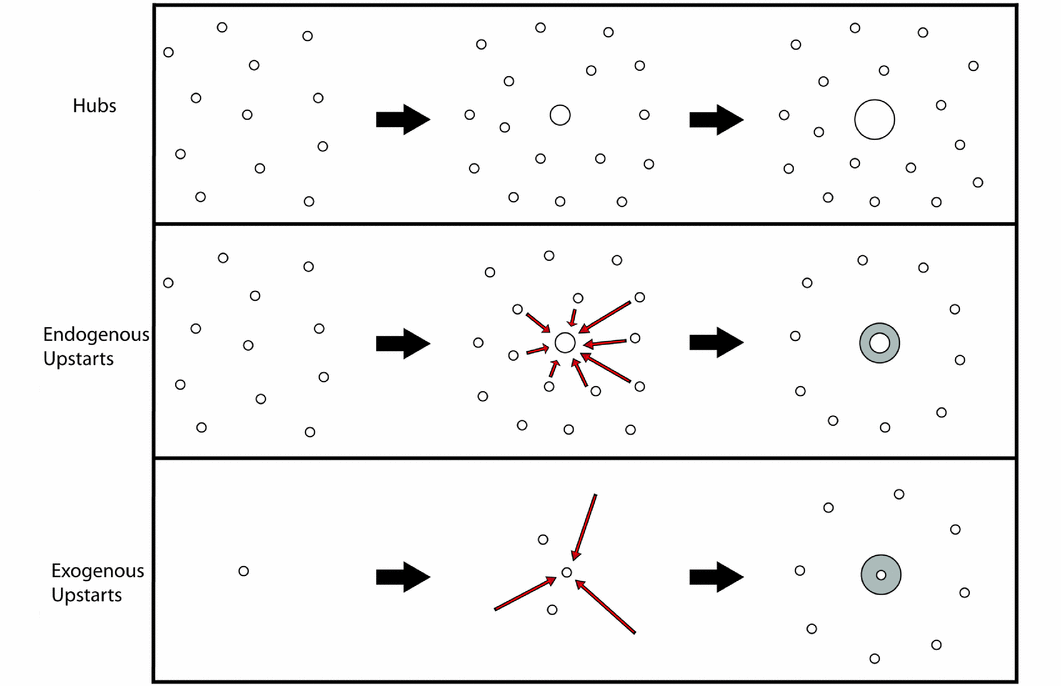
Of the three distinct pathways that resulted in the development of urban centres (Figure 8), slow-growing hub sites appear to have emerged over the course of a millennium or more in areas of dense and gradually increasing local population. In contrast to the hubs, both categories of upstart developed and declined rapidly in a cycle of boom and bust. In the case of endogenous upstarts, growth appears to have resulted from a reorganisation of local populations, with individuals being drawn to the cities from the surrounding villages. This local source of population was not available to the exogenous upstarts, which were predominantly located in areas with very little pre-existing settlement and must therefore have relied on external sources of population.
Schematic representation of three major pathways to urbanism in the northern Fertile Crescent. Small dots represent tell sites, dark grey represents lower towns, red arrows represent population movements.
If, as in most citadel cities, the tell formed a pre-expansion settlement of Late Chalcolithic or early Early Bronze Age date, the ratio of the tell area to total site area provides a rough proxy for the degree of expansion of the site. The bi-axial plot shows Early Bronze Age citadel cities with a small tell and a large total site area within the darker shaded area (Figure 9). In contrast, slow-growing Late Chalcolithic hubs occupy a domain in which site size did not exceed 55ha, although occasionally these exhibit rapid expansions as with LC 3–4 Brak (Ur et al. Reference Ur, Karsgaard and Oates2011; located by arrow on Figure 9). In contrast to Early Bronze Age citadel cities, large Late Chalcolithic tells, which continued to grow slowly and which lack evidence of a lower town, usually exhibit a small but relatively constant ratio between tell area and total area (steady growth, lighter shaded area, Figure 9). Although this concept provides only an approximation for the degree of settlement expansion, it illustrates an envelope of behaviours ranging from slow growth in the Late Chalcolithic, through to explosive growth as at LC 3–4 Brak and Hawa and in the Early Bronze Age citadel cities. The chart also accommodates the large number of small, relatively stable tells that dominate the Fertile Crescent landscape (Wilkinson et al. Reference Wilkinson, Galiatsatos, Lawrence, Ricci, Philip and Dunford2012), as well as new foundations that lack tells (not plotted on Figure 9, but occurring in the narrow void to the left). Phases of expansion off the tell, usually of 200–300 years and rarely more than 500–600 years duration, suggest that urbanisation was pulsating rather than gradual. The rare phases of explosive growth in the Late Chalcolithic become more common and formalised in the later third millennium BC.
Scatter plot of total size of settlement against size of mounded tell part of settlement.

The 55ha area of Tell Brak in LC 2 represents a ceiling for the maximum size of steady settlement growth. If settlement population was in the range of 100–150 persons per hectare, the estimated site population of 5500–8250 people would require a cultivated territory of some 4.2–5.1km radius, a figure that approximates to a local agricultural territory in which cultivation could be conducted entirely from the central settlement. This would also be the case if settlement was limited to the main mound, some 40ha, which, with a radius of cultivation of 3.6–4.4km, would again be potentially self-sufficient. Higher population densities, or sites larger than 55ha, would not be sustainable within a single walking-distance territory. Significant expansion of settlement beyond the tell would probably correspond to a shift to a more complex political economy dependent upon staple contributions from outlying communities and a reliable transport infrastructure. Such a shift from a central tell to an expanded outer town, being dependent upon the incorporation of outlying communities into a growing polity created by ambitious kings or chiefs, would be inherently unstable, hence the evidence for pulsating growth.
Conclusion
Early urbanisation in the northern Fertile Crescent cannot be shoehorned into a single process; variations are evident based upon site morphology and the context of local settlement. The initial phase of urbanisation began with slow-growth ‘hub’ sites that, as self-supporting entities within a local catchment, may be best thought of as agro-towns rather than cities proper. The second phase of urbanisation involved the development of a series of ‘upstarts’, cities that grew rapidly and shared a distinctive upper and lower town morphology as a result, and that required shifts in population of different kinds. Throughout these processes there appear to have been limitations on the form and scale of growth. Late Chalcolithic towns were not sustainable when their population rose beyond that which could be supported by the immediately surrounding area. This limitation appears to have been circumvented during the Early Bronze Age through new forms of political and economic organisation that allowed cities to become integrated into wider networks. However, the urbanisation ‘moment’ in the Early Bronze Age was relatively brief and, again, the cities involved could not sustain themselves in the long term. Urban formation appears to have been a pulsating phenomenon that required levels of political, social and economic complexity and integration that could not be sustained for long periods.
Acknowledgements
We thank Graham Philip and the members of the Fragile Crescent Project at Durham University, as well as participants in the Durham Early Urbanism Seminar, for discussion and comments. Thanks are also given to the Arts and Humanities Research Council (grant no. AH/FO10095/1: Fragile Crescent Project), the British Academy and Council for British Research in the Levant (CBRL) for funding. We are very grateful to the Syrian Directorate General of Antiquities and Museums for supporting our various field projects. Timothy Matney and an anonymous reviewer provided useful suggestions for the final manuscript.


