


1 Introduction
Low-density jets are central to many technological processes, such as thermal plasma spraying and fuel injection. At sufficiently high values of the Reynolds number and transverse curvature, such jets can become globally unstable owing to the presence of a sufficiently large region of local absolute instability (Chomaz, Huerre & Redekopp Reference Chomaz, Huerre and Redekopp1988; Monkewitz & Sohn Reference Monkewitz and Sohn1988; Lesshafft, Huerre & Sagaut Reference Lesshafft, Huerre and Sagaut2007; Coenen & Sevilla Reference Coenen and Sevilla2012; Coenen et al. Reference Coenen, Lesshafft, Garnaud and Sevilla2017; Chakravarthy, Lesshafft & Huerre Reference Chakravarthy, Lesshafft and Huerre2018). This causes the flow to transition from a spatial amplifier of extrinsic perturbations (a fixed point perturbed by noise) to a self-excited oscillator with an intrinsic natural frequency (a periodic limit cycle), behaving as a prototypical hydrodynamic oscillator (Huerre & Monkewitz Reference Huerre and Monkewitz1990). The transition to global instability in low-density jets was originally thought to occur solely via a supercritical Hopf bifurcation (Monkewitz et al. Reference Monkewitz, Bechert, Barsikow and Lehmann1990; Raghu & Monkewitz Reference Raghu and Monkewitz1991; Kyle & Sreenivasan Reference Kyle and Sreenivasan1993). Recently, however, Zhu, Gupta & Li (Reference Zhu, Gupta and Li2017) have shown that this transition can also occur via a subcritical Hopf bifurcation, with a hysteric bistable regime between the Hopf and saddle-node (SN) points. Specifically, through transient hot-wire measurements, these researchers were able to evaluate the coefficients of a truncated Landau equation, establishing that cubic nonlinearity is stabilising in supercritical bifurcations but is destabilising in subcritical bifurcations, which require quintic or higher-order terms for saturation. This highlights the importance of nonlinearity in low-density jets.
In many situations in nature and engineering, it is of interest to know how a nonlinear system responds to noise, as this can affect the interactions within the system and provide insight into its stability and dynamics (Risken Reference Risken1996). For example, Lee et al. (Reference Lee, Zhu, Li and Gupta2019) used a high-order Landau equation and its corresponding Fokker–Planck equation to perform system identification (SI) of a low-density jet, with input data coming from measurements of the noise-induced dynamics in the unconditionally stable regime (USR, i.e. the regime in which the system is stable to infinitesimal as well as finite-amplitude perturbations), prior to both the Hopf and SN points. These researchers showed that this approach can enable accurate prediction of (i) the order of nonlinearity, (ii) the types and locations of the bifurcation points, and hence the stability boundaries, and (iii) the limit-cycle dynamics beyond such boundaries. That study by Lee et al. (Reference Lee, Zhu, Li and Gupta2019) follows another by Noiray & Schuermans (Reference Noiray and Schuermans2013), who showed on a gas-turbine combustor that SI can also be performed using just the stochastic forcing from the underlying turbulent flow field, with no need for external noise application. Moreover, Rigas et al. (Reference Rigas, Morgans, Brackston and Morrison2015) used a nonlinear Langevin equation to show that the effect of input turbulence on the large-scale dynamics of an axisymmetric wake can be modelled as white noise. The common link among these studies, which has not been explored before in hydrodynamics, is coherence resonance (CR). This is a universal feature of nonlinear dynamical systems near a Hopf bifurcation, and provides a suitable framework within which to understand and unify the stochastic dynamics of such systems (Ushakov et al. Reference Ushakov, Wünsche, Henneberger, Khovanov, Schimansky-Geier and Zaks2005).
1.1 Coherence resonance in nonlinear dynamical systems
In seminal work, Wiesenfeld (Reference Wiesenfeld1985) applied external noise to an oscillatory system near a Hopf bifurcation and found that, rather than inducing more randomness, the applied noise induced more order as the Hopf point was approached. This noise-induced order gave rise to precursors in the power spectra capable of forecasting the onset of nonlinear instabilities. The counterintuitive but constructive role of noise was further investigated by Pikovsky & Kurths (Reference Pikovsky and Kurths1997), who found that the coherence of a FitzHugh–Nagumo system peaks at an intermediate noise amplitude – a phenomenon they called CR. Later Ushakov et al. (Reference Ushakov, Wünsche, Henneberger, Khovanov, Schimansky-Geier and Zaks2005) showed that CR is a generic feature of nonlinear dynamical systems near a supercritical or subcritical Hopf bifurcation and that CR is caused by interactions between noise and system nonlinearities. A defining feature of CR is that noise enhances the deterministic dynamics via selective amplification, producing a peak in coherence at an intermediate noise amplitude (Neiman, Saparin & Stone Reference Neiman, Saparin and Stone1997). Since its discovery, CR has been studied in a variety of nonlinear dynamical systems, ranging from electrochemical cells (Kiss et al. Reference Kiss, Hudson, Santos and Parmananda2003) to semiconductor lasers (Ushakov et al. Reference Ushakov, Wünsche, Henneberger, Khovanov, Schimansky-Geier and Zaks2005).
In fluid mechanics, however, CR has thus far been identified in only one class of system. Kabiraj et al. (Reference Kabiraj, Steinert, Saurabh and Paschereit2015) experimentally investigated the noise-induced dynamics of a prototypical thermoacoustic system undergoing a subcritical Hopf bifurcation. By applying noise to the system in its USR, they found that its coherence reaches a maximum at an intermediate noise amplitude and increases as the system approaches the SN point, prior to entering the hysteric bistable regime. Later this experimental evidence of CR was qualitatively reproduced by Gupta et al. (Reference Gupta, Saurabh, Paschereit and Kabiraj2017) using low-order simulations, confirming that the increase in noise-induced coherence can be used as an instability precursor. These researchers also extended their analysis to supercritical Hopf bifurcations, demonstrating that the noise-induced dynamics can be used to distinguish between subcritical and supercritical Hopf bifurcations, even before the onset of instability. However, despite its potential applications, CR has yet to be generalised to hydrodynamic systems, particularly those with high-order nonlinearities.
1.2 Contributions of the present study
As a purely nonlinear phenomenon, CR is active only in systems with sufficient nonlinearity. In our previous study (Zhu et al. Reference Zhu, Gupta and Li2017), we established the role of nonlinearity in low-density jets by demonstrating that they can undergo both supercritical and subcritical Hopf bifurcations. Here we go further to show that CR exists in such jets, producing noise-induced dynamics that can be used to detect and distinguish between the two types of bifurcation, even before the stability boundaries are reached. This has important implications for our understanding of how nonlinear systems respond to noise – potentially unifying the work of Noiray & Schuermans (Reference Noiray and Schuermans2013), Rigas et al. (Reference Rigas, Morgans, Brackston and Morrison2015) and Lee et al. (Reference Lee, Zhu, Li and Gupta2019) – and can be exploited for practical uses such as precursor development and SI (Gupta et al. Reference Gupta, Saurabh, Paschereit and Kabiraj2017). Below we will describe our experimental set-up (§ 2), present evidence of CR in a prototypical hydrodynamic system (§ 3), show that CR can be modelled with a universal oscillator equation containing high-order nonlinear terms (§ 4), and conclude with the key implications of this study (§ 5).
2 Experimental set-up
The prototypical hydrodynamic system under study is a low-density jet. The jet is axisymmetric, incompressible and momentum-dominated, which implies that its transition to global instability is governed by three main parameters (Hallberg & Strykowski Reference Hallberg and Strykowski2006): (i) the jet-to-ambient density ratio $S\equiv \unicode[STIX]{x1D70C}_{j}/\unicode[STIX]{x1D70C}_{\infty }$
, (ii) the transverse curvature
$S\equiv \unicode[STIX]{x1D70C}_{j}/\unicode[STIX]{x1D70C}_{\infty }$
, (ii) the transverse curvature $D/\unicode[STIX]{x1D703}_{0}$
, where
$D/\unicode[STIX]{x1D703}_{0}$
, where $D=6~\text{mm}$
is the nozzle exit diameter and
$D=6~\text{mm}$
is the nozzle exit diameter and $\unicode[STIX]{x1D703}_{0}$
is the momentum thickness at the nozzle exit, and (iii) the jet Reynolds number
$\unicode[STIX]{x1D703}_{0}$
is the momentum thickness at the nozzle exit, and (iii) the jet Reynolds number $Re\equiv \unicode[STIX]{x1D70C}_{j}U_{j}D/\unicode[STIX]{x1D707}_{j}$
, where
$Re\equiv \unicode[STIX]{x1D70C}_{j}U_{j}D/\unicode[STIX]{x1D707}_{j}$
, where $U_{j}$
is the jet centreline velocity and
$U_{j}$
is the jet centreline velocity and $\unicode[STIX]{x1D707}_{j}$
is the jet dynamic viscosity. The jet is produced in the same facility as that used by Lee et al. (Reference Lee, Zhu, Li and Gupta2019), so only a brief overview is given here. A helium–air mixture is discharged from an axisymmetric convergent nozzle (area ratio of 100:1) into quiescent air at atmospheric pressure and temperature (293 K). The nozzle is fed by an upstream settling chamber equipped with a loudspeaker, which receives a white Gaussian noise signal (bandwidth: 0–20 MHz) from a function generator. Although the noise signal driving the loudspeaker is white, the velocity signal produced at the nozzle exit (
$\unicode[STIX]{x1D707}_{j}$
is the jet dynamic viscosity. The jet is produced in the same facility as that used by Lee et al. (Reference Lee, Zhu, Li and Gupta2019), so only a brief overview is given here. A helium–air mixture is discharged from an axisymmetric convergent nozzle (area ratio of 100:1) into quiescent air at atmospheric pressure and temperature (293 K). The nozzle is fed by an upstream settling chamber equipped with a loudspeaker, which receives a white Gaussian noise signal (bandwidth: 0–20 MHz) from a function generator. Although the noise signal driving the loudspeaker is white, the velocity signal produced at the nozzle exit ( $x/D=0$
) is not necessarily white, owing to acoustic resonances in the settling chamber. Nevertheless, our nozzle is designed to keep such resonances away from the noise-induced jet modes (400–500 Hz), producing a reasonably flat velocity spectrum across this frequency range of interest (see later in figure 3
a). The jet response is measured with a calibrated hot-wire anemometer positioned at
$x/D=0$
) is not necessarily white, owing to acoustic resonances in the settling chamber. Nevertheless, our nozzle is designed to keep such resonances away from the noise-induced jet modes (400–500 Hz), producing a reasonably flat velocity spectrum across this frequency range of interest (see later in figure 3
a). The jet response is measured with a calibrated hot-wire anemometer positioned at $(x/D,r/D)=(1.5,0)$
, where
$(x/D,r/D)=(1.5,0)$
, where $x$
and
$x$
and $r$
are the streamwise and radial coordinates, respectively. This sampling location is chosen for two reasons: (i) it is approximately where the amplitude of the global mode peaks for the conditions of this study, and (ii) it is within the jet potential core, ensuring that the hot-wire probe is exposed to only velocity fluctuations, not concentration fluctuations. The hot-wire voltage is sampled at 32 768 Hz for 8 s on a 16-bit data acquisition system. The noise amplitude is defined as the root mean square of the velocity fluctuations, normalised by the time-averaged velocity, both measured at the nozzle exit, i.e. at
$r$
are the streamwise and radial coordinates, respectively. This sampling location is chosen for two reasons: (i) it is approximately where the amplitude of the global mode peaks for the conditions of this study, and (ii) it is within the jet potential core, ensuring that the hot-wire probe is exposed to only velocity fluctuations, not concentration fluctuations. The hot-wire voltage is sampled at 32 768 Hz for 8 s on a 16-bit data acquisition system. The noise amplitude is defined as the root mean square of the velocity fluctuations, normalised by the time-averaged velocity, both measured at the nozzle exit, i.e. at $(x/D,r/D)=(0,0)$
:
$(x/D,r/D)=(0,0)$
: $\unicode[STIX]{x1D6FC}\equiv u_{0,rms}^{\prime }/\overline{u_{0}}$
. The lower limit of
$\unicode[STIX]{x1D6FC}\equiv u_{0,rms}^{\prime }/\overline{u_{0}}$
. The lower limit of $\unicode[STIX]{x1D6FC}$
is the inherent background noise in the jet without any external forcing.
$\unicode[STIX]{x1D6FC}$
is the inherent background noise in the jet without any external forcing.
3 Experimental results
3.1 Unforced dynamics
Experiments are conducted on a low-density jet undergoing both supercritical ( $S=0.14$
) and subcritical (
$S=0.14$
) and subcritical ( $S=0.18$
) Hopf bifurcations to a limit cycle. Figure 1(a,c) shows the bifurcation diagrams for both cases in the absence of external forcing, with the jet dynamics represented by the time-averaged amplitude of the normalised velocity fluctuations,
$S=0.18$
) Hopf bifurcations to a limit cycle. Figure 1(a,c) shows the bifurcation diagrams for both cases in the absence of external forcing, with the jet dynamics represented by the time-averaged amplitude of the normalised velocity fluctuations, $|\overline{A}|\equiv |u^{\prime }|/\overline{u}$
. These diagrams are created by increasing and decreasing
$|\overline{A}|\equiv |u^{\prime }|/\overline{u}$
. These diagrams are created by increasing and decreasing $Re$
(and thus
$Re$
(and thus $D/\unicode[STIX]{x1D703}_{0}$
) at a fixed
$D/\unicode[STIX]{x1D703}_{0}$
) at a fixed $S$
. In figure 1(a), the forward and backward paths overlap, with no sign of hysteresis. This is characteristic of a supercritical Hopf bifurcation and can be modelled with a cubic Landau equation (Raghu & Monkewitz Reference Raghu and Monkewitz1991). However, a large non-hysteretic jump in
$S$
. In figure 1(a), the forward and backward paths overlap, with no sign of hysteresis. This is characteristic of a supercritical Hopf bifurcation and can be modelled with a cubic Landau equation (Raghu & Monkewitz Reference Raghu and Monkewitz1991). However, a large non-hysteretic jump in $|\overline{A}|$
occurs at the Hopf point. We attribute this jump to this particular case being near the supercritical–subcritical border, where the Hopf and SN points are so close together as to be indistinguishable within experimental uncertainty (Lee et al.
Reference Lee, Zhu, Li and Gupta2019). This interpretation of supercritical-like behaviour can also explain similar jumps in
$|\overline{A}|$
occurs at the Hopf point. We attribute this jump to this particular case being near the supercritical–subcritical border, where the Hopf and SN points are so close together as to be indistinguishable within experimental uncertainty (Lee et al.
Reference Lee, Zhu, Li and Gupta2019). This interpretation of supercritical-like behaviour can also explain similar jumps in $|\overline{A}|$
observed in the low-density jet experiments of Hallberg & Strykowski (Reference Hallberg and Strykowski2006) and Zhu et al. (Reference Zhu, Gupta and Li2017). In § 4, we will explore the implications of this jump on the modelling of CR. Specifically, we will show that, when determining the model coefficients, it is insufficient to simply rely on the conventional method of transient experiments, as this can lead to poorer predictions than those provided by SI methods based on the Fokker–Planck equation (Lee et al.
Reference Lee, Zhu, Li and Gupta2019). In figure 1(c), the forward and backward paths do not overlap, owing to the presence of a hysteretic bistable regime between the Hopf and SN points (grey region). These features are characteristic of a subcritical Hopf bifurcation and require at least quintic nonlinearity to be accurately modelled (Zhu et al.
Reference Zhu, Gupta and Li2017).
$|\overline{A}|$
observed in the low-density jet experiments of Hallberg & Strykowski (Reference Hallberg and Strykowski2006) and Zhu et al. (Reference Zhu, Gupta and Li2017). In § 4, we will explore the implications of this jump on the modelling of CR. Specifically, we will show that, when determining the model coefficients, it is insufficient to simply rely on the conventional method of transient experiments, as this can lead to poorer predictions than those provided by SI methods based on the Fokker–Planck equation (Lee et al.
Reference Lee, Zhu, Li and Gupta2019). In figure 1(c), the forward and backward paths do not overlap, owing to the presence of a hysteretic bistable regime between the Hopf and SN points (grey region). These features are characteristic of a subcritical Hopf bifurcation and require at least quintic nonlinearity to be accurately modelled (Zhu et al.
Reference Zhu, Gupta and Li2017).
Experimental bifurcation diagrams in the absence of external forcing for (a) a supercritical Hopf bifurcation at $S=0.14$
and (c) a subcritical Hopf bifurcation at
$S=0.14$
and (c) a subcritical Hopf bifurcation at $S=0.18$
. Panels (b,d) show the jet response at increasing
$S=0.18$
. Panels (b,d) show the jet response at increasing $\unicode[STIX]{x1D6FC}$
for the supercritical and subcritical cases, respectively. Here the red lines with triangular markers represent the unforced dynamics, which is equivalent to the backward paths shown in panels (a,c).
$\unicode[STIX]{x1D6FC}$
for the supercritical and subcritical cases, respectively. Here the red lines with triangular markers represent the unforced dynamics, which is equivalent to the backward paths shown in panels (a,c).

3.2 Noise-induced dynamics
External noise is now applied to the jet in its USR, denoted by points A–D in figure 1. Figure 1(b,d) shows the jet response at five different noise amplitudes ( $\unicode[STIX]{x1D6FC}$
) and the unforced condition (red lines). The vertical dashed line marks the critical
$\unicode[STIX]{x1D6FC}$
) and the unforced condition (red lines). The vertical dashed line marks the critical $Re$
, which corresponds to the Hopf point in the supercritical case (figure 1
b) and to the SN point in the subcritical case (figure 1
d). If the jet were unreceptive to noise, its response
$Re$
, which corresponds to the Hopf point in the supercritical case (figure 1
b) and to the SN point in the subcritical case (figure 1
d). If the jet were unreceptive to noise, its response $|\overline{A}|$
would remain relatively constant as the stability boundary is approached at a fixed
$|\overline{A}|$
would remain relatively constant as the stability boundary is approached at a fixed $\unicode[STIX]{x1D6FC}$
. However, as figure 1(b,d) shows, for all values of
$\unicode[STIX]{x1D6FC}$
. However, as figure 1(b,d) shows, for all values of $\unicode[STIX]{x1D6FC}$
and regardless of the super/subcritical nature of the Hopf bifurcation,
$\unicode[STIX]{x1D6FC}$
and regardless of the super/subcritical nature of the Hopf bifurcation, $|\overline{A}|$
increases as
$|\overline{A}|$
increases as $Re$
approaches its critical value. Physically, this increase in
$Re$
approaches its critical value. Physically, this increase in $|\overline{A}|$
arises from spatial amplification of the applied noise by convective modes, whose growth rates increase as the stability boundary is approached from within the USR (Huerre & Monkewitz Reference Huerre and Monkewitz1990). Although indicative of noise receptivity, the increase in
$|\overline{A}|$
arises from spatial amplification of the applied noise by convective modes, whose growth rates increase as the stability boundary is approached from within the USR (Huerre & Monkewitz Reference Huerre and Monkewitz1990). Although indicative of noise receptivity, the increase in $|\overline{A}|$
is not, by itself, an indicator of CR because it contains no information about the degree of coherence. Thus, it is necessary to consider additional indicators.
$|\overline{A}|$
is not, by itself, an indicator of CR because it contains no information about the degree of coherence. Thus, it is necessary to consider additional indicators.
One candidate is the decay rate of the autocorrelation function (ACF), which was used by Pikovsky & Kurths (Reference Pikovsky and Kurths1997) in their original paper on CR. Figure 2(a,c) shows the ACF of the jet velocity signal (blue line) and its amplitude envelope (red line) at low, intermediate and high values of $\unicode[STIX]{x1D6FC}$
for both supercritical and subcritical Hopf bifurcations. An exponential function is fitted to the ACF amplitude envelope, and the exponent is extracted as the ACF decay rate, which is plotted as a function of
$\unicode[STIX]{x1D6FC}$
for both supercritical and subcritical Hopf bifurcations. An exponential function is fitted to the ACF amplitude envelope, and the exponent is extracted as the ACF decay rate, which is plotted as a function of $\unicode[STIX]{x1D6FC}$
in figure 2(b,d). In all cases, the ACF oscillates with a decaying amplitude, indicating a finite, but decreasing, degree of coherence. In the supercritical case (figure 2
a,b), the ACF decays increasingly rapidly as
$\unicode[STIX]{x1D6FC}$
in figure 2(b,d). In all cases, the ACF oscillates with a decaying amplitude, indicating a finite, but decreasing, degree of coherence. In the supercritical case (figure 2
a,b), the ACF decays increasingly rapidly as $\unicode[STIX]{x1D6FC}$
increases. In the subcritical case (figure 2
c,d), the ACF decays most slowly at an intermediate value of
$\unicode[STIX]{x1D6FC}$
increases. In the subcritical case (figure 2
c,d), the ACF decays most slowly at an intermediate value of $\unicode[STIX]{x1D6FC}$
, as evidenced by a peak in the ACF decay rate (figure 2
d). This peak, which is due to CR, shows that noise does not always suppress the regularity of a system, but can also enhance it via selective amplification (Neiman et al.
Reference Neiman, Saparin and Stone1997). However, the existence of CR in the supercritical case (figure 2
a,b) is not as conclusive as it is in the subcritical case (figure 2
c,d) because the degree of correlation in the former decreases more or less monotonically with
$\unicode[STIX]{x1D6FC}$
, as evidenced by a peak in the ACF decay rate (figure 2
d). This peak, which is due to CR, shows that noise does not always suppress the regularity of a system, but can also enhance it via selective amplification (Neiman et al.
Reference Neiman, Saparin and Stone1997). However, the existence of CR in the supercritical case (figure 2
a,b) is not as conclusive as it is in the subcritical case (figure 2
c,d) because the degree of correlation in the former decreases more or less monotonically with $\unicode[STIX]{x1D6FC}$
, with no intermediate peak. According to Ushakov et al. (Reference Ushakov, Wünsche, Henneberger, Khovanov, Schimansky-Geier and Zaks2005), the different ACF decay trends observed between the supercritical and subcritical cases can be attributed to the different degrees of nonlinearity present in the two systems, and to the fact that different nonlinear terms respond differently to external noise. Nevertheless, as we will see shortly, the supercritical case still exhibits definitive signs of CR when analysed in the frequency domain using spectral measures.
$\unicode[STIX]{x1D6FC}$
, with no intermediate peak. According to Ushakov et al. (Reference Ushakov, Wünsche, Henneberger, Khovanov, Schimansky-Geier and Zaks2005), the different ACF decay trends observed between the supercritical and subcritical cases can be attributed to the different degrees of nonlinearity present in the two systems, and to the fact that different nonlinear terms respond differently to external noise. Nevertheless, as we will see shortly, the supercritical case still exhibits definitive signs of CR when analysed in the frequency domain using spectral measures.
Experimental correlation trends: (a,c) the ACF at low, intermediate and high values of $\unicode[STIX]{x1D6FC}$
and (b,d) the ACF decay rate as a function of
$\unicode[STIX]{x1D6FC}$
and (b,d) the ACF decay rate as a function of $\unicode[STIX]{x1D6FC}$
. Data are shown both for (a,b) the supercritical case at point A in figure 1(a,b) and for (c,d) the subcritical case at point A in figure 1(c,d). In panels (b,d), the ACF decay rate is estimated from three different data ranges: 0–30 cycles (circular markers), 0–20 cycles (blue bars) and 0–10 cycles (green bars). The qualitative difference between (b) the supercritical case and (d) the subcritical case remains apparent even when the cycle number drops to as low as 10, demonstrating the robustness of the fitting technique used to estimate the ACF decay rate.
$\unicode[STIX]{x1D6FC}$
. Data are shown both for (a,b) the supercritical case at point A in figure 1(a,b) and for (c,d) the subcritical case at point A in figure 1(c,d). In panels (b,d), the ACF decay rate is estimated from three different data ranges: 0–30 cycles (circular markers), 0–20 cycles (blue bars) and 0–10 cycles (green bars). The qualitative difference between (b) the supercritical case and (d) the subcritical case remains apparent even when the cycle number drops to as low as 10, demonstrating the robustness of the fitting technique used to estimate the ACF decay rate.

Experimental evidence of CR: (a) definition of $\unicode[STIX]{x1D6FD}\equiv H/(\unicode[STIX]{x0394}f/f_{p})$
, as illustrated with a noise-induced spectral peak at
$\unicode[STIX]{x1D6FD}\equiv H/(\unicode[STIX]{x0394}f/f_{p})$
, as illustrated with a noise-induced spectral peak at $S=0.18$
and
$S=0.18$
and $Re=751$
(point B in figure 1
c,d) for
$Re=751$
(point B in figure 1
c,d) for $\unicode[STIX]{x1D6FC}=2.59\times 10^{-3}$
, with the red line indicating a Lorentzian fit. Also shown is
$\unicode[STIX]{x1D6FC}=2.59\times 10^{-3}$
, with the red line indicating a Lorentzian fit. Also shown is $\unicode[STIX]{x1D6FD}$
as a function of
$\unicode[STIX]{x1D6FD}$
as a function of $\unicode[STIX]{x1D6FC}$
at four different values of
$\unicode[STIX]{x1D6FC}$
at four different values of $Re$
in the USR: (b) the supercritical case at points A–D in figure 1(a,b) and (c) the subcritical case at points A–D in figure 1(c,d).
$Re$
in the USR: (b) the supercritical case at points A–D in figure 1(a,b) and (c) the subcritical case at points A–D in figure 1(c,d).

As a further indicator of CR, the coherence factor ( $\unicode[STIX]{x1D6FD}$
) is computed as per figure 3(a), based on the definition by Ushakov et al. (Reference Ushakov, Wünsche, Henneberger, Khovanov, Schimansky-Geier and Zaks2005). First, the power spectral density (PSD) is computed from the velocity signal in the jet core (
$\unicode[STIX]{x1D6FD}$
) is computed as per figure 3(a), based on the definition by Ushakov et al. (Reference Ushakov, Wünsche, Henneberger, Khovanov, Schimansky-Geier and Zaks2005). First, the power spectral density (PSD) is computed from the velocity signal in the jet core ( $x/D=1.5$
). Then, a Lorentzian function is least-squares fitted to the PSD peak arising from interactions between the applied noise and the least stable eigenmode. In this way, the coherence factor can be computed as
$x/D=1.5$
). Then, a Lorentzian function is least-squares fitted to the PSD peak arising from interactions between the applied noise and the least stable eigenmode. In this way, the coherence factor can be computed as $\unicode[STIX]{x1D6FD}\equiv H/(\unicode[STIX]{x0394}f/f_{p})$
, where
$\unicode[STIX]{x1D6FD}\equiv H/(\unicode[STIX]{x0394}f/f_{p})$
, where $H$
is the height of the PSD peak at frequency
$H$
is the height of the PSD peak at frequency $f_{p}$
and
$f_{p}$
and $\unicode[STIX]{x0394}f$
is the width at
$\unicode[STIX]{x0394}f$
is the width at $H/2$
. Also shown in figure 3(a) is the corresponding PSD measured at the jet base (
$H/2$
. Also shown in figure 3(a) is the corresponding PSD measured at the jet base ( $x/D=0$
). This PSD is relatively flat, in contrast to the sharp PSD observed downstream in the jet core (
$x/D=0$
). This PSD is relatively flat, in contrast to the sharp PSD observed downstream in the jet core ( $x/D=1.5$
). This difference, which is typical of all the cases studied here, confirms that the PSD peak used to compute
$x/D=1.5$
). This difference, which is typical of all the cases studied here, confirms that the PSD peak used to compute $\unicode[STIX]{x1D6FD}$
is indeed due to selective noise amplification by the jet, rather than due to a forcing signal with resonant spectral peaks of its own.
$\unicode[STIX]{x1D6FD}$
is indeed due to selective noise amplification by the jet, rather than due to a forcing signal with resonant spectral peaks of its own.
Figure 3(b,c) shows $\unicode[STIX]{x1D6FD}$
as a function of
$\unicode[STIX]{x1D6FD}$
as a function of $\unicode[STIX]{x1D6FC}$
at four different Reynolds numbers (points A–D in figure 1). In the supercritical case (figure 3
b), at every value of
$\unicode[STIX]{x1D6FC}$
at four different Reynolds numbers (points A–D in figure 1). In the supercritical case (figure 3
b), at every value of $Re$
,
$Re$
, $\unicode[STIX]{x1D6FD}$
first increases, reaches a maximum, and then decreases as
$\unicode[STIX]{x1D6FD}$
first increases, reaches a maximum, and then decreases as $\unicode[STIX]{x1D6FC}$
increases. The maximum in
$\unicode[STIX]{x1D6FC}$
increases. The maximum in $\unicode[STIX]{x1D6FD}$
, or
$\unicode[STIX]{x1D6FD}$
, or $\unicode[STIX]{x1D6FD}_{max}$
, occurs at the so-called optimal noise amplitude,
$\unicode[STIX]{x1D6FD}_{max}$
, occurs at the so-called optimal noise amplitude, $\unicode[STIX]{x1D6FC}_{opt}$
, which is where the intrinsic coherent motion of the jet is most effectively induced by selective noise amplification (Neiman et al.
Reference Neiman, Saparin and Stone1997). The presence of a peak in
$\unicode[STIX]{x1D6FC}_{opt}$
, which is where the intrinsic coherent motion of the jet is most effectively induced by selective noise amplification (Neiman et al.
Reference Neiman, Saparin and Stone1997). The presence of a peak in $\unicode[STIX]{x1D6FD}$
at an intermediate value of
$\unicode[STIX]{x1D6FD}$
at an intermediate value of $\unicode[STIX]{x1D6FC}$
confirms that, in the USR near the supercritical stability boundary (Hopf point), the jet exhibits CR. Similar evidence of CR is observed in the subcritical case (figure 3
c), although here the stability boundary corresponds to a SN point rather than a Hopf point.
$\unicode[STIX]{x1D6FC}$
confirms that, in the USR near the supercritical stability boundary (Hopf point), the jet exhibits CR. Similar evidence of CR is observed in the subcritical case (figure 3
c), although here the stability boundary corresponds to a SN point rather than a Hopf point.
As $Re$
increases for both supercritical and subcritical Hopf bifurcations (figure 3
b,c),
$Re$
increases for both supercritical and subcritical Hopf bifurcations (figure 3
b,c), $\unicode[STIX]{x1D6FD}_{max}$
increases but
$\unicode[STIX]{x1D6FD}_{max}$
increases but $\unicode[STIX]{x1D6FC}_{opt}$
decreases. This implies that as the jet approaches its stability boundary, its noise-induced dynamics becomes more coherent and more receptive to external noise. This dependence of
$\unicode[STIX]{x1D6FC}_{opt}$
decreases. This implies that as the jet approaches its stability boundary, its noise-induced dynamics becomes more coherent and more receptive to external noise. This dependence of $\unicode[STIX]{x1D6FD}_{max}$
and
$\unicode[STIX]{x1D6FD}_{max}$
and $\unicode[STIX]{x1D6FC}_{opt}$
on the proximity to the stability boundary concurs with the observations of Semenov et al. (Reference Semenov, Feoktistov, Vadivasova, Schöll and Zakharova2015). However, the mechanisms generating the peaks in
$\unicode[STIX]{x1D6FC}_{opt}$
on the proximity to the stability boundary concurs with the observations of Semenov et al. (Reference Semenov, Feoktistov, Vadivasova, Schöll and Zakharova2015). However, the mechanisms generating the peaks in $\unicode[STIX]{x1D6FD}$
differ between the supercritical and subcritical cases. In the supercritical case, the peak in
$\unicode[STIX]{x1D6FD}$
differ between the supercritical and subcritical cases. In the supercritical case, the peak in $\unicode[STIX]{x1D6FD}$
arises from a competition between monotonic increases in both
$\unicode[STIX]{x1D6FD}$
arises from a competition between monotonic increases in both $H$
and
$H$
and $\unicode[STIX]{x0394}f$
with increasing
$\unicode[STIX]{x0394}f$
with increasing $\unicode[STIX]{x1D6FC}$
. In the subcritical case, the peak in
$\unicode[STIX]{x1D6FC}$
. In the subcritical case, the peak in $\unicode[STIX]{x1D6FD}$
arises from the co-occurrence of a maximum in
$\unicode[STIX]{x1D6FD}$
arises from the co-occurrence of a maximum in $H$
and a minimum in
$H$
and a minimum in $\unicode[STIX]{x0394}f$
at
$\unicode[STIX]{x0394}f$
at $\unicode[STIX]{x1D6FC}_{opt}$
. Although not shown here for brevity, both of these trends are consistent with the Langevin simulations and laser experiments of Ushakov et al. (Reference Ushakov, Wünsche, Henneberger, Khovanov, Schimansky-Geier and Zaks2005), broadening their universality.
$\unicode[STIX]{x1D6FC}_{opt}$
. Although not shown here for brevity, both of these trends are consistent with the Langevin simulations and laser experiments of Ushakov et al. (Reference Ushakov, Wünsche, Henneberger, Khovanov, Schimansky-Geier and Zaks2005), broadening their universality.
4 Modelling CR with a universal oscillator equation
To model the observed noise-induced dynamics, we use a weakly nonlinear framework based on the van der Pol (VDP) oscillator, with its coefficients determined in two different ways: (i) via the conventional method of measuring the amplitude evolution in transient experiments and fitting the data to the corresponding Landau equation, and (ii) via the SI method of Lee et al. (Reference Lee, Zhu, Li and Gupta2019), based on the Fokker–Planck equation. The details of these models, including their relationship with the Navier–Stokes equations, have been discussed by Provansal, Mathis & Boyer (Reference Provansal, Mathis and Boyer1987), Sipp & Lebedev (Reference Sipp and Lebedev2007) and Noiray & Schuermans (Reference Noiray and Schuermans2013). For the conventional method, of particular relevance is the study by Raghu & Monkewitz (Reference Raghu and Monkewitz1991), who measured the coefficients of a cubic Landau equation for a low-density jet undergoing a supercritical Hopf bifurcation. Here we extend those measurements to both supercritical and subcritical Hopf bifurcations, while allowing for higher-order nonlinearity in the model. The Landau equation has the form
 $$\begin{eqnarray}\frac{\text{d}A}{\text{d}t}=(\unicode[STIX]{x1D70E}+\text{i}\unicode[STIX]{x1D714})A-l(1+\text{i}c)|A|^{2}A+\cdots \,,\end{eqnarray}$$
where $A(t)$
is the complex modal amplitude of a perturbation over the base flow,
$A(t)$
is the complex modal amplitude of a perturbation over the base flow, $\unicode[STIX]{x1D70E}$
is the linear temporal growth rate,
$\unicode[STIX]{x1D70E}$
is the linear temporal growth rate, $\unicode[STIX]{x1D714}$
is the linear angular frequency, and
$\unicode[STIX]{x1D714}$
is the linear angular frequency, and $c$
is the Landau constant, which controls the saturation frequency. We consider the real part of (4.1):
$c$
is the Landau constant, which controls the saturation frequency. We consider the real part of (4.1):
 $$\begin{eqnarray}\frac{\text{d}\log |A|}{\text{d}t}=\unicode[STIX]{x1D70E}-l|A|^{2}+q|A|^{4}-s|A|^{6}+m|A|^{8}-\cdots \,.\end{eqnarray}$$
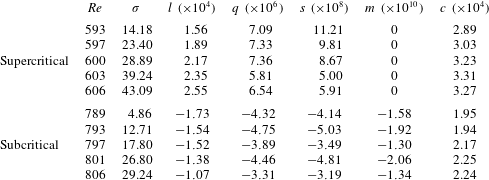
The early experiments of Raghu & Monkewitz (Reference Raghu and Monkewitz1991) considered only linear ( $\unicode[STIX]{x1D70E}$
) and cubic (
$\unicode[STIX]{x1D70E}$
) and cubic ( $l$
) terms because it was assumed that low-density jets could become globally unstable only via supercritical Hopf bifurcations. However, recent experiments by Zhu et al. (Reference Zhu, Gupta and Li2017) and the present study (§ 3.1) have shown that subcritical Hopf bifurcations are also possible, implying that quintic (
$l$
) terms because it was assumed that low-density jets could become globally unstable only via supercritical Hopf bifurcations. However, recent experiments by Zhu et al. (Reference Zhu, Gupta and Li2017) and the present study (§ 3.1) have shown that subcritical Hopf bifurcations are also possible, implying that quintic ( $q$
) or higher-order terms are needed for saturation and bistability. We therefore measure the coefficients of (4.2) via transient experiments: we impulsively increase
$q$
) or higher-order terms are needed for saturation and bistability. We therefore measure the coefficients of (4.2) via transient experiments: we impulsively increase $Re$
from the Hopf point on the fixed-point branch to progressively higher points on the limit-cycle branch, while recording
$Re$
from the Hopf point on the fixed-point branch to progressively higher points on the limit-cycle branch, while recording $A(t)$
. We then determine the coefficients of (4.2) by least-squares fitting polynomial curves to plots of
$A(t)$
. We then determine the coefficients of (4.2) by least-squares fitting polynomial curves to plots of $\text{d}\text{log}|A|/\text{d}t$
versus
$\text{d}\text{log}|A|/\text{d}t$
versus $|A|^{2}$
, as shown in figure 4(a,c) for representative supercritical and subcritical cases.
$|A|^{2}$
, as shown in figure 4(a,c) for representative supercritical and subcritical cases.
Measuring Landau coefficients via the conventional method of transient experiments: derivative of the amplitude evolution for (a) a supercritical Hopf bifurcation at $S=0.14$
and
$S=0.14$
and $Re=590\rightarrow 606$
, and (c) a subcritical Hopf bifurcation at
$Re=590\rightarrow 606$
, and (c) a subcritical Hopf bifurcation at $S=0.18$
and
$S=0.18$
and $Re=785\rightarrow 806$
. In the insets of (a,c), the red line is a time trace of the normalised velocity fluctuation, the blue line is its instantaneous amplitude, and the vertical dashed line marks the start of the growth phase for plotting
$Re=785\rightarrow 806$
. In the insets of (a,c), the red line is a time trace of the normalised velocity fluctuation, the blue line is its instantaneous amplitude, and the vertical dashed line marks the start of the growth phase for plotting $\text{d}\text{log}|A|/\text{d}t$
versus
$\text{d}\text{log}|A|/\text{d}t$
versus $|A|^{2}$
. Also shown are comparisons of the bifurcation diagrams between the Landau models and experiments for the (b) supercritical and (d) subcritical cases.
$|A|^{2}$
. Also shown are comparisons of the bifurcation diagrams between the Landau models and experiments for the (b) supercritical and (d) subcritical cases.

In the supercritical case (figure 4
a), a first-order fit (dashed green line) cannot adequately describe the experimental data (solid blue line), particularly at high $|A|^{2}$
. At least a third-order fit is required (dashed magenta line, with a coefficient of determination of
$|A|^{2}$
. At least a third-order fit is required (dashed magenta line, with a coefficient of determination of $R^{2}=0.9954$
), indicating that one needs to include up to septic nonlinearity (
$R^{2}=0.9954$
), indicating that one needs to include up to septic nonlinearity ( $\unicode[STIX]{x1D70E}$
,
$\unicode[STIX]{x1D70E}$
, $l$
,
$l$
, $q$
,
$q$
, $s$
) in the Landau equation to be able to model this supercritical bifurcation. The resultant Landau coefficients are listed in table 1, where it can be seen that the cubic (
$s$
) in the Landau equation to be able to model this supercritical bifurcation. The resultant Landau coefficients are listed in table 1, where it can be seen that the cubic ( $l$
) and septic (
$l$
) and septic ( $s$
) terms are stabilising, but that the linear (
$s$
) terms are stabilising, but that the linear ( $\unicode[STIX]{x1D70E}$
) and quintic (
$\unicode[STIX]{x1D70E}$
) and quintic ( $q$
) terms are destabilising. The Landau constant (
$q$
) terms are destabilising. The Landau constant ( $c$
) is measured directly, without any curve fitting.
$c$
) is measured directly, without any curve fitting.
In the subcritical case (figure 4
c), at least a fourth-order fit (dashed magenta line, $R^{2}=0.9998$
) is required to describe the experimental data, indicating that up to nonic nonlinearity (
$R^{2}=0.9998$
) is required to describe the experimental data, indicating that up to nonic nonlinearity ( $\unicode[STIX]{x1D70E}$
,
$\unicode[STIX]{x1D70E}$
, $l$
,
$l$
, $q$
,
$q$
, $s$
,
$s$
, $m$
) is required in the Landau equation. From table 1, it can be seen that the quintic (
$m$
) is required in the Landau equation. From table 1, it can be seen that the quintic ( $q$
) and nonic (
$q$
) and nonic ( $m$
) terms are stabilising, but that the linear (
$m$
) terms are stabilising, but that the linear ( $\unicode[STIX]{x1D70E}$
), cubic (
$\unicode[STIX]{x1D70E}$
), cubic ( $l$
) and septic (
$l$
) and septic ( $s$
) terms are destabilising. This is the first time that such high-order nonlinear coefficients have been measured in transient experiments on a low-density jet.
$s$
) terms are destabilising. This is the first time that such high-order nonlinear coefficients have been measured in transient experiments on a low-density jet.
Figure 4(b,d) compares the bifurcation diagrams from the Landau equation (markers) with those from the experiments (green lines). The Landau equation is noise-free, but the jet has a small amount of inherent background noise even when it is unforced. Therefore, the background noise amplitude of the jet is subtracted from the experimental bifurcation data to give meaningful comparisons with the Landau equation. In the supercritical case (figure 4 b), the septic Landau equation (table 1) follows the experimental data more closely than the cubic Landau equation, in accordance with figure 4(a). In the subcritical case (figure 4 d), the nonic Landau equation (table 1) follows the experimental data more closely than the quintic Landau equation, in accordance with figure 4(c). Taken together, these findings underscore the importance of including high-order nonlinearity in the modelling of low-density jets.

Although the Landau equation can model the amplitude evolution of a system, it cannot model CR or other nonlinear effects of noise. This is because the Landau equation is derived by considering only single-mode oscillations in the weakly nonlinear limit, where focus is placed on the (slow) time scales associated with the evolution of the system amplitude and phase, rather than on the (fast) time scales associated with the oscillations ( $x$
) themselves (Huerre & Monkewitz Reference Huerre and Monkewitz1990). Therefore, to model CR, we turn to the VDP oscillator, which has been successfully used to study the forced synchronisation of a low-density jet in which two or more modes coexist simultaneously (Li & Juniper Reference Li and Juniper2013a
,Reference Li and Juniper
b
). The VDP oscillator corresponding to (4.2) is shown on the left-hand side:
$x$
) themselves (Huerre & Monkewitz Reference Huerre and Monkewitz1990). Therefore, to model CR, we turn to the VDP oscillator, which has been successfully used to study the forced synchronisation of a low-density jet in which two or more modes coexist simultaneously (Li & Juniper Reference Li and Juniper2013a
,Reference Li and Juniper
b
). The VDP oscillator corresponding to (4.2) is shown on the left-hand side:
 $$\begin{eqnarray}\frac{\text{d}^{2}x}{\text{d}t^{2}}+\unicode[STIX]{x1D714}^{2}x-\left(2\unicode[STIX]{x1D70E}-8lx^{2}+16qx^{4}-\frac{128}{5}sx^{6}+\frac{256}{7}mx^{8}\right)\frac{\text{d}x}{\text{d}t}+\frac{8}{3}\unicode[STIX]{x1D714}cx^{3}=\unicode[STIX]{x1D6FE}\unicode[STIX]{x1D709}(t),\end{eqnarray}$$
where the right-hand side is the forcing term, with $\unicode[STIX]{x1D709}(t)$
being white Gaussian noise of zero mean and unit variance and
$\unicode[STIX]{x1D709}(t)$
being white Gaussian noise of zero mean and unit variance and $\unicode[STIX]{x1D6FE}$
being the standard deviation of the noise amplitude. We insert the Landau coefficients found via our transient experiments (table 1) into the corresponding forced VDP oscillator (4.3). We numerically solve the septic (supercritical) and nonic (subcritical) VDP oscillators because these were shown to be the simplest models capable of reproducing the experimental bifurcation diagrams (figure 4
b,d).
$\unicode[STIX]{x1D6FE}$
being the standard deviation of the noise amplitude. We insert the Landau coefficients found via our transient experiments (table 1) into the corresponding forced VDP oscillator (4.3). We numerically solve the septic (supercritical) and nonic (subcritical) VDP oscillators because these were shown to be the simplest models capable of reproducing the experimental bifurcation diagrams (figure 4
b,d).
Figures 5 and 6 are analogous to figures 2 and 3 but for the VDP simulations instead of the jet experiments. Good qualitative agreement is found between these two approaches. The ACF decay rate of the VDP oscillator decreases monotonically with $\unicode[STIX]{x1D6FE}$
in the supercritical case (figure 5
a,b) but exhibits a peak at an intermediate value of
$\unicode[STIX]{x1D6FE}$
in the supercritical case (figure 5
a,b) but exhibits a peak at an intermediate value of $\unicode[STIX]{x1D6FE}$
in the subcritical case (figure 5
c,d). Both of these trends are also seen in the experiments (figure 2). Furthermore, in both the supercritical and subcritical cases (figure 6
a,c),
$\unicode[STIX]{x1D6FE}$
in the subcritical case (figure 5
c,d). Both of these trends are also seen in the experiments (figure 2). Furthermore, in both the supercritical and subcritical cases (figure 6
a,c), $\unicode[STIX]{x1D6FD}$
exhibits a distinct peak at an intermediate value of
$\unicode[STIX]{x1D6FD}$
exhibits a distinct peak at an intermediate value of $\unicode[STIX]{x1D6FE}$
(i.e.
$\unicode[STIX]{x1D6FE}$
(i.e. $\unicode[STIX]{x1D6FE}_{opt}$
), confirming the existence of CR (Pikovsky & Kurths Reference Pikovsky and Kurths1997; Ushakov et al.
Reference Ushakov, Wünsche, Henneberger, Khovanov, Schimansky-Geier and Zaks2005). As
$\unicode[STIX]{x1D6FE}_{opt}$
), confirming the existence of CR (Pikovsky & Kurths Reference Pikovsky and Kurths1997; Ushakov et al.
Reference Ushakov, Wünsche, Henneberger, Khovanov, Schimansky-Geier and Zaks2005). As $Re$
increases,
$Re$
increases, $\unicode[STIX]{x1D6FD}_{max}$
increases but
$\unicode[STIX]{x1D6FD}_{max}$
increases but $\unicode[STIX]{x1D6FE}_{opt}$
decreases, again in qualitative agreement with the experiments (figure 3).
$\unicode[STIX]{x1D6FE}_{opt}$
decreases, again in qualitative agreement with the experiments (figure 3).
Although the VDP oscillator is calibrated quantitatively (figure 4), its noise-induced dynamics (figures 5 and 6) does not quantitatively match that of the jet (figures 2 and 3), particularly for the supercritical case, where $\unicode[STIX]{x1D6FD}_{max}$
of the VDP model (calibrated via the conventional method) is an order of magnitude smaller than that of the jet (figure 6
b). We speculate that this quantitative discrepancy arises because this particular supercritical case is near the supercritical–subcritical border, where the Hopf and SN points are so close together as to make the noise-induced dynamics exceptionally sensitive to the precise value of
$\unicode[STIX]{x1D6FD}_{max}$
of the VDP model (calibrated via the conventional method) is an order of magnitude smaller than that of the jet (figure 6
b). We speculate that this quantitative discrepancy arises because this particular supercritical case is near the supercritical–subcritical border, where the Hopf and SN points are so close together as to make the noise-induced dynamics exceptionally sensitive to the precise value of $Re$
. To resolve this issue, we recalibrate the VDP oscillator using the model coefficients of Lee et al. (Reference Lee, Zhu, Li and Gupta2019, see table 1), which contain up to nonic nonlinearity and were determined via SI by fitting the noise-induced response of an identical low-density jet to the Fokker–Planck equation in the USR (Risken Reference Risken1996). We find that this SI method of calibration is superior to the conventional method, as evidenced by the improved quantitative match in
$Re$
. To resolve this issue, we recalibrate the VDP oscillator using the model coefficients of Lee et al. (Reference Lee, Zhu, Li and Gupta2019, see table 1), which contain up to nonic nonlinearity and were determined via SI by fitting the noise-induced response of an identical low-density jet to the Fokker–Planck equation in the USR (Risken Reference Risken1996). We find that this SI method of calibration is superior to the conventional method, as evidenced by the improved quantitative match in $\unicode[STIX]{x1D6FD}_{max}$
between the VDP model and the jet, for both supercritical and subcritical Hopf bifurcations (figure 6
b,d).
$\unicode[STIX]{x1D6FD}_{max}$
between the VDP model and the jet, for both supercritical and subcritical Hopf bifurcations (figure 6
b,d).
The VDP simulations analogous to the jet experiments of figure 2: (a,b) the supercritical case at $Re=590$
and (c,d) the subcritical case at
$Re=590$
and (c,d) the subcritical case at $Re=755$
. In panels (b,d), the ACF decay rate is estimated from three different data ranges: 0–30 cycles (circular markers), 0–20 cycles (blue bars) and 0–10 cycles (green bars).
$Re=755$
. In panels (b,d), the ACF decay rate is estimated from three different data ranges: 0–30 cycles (circular markers), 0–20 cycles (blue bars) and 0–10 cycles (green bars).

The VDP simulations analogous to the jet experiments of figure 3: (a,c) $\unicode[STIX]{x1D6FD}$
as a function of
$\unicode[STIX]{x1D6FD}$
as a function of $\unicode[STIX]{x1D6FE}$
at four values of
$\unicode[STIX]{x1D6FE}$
at four values of $Re$
in the USR of the VDP model calibrated via the conventional method, and (b,d) comparisons of
$Re$
in the USR of the VDP model calibrated via the conventional method, and (b,d) comparisons of $\unicode[STIX]{x1D6FD}_{max}$
between the experiments and the VDP model calibrated via the conventional method and via the SI method of Lee et al. (Reference Lee, Zhu, Li and Gupta2019). Panels (a,b) are for the supercritical case at points A–D in figure 4(b), while panels (c,d) are for the subcritical case at points A–D in figure 4(d).
$\unicode[STIX]{x1D6FD}_{max}$
between the experiments and the VDP model calibrated via the conventional method and via the SI method of Lee et al. (Reference Lee, Zhu, Li and Gupta2019). Panels (a,b) are for the supercritical case at points A–D in figure 4(b), while panels (c,d) are for the subcritical case at points A–D in figure 4(d).

5 Conclusions and implications
We have experimentally investigated the noise-induced dynamics of a prototypical hydrodynamic system (a low-density jet) undergoing both supercritical and subcritical Hopf bifurcations. By applying external noise to the system in its USR (prior to both the Hopf and SN points) and measuring its ACF decay rate and $\unicode[STIX]{x1D6FD}$
, we find that the noise-induced coherence peaks at an intermediate noise amplitude and increases as the stability boundary is approached, providing the first evidence of CR in hydrodynamics.
$\unicode[STIX]{x1D6FD}$
, we find that the noise-induced coherence peaks at an intermediate noise amplitude and increases as the stability boundary is approached, providing the first evidence of CR in hydrodynamics.
We model the CR dynamics in a weakly nonlinear framework based on a stochastically forced VDP oscillator, which is initially calibrated via the conventional method of measuring the transient amplitude evolution and fitting the data to a Landau equation. Although we find that this approach can qualitatively reproduce the CR dynamics of the jet, its quantitative predictions are poor, particularly for the supercritical case. We speculate that this is because this particular supercritical case is near the supercritical–subcritical border, where the noise-induced dynamics is known to be exceptionally sensitive to the precise value of $Re$
. We then recalibrate the VDP oscillator with the SI method of Lee et al. (Reference Lee, Zhu, Li and Gupta2019), which uses the Fokker–Planck equation, and find improved quantitative agreement with the experimental data. This shows that, when determining the model coefficients in analyses of the noise-induced dynamics of nonlinear systems, it is preferable to use SI methods based on a stochastic framework, rather than conventional amplitude-evolution methods based on a deterministic framework. Crucially, the fact that a simple oscillator model can reproduce the CR dynamics of a real hydrodynamic system shows that the observed dynamics is not unique to our specific system, but is universal to nonlinear dynamical systems near a Hopf bifurcation (Ushakov et al.
Reference Ushakov, Wünsche, Henneberger, Khovanov, Schimansky-Geier and Zaks2005).
$Re$
. We then recalibrate the VDP oscillator with the SI method of Lee et al. (Reference Lee, Zhu, Li and Gupta2019), which uses the Fokker–Planck equation, and find improved quantitative agreement with the experimental data. This shows that, when determining the model coefficients in analyses of the noise-induced dynamics of nonlinear systems, it is preferable to use SI methods based on a stochastic framework, rather than conventional amplitude-evolution methods based on a deterministic framework. Crucially, the fact that a simple oscillator model can reproduce the CR dynamics of a real hydrodynamic system shows that the observed dynamics is not unique to our specific system, but is universal to nonlinear dynamical systems near a Hopf bifurcation (Ushakov et al.
Reference Ushakov, Wünsche, Henneberger, Khovanov, Schimansky-Geier and Zaks2005).
This study has two practical implications, both relating to early warning indicators. First, the increase in $\unicode[STIX]{x1D6FD}$
as the stability boundary is approached from within the USR can be used to forecast the onset of global instability. Second, the dependence of the ACF decay rate on the super/subcritical nature of a Hopf bifurcation can be used to distinguish between these two types of bifurcation, even before the onset of global instability. Although demonstrated here on a low-density jet, both of these noise-induced precursors are expected to arise in other hydrodynamic systems as well, so long as they are near a Hopf bifurcation (Ushakov et al.
Reference Ushakov, Wünsche, Henneberger, Khovanov, Schimansky-Geier and Zaks2005; Scheffer et al.
Reference Scheffer, Bascompte, Brock, Brovkin, Carpenter, Dakos, Held, Van Nes, Rietkerk and Sugihara2009). This opens up new possibilities for the development of global-instability precursors in a variety of hydrodynamic systems.
$\unicode[STIX]{x1D6FD}$
as the stability boundary is approached from within the USR can be used to forecast the onset of global instability. Second, the dependence of the ACF decay rate on the super/subcritical nature of a Hopf bifurcation can be used to distinguish between these two types of bifurcation, even before the onset of global instability. Although demonstrated here on a low-density jet, both of these noise-induced precursors are expected to arise in other hydrodynamic systems as well, so long as they are near a Hopf bifurcation (Ushakov et al.
Reference Ushakov, Wünsche, Henneberger, Khovanov, Schimansky-Geier and Zaks2005; Scheffer et al.
Reference Scheffer, Bascompte, Brock, Brovkin, Carpenter, Dakos, Held, Van Nes, Rietkerk and Sugihara2009). This opens up new possibilities for the development of global-instability precursors in a variety of hydrodynamic systems.
Acknowledgements
This work was funded by the Research Grants Council of Hong Kong (project nos 16235716, 26202815 and 16210418). V.G. was supported by the National Natural Science Foundation of China (grant nos 11672123 and 91752201) and the Shenzhen Science and Technology Program (grant no. JCYJ20170412151759222).


 Open access