Serum uric acid (SUA) is the end product of purine metabolism(Reference Wu, Lee and Muzny1). Hyperuricaemia (HUA) may develop when there is a disturbance in purine metabolism. HUA, as an emerging public health issue, has attracted increasing attention because its prevalence has been steadily rising globally in recent decades(Reference Singh, Lingala and Mithal2,Reference Ting, Gill and Keen3) . It has been closely linked to gout, hypertension and CVD mortality, as well as all-cause mortality(Reference Dalbeth, Gosling and Gaffo4–Reference Zhao, Huang and Song6). The prevalence of HUA in China was high, estimated at approximately 20 % according to a National Health Survey conducted in China between 2012 and 2017(Reference He, Pan and Ren7). Thus, identifying modifiable HUA risk factors is vital to implement effective prevention strategies.
Obesity is recognised as a major risk factor for HUA(Reference Dehlin, Jacobsson and Roddy8–Reference Dong, Zhang and Wang10). More than 650 million people in the world have obesity(Reference Xiao, Zhong and Lin11). With approximately 89·6 million individuals classified as obese(12), China has the largest population with obesity globally. Growing evidence suggests that body fat distribution is correlated with different risks of HUA. Research has shown a stronger association between visceral adipose tissue accumulation and the risk of HUA than abdominal subcutaneous fat across diverse populations(Reference Matsuura, Yamashita and Nakamura13–Reference Takahashi, Yamamoto and Tsutsumi15). MRI and CT can precisely quantify the visceral fat area, but their application in large-scale epidemiological studies is constrained by their high cost and the potential risk of radiation exposure(Reference Luo, Ma and Shen16). Waist circumference (WC) and waist:height ratio (WHtR), as traditional abdominal adiposity indices, lack the ability to distinguish between subcutaneous and visceral fats(Reference Qiao, Luo and Pei17). Consequently, novel abdominal adiposity indices, such as visceral adiposity index (VAI), lipid accumulation product (LAP) index, cardiometabolic index (CMI) and Chinese visceral adiposity index (CVAI), have been established to differentiate between visceral and subcutaneous adiposity. Notably, Asians have a lower BMI than Caucasians(Reference Deurenberg, Deurenberg-Yap and Guricci18), but they seem to be more prone to central fat deposition(Reference Camhi, Bray and Bouchard19). This means that VAI, which is used to predict visceral adiposity in Caucasians, may not adequately predict visceral adiposity in Asians. The CVAI is a recently established abdominal adiposity index in Chinese adults(Reference Xia, Chen and Lin20). It combines WC, BMI, TAG and HDL-cholesterol while considering the influence of gender and age. It is recognised as a dependable indicator for assessing dysfunction in visceral adipose tissue(Reference Xia, Chen and Lin20). In the Chinese population, CVAI is more correlated with hypertension and prehypertension(Reference Li, Wang and Zhou21), arterial atherosclerosis(Reference Huang, Huang and Lin22) and diabetes complications(Reference Wan, Wang and Xiang23) than other obesity-related indices.
However, research investigating the associations between CVAI and HUA is scarce(Reference Wang, Wang and Yin24,Reference Zhang, Qu and Qiu25) , and the predictive performance of CVAI for HUA still needs to be explored. Moreover, recent research has identified sex differences in the associations between obesity-related indices and HUA(Reference Su, Lin and Liu26). However, whether the association between CVAI and HUA differs by sex is unclear. Hence, this study aimed to explore sex-specific association between CVAI and HUA and assess the discriminative ability of CVAI for HUA in comparison with VAI, LAP, CMI, WC and WHtR by utilising data from the China Multi-Ethnic Cohort study (Chongqing region). Stratified analysis was conducted with age, smoking, drinking, spicy food intake, BMI, diabetes and hypertension to explore the effect modifications of socio-demographic characteristics, lifestyle factors, anthropometric measurements and health status in the relationship between CVAI and HUA.
Method
Study population
Data for this study were obtained from the China Multi-Ethnic Cohort study in Chongqing region. Detailed information about the China Multi-Ethnic Cohort study has been introduced previously(Reference Zhao, Hong and Yin27). A total of 23 308 Han adults aged 30–79 years were enrolled using multistage, stratified cluster sampling methods in Chongqing Municipality, located in Southwest China, between September 2018 and February 2019. In brief, the cluster sampling method was used to select thirteen districts and counties (districts and counties of the same administrative level) in Chongqing. Subsequently, based on the age and gender structure of Chongqing in 2018, stratified random sampling was employed to allocate the number of people in each district and county. Participants with missing data for SUA levels (n 859), anthropometric parameters (n 39), biochemical measurement indices (n 290) and covariates (n 39) were excluded. The remaining 22 171 participants (men: 10 355; women: 11 816) were finally included in the current analysis (online Supplementary Figure S1). This study protocol was conducted in accordance with the guidelines laid down in the Declaration of Helsinki, and all procedures involving human participants were approved by the Sichuan University Medical Ethical Review Board (K2016038) and the Research Ethics Committee of the Chongqing Centre for Disease Control and Prevention [2017(001)]. Written informed consent was obtained from all participants prior to participation.
Anthropometric and biochemical measurements
Anthropometric measurements, including weight (kg), height (cm) and WC (cm), were conducted by trained staff in accordance with standard protocols. Participants were checked for weight and height while standing barefoot and wearing light clothing. WC was measured using the lower edge of the tape 1 cm above the navel. BMI was calculated by dividing weight (kg) by the square of height (m). WHtR was calculated by dividing WC (cm) by height (cm).
After sitting at rest for at least 5 min, the participants’ blood pressure was measured three times at 45-second intervals by a trained interviewer using an electronic oscillometric blood pressure measurement device (Omron HEM-7600T). The systolic blood pressure (SBP) or diastolic blood pressure (DBP) in this study was determined as the average of three measurements for SBP or DBP. Blood samples of participants were collected following an overnight fast (minimum of 8 h) and tested at the Di’an Medical Laboratory Center. Fasting blood glucose, total cholesterol (TC), TAG, LDL-cholesterol, HDL-cholesterol, SUA and creatinine were measured on an automated biochemical analyser (HITACHI 7600 Series, Chongqing, China). The estimated glomerular filtration rate (eGFR) was computed by utilising the newly formulated equation provided by the Chronic Kidney Disease Epidemiology Collaboration(Reference Levey, Stevens and Schmid28).
Definitions
HUA was defined as having a SUA level of ≥ 360 μmol/l in women and ≥ 420 μmol/l in men(Reference Feig, Kang and Johnson29). The formulas for VAI(Reference Amato, Giordano and Galia30), CMI(Reference Wakabayashi and Daimon31), LAP(Reference Kahn32) and CVAI(Reference Xia, Chen and Lin20) were as follows:
 $${\rm{VAI}}({\rm{men}}) = \left( {{{{\rm{WC}}({\rm{cm}})} \over {39.68 + 1.88 \times {\rm{BMI}}({\rm{kg}}/{{\rm{m}}^2})}}} \right) \times \left( {{{{\rm{TG}}({\rm{mmol}}/{\rm{L}})} \over {1.03}}} \right) \times \left( {{{1.31} \over {{\rm{HDL}}({\rm{mmol}}/{\rm{L}})}}} \right)$$
 $${\rm{VAI}}({\rm{women}}) = \left( {{{{\rm{WC}}({\rm{cm}})} \over {36.58 + 1.89 \times {\rm{BMI}}({\rm{kg}}/{{\rm{m}}^2})}}} \right) \times \left( {{{{\rm{TG}}({\rm{mmol}}/{\rm{L}})} \over {0.81}}} \right) \times \left( {{{1.52} \over {{\rm{HDL}}({\rm{mmol}}/{\rm{L}})}}} \right)$$
 $${\rm{LAP}}({\rm{men}}) = ({\rm{WC}}({\rm{cm}}) - 65) \times {\rm{TG}}({\rm{mmol}}/{\rm{L}})$$
 $${\rm{LAP}}({\rm{women}}) = ({\rm{WC}}({\rm{cm}}) - 58) \times {\rm{TG}}({\rm{mmol}}/{\rm{L}})$$


 $${\rm{CMI}} = \left( {{{{\rm{TG}}({\rm{mmol}}/{\rm{L}})} \over {{\rm{HDL}}({\rm{mmol}}/{\rm{L}})}}} \right) \times {\rm{WHtR}}$$
Assessment of covariates
Face-to-face interviews were conducted utilising structured questionnaires to collect detailed information on socio-demographic status (e.g. gender, age, area, marital status and educational level), lifestyle factors (such as smoking status, drinking status, physical activity and dietary intake) and health status. Area was divided into two categories: urban areas and rural areas, based on participants’ residential addresses. Smoking was defined as having smoked ≥ 100 cigarettes in their lifetime, and drinking was defined as alcohol intake ≥ 12 times during the last year(Reference Zhao, Hong and Yin27). The participants’ physical activity levels were assessed by aggregating the respective metabolic equivalent tasks (MET) across four domains: housework, transportation, work and leisure(Reference Ao, Zhou and Han33,Reference Ainsworth, Haskell and Whitt34) . Dietary intake information was obtained through a FFQ. The Dietary Approaches to Stop Hypertension (DASH) score was calculated based on the scoring method developed by Fung et al.(Reference Fung, Chiuve and McCullough35). Scores of 1–5 were assigned to seven food categories (whole grains, fresh fruits, fresh vegetables, legumes, red meat products, dairy products and Na) in accordance with the quintile of average food intake in this study. For whole grains, fresh fruits, fresh vegetables, legumes and dairy products, the highest quintile scored 5 and the lowest quintile scored 1. Conversely, for red meat products and Na, this study aimed for lower intake, so the scoring pattern was reversed. Subsequently, the scores for these seven components were aggregated to yield an overall DASH score within the range of 7–35. The participants were divided into two groups (≤ 21 and > 21) on the basis of median DASH score. Non-spicy eaters were defined as those who have not consumed any spicy foods in the past month. BMI was grouped into < 24·0, 24·0–27·9 and ≥ 28·0 kg/m²(36). Hypertension was diagnosed as the average measurements of SBP/DBP ≥ 140/90 mmHg or having a self-reported history of physician-diagnosed hypertension(37). Diabetes was defined as fasting blood glucose ≥ 7·0 mmol/L, glycosylated Hb percentage of ≥ 6·5 % or having a self-reported history of physician-diagnosed diabetes(38).
Statistical analyses
Continuous variables, including age, physical activity, SBP, DBP, fasting blood glucose, TC, TAG, HDL-cholesterol, LDL-cholesterol, SUA, eGFR, BMI, WC, WHtR, VAI, CMI and CVAI, were presented as medians and interquartile ranges (IQR) because of skewed distribution and examined using Wilcoxon two sample test, whereas categorical variables, including area, marital status, educational level, smoking status, drinking status, spicy food intake, DASH score, diabetes and hypertension, were expressed as numbers (percentages) and were analysed using χ 2 tests. All analyses were performed separately by sex.
Logistic regression analyses were used to explore the association between CVAI and HUA and assess the OR with corresponding 95 % CI for HUA, considering CVAI as either a continuous variable (per 1-sd increment) or a categorical variable (quartiles). A series of models was employed to adjust for potential confounding factors. Model 1 included no adjustments; model 2 adjusted for age, area, educational level, marital status, smoking, drinking, spicy food intake, DASH score and physical activity and model 3 extended these adjustments by including diabetes, hypertension, BMI, eGFR, TC and LDL-cholesterol. The covariates included in the models were selected based on previous studies investigating the relationship between obesity and metabolic diseases(Reference Bai, Ying and Shen14,Reference Li, Wang and Zhou21,Reference Wan, Wang and Xiang23,Reference Huang, Jiang and Wang39,Reference Dong, Li and Yang40) . Collinearity among all adjusted variables was examined, revealing no definitive evidence of multicollinearity (the variance inflation factor for all included variables was < 5; online Supplementary Figure S2). The interaction between sex and CVAI on HUA in logistic regression analysis was as follows: Model outcome (y) = x1 + x2 + x1 × x2 + covariates, where y represents HUA, x1 represents sex, x2 represents CVAI (per 1-sd), x1 × x2 was the interaction term and covariates referred to the adjusted variables in model 3. Restricted cubic spline (RCS) analysis was conducted with four knots positioned at the 5th, 35th, 65th and 95th percentiles of CVAI to examine potential nonlinear associations and depict the dose–response relationship of between CVAI and HUA. The predictive powers of CVAI, VAI, LAP, CMI, WC and WHtR for HUA were evaluated using receiver operating characteristic curve. A non-parametric approach described by De Long et al.(Reference DeLong, DeLong and Clarke-Pearson41) was employed to compare the area under the receiver operating characteristic curve (AUROC) of CVAI in predicting HUA with those of other adiposity indices (VAI, LAP, CMI, WC and WHtR). Stratified analyses were conducted across diverse subgroups, including age, smoking status, drinking status, BMI, diabetes and hypertension, to evaluate the effect modifications of CVAI on the risk of HUA and explore potential interaction effects using a multiplicative interaction term [CVAI × (subgroups)]. Sensitivity analyses were performed by excluding participants with self-reported coronary artery disease, stroke or cancer to validate the robustness of the results.
RCS was calculated using R (version 4.3.3, R Foundation, Boston, MA) with the ‘rms’ package, and other analyses were conducted using SPSS (version 26.0, SPSS, Inc). A two-sided P < 0·05 was deemed statistically significant.
Results
Baseline characteristics of participants
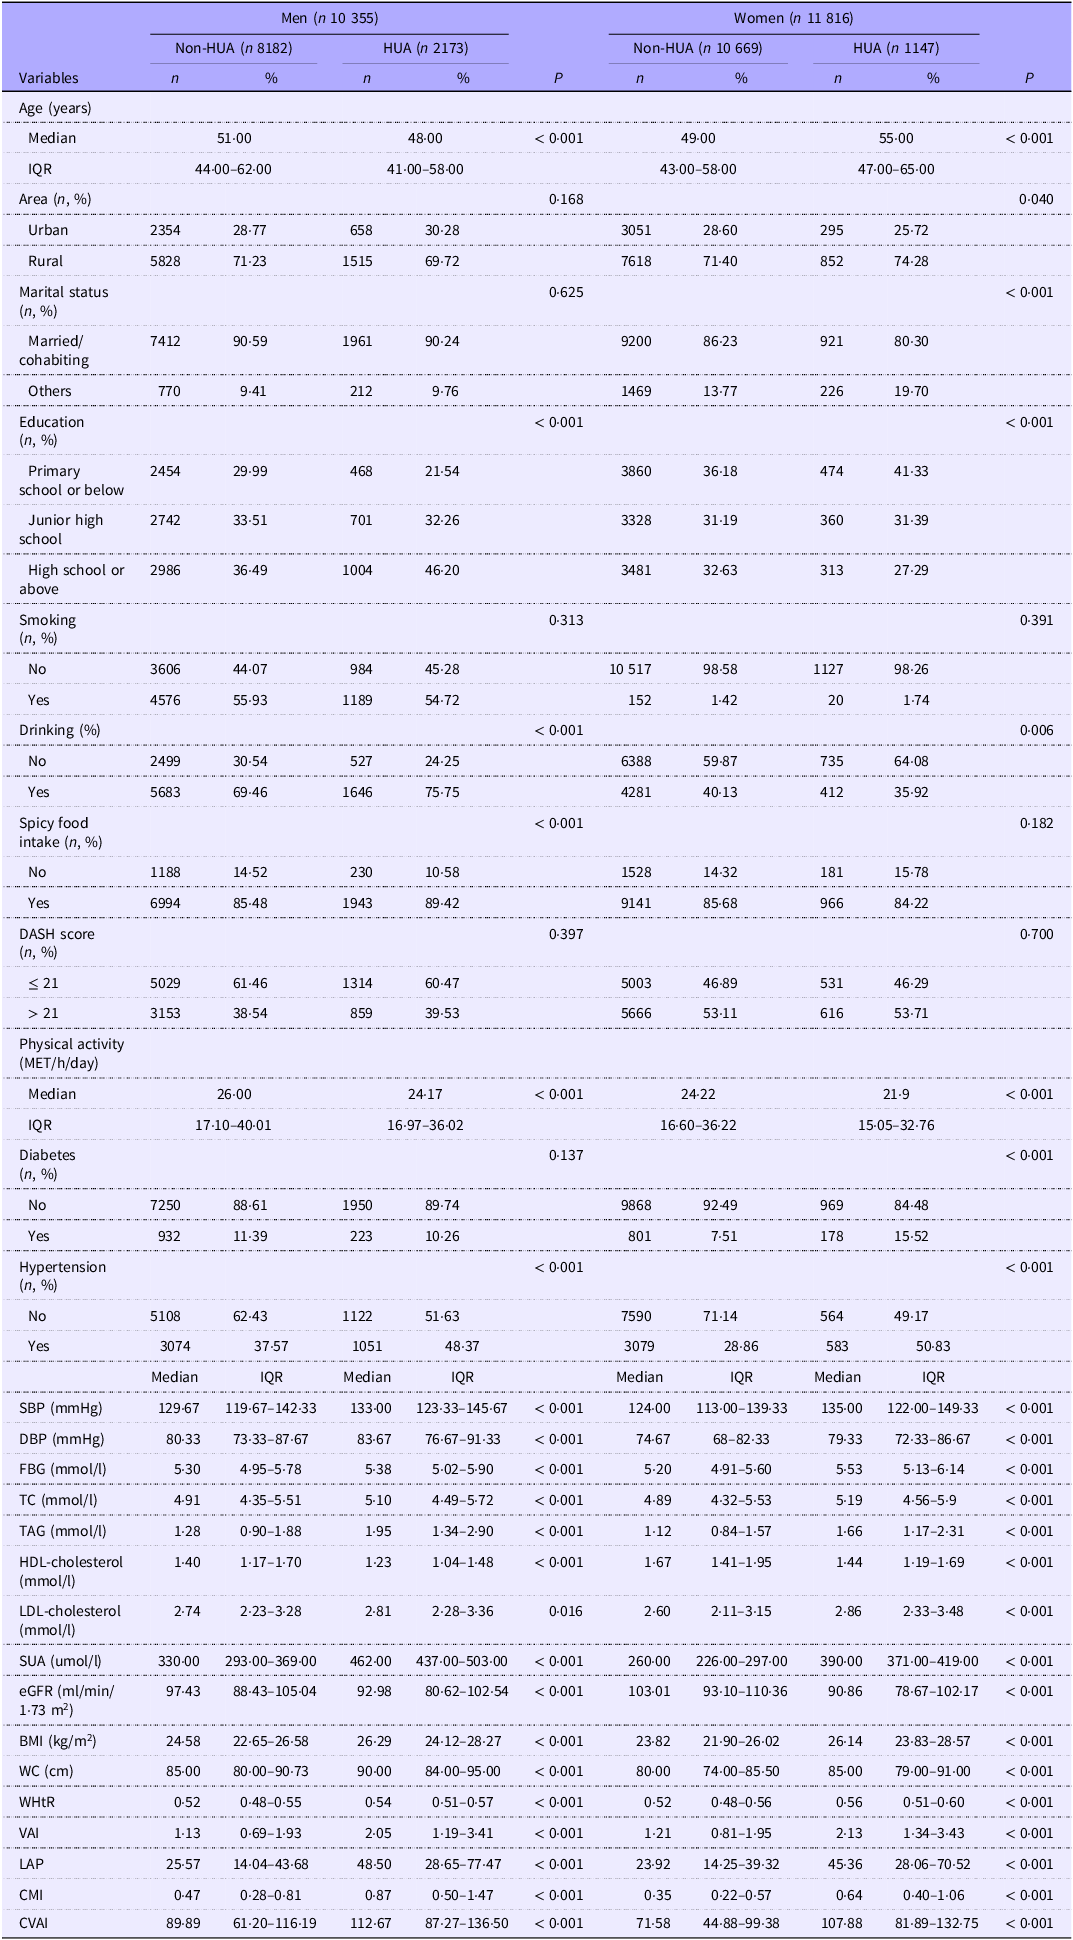
Overall, 22 171 participants (10 355 men: 46·7 %; 11 816 women: 53·3 %) were included for analysis. Among them, 3320 participants (2173 men: 20·9 %; 1147 women: 9·7 %) were defined as having HUA. The baseline characteristics of the participants are presented in Table 1. The participants with HUA, regardless of sex, exhibited a higher proportion of hypertension at baseline; higher BMI, WC, WHtR, VAI, LAP, CMI, CVAI, SBP, DBP, fasting blood glucose, TC, TAG, LDL-cholesterol and SUA levels; lower HDL-cholesterol and eGFR levels and less physical activity compared with those without HUA (all P < 0·05). However, women with HUA tended to live in rural areas, showed a lower proportion of being married/cohabiting and had a higher proportion of diabetes at baseline than those without HUA (all P < 0·05). Meanwhile, these significant differences were not observed in men with and without HUA. Moreover, women with HUA tended to be older, less educated and non-drinkers, whereas men with HUA exhibited the opposite trend. The general characteristics of included and excluded participants were compared in online Supplementary Table S1. There were no significant differences in sex (men: 47·85 % v. 46·71 %; women: 52·15 % v. 53·29 %; P = 0·452) and age (49·66 (IQR: 43·36–60·83) v. 50·61 (IQR: 44·63–61·03); P = 0·154) between included and excluded participants.
Baseline characteristics of 22 171 participants with and without hyperuricaemia (HUA), stratified by sex, recruited from the Chinese Multi-Ethnic Cohort Study in Chongqing, China (Median and interquartile ranges (IQR); numbers and percentages)

DASH, dietary approaches to stop hypertension; METs, metabolic equivalent values; SBP, systolic blood pressure; DBP, diastolic blood pressure; FBG, fasting blood glucose; TC, total cholesterol; HDL-cholesterol, high-density lipoprotein cholesterol; LDL-cholesterol, low density lipoprotein cholesterol; SUA, serum uric acid; eGFR, estimated glomerular filtration rate; WC, waist circumference; WHtR, waist:height ratio; VAI, visceral adiposity index; CVAI, Chinese visceral adiposity index; LAP, lipid accumulation product index; CMI, cardiometabolic index; HUA, hyperuricemia. Others in marital status including separated/divorced/widowed/unmarried.
Sex-specific association between Chinese visceral adiposity index and hyperuricaemia
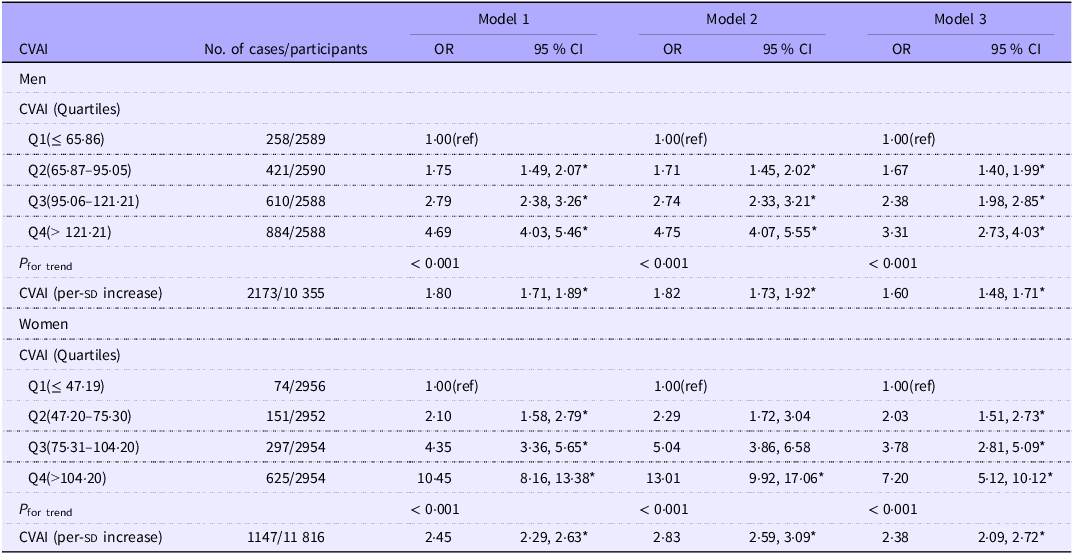
The sex-specific association between CVAI and HUA is presented in Table 2. After adjusting for confounding factors, compared with the first quartile (Q1) of CVAI, the OR with corresponding 95 % CI for HUA in the second, third and fourth quartiles (Q2, Q3 and Q4) of CVAI were 1·67 (1·40, 1·99), 2·38 (1·98, 2·85) and 3·31 (2·73, 4·03), respectively, for men and 2·03 (1·51, 2·73), 3·78 (2·81, 5·09) and 7·20 (5·12, 10·12), respectively, for women in model 3. Furthermore, the association between each 1-sd increase in CVAI and HUA was significantly stronger in women (OR = 2·38, 95 % CI 2·09, 2·72) than in men (OR = 1·60, 95 % CI 1·48, 1·71) in model 3. This sex–specific difference was statistically supported by a significant interaction between sex and CVAI on HUA (P interaction < 0·001). After participants who self-reported coronary artery disease, stroke or cancer were excluded, the positive association between CVAI and HUA persisted (online Supplementary Table S2).
Association between Chinese visceral adiposity index (CVAI) and hyperuricemia (HUA) among adults enrolled in the Chinese Multi-Ethnic Cohort study, stratified by sex, according to CVAI as categorical (quartile) or continuous variables, using logistic regression (Odds ratios (OR) and 95 % confidence intervals (CI); numbers)

Model 1: without adjustments. Model 2: adjusted for age, area, education level, marital status, smoking, drinking, spicy food intake, DASH score and physical activity. Model 3: further adjusted for diabetes, hypertension, BMI, eGFR, TC and LDL-cholesterol. sd, standard deviation. *P < 0·001.
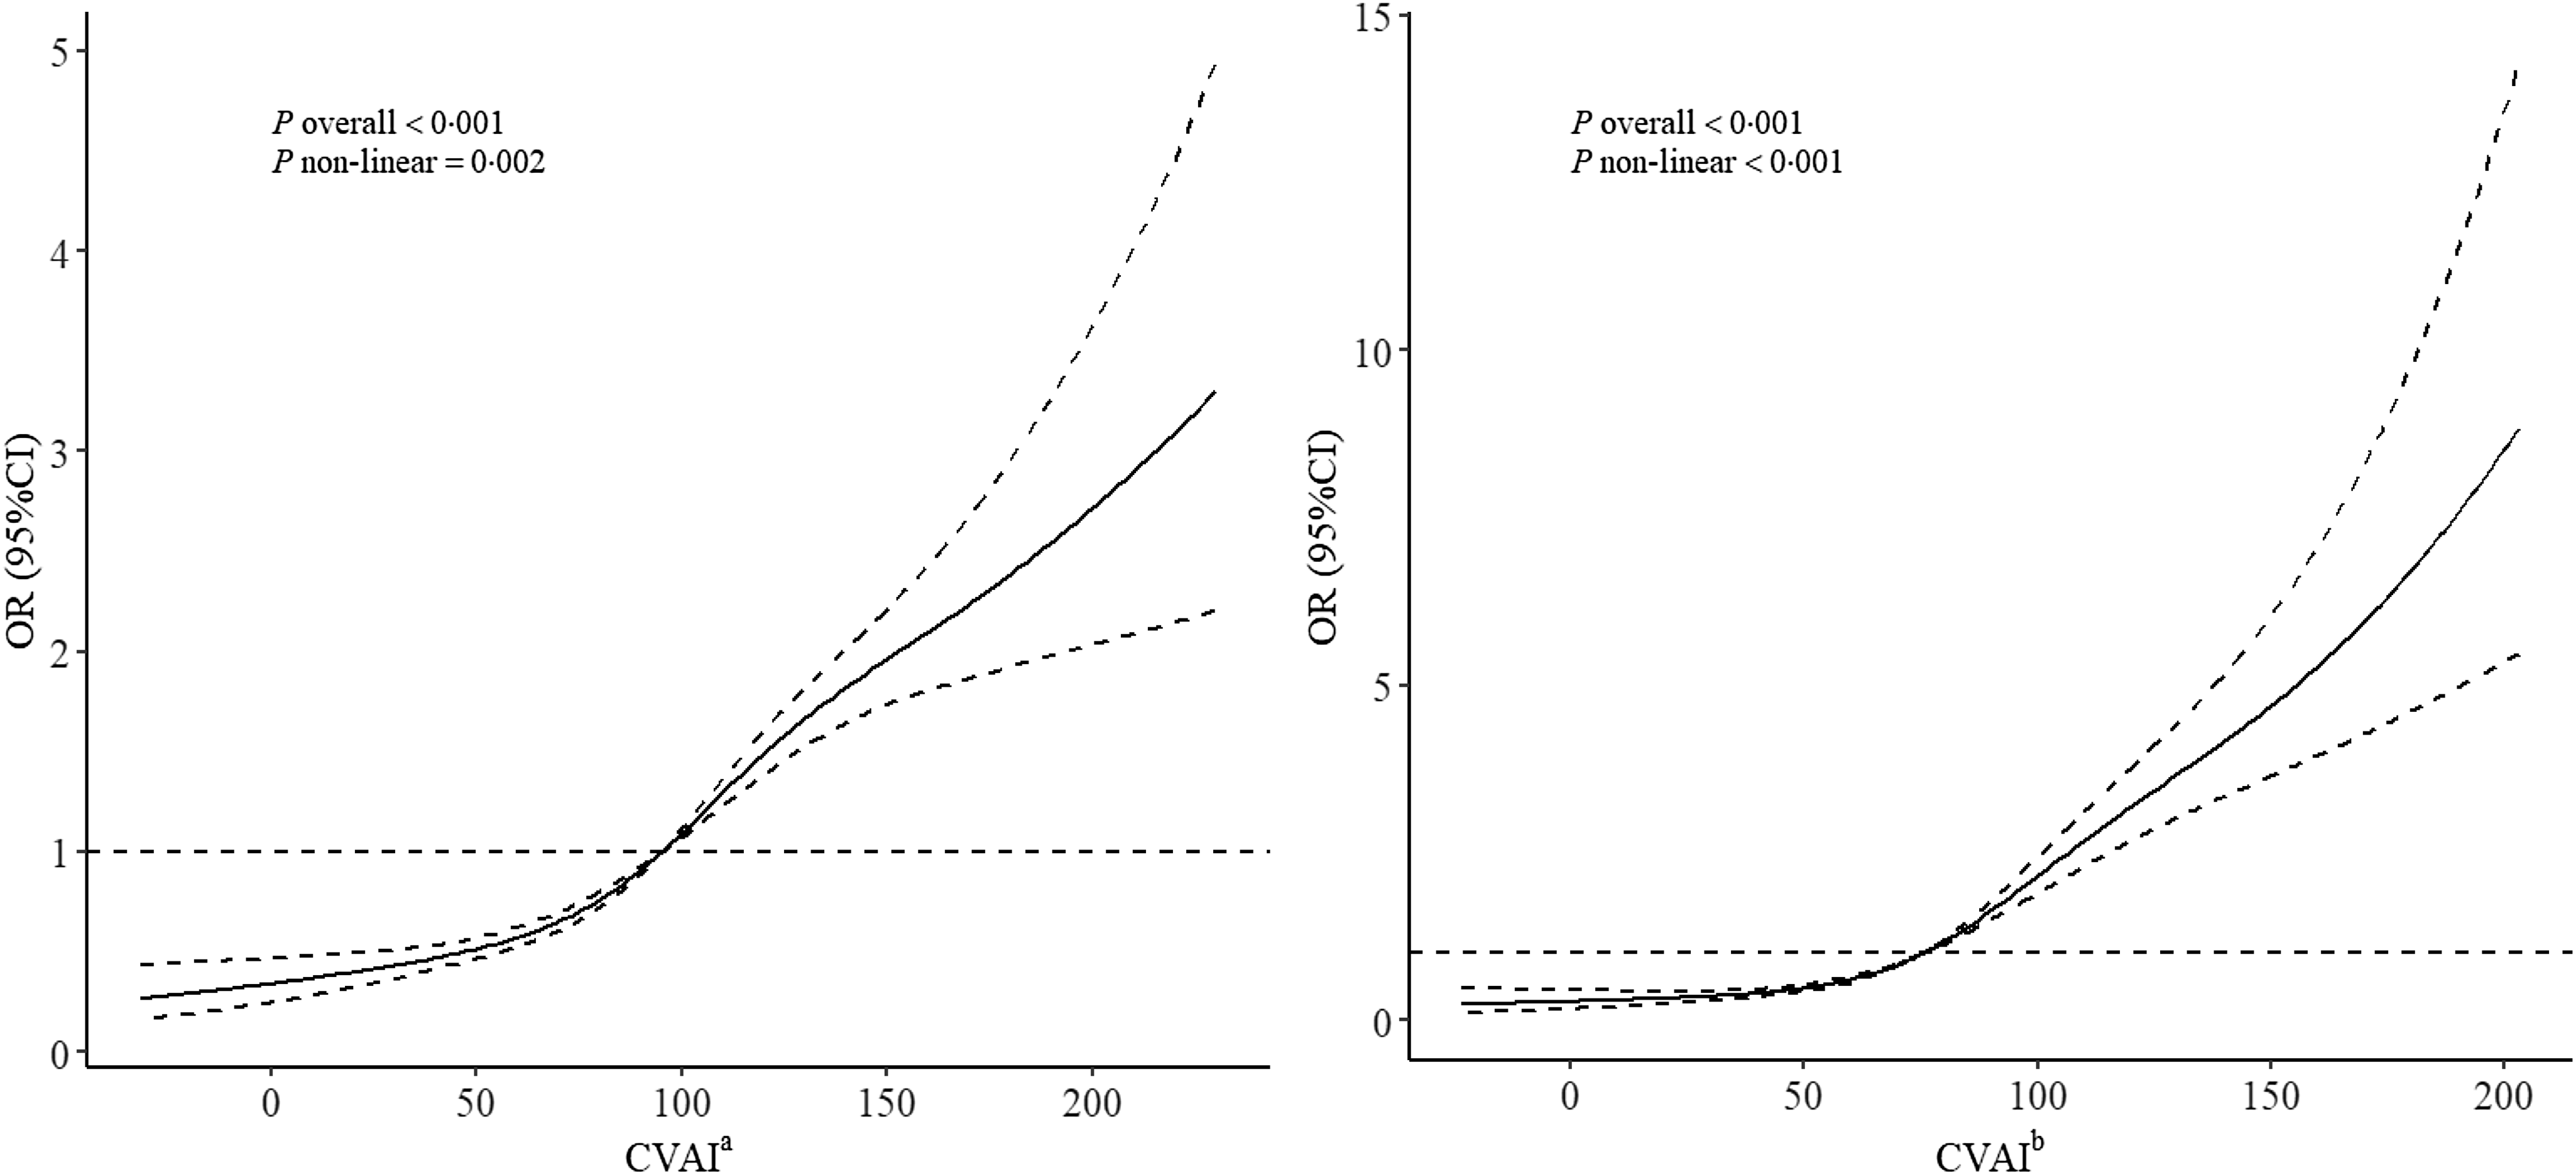
RCSs revealed a nonlinear dose–response relationship between CVAI and HUA in both sexes (all P overall < 0·001, P non-linear < 0·05; Figure 1). In men, with the knot at 50th percentile of CVAI as the reference, the OR with corresponding 95 % CI for the four knots of CVAI (22·10, 78·43, 109·86 and 161·22) were 0·41 (0·33, 0·50), 0·74 (0·70, 0·79), 1·30 (1·24, 1·38) and 2·12 (1·82, 2·47), respectively. The risk of HUA decreased when CVAI was < 95·82 and increased when CVAI was ≥ 95·82 (Figure 1(a)). In women, With the knot at 50th percentile of CVAI as the reference, the OR with corresponding 95 % CI for the four knots of CVAI (12·23, 58·93, 91·75 and 143·58) were 0·31 (0·22, 0·44), 0·61 (0·57, 0·66), 1·72 (1·57, 1·89) and 4·37 (3·47, 5·50), respectively. The risk of HUA decreased when CVAI was < 75·81 and increased when CVAI was ≥ 75·81(Figure 1(b)).
Dose–response relationship between Chinese visceral adiposity index (CVAI) and hyperuricaemia (HUA) among adults enrolled in the Chinese Multi-Ethnic Cohort study, using restricted cubic splines based on a logistic regression model. The plot shows a non-linear relationship between CVAI and HUA. Data are OR and 95 % CI, solid lines indicate OR, shadow shape indicates 95 % CI. aThere was a nonlinear dose–response relationship between CVAI and the risk of HUA in men (P overall < 0·001, P non-linear = 0·002). bThere was a nonlinear dose–response relationship between CVAI and the risk of HUA in women (P overall < 0·001, P non-linear < 0·001).

Comparison of the predictive power of Chinese visceral adiposity index, visceral adiposity index, lipid accumulation product index, cardiometabolic index, waist:height ratio and waist circumference for hyperuricaemia
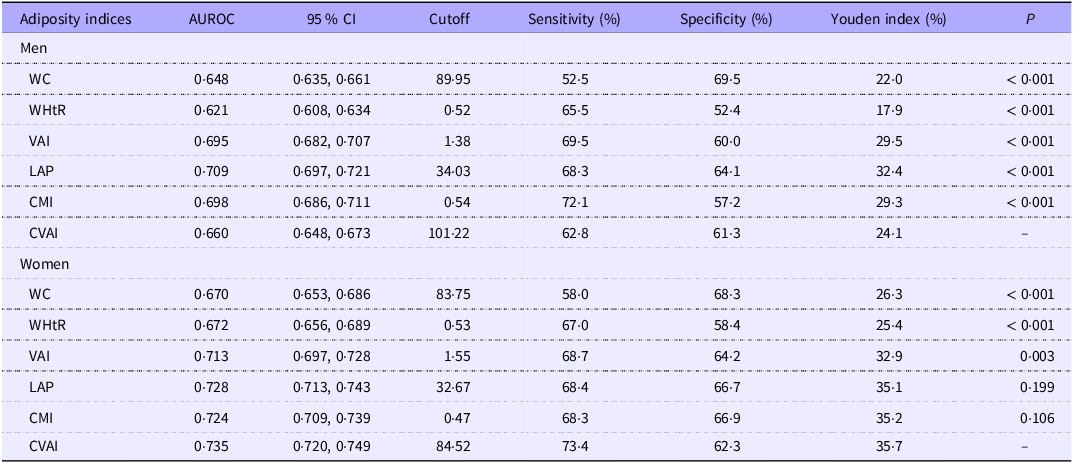
The receiver operating characteristic curve analysis showed the predictive ability of CVAI, VAI, LAP, CMI, WHtR and WC for HUA in both sexes (online Supplementary Figure S3). The AUROC with 95 % CI of CVAI, VAI, LAP, CMI, WHtR and WC in men were 0·660 (0·648, 0·673), 0·695 (0·682, 0·707), 0·709 (0·697, 0·721), 0·698 (0·686, 0·711), 0·621 (0·608, 0·634) and 0·648 (0·635, 0·661), respectively, and 0·735 (0·720, 0·749), 0·713 (0·697, 0·728), 0·728 (0·713, 0·743), 0·724 (0·709, 0·739), 0·672 (0·656, 0·689) and 0·670 (0·653, 0·686), respectively, in women. Among them, LAP had the largest AUROC for HUA in men, with a cut-off of 34·03 (sensitivity: 68·3 %, specificity: 64·1 %), and CVAI had the largest AUROC for HUA in women, with a cut-off of 84·52 (sensitivity: 73·4 %, specificity: 62·3 %; Table 3). Additionally, the AUROC of CVAI was further compared with those of other adiposity indices among different sexes. Among men, the AUROC of CVAI statistically weaker than those of LAP, CMI and VAI and greater than those of WC and WHtR (all P < 0·001). Among women, the AUROC of CVAI were statistically greater than those of WC, WHtR and VAI (all P < 0·05). Meanwhile, no significant differences were observed in the AUROC between CVAI and CMI and between CVAI and LAP (Table 3). Similar results were observed in the sensitivity analysis (online Supplementary Table S3).
Area under the receiver operating characteristic curve (AUROC) of adiposity indices for predicting hyperuricemia (HUA) among men (n 10 355) and women (n 11 816) enrolled in the Chinese Multi-Ethnic Cohort study

WC, waist circumference; WHtR, waist:height ratio; VAI, visceral adiposity index; LAP, lipid accumulation product; CMI, cardiometabolic index; CVAI, Chinese visceral adiposity index; HUA, hyperuricaemia; AUROC, area under the receiver operating characteristic curve.
Stratified analysis
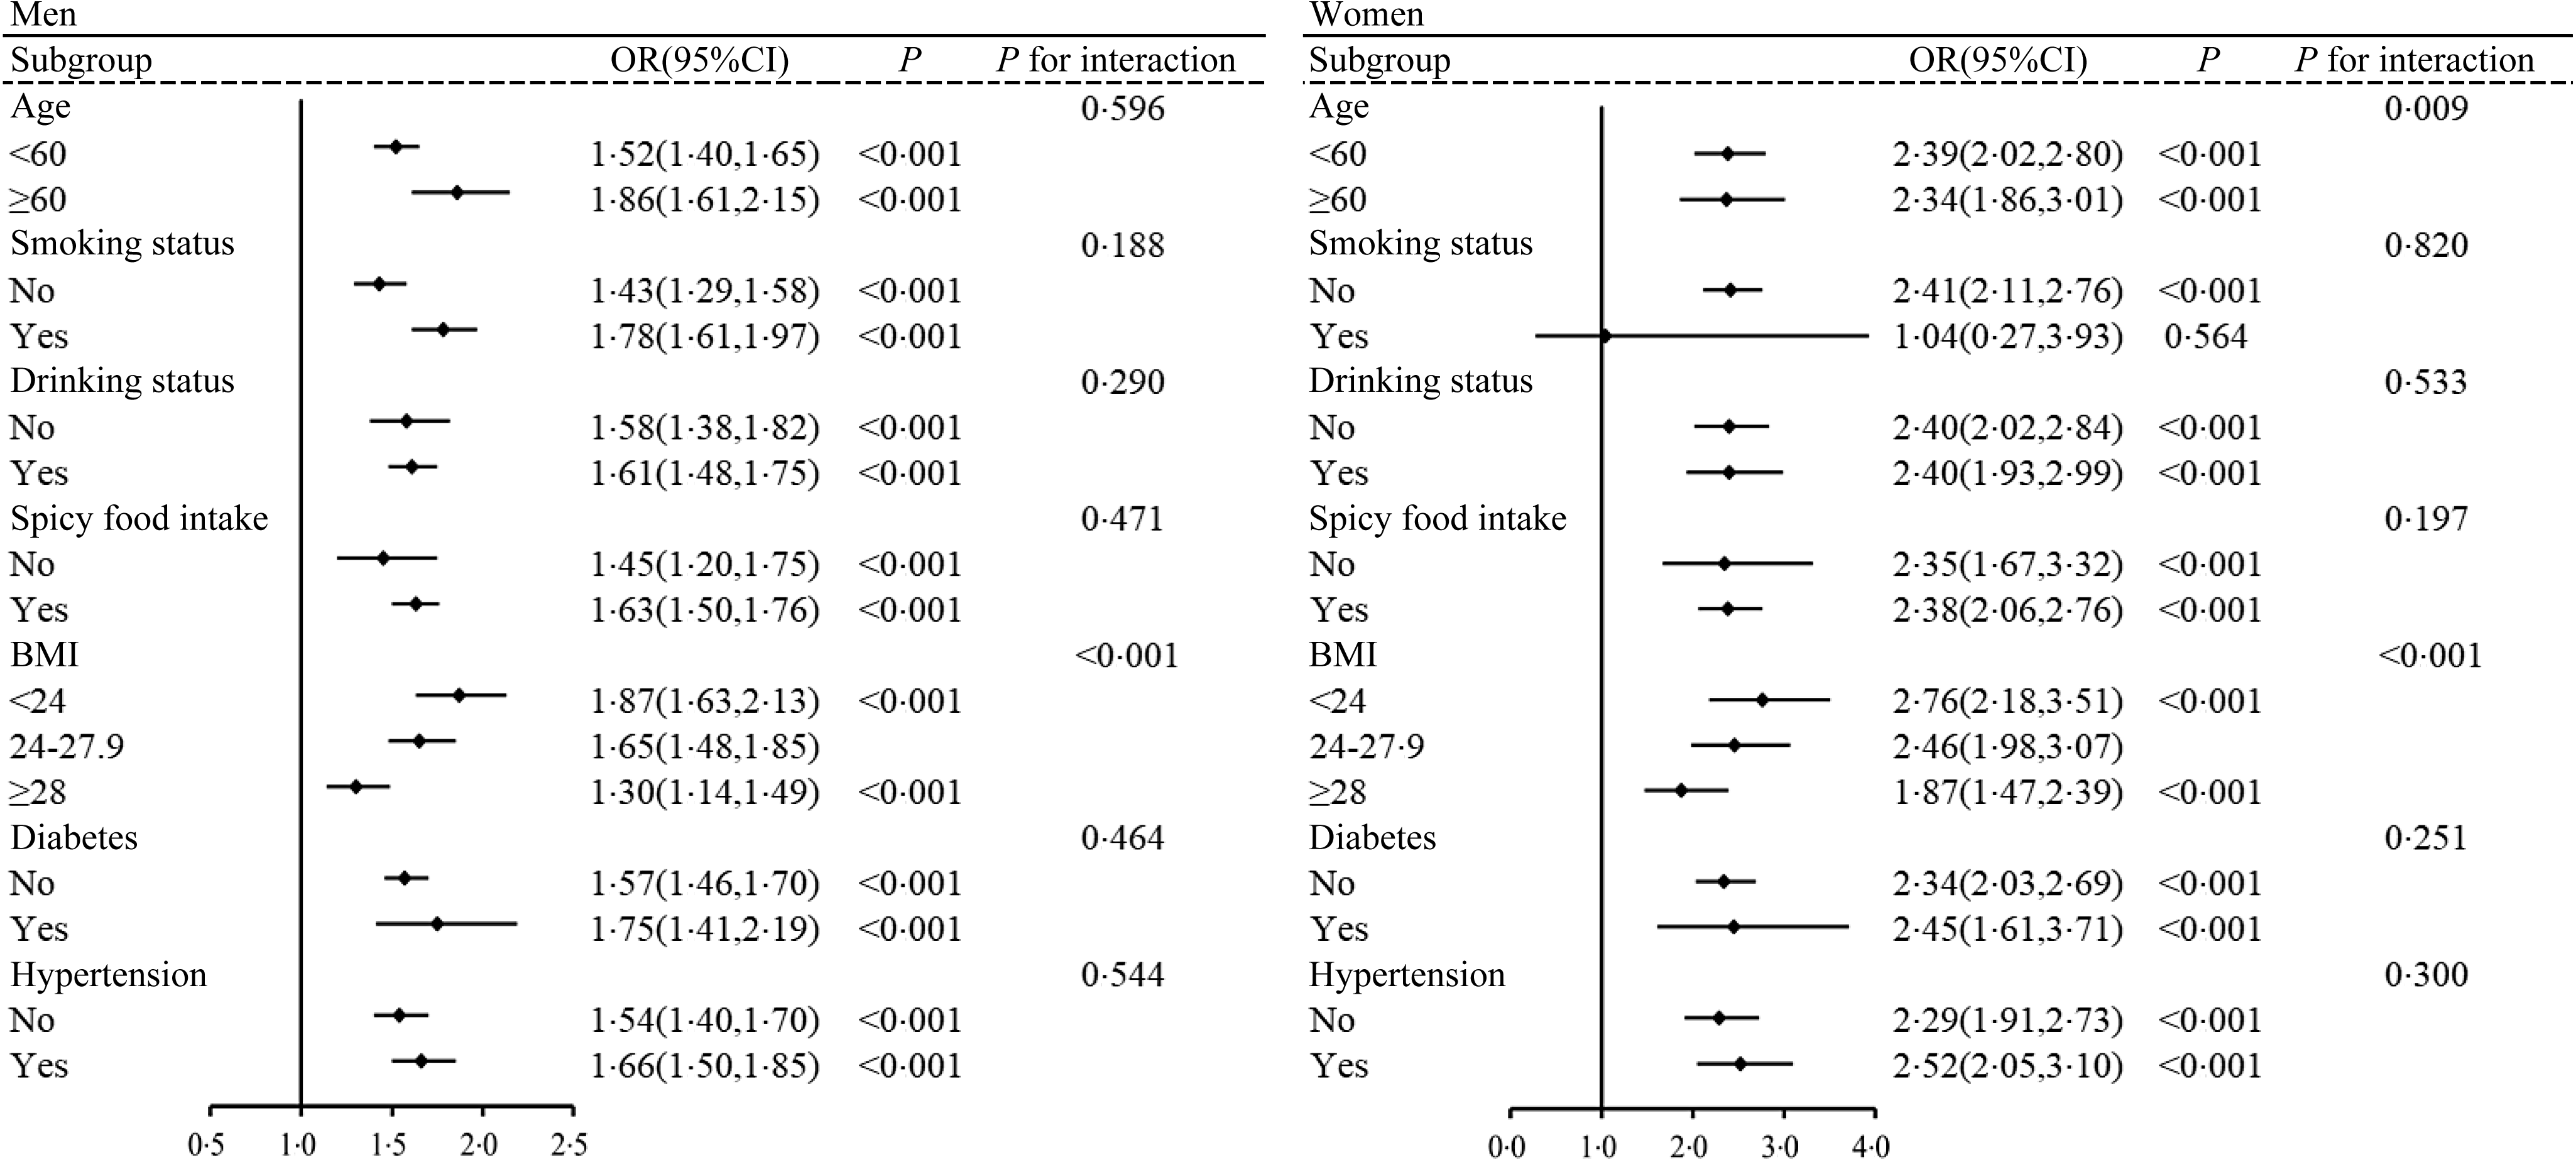
The participants were grouped based on age (< 60 and ≥ 60 years), smoking status (no and yes), drinking status (no and yes), spicy food (no and yes), BMI (< 24·0, 24·0–27·9 and ≥ 28·0 kg/m2), diabetes (no and yes) and hypertension (no and yes) to evaluate the effect modification of these factors on the association between CVAI and HUA. The positive association between CVAI and HUA persisted across various subgroups for both sexes. In both sexes, significant interactions were observed between BMI and CVAI on HUA (all P interaction < 0·001). When analyses were stratified by BMI, the association between CVAI and HUA was strongest in individuals with BMI < 24·0 kg/m². Specifically, for men, the percentage increase in OR of HUA (calculated as [OR–1] × 100 %) was 87 % in the BMI < 24·0 kg/m² group (OR = 1·87, 95 % CI 1·63, 2·13), 65 % in the BMI 24·0–27·9 kg/m² group (OR = 1·65, 95 % CI 1·48, 1·85) and 30 % in the BMI ≥ 28·0 kg/m² group (OR = 1·30, 95 % CI 1·14, 1·49). Similarly, among women, the corresponding percentage increases were 176 % (OR = 2·76, 95 % CI 2·18, 3·51), 146 % (OR = 2·46, 95 % CI 1·98, 3·07) and 87 % (OR = 1·87, 95 % CI 1·47, 2·39) across different BMI groups (Figure 2). Moreover, a significant interaction was found between age and CVAI on HUA in women (P interaction < 0·05). However, the magnitude of the association changed minimally across different age groups, with an OR of 2·39 (95 % CI 2·02, 2·80) per 1-sd increase in CVAI for women aged < 60 years and 2·34 (95 % CI 1·86, 3·01) for those aged ≥ 60 years (Figure 2). Similar positive associations were observed in the sensitivity analysis (online Supplementary Figure S4).
Association between Chinese visceral adiposity index (CVAI) (per-sd increase) and hyperuricaemia (HUA) among adults enrolled in the Chinese Multi-Ethnic Cohort study, stratified by age, smoking, drinking, spicy food, BMI, diabetes and hypertension, using logistic regression model. The model was adjusted for age, area, education level, marital status, smoking, drinking, spicy food intake, DASH score, physical activity, diabetes, hypertension, BMI, eGFR, TC and LDL-cholesterol, except for stratification. Data are OR and 95 % CI. CVAI, Chinese visceral adiposity index; DASH, Dietary Approaches to Stop Hypertension; eGFR, estimated glomerular filtration rate; HUA, hyperuricaemia; TC, total cholesterol.

Discussion
The sex-specific association between CVAI and HUA was thoroughly explored for the first time by using a large population-based sample from Chongqing, China. A significant positive association was found between CVAI and HUA, even after adjusting for a wide range of biochemical and lifestyle factors. Sex differences were observed, with a stronger association in women than in men. Moreover, a nonlinear dose–response relationship between CVAI and HUA was observed in both sexes. Further stratified analysis revealed that the association between CVAI and HUA was strong in both sexes with BMI < 24·0 kg/m2. A significant interaction was found between age and CVAI on HUA in women. However, the magnitude of association showed minimal variation across different age groups.
This research also showed that CVAI performed well in predicting HUA in women (with the largest AUROC value), but relatively poorly in men. A Chinese study of 329 patients with type 2 diabetes revealed that except for visceral fat area, CVAI had the best diagnostic ability for HUA among other obesity indicators (BMI, neck circumference, WC and hip circumference), regardless of sex(Reference Wang, Wang and Yin24). However, new adiposity indices, such as VAI, LAP and CMI, were not considered in their study(Reference Wang, Wang and Yin24). Another study including 7848 participants explored the predictive ability of different obesity indices (including new adiposity indices) for HUA, indicating that CMI had the largest AUROC in both sexes, with no significant differences in the AUROC among CVAI, CMI and LAP for women(Reference Zhang, Qu and Qiu25). Differences in results across studies may be attributed to variations in study populations, sample sizes, statistical analyses and adjustment factors.
Moreover, our study found that LAP demonstrated the best predictive capability for HUA among men, with the largest AUROC. LAP’s calculation formula incorporates WC and TAG, which are closely related to abdominal obesity and lipid metabolism(Reference Mirmiran, Bahadoran and Azizi42). Men and women typically exhibit significant differences in lipid metabolism and visceral fat distribution(Reference Link and Reue43), potentially making LAP a more sensitive predictor of HUA in men. Previous studies have indicated that LAP has been more strongly correlated with HUA than other adiposity indices and has exhibited satisfactory predictive capability for HUA(Reference Su, Lin and Liu26,Reference Liu, Li and Huang44) . However, these studies did not include CVAI. Our findings suggest that CVAI had satisfactory predictive capability for HUA in women, while LAP was effective in men. Therefore, considering sex-specific factors, combining different obesity indices may be necessary for comprehensive HUA assessment.
Furthermore, CVAI was more strongly associated with HUA in women than in men, similar to findings from a recent Taiwan study that showed a stronger correlation between obesity-related indices and HUA in women(Reference Su, Lin and Liu26). They hypothesised that this discrepancy may be attributed to higher xanthine oxidoreductase activity in men(Reference Su, Lin and Liu26), which catalyses the synthesis of uric acid (UA) through the oxidation of hypoxanthine and xanthine(Reference Battelli, Bortolotti and Polito45). Tsushima et al. suggested that adipose tissue is rich in xanthine oxidoreductase, which plays a key role in UA production utilising a mouse model(Reference Tsushima, Nishizawa and Tochino46). A previous study has indicated higher levels of xanthine, hypoxanthine and plasma xanthine oxidoreductase in men than in women, with hypoxanthine concentration independently associated with obesity(Reference Furuhashi, Koyama and Higashiura47). Thus, higher xanthine oxidoreductase activity in men may explain the weaker correlation between obesity indicators and HUA. Additionally, previous studies have found a stronger association between visceral fat and adverse metabolic outcomes in women than in men, possibly due to sex differences in adipocyte size, basal lipolysis and fatty acid oxidation rates(Reference Kanaya, Harris and Goodpaster48,Reference Tanaka, Togashi and Rankinen49) . Women tended to have lower levels of basal fatty acid oxidation than men, making them more susceptible to metabolic disturbances(Reference Blaak50). Further studies are needed to explore the sex physiology associated with HUA and obesity.
Additionally, the stratified analysis suggested that BMI could potentially modulate the association between CVAI and HUA, a more pronounced interaction effect of CVAI on HUA was observed in individuals with BMI < 24·0 kg/m2. BMI, serving as a general obesity metric, is incapable of evaluating specific regional adipose tissue content. For instance, a CT study demonstrated that individuals with normal BMI (18·5–25·0 kg/m²) exhibited a high proportion of visceral obesity – a condition strongly linked to metabolic disorders(Reference Kong, Xu and Zhou51). In Asians, visceral obesity has emerged as a more reliable indicator of obesity than BMI(Reference Kang, Baek and Kim52). Research has shown stronger correlations between abdominal obesity indices (WC, VAI, LAP and CVAI) and incident cardiovascular events in the subgroup with BMI < 25 kg/m² compared with the overweight/obese group(Reference Qiao, Luo and Pei17). Another study had similar findings(Reference Wan, Wang and Xiang23). These findings collectively indicate that BMI inadequately captures visceral fat accumulation – a key factor of obesity-related diseases like HUA and CVD. To the best of the authors’ knowledge, this study was the first stratified analysis conducted to explore the relationship between CVAI and HUA.
SUA is produced as a result of purine metabolism, with its levels primarily governed by the balance between UA production and excretion(Reference Fathallah-Shaykh and Cramer53). Our study found an association between CVAI and HUA. The mechanisms may include (1) The buildup of obese adipose tissue in individuals with obesity can increase free fatty acid levels, which are closely associated with de-novo purine synthesis, thereby promoting SUA production(Reference Takahashi, Yamamoto and Tsutsumi15,Reference Tsushima, Nishizawa and Tochino46) . (2) Adiposity is associated with hyperinsulinemia and insulin resistance, which may affect the reabsorption of Na and UA on renal tubules, leading to reduced UA excretion and increased UA levels, ultimately fostering the development of HUA(Reference Fryk, Olausson and Mossberg54–Reference Quiñones Galvan, Natali and Baldi56). (3) Visceral adipose tissue exhibits a higher level of lipolysis than subcutaneous adipose tissue. The higher the lipolytic activity of visceral adipose tissue, the greater the flow of free fatty acids to the liver, affecting purine metabolism and accelerating UA production(Reference Seyed-Sadjadi, Berg and Bilgin57).
The key strengths of this study include that it is the first to explore the sex-specific association between CVAI and HUA in a large population-based sample from Chongqing, as well as the first to examine their dose–response relationship, which was not considered in previous research. However, several limitations should be noted. First, as a cross-sectional study, causality cannot be determined. Second, self-reported data on variables, such as physical activity, smoking, drinking and dietary habits, may introduce reporting and recall biases. Third, participants with HUA may have altered their lifestyles to reduce visceral fat accumulation, potentially underestimating the association. Therefore, longitudinal studies are warranted to validate these findings. Finally, since the study was conducted exclusively in Chongqing, China, the results may not be generalisable to broader Chinese populations.
Conclusions
The research findings indicated a close association between CVAI and HUA in adults aged 30–79 years in Chongqing, China, particularly pronounced in those with BMI < 24·0 kg/m², and with sex differences. A stronger association was found in women than in men. For women, CVAI served as a satisfactory predictor of HUA, while for men, LAP proved to be a more effective predictor. Considering the sex factor, different obesity-related indices should be combined to provide a comprehensive evaluation for HUA.
Acknowledgements
We are very grateful to all the participants in this study and to all team members for their support of this study.
This work was supported by the National Key Research and Development Program of China (Grant number 2017YFC0907303), the Medical Scientific Research Project of Chongqing Health Commission (Grant number 2022WSJK021) and the Key Research and Development Project of the Science and Technology of Sichuan Province (Grant number 2020YFS0216).
The authors’contributions are as follows: X. D., X. T., W. T., J. Q. and X. L. designed research; Y. L., R. D, L. C., Y. H. and M. X. conducted research; W. T., J. Q. and X. L. provided essential reagents and materials; Y. L., R. D., L. C., Y. H. and M. X. analysed data; Y. L. wrote the paper; X. D. and X. T. reviewed and revised the manuscript and Y. L., X. D. and X. T. had primary responsibility for final content. All authors read and approved the final manuscript for submission.
The authors declared that they had no conflicts of interest with the contents of this article.
Supplementary material
For supplementary material/s referred to in this article, please visit https://doi.org/10.1017/S0007114525000595