








1. Introduction
Young stellar objects (YSOs) are pre-main-sequence protostars with active accretion and winds that expel matter and angular momentum along the axis of rotation (Hartmann & MacGregor Reference Hartmann and MacGregor1982; Burgarella, Livio & O'Dea Reference Burgarella, Livio and O'Dea1993; Lynden-Bell Reference Lynden-Bell1996). While bipolar collimated jets are broadly observed in YSOs, the relationship between the collimation and stability of the jets and the local magnetic field evades understanding. The magnetocentrifugal theory of outflows (Blandford & Payne Reference Blandford and Payne1982) suggests that magnetic field lines may provide guides for plasma flung centrifugally from the disk to travel out along the poles of the star. An alternative model suggests a ‘magnetic tower’ mechanism (Lynden-Bell Reference Lynden-Bell1996, Reference Lynden-Bell2003; Lovelace et al. Reference Lovelace, Li, Koldoba, Ustyugova and Romanova2002) in which magnetic field lines are frozen into the rotating accretion disk and subsequently wind up into a tight coil. When this coil releases tension like a compressed spring, the axial jet is accelerated up and a magnetic cavity forms around the structure. There is no clear observational evidence for the theories describing a disk-to-jet transition due to the difficulty of resolving the launch region, so testing the mechanisms in scaled laboratory experiments allows for a bridge between simulated models and measurable plasma properties.
This paper provides proof-of-concept for a new experimental design with which to study scaled rotating plasmas that transition from a converging, rotating ‘disk’ into rotating bipolar axial outflows. The multiple possible permutations of this load design are described in further detail in a previous paper (Hasson et al. Reference Hasson, Adams, Evans, Shapovalov, West-Abdallah, Young, Greenly, Hammer, Kusse and Seyler2020), but we will focus on the simplest iteration in this study. This design will be an example of the regime of the plasma we expect to produce and will help us understand any shortcomings in the model used for our magnetohydrodynamics (MHD) simulations. In this work, we will address the stages of the experiment at different times in the current pulse, from the early axial precursor plasma to the assembly of the jets around peak current to finally the matured outflow well into the current reversal. In future iterations of this platform, we will observe the effects of adding axial magnetic field and rotational velocity on how long the jet remains stable and the degree of collimation in the outflows.
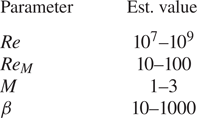
To justify the scaling of a laboratory experiment to the astrophysical context, we must match certain dimensionless parameters that arise from the non-dimensionalized MHD equations (Ryutov et al. Reference Ryutov, Drake, Kane, Liang, Remington and Wood–Vasey1999, Reference Ryutov, Remington, Robey and Drake2001). The experiment in this work was modelled previously (Hasson et al. Reference Hasson, Adams, Evans, Shapovalov, West-Abdallah, Young, Greenly, Hammer, Kusse and Seyler2020) using the PERSEUS 3-D MHD code (Seyler & Martin Reference Seyler and Martin2011) to estimate the following parameters: the sonic Mach number $M$ , the local ratio of thermal to magnetic pressure $\beta$
 , the Reynolds number $Re$
 and the magnetic Reynolds number $Re_M$
 . The formulae for these parameters are

where $u$ is the speed of the plasma, $c_s$
 is the sound speed, $L$
 is the characteristic length scale of the system (taken to be the magnetic scale length of half the jet radius $L=\lvert \boldsymbol {B}\rvert /\lvert \boldsymbol {\nabla }\times \boldsymbol {B}\rvert =r/2$
 (Gourdain & Seyler Reference Gourdain and Seyler2013), $\nu$
 is the kinematic viscosity and $\eta$
 is the magnetic diffusivity, which is the electrical resistivity divided by the vacuum permeability $\mu _0$
 in SI units.
Observations of YSO jets have yielded $M\gg 5$ , $0.01<\beta <100$
 , $Re>10^8$
 and ${Re_M>10^{15}}$
 (Garcia & Ferreira Reference Garcia and Ferreira2009), but realistic laboratory plasmas cannot match the viscous and magnetic Reynolds numbers exactly, due largely to their dependence on the system length scale for a given temperature. Thus, the experiments fit into the broader regimes of dimensionless quantities that highlight the same dominant physical processes:

This places the experiment in the regime of supersonic, turbulent flows (Dimotakis Reference Dimotakis2000) that have magnetic flux frozen into the plasma and magnetic pressure dominating outside the jet while thermal pressure dominates inside the jet. We proceed with these important dimensionless conditions in mind.
Previous pulsed-power experiments have used various radial foil and radial wire array designs to reproduce flows that emulate mixtures of the magnetocentrifugal and magnetic tower models. While radial wire arrays and foils are able to create collimated jets with rotation (Lebedev et al. Reference Lebedev, Ciardi, Ampleford, Bland, Bott, Chittenden, Hall, Rapley, Jennings and Frank2005; Suzuki-Vidal et al. Reference Suzuki-Vidal, Lebedev, Ciardi, Bland, Chittenden, Hall, Harvey-Thompson, Marocchino, Ning and Stehle2009), they do not emulate the accretion aspect of the astrophysical system. Conical and cylindrical wire arrays (Lebedev et al. Reference Lebedev, Chittenden, Beg, Bland, Ciardi, Ampleford, Hughes, Haines, Frank and Blackman2002; Aleksandrov et al. Reference Aleksandrov, Grabovski, Zukakishvili, Mitrofanov, Medovshchikov and Frolov2008; Ampleford et al. Reference Ampleford, Lebedev, Ciardi, Bland, Bott, Hall, Naz, Jennings, Sherlock and Chittenden2008; Bennett et al. Reference Bennett, Lebedev, Hall, Suttle, Burdiak, Suzuki-Vidal, Hare, Swadling, Patankar and Bocchi2015; Valenzuela-Villaseca et al. Reference Valenzuela-Villaseca, Suttle, Suzuki-Vidal, Halliday, Merlini, Russell, Tubman, Hare, Chittenden and Koepke2023) have been used to generate pseudo-axisymmetric flows (small number of streams distributed at equal intervals along the azimuth) that move radially inwards and then eject a jet along the central axis. These experiments have emulated the accretion flow geometry well, but may only create limited combinations of magnetic field geometries and plasma rotation due to their current path design. We use a short-wire array to generate a thinner inflow and focus our study on the development of the outflow far outside of the array. In future studies, we will attempt to use our unique current path in figure 8 to independently control rotation and magnetic field geometry.
2. Experimental set-up and load description
All 24 of the shots analysed for this paper were performed on Cornell's COBRA driver (Greenly et al. Reference Greenly, Douglas, Hammer, Kusse, Glidden and Sanders2008) using a multi-peaked waveform with a rise time of $t_{{\rm rise}}\approx 200$ ns (figure 1). Our load for this set of experiments is the same modified cylindrical wire array design as described previously (Hasson et al. Reference Hasson, Adams, Evans, Shapovalov, West-Abdallah, Young, Greenly, Hammer, Kusse and Seyler2020), but used as a standard wire array load with radial converging flows and non-rotating outflows (figure 2). The cylindrical wire arrays were each $\approx$
 1 cm in diameter and $\approx$
 2 mm tall. All wires in the arrays were of $50\,\mathrm {\mu }$
 m diameter aluminium and each 3-D-printed stainless steel load discussed in this paper was identical. Additional load measurements are given in Appendix A.
Seventeen traces of the long-pulse current profile on the COBRA driver.

Load geometry for this experiment. Left is a photo of a load installed on Cornell's COBRA driver with an inset zoom-in of a single hook and wire for clarity. The outer diameter of the load's base measures 8.4 cm. On the right is a top-down view of the same load with a hole drilled in the centre for additional diagnostic access.

When the wires in the array are ohmically heated by the $\sim$ 1 MA current pulse, their outer layer becomes a hot coronal plasma that may be pushed radially inwards by magnetic forces in the system up to velocities of $v\sim 100$
 km s$^{-1}$
 (according to the rocket model of Lebedev et al. (Reference Lebedev, Beg, Bland, Chittenden, Dangor, Haines, Kwek, Pikuz and Shelkovenko2001) and measurements by Harvey-Thompson et al. Reference Harvey-Thompson, Lebedev, Patankar, Bland, Burdiak, Chittenden, Colaitis, De Grouchy, Doyle and Hall2012a, Reference Harvey-Thompson, Lebedev, Patankar, Bland, Burdiak, Chittenden, Colaitis, De Grouchy, Hall and Khooryb). These flows then collide at the centre and are squeezed out along the poles by the bulk pressure (figure 2).
We will include the complexities of tuning the load to produce rotation and axial magnetic field in later campaigns, after we show that reproducible outflows with scaling parameters near what is needed for protostellar jets may be achieved in this simplified study.
3. Diagnostics
3.1. Imaging diagnostics
Optical spatially resolved and line-integrated interferometry and shadowgraphy were performed with an Ekspla Nd:YAG laser with a 148 ps duration and 140 mJ pulse at the frequency-doubled wavelength of 532 nm. The interferometry was obtained either with a trio of shearing air-wedge interferometers (Sarkisov Reference Sarkisov1996) at three different time delays, or with a single Mach–Zender set-up. The interference fringes were then phase-unwrapped with a Levenberg–Marquardt algorithm (Gourdain & Bachmann Reference Gourdain and Bachmann2022) and converted to areal electron number density measurements. Due to the asymmetries of the plasma outflows produced on most shots, we are not able to use Abel inversion to obtain volumetric number density.
The shadowgraphy images were obtained from the same views as the shearing interferometers, since the experimental arrangement includes splitting the laser beam into interferometry and shadowgraphy channels after the beam exits the plasma. While the signal in these images is deflected proportional to the second derivative of the refractive index (Hutchinson Reference Hutchinson1987), here it is used for qualitative analyses.
We used a pair of extreme ultraviolet (XUV) cameras that each collected an array of four images with a gate of 5 ns each from the plasma's self-emission. Each image was generated from a separate pinhole in front of an independently triggered multi-channel plate (MCP) sensitive to the 10–100 eV energy range. The four MCPs for each camera were triggered with 10 ns staggered delays and captured by a charge-coupled device (CCD) camera. These emission images are used for qualitative analysis of the plasma evolution.
A gated optical Invisible Vision camera was used in each shot to collect a series of 12 images with adjustable exposure lengths and frame rates. The sets of images used in this study were all 5 ns exposures with frame rates of either 1 frame per 30 ns or 1 frame per 20 ns. The camera imaged plasma self-emission from a side-on view in the 1.5–3 eV range for qualitative analysis.
3.2. Optical Thomson scattering (OTS)
To locally measure bulk flow velocities and electron temperatures, we used an optical Thomson scattering (OTS) diagnostic on several shots. We injected a 10 J, 526.5 nm laser with a 2.3 ns pulse width through a Brewster-angle window; it was focused with a 5 cm diameter, 1.5 m focal length lens to a diameter of approximately 250 $\mathrm {\mu }$ m in the plasma. The laser crossed the central axis of the plasma at either the height of the wire array midplane (to observe the radial inflow) or approximately 2 mm above the top of the load hardware in the jet outflow (figure 3). We then collected scattered light at two angles in the $r$
 –$\theta$
 plane of the array and one along the outflow axis using linear optical fibre arrays (figure 3). The wavevector measured by an array of optical fibres is defined as

where $\boldsymbol {k}_s$ and $\boldsymbol {k}_L$
 are the wavevectors of the collected scattered light and input laser, respectively. Figure 3 shows these vectors in the plane of the vacuum chamber and along the outflow axis. The scattered light was collected by two arrays of twenty fibres (one bundle was split in half when all three collection angles were used simultaneously) with diameters of $100\,\mathrm {\mu }$
 m and spacing of $125\,\mathrm {\mu }$
 m from centre-to-centre. The light from these fibre arrays was then fed into a 0.75 m Czerny–Turner spectrometer with a grating of 2400 lines mm$^{-1}$
 . This produced spectra with a resolution of 0.6 Å. For the shots in which we probed the plasma before the outflow had ejected, one fibre array collected light at $+90^{\circ }$
 (referred to as the south bundle $k_{{\rm south}}$
 in figure 3) in the midplane of the wire array, and for the shot in which we probed the ejected outflow, two additional fibre arrays also collected light at $-90^{\circ }$
 in the plane of the vacuum chamber (the north bundle $k_{{\rm north}}$
 ) and orthogonal to the chamber along the bottom outflow axis (the bottom bundle, $k_{{\rm bot}}$
 ). The spatial resolution of the two side-on collection views was ${\approx }250\,\mathrm {\mu }$
 m, and the resolution of the bottom collection view was ${\approx }530\,\mathrm {\mu }$
 m. With these three collection angles, we may compute the azimuthal, radial and axial components of the bulk velocity ($v_\theta$
 , $v_r$
 and $v_z$
 ) by converting the Cartesian components measured into cylindrical coordinates. Since $k_{{\rm south}}$
 and $k_{{\rm north}}$
 are each $90^{\circ }$
 from the laser-forward direction, and thus have equal radial and azimuthal components, the following formulae may then be used to obtain the three cylindrical velocity components from each bundle's measured Doppler velocity:

Although the load design in this campaign is meant to produce radially inward flows, each ablation stream initially emerges with a spread of angles before interacting with its neighbours to cancel rotational components. Therefore, our early measurements in particular may include some component of $v_\theta$ . Thus, when we only have spectra in one fibre bundle, we cannot assume that our measurements are observing purely radial velocities. In these cases, we will thus discuss bulk velocities in terms of $\boldsymbol {v}_{k,{\rm south}}$
 , the velocity along the only measurement vector, for these shots.
A (a) top-down and (b) side-on view of the OTS vectors, as well as (c) a sample of a raw spectrum and model fit for $\boldsymbol {v}_k$ , $T_e$
 and $T_i$
 from each collection view. Laser vector $\boldsymbol {k_L}$
 is shown in green; scattering collection vectors $\boldsymbol {k}_{s1}, \boldsymbol {k}_{s2}$
 and $\boldsymbol {k}_{s3}$
 are shown in black; and measurement vectors $\boldsymbol {k}_{{\rm south}}, \boldsymbol {k}_{{\rm north}}$
 and $\boldsymbol {k}_{{\rm bot}}$
 are shown in orange. The scattering laser enters the vacuum chamber from the $-\boldsymbol {x}$
 direction and focuses at the centre of the chamber in the plasma (in dark grey) at either $\approx$
 2 mm above the load or in the midplane of the wire array. The collection volumes observed by the fibres are shown as a strand of yellow dots in the side-on view.

The plasma parameters in this experiment are such that the scattered spectrum is in the collective regime (Sheffield et al. Reference Sheffield, Froula, Glenzer and Luhmann2010). The collective scattered spectrum gives us a double- or single-peaked ion-acoustic wave feature, whose properties we may fit to a theoretical spectral density function to constrain the bulk plasma velocity, ion temperature, electron temperature and electron–ion drift velocity. Each fibre's spectrum is averaged vertically across approximately 25 pixel rows in the focusing spectrometer gated intensified CCD camera, corresponding to the physical height of the fibre. The averaged spectrum is then fit by a theoretical spectral density function using the ThomsonPy code (Banasek et al. Reference Banasek, Byvank, Rocco, Potter, Kusse and Hammer2018). For these fits, we chose a model that fits for $T_e$ and $T_i$
 independently, since wire arrays are known to have high radiative cooling of electrons and potential shock heating of ions during the pinch (Harvey-Thompson et al. Reference Harvey-Thompson, Lebedev, Patankar, Bland, Burdiak, Chittenden, Colaitis, De Grouchy, Doyle and Hall2012a, Reference Harvey-Thompson, Lebedev, Patankar, Bland, Burdiak, Chittenden, Colaitis, De Grouchy, Hall and Khooryb), which other jets from wire arrays have also demonstrated (Valenzuela-Villaseca et al. Reference Valenzuela-Villaseca, Suttle, Suzuki-Vidal, Halliday, Merlini, Russell, Tubman, Hare, Chittenden and Koepke2023). We ultimately used this fit to extract the Doppler velocity along $\boldsymbol {k}$
 ($v_{k,{\rm north}}, v_{k,{\rm south}}$
 or $v_{k,{\rm bot}}$
 ), the electron temperature $T_e$
 and the ion temperature $T_i$
 . Error bars were then computed in the ThomsonPy code by fitting 100 Monte Carlo (Follett et al. Reference Follett, Delettrez, Edgell, Henchen, Katz, Myatt and Froula2016; Banasek et al. Reference Banasek, Byvank, Rocco, Potter, Kusse and Hammer2018) trials in which the electron number density, ionization state, ratio of electron and ion temperatures, instrument function, laser wavelength, and linear dispersion parameters were varied from the initial fit by sampling from a Gaussian distribution for each error. By taking the mean and standard deviation of these 100 fits, we found our best fit and its corresponding standard deviation.
4. Results
4.1. Plasma structure and density
We first observe the gradual stripping of coronal wire plasma into ablation streams that flow towards the central axis in the early stages of the experiment ($t\gtrsim 30$ ns before $I_{{\rm peak}}$
 ). These inward ablation flows creates a small stagnated plasma at roughly the load centre with areal number density of the order of $n\sim 10^{18}$
 cm$^{-2}$
 observed as early as 140 ns before $I_{{\rm peak}}$
 . We will henceforth refer to this early axial structure as the ‘precursor’, as it is called in many wire array Z-pinch studies. Figure 4 shows a side-by-side comparison of the precursor in three separate shots at different times relative to peak current. We can see that these jets are generally not symmetrical, likely due to the small amount of wires in the array (six), as well as potential asymmetries in the 3-D-printed load hardware onto which the wires are mounted. Although the resulting precursors may be tilted (like the leftmost shot, 6481) or longer on one side (as with the centre image, shot 6483), they are filled (also supported by top-down XUV imaging). There are asymmetries between the top and bottom of the precursors as well that may evolve with time, an example of which is the rightmost image of figure 4, shot 6485. This can be attributed to the $z$
 -axis asymmetry of the magnetic fields generated by the load, which has complicated leg structures on the bottom and empty space above. This field asymmetry and resultant jet asymmetry are consistently observed in PERSEUS simulations (see Appendix B).
Three side-on shadowgraphs in different shots at early times before peak current. The stagnated precursors are filled cylindrical structures.

We next observe a dense plasma inside the array around the time of peak current that breaks into two with an underdensity at the midplane of the wire array (see figure 6(b-ii). The density and structure of this region are harder to estimate due to the extremely small fringe spacing (requiring $\ell*n_e>10^{19}\,{\rm cm}^{-2}$ ), but because they likely do not reach the critical number density for the 532 nm laser ($n_e \approx 4\times 10^{21}$
 cm$^{-3}$
 ), we can use this as an absolute cap for the interferometry and shadowgraphy measurements. We note that the remaining wire material is consistently observed to be pinched towards the axis shortly after peak current, which is coupled with an observed spike in the x-ray flux measured by photoconductive detectors on average 10 ns after $I_{{\rm peak}}$
 . The current path has now changed and must go through the plasma to traverse the gap left by the wires, causing magnetic pressure to build interior to this new current geometry. The resultant magnetic bubble expands and plasma is ejected out along the axis of the array as the current begins to reverse. We refer to this period after the precursor formation and before the outflow launch as the ‘assembly’ phase, as the magnetic bubble that pushes the outflows forms during this time.
Finally, the top outflow launches beyond the load hardware after approximately 35 ns and continues to expand. As an outflow grows, any asymmetries may amplify and be warped by MHD kink instabilities. This is evident in some interferometry and emission imaging at later times, as shown in figure 5. We see complicated density variations at $t=95$ ns after $I_{{\rm peak}}$
 in the interferometry image, where the straight fringe lines are extremely warped by the electron areal number density of at least $n_e\sim 10^{19}$
 cm$^{-2}$
 in the plasma. The interferometry and optical emission images at this time show identical development of a kink in the outflow, which later develops into a break in the jet. This kink instability indicates the presence of current in the outflow, since this is an MHD phenomenon, supporting the idea that the current path has shifted to the plasma due to the loss of the wires. These kinks were not evident in every shot, but were observed on three of the eight shots where imaging of the outflow was recorded.
(a) A raw interferogram with a processed line-integrated number density map inset (masked region in black) and (b) an optical emission image of an outflow in shot 6720, both at 95 ns after peak current from the same view angle. A kink in the vertical outflow is visible in both images. The load hardware is overlaid for clarity and both images have the same spatial scale.

4.2. Measured velocities
We calculated bulk flow velocities using multiple local Doppler shift measurements from OTS at a single time. As discussed in § 3.2, OTS measurements were done at two different heights, one in the midplane of the wire array to capture inflow and jet formation dynamics and the other $\approx$ 2 mm above the top of the load hardware ($\approx$
 6.25 mm above the wire array midplane) to capture velocity components in the top jet (see figure 3).
OTS measurements in the midplane of the wire array were taken to observe the precursor at 125 ns before $I_{{\rm peak}}$ and to observe the ‘assembly’ stage when the implosion of the array begins to transition to a jet at roughly the time of $I_{{\rm peak}}$
 . As mentioned in § 3, we only had one collection angle that received any signal for the shots where OTS was collected in the midplane, so we may only discuss Doppler velocities in the direction of the measurement wavevector $\boldsymbol {k}_{{\rm south}}$
 , which is some combination of radial and azimuthal components. Figure 6(a-i,a-ii) shows the bulk velocities obtained from fitted Doppler shifts for these two shots. We can see that in the Precursor frame, the plasma velocity decreases from the typical ${\sim }100$
 km s$^{-1}$
 wire array ablation streams to as low as 10 km s$^{-1}$
 inwards closer to the precursor. This behaviour is typical of wire array Z-pinches, which generate a stagnated column of ablated plasma on axis before the wires are pinched in. For the assembly stage, the velocity is a consistent ${\sim }70$
 km s$^{-1}$
 across the diameter of the wire array with a peak at the centre axis. This may be explained by the thinned wires being thrown inwards around this time, whipping up the entire radial inflow as they race towards the centre. This roughly flat velocity profile is consistent with the implosion phase in other cylindrical wire arrays (Harvey-Thompson et al. Reference Harvey-Thompson, Lebedev, Patankar, Bland, Burdiak, Chittenden, Colaitis, De Grouchy, Doyle and Hall2012a, Reference Harvey-Thompson, Lebedev, Patankar, Bland, Burdiak, Chittenden, Colaitis, De Grouchy, Hall and Khooryb), while the spike on axis may be an effect of the flows being dragged rapidly by the now-parting outflows.
OTS and imaging data from three shots studying (i) the precursor, (ii) the assembly of the jet and (iii) the base of the top outflow. The OTS data plots in panels (a-i–a-iii) show Doppler velocities and electron temperatures at various distances from the centre load axis. Negative positions are moving towards the laser entrance port of the target chamber. The shadowgraph images in panels (b-i,b-ii) show where the electron density gradients are steepest due to the plasma, with the OTS sample regions from panels(a-i–a-iii) overlaid in a red dashed line. Finally, panels (b-iii) and (c-i–c-iii) are XUV images of the side-on and top down views of the plasma respectively, where panel (b-iii) has a CAD drawing of the load overlaid. All times listed are relative to peak current.

The Doppler OTS measurement for the Outflow in figure 6(a-iii) sampled the plasma approximately 2 mm above the top of the hardware 82 ns after peak current (roughly 60 ns after the outflow launched). Three different angles of scattering collection were used for this shot to calculate all three cylindrical velocity components, $v_r$ , $v_\theta$
 and $v_z$
 (table 1). We collected all three views in two positions ($r=0.53,0.79$
 mm), which showed $v_z \approx 48$
 km s$^{-1}$
 near the axis and decreasing at a larger radius. The radial velocity component was nearly stagnant close to the axis, increasing to $v_r\approx 22$
 km s$^{-1}$
 moving radially outwards to the wall of the outflow. Finally, we measured $v_\theta \approx 14$
 km s$^{-1}$
 near the centre, but dropping sharply to near-zero at larger radii, indicating no rotation in the wall of the outflow.
Calculated velocity components for the outflow in shot 6720 at 82 ns after $I_{{\rm peak}}$ .
.

4.3. Electron temperatures and possible laser-heating
Electron temperatures were fitted concurrently with the Doppler velocities from Thomson scattering spectra. Figure 6(a-i–a-iii) shows the fitted electron temperatures for the three shots when OTS was used, with the temperatures for the measurements taken in the midplane of the wire array in panels (a-i) and (a-ii) and the measurements above the load in panel (a-iii).
We observe that for the precursor (figure 6a-i), looking in the midplane of the wire array at $t_{{\rm peak}}-125$ ns, there is a steep gradient in the electron temperature moving out from the centre of the jet. This ultimately peaks at $\approx$
 100 eV near what is likely where the precursor edge meets the hot ablation stream. For the shot observing the ‘assembly’ flow in panel (b-i) around peak current, we see that the plasma in this region has cooled and thermally equilibrated, as the temperature is now roughly 5–15 eV across the wire array midplane. In the outflow at 82 ns after $t_{{\rm peak}}$
 , we observe higher and less uniform temperatures of $\sim$
 10–50 eV.
However, we observe in the side-on XUV in figure 6(b-iii) that there is evident laser-heating from the OTS laser on the shot observing the outflow. This may influence our measurement on that shot to the extent that we cannot trust the outflow electron temperatures measured. We did not observe this emission due to laser heating in the precursor and radial inflow shots, likely due to the lower densities causing less absorption, so it is less likely it affected the electron temperature measurement. We used a simple inverse-Bremsstrahlung model of laser deposition (Turnbull et al. Reference Turnbull, Katz, Sherlock, Divol, Shaffer, Strozzi, Colaïtis, Edgell, Follett and McMillen2023; Young & Gourdain Reference Young and Gourdain2023) for our plasma to estimate that up to 30 eV of laser heating was possible. Since the temperatures measured in the assembly stage were quite low, we find it unlikely that there was laser-heating present there. Nonetheless, we will take the fitted temperatures as upper bounds. In the future, this effect could be reduced by lowering the laser intensity (at the cost of absolute scattering signal) or reducing the probe laser wavelength (which would increase experimental complexity if using UV light).
The ion temperature, which was fitted independently from the electron temperature, followed a typical evolution for wire array Z-pinches (Bott et al. Reference Bott, Lebedev, Ampleford, Bland, Chittenden, Ciardi, Haines, Jennings, Sherlock and Hall2006), where $T_i\gg T_e$ ($\sim$
 100 s of eV) for the precursor early in time and then equilibrated later in time and was roughly equal to $T_e$
 for the outflow measurements. However, we find that $T_i$
 has very large error bars and is generally not a reliable parameter to extract from these fits because it is extracted from the ion peak width, which may be influenced by other broadening mechanisms. Additionally, the ion temperature of the precursor is often overestimated due to the line broadening caused by the crossing ablation streams that do not necessarily interact and thermalize immediately (Swadling et al. Reference Swadling, Lebedev, Hall, Suzuki-Vidal, Burdiak, Pickworth, De Grouchy, Skidmore, Khoory and Suttle2016).
5. Discussion
5.1. Comparison of experimental measurements with PERSEUS MHD simulations
We now use the measurements in the previous section to estimate how the experimentally observed dimensionless scaling parameters compare with those from the PERSEUS simulation. The PERSEUS simulations in this study were 3-D, ${\sim }90$ micron resolution models in extended MHD, which includes additional Hall and electron inertia terms that remove the need for a false vacuum resistivity. A fully aluminium load geometry was simulated with shorter legs to reduce computational expense (see Hasson et al. Reference Hasson, Adams, Evans, Shapovalov, West-Abdallah, Young, Greenly, Hammer, Kusse and Seyler2020), and a replica of the 200 ns-rise COBRA pulse (figure 1) was fed through. In this work, we address the scaling arguments that do not require a magnetic field measurement, namely, Reynolds number ($Re$
 ), magnetic Reynolds number ($Re_M$
 ) and sonic Mach number ($M$
 ), since we did not have b-dot probes for this set of experiments. To compute these scaling parameters, we use the following formulae from § 1:

where $u$ is the speed of the plasma, $L\sim 1$
 mm is the characteristic length scale of the system, $\nu$
 is the kinematic viscosity and $c_s$
 is the sound speed. The formula used for kinematic viscosity is the approximation of the Braginskii formulation where the ions are weakly coupled from Robey (Reference Robey2004),

where $A$ is the atomic mass, $Z_{{\rm eff}}$
 is the effective charge of the ion, $T_i$
 is the ion temperature in eV, $\rho$
 is the mass density in g cm$^{-3}$
 and $ln(\varLambda )$
 is the Coulomb logarithm for electron–ion collisions, which can be found in the NRL Plasma Formulary (Huba Reference Huba2009), and is dependent on the electron temperature $T_e$
 and number density $n_e$
 . The effective charge was estimated by the PrismSPECT software program to be $Z_{{\rm eff}}\approx 3$
 for an Al plasma of $T_e\approx 50$
 eV and $n_e\sim 10^{19}$
 , based on PERSEUS simulations. For the magnetic Reynolds number, we take the resistivity of the plasma to be the Spitzer resistivity (in seconds), which can also be found in the NRL Plasma Formulary.
For the sound speed, we used the ion sound velocity

where $\gamma$ is the adiabatic index (taken to be 1.4 for monatomic gas), and $m_i$
 and $m_p$
 are the ion and proton mass, respectively. All quantities here are in cgs except for temperature, which is in eV.
We can now compute $Re$ , $Re_M$
 and $M$
 for the locations at which we obtained OTS measurements. Figure 7(a–c) shows experimentally tabulated parameters for the three regions characterized in figure 6. Uncertainties from OTS measurements were propagated to the dimensionless parameters in Python using the Asymmetric Uncertainties package by Gobat (Reference Gobat2022). Global estimates for the scaling parameters were extracted from 3-D PERSEUS simulations at timings comparable to those when OTS measurements were made. These simulated parameter estimates can be found in table 2.
(a) Calculated viscous Reynolds numbers, (b) magnetic Reynolds numbers and (c) sonic Mach numbers from OTS measurements.

Globally estimated scaling parameters from PERSEUS simulations.
We first note that the experimental $Re$ curves are within the conditions of turbulent flow where $Re>10^4$
 and thus in the desired regime. There is a broad spread of $Re$
 across the measurements though, spanning from $Re\sim 10^5\text { to }10^9$
 . This broad variation in the measured $Re$
 is due to the variation in kinematic viscosity $\nu$
 , which depends strongly on the temperature ($\nu \propto T^{5/2}$
 ). Since the ion temperature varies from $T_i\sim 5\text { to }300$
 eV across the jet at different times, we get a factor of roughly $(300/5)^{5/2}=3\times 10^4$
 variation in the kinematic viscosity and therefore the Reynolds number as well. The inverse proportionality of kinematic viscosity to mass density factors in as well, but varies by 1–2 magnitudes in the jet at most. Spatial variations of 1–2 orders of magnitude for $Re$
 were present in the PERSEUS simulations as well, which were due to the steep radial ion temperature gradient.
The magnetic Reynolds number data exhibit more significant differences from the simulation, where the simulation produces larger values due to the overprediction of electron temperature. This time, our experimental values are on the border of our required condition, that being $Re_M\gg 1$ . While the assembly phase is not necessarily advecting field lines in this example, the precursor and outflow are expected to weakly advect the field with values of up to $Re_M\approx 15$
 and $Re_M\approx 4$
 , respectively. We can characterize how important this lower $Re_M$
 is by estimating the diffusion time of the magnetic field through the plasma, $\tau _D=\mu _0 L^2/\eta _{Sp}$
 , where $L\sim 1$
 mm is again the characteristic scale of the $B$
 field in the jet and $\eta _{Sp}$
 is the Spitzer resistivity. We find $\tau _D\sim 1\,\mathrm {\mu } {\rm s}$
 , which is an order of magnitude greater than our current rise time of 100 ns. Thus, the magnetic field takes several experiment time scales to diffuse through the plasma and we can treat it as nearly frozen-in.
Finally, the Mach number in the simulation predicts $1< M<3$ in most of the regions outside the centre of the jet. The experiments matched these predictions relatively well for the points in the precursor and outflow, but the assembly stage exhibited highly supersonic flows with $M\approx 5$
 . This may be attributed to the fact that the temperature of the plasma, which is inversely proportional to the square of the Mach number, was quite low for the assembly phase. The radiative cooling in the experiment could be mitigated, raising the electron temperature, by using a lower-Z material for the wires, say carbon. This could also relieve the disagreement between simulation and experiment due to the simulation not including a radiative cooling package.
5.2. Conclusions
We conclude that our experiment created a diagnosable plasma with three distinct phases of evolution: the early precursor plasma with steep gradients in $v$ and $T_e$
 , in which a hot ($T_e\approx 80\,{\rm eV}$
 ), fast ($v\geq 100$
 km s$^{-1}$
 ) coronal wire plasma collides into a cool ($T_e\approx 10\,{\rm eV}$
 ) stagnant column on axis; the assembly period, in which the wires begin to disintegrate around the time of $I_{{\rm peak}}$
 and the current redirects into two vertical layers sandwiching a magnetic bubble which begins to push axially out from the wire array midplane; and finally matured bipolar outflows that carry current away from the load at high axial velocities ($v>40$
 km s$^{-1}$
 at $\approx 6.25\,{\rm mm}$
 above the wire array midplane).
We found that the generated plasma met the scaling conditions for Reynolds number and Mach number, with $Re\sim 10^5\unicode{x2013}10^9$ and $M\sim 1\unicode{x2013}10$
 . While the magnetic Reynolds number is only slightly above the set threshold for plasma advecting field lines with $Re_M\sim 0.5\unicode{x2013}15$
 , we may make an argument for relatively slow field diffusion ($t_D=\mu _0 L^2/\eta _{Sp}\sim 1\,\mathrm {\mu }$
 s) compared with the time scale of the experiment ($t_{{\rm rise}}\sim 100\,{\rm ns}$
 ). This means that, rather than assuming a perfect ‘frozen-in’ condition for the magnetic field lines in the plasma, we can assume that they diffuse out of the plasma in roughly 10 hydrodynamical time scales, which is slow enough that we could expect to observe effects of the field dragging and twisting in future studies. Additionally, we foresee that $Re_M$
 could be increased by using lower-Z wire material that radiatively cools less, as well as increasing the scale of the jet radius in the experiment. Qualitatively and quantitatively, our results resemble the physics of the PERSEUS simulation with the caveat of asymmetries and the effects of radiative cooling.
5.3. Ongoing work
The next phase of this work is to proceed with generating and characterizing rotating jets with and without $B_z$ by modifying the load return current path according to Hasson et al. (Reference Hasson, Adams, Evans, Shapovalov, West-Abdallah, Young, Greenly, Hammer, Kusse and Seyler2020), similar to the ideas originally proposed and simulated by Ryutov (Reference Ryutov2011) and Bocchi et al. (Reference Bocchi, Chittenden, Lebedev, Hall, Bennett, Frank and Blackman2013), respectively. These rotating plasmas will be measured with the same diagnostics as this study adding inductive b-dot probes to measure the axial field in the outflows so that the local $\beta$
 may also be characterized and compared with simulations. To characterize the angular momentum in each plasma, we will measure velocity components across the radius of the jet and obtain the rotation curve. We ultimately want to characterize the effect of the amount of $B_z$
 on the disk and jet's structures, and how it evolves throughout the experiment.
Acknowledgements
The authors would like to acknowledge the detailed contributions of the reviewers that improved this manuscript, as well as the kind staff of Cornell's Laboratory of Plasma Studies for all of their experimental wisdom.
Editor Luís O. Silva thanks the referees for their advice in evaluating this article.
Funding
This work was supported by the National Science Foundation (P.-A.G., grant numbers PHY-1725178 and PHY-1943939); and by the Department of Energy (P.-A.G., grant number DE-SC0020391).
Declaration of interests
The authors report no conflict of interest.
Data availability statement
The data that support the findings of this study are available from the corresponding author upon reasonable request.
Appendix A. Detailed load diagrams
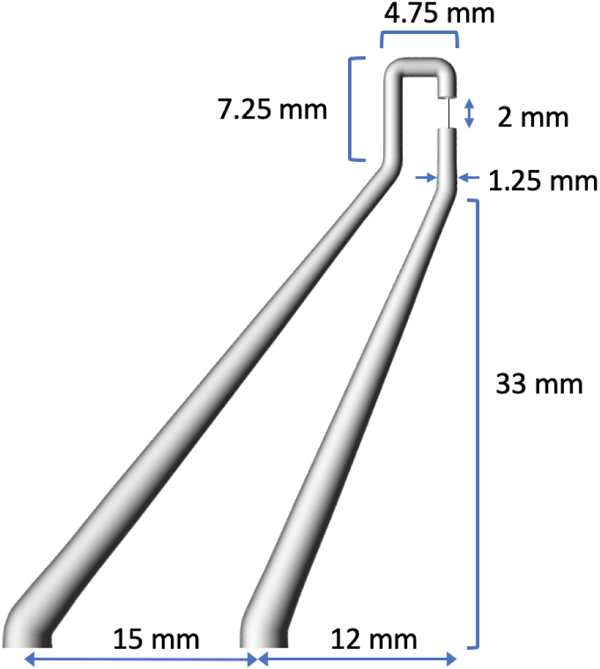
Figure 8 shows the current path through a single hook-leg unit of the load in which a single wire is mounted. Figure 9 shows the dimensions of a single hook-leg unit. This scaffolding structure was 3-D-printed in stainless steel 316L.
Current path for one of six identical hook-leg units that hold the wires in the array.

Dimensions for one of six identical hook-leg units that hold the wires in the array.
Appendix B. Asymmetry evolution in PERSEUS simulation
Figure 10 shows a load view split in half along the $z$ -axis to illustrate both $\log {n_e}$
 and $\lvert \boldsymbol {B} \rvert$
 over three frames at different times. We see that early in time, the flow and the $B$
 field interior to the wire array are relatively symmetric along $\boldsymbol {z}$
 , but as time passes, a vertical asymmetry grows due to the asymmetry of the current path in the load.
Evolution of $\log {n_e}$ and $\lvert \boldsymbol {B} \rvert$
 in three frames over 240 ns. All times are relative to peak current.


 Open access

