





1. Introduction
Phase transitions in atomic and colloidal systems arise from competition among contributions to the free energy. Purely entropic transitions have been predicted and observed in hard-particle systems by theory, experiments and simulations for nearly a century. In systems with shape anisotropy or size polydispersity, each distinct orientation or size provides an entropic drive that competes with the others, and this competition produces phase separation. For example, Onsager showed that shape anisotropy can generate configurational entropy that drives liquid-crystalline order in highly anisometric particles (Onsager Reference Onsager1949), a mechanism later framed by Frenkel as an exchange between orientational and translational entropy that underlies, e.g. the isotropic–nematic transition (Frenkel & Onsager Reference Frenkel and Onsager2000). Subsequent work mapped phase envelopes for atomic and colloidal systems and quantified how phase behaviour is reshaped by softness (Hoover, Gray & Johnson Reference Hoover, Gray and Johnson1971; Robbins, Kremer & Grest Reference Robbins, Kremer and Grest1988; Meijer & Frenkel Reference Meijer and Frenkel1991; Löwen et al. Reference Löwen, Palberg and Simon1993; Lowen & Szamel Reference Lowen and Szamel1993; Piazza, Bellini & Degiorgio Reference Piazza, Bellini and Degiorgio1993; Németh & Likos Reference Németh and Likos1995; Senff & Richtering Reference Senff and Richtering1999; Likos Reference Likos2001; Castelletto et al. Reference Castelletto, Caillet, Hamley and Yang2002; Archer Reference Archer2005; Laurati et al. Reference Laurati, Stellbrink, Lund, Willner, Richter and Zaccarelli2005; Likos Reference Likos2006; Mladek et al. Reference Mladek, Charbonneau and Frenkel2007a , Reference Mladek, Gottwaldy, Kahl, Neumann and Likosb ; Vlassopoulos & Cloitre Reference Vlassopoulos and Cloitre2014; Gupta et al. Reference Gupta, Camargo, Stellbrink, Allgaier, Radulescu, Lindner, Zaccarelli, Likos and Richter2015; Pelaez-Fernandez et al. Reference Pelaez-Fernandez, Souslov, Lyon, Goldbart and Fernandez-Nieves2015; Zakhari, Anderson & Hütter Reference Zakhari, Anderson and Hütter2017; Erigi, Dhumal & Tripathy Reference Erigi, Dhumal and Tripathy2023; Dhumal Reference Dhumal2026), shape anisotropy (Eppenga & Frenkel Reference Eppenga and Frenkel1984; Camp & Allen Reference Camp and Allen1997; Cuetos & Dijkstra Reference Cuetos and Dijkstra2007; Cinacchi & van Duijneveldt Reference Cinacchi and van Duijneveldt2010; Miller, Bozorgui & Cacciuto Reference Miller, Bozorgui and Cacciuto2010; Agarwal & Escobedo Reference Agarwal and Escobedo2011; Haji-Akbari, Engel & Glotzer Reference Haji-Akbari, Engel and Glotzer2011; Jiao & Torquato Reference Jiao and Torquato2011; Kallus & Elser Reference Kallus and Elser2011; Avendano & Escobedo Reference Avendano and Escobedo2012; Marechal, Zimmermann & Löwen Reference Marechal, Zimmermann and Löwen2012; Peroukidis & Vanakaras Reference Peroukidis and Vanakaras2013; Dijkstra Reference Dijkstra2014; Boles, Engel & Talapin Reference Boles, Engel and Talapin2016; Karas et al. Reference Karas, Dshemuchadse, van Anders and Glotzer2019; Lim, Lee & Glotzer Reference Lim, Lee and Glotzer2023) and size polydispersity (through fractionation and polycrystallinity) (Kranendonk & Frenkel Reference Kranendonk and Frenkel1991; Bartlett, Ottewill & Pusey Reference Bartlett, Ottewill and Pusey1992; Eldridge, Madden & Frenkel Reference Eldridge, Madden and Frenkel1993; Han & Herzfeld Reference Han and Herzfeld1994; Dijkstra et al. Reference Dijkstra, van Roij and Evans1998, Reference Dijkstra, van Roij and Evans1999; Bartlett & Warren Reference Bartlett and Warren1999; Fasolo & Sollich Reference Fasolo and Sollich2003; Zubarev & Iskakova Reference Zubarev and Iskakova2005; Zaccarelli et al. Reference Zaccarelli, Valeriani, Sanz, Poon, Cates and Pusey2009; Wilding & Sollich Reference Wilding and Sollich2010; Filion et al. Reference Filion, Hermes, Ni, Vermolen, Kuijk, Christova, Stiefelhagen, Vissers, Van Blaaderen and Dijkstra2011a ; Hopkins et al. Reference Hopkins, Jiao, Stillinger and Torquato2011; Dijkstra Reference Dijkstra2014; Boles et al. Reference Boles, Engel and Talapin2016; Koshoji et al. Reference Koshoji, Kawamura, Fukuda and Ozaki2021; Koshoji & Ozaki Reference Koshoji and Ozaki2021). However, size polydispersity is known to hinder crystal nucleation and slow phase separation by introducing additional kinetic bottlenecks (Henderson et al. Reference Henderson, Mortensen, Underwood and van Megen1996; Schöpe et al. Reference Schöpe, Bryant and van Megen2007; Pusey et al. Reference Pusey, Zaccarelli, Valeriani, Sanz, Poon and Cates2009a ; Castagnède et al. Reference Castagnède, Filion and Smallenburg2025). At the same time, from a thermodynamic perspective, each particle size acts as a distinct species with its own entropy contribution; this multi-species entropy drives fractionation and can lead to polycrystals and multiple coexisting solids (Mansoori et al. Reference Mansoori, Carnahan, Starling and Leland1971; Bartlett, Ottewill & Pusey Reference Bartlett, Ottewill and Pusey1990; Bartlett Reference Bartlett1998; Phan et al. Reference Phan, Russel, Zhu and Chaikin1998; Sollich & Cates Reference Sollich and Cates1998; Warren Reference Warren1998; Bartlett & Warren Reference Bartlett and Warren1999; Kofke & Bolhuis Reference Kofke and Bolhuis1999; Bartlett Reference Bartlett2000; Fasolo & Sollich Reference Fasolo and Sollich2003, Reference Fasolo and Sollich2004; Pusey et al. Reference Pusey, Zaccarelli, Valeriani, Sanz, Poon and Cates2009b ; Zaccarelli et al. Reference Zaccarelli, Valeriani, Sanz, Poon, Cates and Pusey2009; Wilding & Sollich Reference Wilding and Sollich2010; Sollich & Wilding Reference Sollich and Wilding2011; Bommineni et al. Reference Bommineni, Varela-Rosales, Klement and Engel2019, Reference Bommineni, Klement and Engel2020). Two recent reviews summarise this landscape across theory, experiment and simulation (Royall et al. Reference Royall, Charbonneau, Dijkstra, Russo, Smallenburg, Speck and Valeriani2024; Wang et al. Reference Wang, Dhumal, Zakhari and Zia2026). Across these studies, two hallmarks of first-order transitions consistently appear: phase transition between pure states and phase separation into coexisting domains.
Systems of monodisperse, purely repulsive hard spheres (MPRHS) also undergo fluid–crystal transitions. While the distinct contributors to phase transition are less obvious (only a single size of isotropic particles), prediction of MPRHS phase behaviour in colloids dates back to predictions for atomic systems from Kirkwood and Monroe, who predicted the melting point of atomic hard spheres in 1941 (Kirkwood & Monroe Reference Kirkwood and Monroe1941); Alder and Wainwright’s simulations (1957–1960), traced the fluid and solid lines (Alder et al. Reference Alder1957; Alder & Wainwright Reference Alder and Wainwright1959, Reference Alder and Wainwright1960), establishing the transition. Hoover and Ree later confirmed these lines and, using thermodynamic arguments, deduced the coexistence tie line and the freezing/melting volume fractions $\phi _F=0.494$
and
$\phi _F=0.494$
and $\phi _M=0.545$
that are standard in the hard-sphere literature (Hoover & Ree Reference Hoover and Ree1968). Experiments, which necessarily approximate but cannot realise perfectly hard interactions, reproduced the full phase diagram in colloidal dispersions – most notably Pusey and van Megen’s seminal study showing fluid, crystal and explicit coexistence obeying a lever rule (Pusey & van Megen Reference Pusey and van Megen1986) and the X-ray stratification measurements of Russel and co-workers (Phan et al. Reference Phan, Russel, Cheng, Zhu, Chaikin, Dunsmuir and Ottewill1996). Thus, entropically driven first-order transitions in MPRHS are thoroughly established: distinct phases, phase envelopes and
$\phi _M=0.545$
that are standard in the hard-sphere literature (Hoover & Ree Reference Hoover and Ree1968). Experiments, which necessarily approximate but cannot realise perfectly hard interactions, reproduced the full phase diagram in colloidal dispersions – most notably Pusey and van Megen’s seminal study showing fluid, crystal and explicit coexistence obeying a lever rule (Pusey & van Megen Reference Pusey and van Megen1986) and the X-ray stratification measurements of Russel and co-workers (Phan et al. Reference Phan, Russel, Cheng, Zhu, Chaikin, Dunsmuir and Ottewill1996). Thus, entropically driven first-order transitions in MPRHS are thoroughly established: distinct phases, phase envelopes and $\phi _F$
and
$\phi _F$
and $\phi _M$
from theory, simulation and experiment. Our recent Perspective article traces this 80-year arc of discovery and inquiry into hard-sphere phase behaviour across the literature in depth (Wang et al. Reference Wang, Dhumal, Zakhari and Zia2026). For a brief snapshot of that history, see Appendix A in the present paper.
$\phi _M$
from theory, simulation and experiment. Our recent Perspective article traces this 80-year arc of discovery and inquiry into hard-sphere phase behaviour across the literature in depth (Wang et al. Reference Wang, Dhumal, Zakhari and Zia2026). For a brief snapshot of that history, see Appendix A in the present paper.
Although the fluid–solid transition in MPRHS is long established by theory, its purely entropic origin was initially controversial, as it appeared to imply that the more ordered crystal must somehow possess higher entropy than the fluid (Uhlenbeck Reference Uhlenbeck1963; Ackerson Reference Ackerson1993; Frenkel Reference Frenkel1993). Classical liquid-state approaches effectively bypass having to make this microscopic competition explicit. These methods typically compute separate equations of state for the homogeneous fluid and crystal branches using virial expansions and related frameworks (Thiele Reference Thiele1963; Wertheim Reference Wertheim1963; McQuarrie Reference McQuarrie1975; Ree & Hoover Reference Ree and Hoover1964, Reference Ree and Hoover1967; Carnahan & Starling Reference Carnahan and Starling1969; Hall Reference Hall1972; Clisby & McCoy Reference Clisby and McCoy2006; Schultz & Kofke Reference Schultz and Kofke2014), and then determine the coexistence point by enforcing equality of pressure and chemical potential between the two phases (Frenkel & Ladd Reference Frenkel and Ladd1984; Frenkel & Smit Reference Frenkel and Smit2002; Vega & Noya Reference Vega and Noya2007; Odriozola Reference Odriozola2009; Bannerman, Lue & Woodcock Reference Bannerman, Lue and Woodcock2010; Nayhouse, Amlani & Orkoulas Reference Nayhouse, Amlani and Orkoulas2011; Fernández et al. Reference Fernández, Martin-Mayor, Seoane and Verrocchio2012; Statt et al. Reference Statt, Schmitz, Virnau and Binder2016; Ustinov Reference Ustinov2017; Pieprzyk et al. Reference Pieprzyk, Bannerman, Brańka, Chudak and Heyes2019; Moir, Lue & Bannerman Reference Moir, Lue and Bannerman2021). Because these virial and free-energy methods treat the fluid and crystal separately and assume analyticity within each phase, the first-order transition emerges from free-energy matching across phases rather than from a direct accounting of which microscopic entropic contributions are increasing or decreasing.
Other simulation studies take a different approach to determining coexistence, without relying on separate equations of state for the two phases. For example, Kegel, Reiss & Lekkerkerker (Reference Kegel, Reiss and Lekkerkerker1999) introduced a grand-distribution framework based on available volume and used it to demonstrate a first-order freezing transition in hard spheres using Monte Carlo simulations of small systems (up to 27 particles). Although explicit coexistence could not be resolved due to system size, this method offered an early and rigorous alternative to traditional thermodynamic constructions. Similarly, Wilding & Bruce (Reference Wilding and Bruce2000) developed a phase-switch, extended-ensemble Monte Carlo method in which both fluid and crystalline phases are sampled within a single simulation. The coexistence condition is inferred from the relative statistical weights of the two phases – identified via equal peak heights in the free energy – without separately computing pressure or chemical potential.
Nonetheless, while these methods provide thermodynamically rigorous determinations of the transition and coexistence conditions, they do not by themselves make the microscopic redistribution of entropy – specifically, the exchange between long-range configurational and short-range vibrational entropy – explicit within the simulation. Our study complements these efforts by directly accessing this entropy-exchange mechanism through dynamically evolved, nearly hard-sphere systems.
In systems with attractions, polydispersity or anisotropy, one can often appeal to additional energetic or entropic terms, but in pristine MPRHS the only driver is entropy, and because there is only a single size and no anisotropy, the underlying `mechanistic competition’ is obscured. Frenkel proposed to make this explicit by viewing the transition as an exchange in which a loss of long-range configurational entropy is compensated by a gain in short-range vibrational entropy (Frenkel Reference Frenkel1993). Making that configurational–vibrational entropy exchange operational is essential for building simulation models that do not just reproduce the hard-sphere phase diagram, but also interrogate how MPRHS actually undergo phase separation in practice (Wang et al. Reference Wang, Dhumal, Zakhari and Zia2026).
However, decades of simulations that nominally match the atomic MPRHS model still do not report spontaneously formed, long-lived fluid–crystal coexistence starting from an unbiased homogeneous state; explicit coexistence appears only when one introduces either algorithmic drivers or crystal-nucleating triggers (Filion et al. Reference Filion, Hermes, Ni and Dijkstra2010, Reference Filion, Ni, Frenkel and Dijkstra2011b ; Isobe & Krauth Reference Isobe and Krauth2015; Wang et al. Reference Wang, Dhumal, Zakhari and Zia2026). To be clear, the first-order transition between fluid and crystal in MPRHS is firmly established by liquid-state theory, free-energy calculations, simulations and experiments, and we take the hard-sphere equation of state and coexistence window as given (Hoover & Ree Reference Hoover and Ree1968; Carnahan & Starling Reference Carnahan and Starling1969; Hall Reference Hall1972; McQuarrie Reference McQuarrie1975; Pusey & van Megen Reference Pusey and van Megen1986; Phan et al. Reference Phan, Russel, Cheng, Zhu, Chaikin, Dunsmuir and Ottewill1996; Kolafa, Labík & Malijevskỳ ; Pieprzyk et al. Reference Pieprzyk, Bannerman, Brańka, Chudak and Heyes2019).
Our aim is not to revisit or qualify that thermodynamic result. The issue is kinetic: in pristine MPRHS simulations (perfectly hard, strictly monodisperse spheres with no templates, walls, gravity or softness) the equilibrium coexistence state is dynamically inaccessible on practical time scales. In brief, nucleation is well known to be slow on simulation time scales, which makes spontaneous realisation of fluid–crystal coexistence challenging in finite systems. For state points within the coexistence interval, $0.494 \le \phi \le 0.545$
, the homogeneous fluid is metastable: leaving this branch requires a rare fluctuation that generates a supercritical crystal nucleus, after which growth proceeds at the expense of the surrounding metastable phase, as described by classical nucleation theory (CNT). In principle, this nucleation-and-growth pathway is precisely how a system enters a fluid–crystal coexistence state. In a finite
$0.494 \le \phi \le 0.545$
, the homogeneous fluid is metastable: leaving this branch requires a rare fluctuation that generates a supercritical crystal nucleus, after which growth proceeds at the expense of the surrounding metastable phase, as described by classical nucleation theory (CNT). In principle, this nucleation-and-growth pathway is precisely how a system enters a fluid–crystal coexistence state. In a finite $NVT$
system (canonical ensemble with fixed particle number
$NVT$
system (canonical ensemble with fixed particle number $N$
, volume
$N$
, volume $V$
, and temperature
$V$
, and temperature $T$
), however, this same pathway complicates the interpretation of simulation outcomes: for
$T$
), however, this same pathway complicates the interpretation of simulation outcomes: for $\phi$
inside the coexistence window – particularly toward its high-density side (e.g.
$\phi$
inside the coexistence window – particularly toward its high-density side (e.g. $\phi \gtrsim 0.53$
) – a supercritical nucleus formed in a metastable fluid can continue to grow until the crystalline domain spans the simulation cell, a finite-size outcome that reflects the bounded extent of the
$\phi \gtrsim 0.53$
) – a supercritical nucleus formed in a metastable fluid can continue to grow until the crystalline domain spans the simulation cell, a finite-size outcome that reflects the bounded extent of the $NVT$
simulation box, producing an apparently fully crystalline endpoint even though a lever-rule mixture is thermodynamically permitted. Achieving a macroscopic lever-rule coexistence morphology in a periodic cell would instead require an additional, rare ‘reverse’ event that creates a macroscopic fluid domain and concomitant interfaces, which is exponentially unlikely on accessible simulation time scales. Accordingly, the appearance of a box-spanning crystal at coexistence is not, by itself, diagnostic of a dynamically realised two-phase state. By contrast, simulations performed above the coexistence interval (e.g.
$NVT$
simulation box, producing an apparently fully crystalline endpoint even though a lever-rule mixture is thermodynamically permitted. Achieving a macroscopic lever-rule coexistence morphology in a periodic cell would instead require an additional, rare ‘reverse’ event that creates a macroscopic fluid domain and concomitant interfaces, which is exponentially unlikely on accessible simulation time scales. Accordingly, the appearance of a box-spanning crystal at coexistence is not, by itself, diagnostic of a dynamically realised two-phase state. By contrast, simulations performed above the coexistence interval (e.g. $\phi \gtrsim \phi _M \approx 0.545$
) are expected to crystallise completely on thermodynamic grounds and therefore do not directly test the existence of fluid–crystal coexistence. As a result, unbiased event-driven molecular dynamics (EDMD) or Brownian dynamics simulations prepared in the coexistence density interval typically remain as long-lived homogeneous fluid or homogeneous crystal, or else crystallise completely after a nucleation event as the growing domain spans the finite simulation cell (Filion et al. Reference Filion, Hermes, Ni and Dijkstra2010, Reference Filion, Ni, Frenkel and Dijkstra2011b
; Pieprzyk et al. Reference Pieprzyk, Bannerman, Brańka, Chudak and Heyes2019; Fiorucci et al. Reference Fiorucci, Coli, Padding and Dijkstra2020; Wöhler & Schilling Reference Wöhler and Schilling2022). Here, and throughout, we use ‘biased’ to refer to the use of physical triggers (e.g. seeds, walls, slabs) or rare-event bias imposed in simulation. There are also methods that are thermodynamically unbiased in the sense that they converge to correct equilibrium ensembles but they do so via algorithmically driven equilibration. We elaborate further below on what we mean by biased versus unbiased simulations and algorithmic acceleration, and we return to why phase separation is nevertheless reported in many simulation studies under biased protocols.
$\phi \gtrsim \phi _M \approx 0.545$
) are expected to crystallise completely on thermodynamic grounds and therefore do not directly test the existence of fluid–crystal coexistence. As a result, unbiased event-driven molecular dynamics (EDMD) or Brownian dynamics simulations prepared in the coexistence density interval typically remain as long-lived homogeneous fluid or homogeneous crystal, or else crystallise completely after a nucleation event as the growing domain spans the finite simulation cell (Filion et al. Reference Filion, Hermes, Ni and Dijkstra2010, Reference Filion, Ni, Frenkel and Dijkstra2011b
; Pieprzyk et al. Reference Pieprzyk, Bannerman, Brańka, Chudak and Heyes2019; Fiorucci et al. Reference Fiorucci, Coli, Padding and Dijkstra2020; Wöhler & Schilling Reference Wöhler and Schilling2022). Here, and throughout, we use ‘biased’ to refer to the use of physical triggers (e.g. seeds, walls, slabs) or rare-event bias imposed in simulation. There are also methods that are thermodynamically unbiased in the sense that they converge to correct equilibrium ensembles but they do so via algorithmically driven equilibration. We elaborate further below on what we mean by biased versus unbiased simulations and algorithmic acceleration, and we return to why phase separation is nevertheless reported in many simulation studies under biased protocols.
A useful way to quantify why pristine simulations do not readily phase separate is via CNT and the scaling of the mean waiting time for the first supercritical nucleus. The barrier to nucleating a crystal from an equilibrium fluid grows without bound at the freezing point as the coexistence region is approached and, likewise, the barrier to nucleating a fluid packet from an equilibrium crystal grows without bound at the melting point as the coexistence region is approached. As we noted in our recent Perspective article (Wang et al. Reference Wang, Dhumal, Zakhari and Zia2026), ten Wolde et al. ‘showed for a Lennard–Jones fluid that the mean waiting time for the first supercritical crystal nucleus in a finite system of volume $V$
is
$V$
is $t_{wait}\sim 1/(J V)$
, where
$t_{wait}\sim 1/(J V)$
, where $J$
is the crystal-nucleation rate per unit volume. As one approaches fluid–solid coexistence, the supersaturation
$J$
is the crystal-nucleation rate per unit volume. As one approaches fluid–solid coexistence, the supersaturation $\Delta \mu$
decreases and the nucleation barrier grows roughly as
$\Delta \mu$
decreases and the nucleation barrier grows roughly as $\Delta G^*\propto 1/ \Delta \mu ^2$
so that
$\Delta G^*\propto 1/ \Delta \mu ^2$
so that $J\,\sim \,J_0 \exp (-\Delta G^*/kT)$
falls off extremely rapidly. ten Wolde et al. further emphasised that, for typical experimental supersaturations, this framework yields nucleation times consistent with observed crystallisation, but that pushing closer to coexistence drives
$J\,\sim \,J_0 \exp (-\Delta G^*/kT)$
falls off extremely rapidly. ten Wolde et al. further emphasised that, for typical experimental supersaturations, this framework yields nucleation times consistent with observed crystallisation, but that pushing closer to coexistence drives $t_{wait}$
to astronomically long values even for macroscopic samples’ (Ten Wolde et al. Reference Ten Wolde, Ruiz-Montero and Frenkel1996; Wang et al. Reference Wang, Dhumal, Zakhari and Zia2026). Here,
$t_{wait}$
to astronomically long values even for macroscopic samples’ (Ten Wolde et al. Reference Ten Wolde, Ruiz-Montero and Frenkel1996; Wang et al. Reference Wang, Dhumal, Zakhari and Zia2026). Here, $k$
is Boltzmann’s constant and
$k$
is Boltzmann’s constant and $T$
is the absolute temperature. Combining this scaling with hard-sphere absolute-rate calculations implies astronomically long waiting times near coexistence even for
$T$
is the absolute temperature. Combining this scaling with hard-sphere absolute-rate calculations implies astronomically long waiting times near coexistence even for $N\sim 10^6$
particles (Ten Wolde et al. Reference Ten Wolde, Ruiz-Montero and Frenkel1996; Auer & Frenkel Reference Auer and Frenkel2001a
).
$N\sim 10^6$
particles (Ten Wolde et al. Reference Ten Wolde, Ruiz-Montero and Frenkel1996; Auer & Frenkel Reference Auer and Frenkel2001a
).
We emphasise that this kinetic argument is fully consistent with the fact that nucleation and phase separation are nevertheless observed in both simulations and experiments. In simulations, nucleation is commonly observed but only because many studies either operate at state points sufficiently above coexistence (where supersaturation is large and barriers are modest), or they intentionally flatten the barrier by introducing strong physical triggers (e.g. direct-coexistence geometries, large crystal platforms/seeds, walls or other constraints), and/or they use algorithmic drivers that accelerate exploration of configuration space (e.g. rare-event methods, biased sampling or advanced Monte Carlo equilibration schemes). In experiments, fluid–crystal phase separation is routinely observed because `hard-sphere’ colloids necessarily deviate from pristine MPRHS conditions – through walls and boundaries, gravity, slight softness and residual charge, among other non-idealities – which can substantially lower kinetic bottlenecks relative to the idealised monodisperse, purely repulsive model. We next summarise the principal classes of crystal triggers and the algorithmic acceleration strategies by which simulations nevertheless access fluid–crystal coexistence.
In addition to Brownian dynamics and EDMD, Monte Carlo algorithms have been used to explore truly MPRHS phase behaviour, done elegantly by Isobe & Krauth (Reference Isobe and Krauth2015), where coexistence is indeed realised – but with important caveats. They compare event-chain Monte Carlo (ECMC) with local Monte Carlo (LMC) and EDMD, showing that ECMC very efficiently reproduces the hard-sphere equation of state and coexistence region, and that mixed fluid–crystal morphologies can be obtained within the coexistence window. Isobe and Krauth thus meet their intended goal: they convincingly demonstrate that different algorithms produce consistent equilibrium properties and that ECMC can map the hard-sphere equation of state and coexistence region with high efficiency. That study is therefore an important thermodynamic benchmark rather than a resolution of the kinetic issue we address. Indeed, the authors explicitly note that simulation in the coexistence region remains difficult even with ECMC. To wit, coexistence states are always reached by using equilibrium-sampling Monte Carlo schemes (LMC/ECMC), whose moves are explicitly designed to accelerate equilibration and, at parts of the coexistence region, by also starting from crystal-rich initial configurations. Their observed behaviour is entirely consistent with algorithmically driven equilibration: these schemes are constructed to reach the correct equilibrium mixture if one waits long enough, but they do so via non-physical moves whose effective nucleation rates are set by the algorithm, not by the underlying colloidal dynamics. In this sense, the emergence of coexistence in their simulations always reflects algorithmically driven equilibration toward the known equilibrium mixture, rather than the spontaneous colloidal dynamics under Brownian or Newtonian equations of motion. This behaviour is consistent with the view that the coexistence state is thermodynamically well defined but extremely difficult to realise dynamically in pristine MPRHS with physically motivated dynamics on accessible time scales.
Against this backdrop, it is useful to distinguish two broad ways in which simulations do achieve fluid–crystal coexistence – but again, not spontaneously. One route uses equilibrium-sampling algorithms such as Metropolis Monte Carlo, ECMC and related enhanced-sampling schemes (Frenkel & Ladd Reference Frenkel and Ladd1984; Vega & Noya Reference Vega and Noya2007; Odriozola Reference Odriozola2009; Fernández et al. Reference Fernández, Martin-Mayor, Seoane and Verrocchio2012; Isobe & Krauth Reference Isobe and Krauth2015; Statt et al. Reference Statt, Schmitz, Virnau and Binder2016; Ustinov Reference Ustinov2017). These methods are thermodynamically unbiased in the sense that they converge to the correct hard-sphere equilibrium ensemble, but they do so via algorithmically driven equilibration: moves that do not aim to reproduce Brownian or Newtonian trajectories are deliberately constructed to accelerate exploration of configuration space and the approach to equilibrium. As a result, any finite nucleation barrier will eventually be overcome, and the apparent `nucleation rate’ is controlled by the move set, not by colloidal kinetics. A second route uses strong physical or geometric triggers – such as crystalline seeds, pre-constructed slabs (‘direct coexistence’), walls, gravity, appreciable softness or size polydispersity – which lower or bypass the metastable barrier and reliably generate coexisting domains (Pusey & van Megen Reference Pusey and van Megen1986; Phan et al. Reference Phan, Russel, Cheng, Zhu, Chaikin, Dunsmuir and Ottewill1996; Rutgers et al. Reference Rutgers, Dunsmuir, Xue, Russel and Chaikin1996; Auer & Frenkel Reference Auer and Frenkel2001a , Reference Auer and Frenkelb ; Hernández-Guzmán & Weeks Reference Hernández-Guzmán and Weeks2009; Hermes et al. Reference Hermes, Vermolen, Leunissen, Vossen, Van Oostrum, Dijkstra and Van Blaaderen2011; Espinosa et al. Reference Espinosa, Sanz, Valeriani and Vega2013, Reference Espinosa, Vega and Sanz2014; Royall, Poon & Weeks Reference Royall, Poon and Weeks2013; Espinosa et al. Reference Espinosa, Vega, Valeriani and Sanz2016; Tateno et al. Reference Tateno, Yanagishima, Russo and Tanaka2019; Montero de Hijes et al. Reference Montero de Hijes, Espinosa, Bianco, Sanz and Vega2020a , Reference Montero de Hijes, Shi, Noya, Santiso, Gubbins, Sanz and Vegab ; Gispen & Dijkstra Reference Gispen and Dijkstra2024). In this work, we take the hard-sphere phase diagram as settled, and focus instead on the kinetic bottleneck: we introduce deliberately minimal, quantitatively small perturbations – very slight deviations from perfect hardness and extremely weak, distributed crystalline seeds – while preparing the system in the coexistence region. These controlled deviations are chosen to leave the hard-sphere thermodynamics essentially unchanged, but to be just strong enough to break metastability on finite time scales, thereby rendering the phase-separation pathway observable. Our study is therefore aimed squarely at this kinetic question: starting from homogeneous, nearly MPRHS fluids evolved with Brownian dynamics, we ask what minimal, physically motivated perturbations to local vibrational entropy (finite softness) and, using very weak distributed seeding, are required to make the coexistence state actually appear and to expose Frenkel’s configurational–vibrational entropy-exchange mechanism in a system that is otherwise as close as possible to the ideal hard-sphere limit.
Frenkel’s mechanism also sets expectations for `pristine’ simulations – perfectly hard, strictly monodisperse, repulsive spheres with system size governed by the law of large numbers (LLN). In finite systems, unbiased simulations primarily report nucleation for $\phi \gt 0.53$
and, crucially, no reports of equilibrium coexistence (Filion et al. Reference Filion, Hermes, Ni and Dijkstra2010; Wöhler & Schilling Reference Wöhler and Schilling2022). Even large, long simulations of truly hard spheres do not report explicit phase separation (Pieprzyk et al. Reference Pieprzyk, Bannerman, Brańka, Chudak and Heyes2019). Experimental estimates imply that, for
$\phi \gt 0.53$
and, crucially, no reports of equilibrium coexistence (Filion et al. Reference Filion, Hermes, Ni and Dijkstra2010; Wöhler & Schilling Reference Wöhler and Schilling2022). Even large, long simulations of truly hard spheres do not report explicit phase separation (Pieprzyk et al. Reference Pieprzyk, Bannerman, Brańka, Chudak and Heyes2019). Experimental estimates imply that, for $\mathcal{O}(10^6)$
particles, generating spontaneous, durable phase separation, would take
$\mathcal{O}(10^6)$
particles, generating spontaneous, durable phase separation, would take $\sim 3.17\times 10^8$
years (Ten Wolde et al. Reference Ten Wolde, Ruiz-Montero and Frenkel1996), i.e. effectively unreachable in simulation.
$\sim 3.17\times 10^8$
years (Ten Wolde et al. Reference Ten Wolde, Ruiz-Montero and Frenkel1996), i.e. effectively unreachable in simulation.
To traverse the tie line in finite time with minimal perturbation, we simulate the weakest practicable departure from metastability in a very large MPRHS system. We enforce a purely entropic competition (no attractions, no gravity) and preserve the long-range/short-range entropy exchange by strictly imposing a single particle size. We approach the LLN by using $N=2{\,}000{\,}000$
spheres. To gently perturb metastability – while connecting to prior work – we introduce widely distributed crystal seeds totalling 0.5 %–4 % crystalline fraction. Our perturbations do not aim to change the equilibrium phase behaviour; they are used to slightly destabilise the long-lived metastable fluid or crystal, so that phase separation can actually occur on finite simulation time scales. This ‘weak triggering’ allows us to observe and quantify how Frenkel’s entropy-exchange mechanism operates in a system that otherwise behaves as an MPRHS fluid. By contrast, strong triggers (Ladd & Woodcock Reference Ladd and Woodcock1977; Davidchack & Laird Reference Davidchack and Laird1998; Auer & Frenkel Reference Auer and Frenkel2001a
,
Reference Auer and Frenkelb
, Reference Auer and Frenkel2004; Noya et al. Reference Noya, Vega and de Miguel2008; Filion et al. Reference Filion, Hermes, Ni and Dijkstra2010, Reference Filion, Ni, Frenkel and Dijkstra2011b
; Zykova-Timan, Horbach & Binder Reference Zykova-Timan, Horbach and Binder2010; Hermes et al. Reference Hermes, Vermolen, Leunissen, Vossen, Van Oostrum, Dijkstra and Van Blaaderen2011; Espinosa et al. Reference Espinosa, Sanz, Valeriani and Vega2013; Espinosa et al. Reference Espinosa, Vega, Valeriani and Sanz2016; Tateno et al. Reference Tateno, Yanagishima, Russo and Tanaka2019; Fiorucci et al. Reference Fiorucci, Coli, Padding and Dijkstra2020; Montero de Hijes et al. Reference Montero de Hijes, Espinosa, Bianco, Sanz and Vega2020a
,
Reference Montero de Hijes, Shi, Noya, Santiso, Gubbins, Sanz and Vegab
; Sanchez-Burgos et al. Reference Sanchez-Burgos, Sanz, Vega and Espinosa2021; Gispen & Dijkstra Reference Gispen and Dijkstra2024) – such as direct-coexistence protocols (Ladd & Woodcock Reference Ladd and Woodcock1977; Davidchack & Laird Reference Davidchack and Laird1998; Noya et al. Reference Noya, Vega and de Miguel2008; Zykova-Timan et al. Reference Zykova-Timan, Horbach and Binder2010; Espinosa et al. Reference Espinosa, Sanz, Valeriani and Vega2013; Tateno et al. Reference Tateno, Yanagishima, Russo and Tanaka2019; Sanchez-Burgos et al. Reference Sanchez-Burgos, Sanz, Vega and Espinosa2021) that insert a large crystal slab into the fluid, effectively placing the system right at the coexistence line – bypass this mechanism entirely: they are valuable for other questions but cannot interrogate the sought-after entropy-exchange mechanism. By distributing many tiny crystallites throughout the volume, we better mimic the natural competition between local mobility and long-range entropy driven by Brownian motion.
$N=2{\,}000{\,}000$
spheres. To gently perturb metastability – while connecting to prior work – we introduce widely distributed crystal seeds totalling 0.5 %–4 % crystalline fraction. Our perturbations do not aim to change the equilibrium phase behaviour; they are used to slightly destabilise the long-lived metastable fluid or crystal, so that phase separation can actually occur on finite simulation time scales. This ‘weak triggering’ allows us to observe and quantify how Frenkel’s entropy-exchange mechanism operates in a system that otherwise behaves as an MPRHS fluid. By contrast, strong triggers (Ladd & Woodcock Reference Ladd and Woodcock1977; Davidchack & Laird Reference Davidchack and Laird1998; Auer & Frenkel Reference Auer and Frenkel2001a
,
Reference Auer and Frenkelb
, Reference Auer and Frenkel2004; Noya et al. Reference Noya, Vega and de Miguel2008; Filion et al. Reference Filion, Hermes, Ni and Dijkstra2010, Reference Filion, Ni, Frenkel and Dijkstra2011b
; Zykova-Timan, Horbach & Binder Reference Zykova-Timan, Horbach and Binder2010; Hermes et al. Reference Hermes, Vermolen, Leunissen, Vossen, Van Oostrum, Dijkstra and Van Blaaderen2011; Espinosa et al. Reference Espinosa, Sanz, Valeriani and Vega2013; Espinosa et al. Reference Espinosa, Vega, Valeriani and Sanz2016; Tateno et al. Reference Tateno, Yanagishima, Russo and Tanaka2019; Fiorucci et al. Reference Fiorucci, Coli, Padding and Dijkstra2020; Montero de Hijes et al. Reference Montero de Hijes, Espinosa, Bianco, Sanz and Vega2020a
,
Reference Montero de Hijes, Shi, Noya, Santiso, Gubbins, Sanz and Vegab
; Sanchez-Burgos et al. Reference Sanchez-Burgos, Sanz, Vega and Espinosa2021; Gispen & Dijkstra Reference Gispen and Dijkstra2024) – such as direct-coexistence protocols (Ladd & Woodcock Reference Ladd and Woodcock1977; Davidchack & Laird Reference Davidchack and Laird1998; Noya et al. Reference Noya, Vega and de Miguel2008; Zykova-Timan et al. Reference Zykova-Timan, Horbach and Binder2010; Espinosa et al. Reference Espinosa, Sanz, Valeriani and Vega2013; Tateno et al. Reference Tateno, Yanagishima, Russo and Tanaka2019; Sanchez-Burgos et al. Reference Sanchez-Burgos, Sanz, Vega and Espinosa2021) that insert a large crystal slab into the fluid, effectively placing the system right at the coexistence line – bypass this mechanism entirely: they are valuable for other questions but cannot interrogate the sought-after entropy-exchange mechanism. By distributing many tiny crystallites throughout the volume, we better mimic the natural competition between local mobility and long-range entropy driven by Brownian motion.
This controlled, weak perturbation provides a finite-time route along the coexistence tie line. It also enables us to examine a second, more fundamental factor: particle hardness. The intellectual merit of the work is that, by controlling and minimising these perturbations, we can interrogate Frenkel’s proposed entropy-exchange mechanism in the idealised MPRHS limit. Our focus is dynamic and mechanistic: how phase separation proceeds once metastability is very gently broken, not whether the thermodynamic transition exists.
As a final remark before proceeding, although the hard-sphere model was developed historically in the atomic/liquid-state setting and is often simulated with ballistic event-driven dynamics, in this work we deliberately adopt a colloidal realisation: nearly hard spheres suspended in a solvent and evolved under overdamped Brownian dynamics. This choice is intentional because the open question motivating the present study is posed most sharply in the colloids literature, where hard-sphere(-like) suspensions serve as a foundational reference for complex fluids and where one would like a mechanistically transparent demonstration of how fluid–crystal coexistence can be realised, and how Frenkel’s entropy-exchange picture becomes operational, under physically motivated suspension dynamics. At the same time, our goal is explicitly connective rather than colloids field specific: our Perspective traced the historical arc linking atomic hard-sphere theory to colloidal hard-sphere experiments and emphasised that the present kinetic difficulty is another important connection between the two communities – a shared metastability problem that persists under different physical dynamics (ballistic versus overdamped). In that spirit, there is no fundamental barrier to applying the same interaction model and the same controlled `hardness’ perturbation strategy under ballistic dynamics. Indeed, recent large-scale event-driven simulations of ballistic hard spheres were also unable to report explicit spontaneous phase separation in a pristine, finite system near coexistence (e.g. Pieprzyk et al. Reference Pieprzyk, Bannerman, Brańka, Chudak and Heyes2019). Here, we demonstrate, in a colloidal setting directly aligned with suspension experiments, how minimal, quantified perturbations to hardness and very weak seeding render the metastable barrier surmountable and expose the proposed entropy-exchange mechanism in a system that remains as close as practicable to the MPRHS limit. We hope this perspective will motivate analogous tests in ballistic atomic simulations as well.
2. Methods
2.1. Model system
The computational model system studied here comprises 2000 000 neutrally buoyant colloidal hard spheres of monodisperse radius $a$
suspended in a Newtonian solvent of density
$a$
suspended in a Newtonian solvent of density $\rho$
and viscosity
$\rho$
and viscosity $\eta$
. Particle interactions and Brownian motion disturb the surrounding fluid with motion governed by the Stokes equations, owing to the vanishingly small Reynolds and Stokes numbers associated with the small size of colloids,
$\eta$
. Particle interactions and Brownian motion disturb the surrounding fluid with motion governed by the Stokes equations, owing to the vanishingly small Reynolds and Stokes numbers associated with the small size of colloids, $Re = \rho U a / \eta \ll 1$
and
$Re = \rho U a / \eta \ll 1$
and $St = (\rho _p/\rho )\,Re \ll 1$
, where
$St = (\rho _p/\rho )\,Re \ll 1$
, where $U$
is a characteristic particle velocity set by Brownian diffusion. We emphasise that this overdamped choice is made to align with colloidal suspension physics; the metastability problem and the controlled `hardness’-perturbation strategy discussed here are expected to translate directly to ballistic hard-sphere dynamics as well. The phase behaviour of purely repulsive hard colloids is controlled solely by the colloid volume fraction,
$U$
is a characteristic particle velocity set by Brownian diffusion. We emphasise that this overdamped choice is made to align with colloidal suspension physics; the metastability problem and the controlled `hardness’-perturbation strategy discussed here are expected to translate directly to ballistic hard-sphere dynamics as well. The phase behaviour of purely repulsive hard colloids is controlled solely by the colloid volume fraction, $\phi = 4\pi a^3 n / 3$
, where
$\phi = 4\pi a^3 n / 3$
, where $n$
is the number of colloids per unit total volume. Each particle experiences hydrodynamic drag and Brownian forces as described below. Many-body hydrodynamic interactions are neglected. The systems studied lie in the volume-fraction range
$n$
is the number of colloids per unit total volume. Each particle experiences hydrodynamic drag and Brownian forces as described below. Many-body hydrodynamic interactions are neglected. The systems studied lie in the volume-fraction range $0.49 \le \phi _{{target}} \le 0.55$
, spanning the entire theoretical coexistence region.
$0.49 \le \phi _{{target}} \le 0.55$
, spanning the entire theoretical coexistence region.
2.1.1. Interaction potential and nearly hard-sphere limit
Our goal is to model nearly hard-sphere colloids under Brownian dynamics, rather than mathematically ideal hard spheres. To this end, we use a short-ranged Morse pair potential with parameters chosen so that the reduced second virial coefficient differs from the hard-sphere value by at most $1\,\%$
. In this sense, the Morse interaction is a quantitatively accurate hard-sphere surrogate that also provides a clean control parameter for particle softness (through the potential depth and range). Throughout, we deliberately exploit this tunability to study how small, explicitly quantified deviations from the MPRHS limit affect phase separation and Frenkel’s entropy-exchange mechanism.
$1\,\%$
. In this sense, the Morse interaction is a quantitatively accurate hard-sphere surrogate that also provides a clean control parameter for particle softness (through the potential depth and range). Throughout, we deliberately exploit this tunability to study how small, explicitly quantified deviations from the MPRHS limit affect phase separation and Frenkel’s entropy-exchange mechanism.
To represent the hard-sphere condition in simulation, entropic exclusion was modelled using a purely repulsive pair potential $V(r)$
, where
$V(r)$
, where $r$
is the centre-to-centre distance between particles. To avoid a singular contact condition, we employed a short-range Morse potential with strong repulsion, truncated at contact
$r$
is the centre-to-centre distance between particles. To avoid a singular contact condition, we employed a short-range Morse potential with strong repulsion, truncated at contact
 \begin{equation} V(r) = \begin{cases} -V_0 \!\left ( 2\,\mathrm{e}^{-\kappa [r-(a_i+a_{\!j})]} - \mathrm{e}^{-2\kappa [r-(a_i+a_{\!j})]} +1\right ), & r \le a_i+a_{\!j},\\ 0, & r \gt a_i+a_{\!j}. \end{cases} \end{equation}
Equation (2.1) describes a nearly hard-sphere interaction between particles $i$
and
$i$
and $j$
. The potential hardness is controlled by the parameters
$j$
. The potential hardness is controlled by the parameters $V_0$
and
$V_0$
and $\kappa ^{-1}$
, with larger values corresponding to steeper repulsion. The baseline parameters
$\kappa ^{-1}$
, with larger values corresponding to steeper repulsion. The baseline parameters $V_0 = 6kT$
and
$V_0 = 6kT$
and $\kappa = 30/a$
, together with the exponential form of the Morse potential, have been widely used to approximate hard-sphere behaviour in colloidal simulations of diffusion, flow and gelation (Zia, Landrum & Russel Reference Zia, Landrum and Russel2014; Aponte-Rivera & Zia Reference Aponte-Rivera and Zia2016; Landrum, Russel & Zia Reference Landrum, Russel and Zia2016; Aponte-Rivera, Su & Zia Reference Aponte-Rivera, Su and Zia2018; Johnson, Landrum & Zia Reference Johnson, Landrum and Zia2018; Padmanabhan & Zia Reference Padmanabhan and Zia2018; Johnson et al. Reference Johnson, Zia, Moghimi and Petekidis2019; Gonzalez, Aponte-Rivera & Zia Reference Gonzalez, Aponte-Rivera and Zia2021; Johnson & Zia Reference Johnson and Zia2021; Aponte-Rivera & Zia Reference Aponte-Rivera and Zia2022; Ryu et al. Reference Ryu, Fenton, Nguyen, Helgeson and Zia2022; Sunol & Zia Reference Sunol and Zia2023). The attractive part of
$\kappa = 30/a$
, together with the exponential form of the Morse potential, have been widely used to approximate hard-sphere behaviour in colloidal simulations of diffusion, flow and gelation (Zia, Landrum & Russel Reference Zia, Landrum and Russel2014; Aponte-Rivera & Zia Reference Aponte-Rivera and Zia2016; Landrum, Russel & Zia Reference Landrum, Russel and Zia2016; Aponte-Rivera, Su & Zia Reference Aponte-Rivera, Su and Zia2018; Johnson, Landrum & Zia Reference Johnson, Landrum and Zia2018; Padmanabhan & Zia Reference Padmanabhan and Zia2018; Johnson et al. Reference Johnson, Zia, Moghimi and Petekidis2019; Gonzalez, Aponte-Rivera & Zia Reference Gonzalez, Aponte-Rivera and Zia2021; Johnson & Zia Reference Johnson and Zia2021; Aponte-Rivera & Zia Reference Aponte-Rivera and Zia2022; Ryu et al. Reference Ryu, Fenton, Nguyen, Helgeson and Zia2022; Sunol & Zia Reference Sunol and Zia2023). The attractive part of $V(r)$
was truncated to yield a purely repulsive potential. Under these parameters, the reduced second virial coefficient is
$V(r)$
was truncated to yield a purely repulsive potential. Under these parameters, the reduced second virial coefficient is $B_2^* \equiv B_2/B_2^{HS} = 0.985$
, where
$B_2^* \equiv B_2/B_2^{HS} = 0.985$
, where $B_2^{HS}$
denotes the hard-sphere reference value. A value of
$B_2^{HS}$
denotes the hard-sphere reference value. A value of $B_2^*=1$
defines the ideal hard-sphere limit; thus
$B_2^*=1$
defines the ideal hard-sphere limit; thus $B_2^* = 0.985$
corresponds to an effective particle deformation of only 1 %–2 %, consistent with experimental estimates for PMMA or polystyrene colloids (Royall et al. Reference Royall, Poon and Weeks2013).
$B_2^* = 0.985$
corresponds to an effective particle deformation of only 1 %–2 %, consistent with experimental estimates for PMMA or polystyrene colloids (Royall et al. Reference Royall, Poon and Weeks2013).
Comparison of potentials used to represent hard-sphere colloids in simulations, plotted as a function of particle centre-to-centre distance, where values smaller than unity indicate `overlap’. The purely repulsive Morse potential with $\kappa a=30$
(solid lines) is shown for varying hardness values as indicated in the legend. A commonly used WCA potential is also shown (black dashed line). Truly hard-sphere interaction is a Heaviside function at unity.
$\kappa a=30$
(solid lines) is shown for varying hardness values as indicated in the legend. A commonly used WCA potential is also shown (black dashed line). Truly hard-sphere interaction is a Heaviside function at unity.

In this study we systematically explored perturbations of this nominally hard-sphere condition. The potential depth $V_0$
was varied from
$V_0$
was varied from $6kT$
to
$6kT$
to $15kT$
,
$15kT$
, $30kT$
and
$30kT$
and $60kT$
, corresponding to increased hardness with
$60kT$
, corresponding to increased hardness with $B_2^* = 0.990$
,
$B_2^* = 0.990$
, $0.993$
and
$0.993$
and $0.995$
, respectively (figure 1). These values closely match experimental estimates for poly(12-hydroxystearic acid)-stabilised PMMA particles, which exhibit
$0.995$
, respectively (figure 1). These values closely match experimental estimates for poly(12-hydroxystearic acid)-stabilised PMMA particles, which exhibit $0.969 \le B_2^* \le 0.999$
(Bryant et al. Reference Bryant, Williams, Qian, Snook, Perez and Pincet2002). We intentionally employ an `extremely hard’ but finitely soft Morse potential as a controlled approximation to hard spheres, not as an exact hard-sphere model. In this work we deliberately vary particle hardness as a tuneable perturbation away from the ideal MPRHS limit in order to obtain phase separation on accessible time scales and to probe the entropy-exchange mechanism. For the parameters used here, the Morse system remains quantitatively close to hard-sphere thermodynamics while primarily modifying the kinetics.
$0.969 \le B_2^* \le 0.999$
(Bryant et al. Reference Bryant, Williams, Qian, Snook, Perez and Pincet2002). We intentionally employ an `extremely hard’ but finitely soft Morse potential as a controlled approximation to hard spheres, not as an exact hard-sphere model. In this work we deliberately vary particle hardness as a tuneable perturbation away from the ideal MPRHS limit in order to obtain phase separation on accessible time scales and to probe the entropy-exchange mechanism. For the parameters used here, the Morse system remains quantitatively close to hard-sphere thermodynamics while primarily modifying the kinetics.
For comparison, many colloidal simulations employ the Weeks–Chandler–Andersen (WCA) potential as a nominally hard-sphere model (see Appendix B). As shown in figure 1, even our softest Morse potential ( $B_2^* = 0.985$
,
$B_2^* = 0.985$
, $V_0 = 6kT$
) produces substantially steeper repulsion than the WCA potential. The WCA form with
$V_0 = 6kT$
) produces substantially steeper repulsion than the WCA potential. The WCA form with $V_0 = 40kT$
used in several prior studies (Filion et al. Reference Filion, Ni, Frenkel and Dijkstra2011b
; Tateno et al. Reference Tateno, Yanagishima, Russo and Tanaka2019; Fiorucci et al. Reference Fiorucci, Coli, Padding and Dijkstra2020; Gispen & Dijkstra Reference Gispen and Dijkstra2024) yields
$V_0 = 40kT$
used in several prior studies (Filion et al. Reference Filion, Ni, Frenkel and Dijkstra2011b
; Tateno et al. Reference Tateno, Yanagishima, Russo and Tanaka2019; Fiorucci et al. Reference Fiorucci, Coli, Padding and Dijkstra2020; Gispen & Dijkstra Reference Gispen and Dijkstra2024) yields $B_2^* = 0.729$
, permitting roughly 30 % effective particle overlap, far softer than the 2 % deformation typical in experiments (Royall et al. Reference Royall, Poon and Weeks2013). Such soft interactions shift the phase envelope to higher volume fractions, a well-established effect in the literature (Hoover et al. Reference Hoover, Gray and Johnson1971; Robbins et al. Reference Robbins, Kremer and Grest1988; Meijer & Frenkel Reference Meijer and Frenkel1991; Löwen et al. Reference Löwen, Palberg and Simon1993; Lowen & Szamel Reference Lowen and Szamel1993; Piazza et al. Reference Piazza, Bellini and Degiorgio1993; Németh & Likos Reference Németh and Likos1995; Senff & Richtering Reference Senff and Richtering1999; Likos Reference Likos2001; Castelletto et al. Reference Castelletto, Caillet, Hamley and Yang2002; Laurati et al. Reference Laurati, Stellbrink, Lund, Willner, Richter and Zaccarelli2005; Archer Reference Archer2005; Likos Reference Likos2006; Mladek et al. Reference Mladek, Charbonneau and Frenkel2007a
,
Reference Mladek, Gottwaldy, Kahl, Neumann and Likosb
; Vlassopoulos & Cloitre Reference Vlassopoulos and Cloitre2014; Gupta et al. Reference Gupta, Camargo, Stellbrink, Allgaier, Radulescu, Lindner, Zaccarelli, Likos and Richter2015; Pelaez-Fernandez et al. Reference Pelaez-Fernandez, Souslov, Lyon, Goldbart and Fernandez-Nieves2015; Zakhari et al. Reference Zakhari, Anderson and Hütter2017; Erigi et al. Reference Erigi, Dhumal and Tripathy2023). Consequently, these WCA-based systems typically require rescaling of the freezing point, which in turn misaligns the predicted melting point (Poon, Weeks & Royall Reference Poon, Weeks and Royall2012).
$B_2^* = 0.729$
, permitting roughly 30 % effective particle overlap, far softer than the 2 % deformation typical in experiments (Royall et al. Reference Royall, Poon and Weeks2013). Such soft interactions shift the phase envelope to higher volume fractions, a well-established effect in the literature (Hoover et al. Reference Hoover, Gray and Johnson1971; Robbins et al. Reference Robbins, Kremer and Grest1988; Meijer & Frenkel Reference Meijer and Frenkel1991; Löwen et al. Reference Löwen, Palberg and Simon1993; Lowen & Szamel Reference Lowen and Szamel1993; Piazza et al. Reference Piazza, Bellini and Degiorgio1993; Németh & Likos Reference Németh and Likos1995; Senff & Richtering Reference Senff and Richtering1999; Likos Reference Likos2001; Castelletto et al. Reference Castelletto, Caillet, Hamley and Yang2002; Laurati et al. Reference Laurati, Stellbrink, Lund, Willner, Richter and Zaccarelli2005; Archer Reference Archer2005; Likos Reference Likos2006; Mladek et al. Reference Mladek, Charbonneau and Frenkel2007a
,
Reference Mladek, Gottwaldy, Kahl, Neumann and Likosb
; Vlassopoulos & Cloitre Reference Vlassopoulos and Cloitre2014; Gupta et al. Reference Gupta, Camargo, Stellbrink, Allgaier, Radulescu, Lindner, Zaccarelli, Likos and Richter2015; Pelaez-Fernandez et al. Reference Pelaez-Fernandez, Souslov, Lyon, Goldbart and Fernandez-Nieves2015; Zakhari et al. Reference Zakhari, Anderson and Hütter2017; Erigi et al. Reference Erigi, Dhumal and Tripathy2023). Consequently, these WCA-based systems typically require rescaling of the freezing point, which in turn misaligns the predicted melting point (Poon, Weeks & Royall Reference Poon, Weeks and Royall2012).
2.2. Dynamic simulation model and algorithm
2.2.1. Brownian dynamics and hydrodynamics
All simulations are performed using overdamped Brownian dynamics with hydrodynamic interactions, appropriate for colloidal particles suspended in a solvent. In this framework, solvent-mediated thermal fluctuations set both short- and long-time self-diffusion and drive the configurational rearrangements and local vibrational motion that govern phase behaviour. Our aim is therefore not to reproduce the event-driven dynamics of atomic hard spheres, but to capture the kinetics of nearly hard-sphere colloids under a realistic Brownian description while systematically varying particle hardness.
By contrast, Monte Carlo (MC) schemes, including event-chain MC, are designed for algorithmically driven equilibration: trial moves (which may be large, collective or chain-like) are constructed to accelerate exploration of configuration space and convergence to the correct equilibrium ensemble, rather than to mimic Brownian or Newtonian trajectories. Such methods are ideal for determining equations of state and coexistence boundaries, and we take the hard-sphere thermodynamics established by these approaches as given. They are not, however, intended to resolve the actual time scales and pathways by which a Brownian suspension reaches fluid–crystal coexistence from a homogeneous initial state, which is the kinetic question we address here.
We conduct Brownian dynamics simulations utilising the LAMMPS molecular dynamics package (Thompson et al. Reference Thompson2022) which has a parallelisation scheme optimised to handle large particle systems. We distributed 2000 000 particles, all of size $a$
, throughout the simulation cell. To efficiently initialise the system with high volume fraction, we placed all particles on a periodic lattice, then allowed its configuration to relax via Brownian motion throughout simulation. The simulation cell is replicated into an infinite domain.
$a$
, throughout the simulation cell. To efficiently initialise the system with high volume fraction, we placed all particles on a periodic lattice, then allowed its configuration to relax via Brownian motion throughout simulation. The simulation cell is replicated into an infinite domain.
LAMMPS’ implicit solvent package solves the Langevin equation for each particle at each time step throughout simulation
 \begin{equation} \boldsymbol{m} \boldsymbol{\cdot }\frac {{\rm d}\boldsymbol{U}}{{\rm d}t} = \boldsymbol{F}^H+\boldsymbol{F}^B+\boldsymbol{F}^P. \end{equation}
Here, $\boldsymbol{m}$
is particle mass, and
$\boldsymbol{m}$
is particle mass, and $\boldsymbol{F}^H$
,
$\boldsymbol{F}^H$
, $\boldsymbol{F}^B$
and
$\boldsymbol{F}^B$
and $\boldsymbol{F}^P$
are the Stokes drag, the stochastic Brownian force and the interparticle forces, respectively. Although many-body hydrodynamic interactions play a role in suspension mechanics even up to volume fractions as high as
$\boldsymbol{F}^P$
are the Stokes drag, the stochastic Brownian force and the interparticle forces, respectively. Although many-body hydrodynamic interactions play a role in suspension mechanics even up to volume fractions as high as $55\,\%$
(Zia, Swan & Su Reference Zia, Swan and Su2015), in cases where repulsion keeps particles’ no-slip surfaces separated by at least twenty per cent of their size, these interactions become weak and can be neglected to good approximation (Bergenholtz, Brady & Vicic Reference Bergenholtz, Brady and Vicic2002; Khair & Brady Reference Khair and Brady2006; Khair, Swaroop & Brady Reference Khair, Swaroop and Brady2006; Swaroop & Brady Reference Swaroop and Brady2007). Making this freely draining approximation, the hydrodynamic force on each particle is determined by Stokes’ drag law
$55\,\%$
(Zia, Swan & Su Reference Zia, Swan and Su2015), in cases where repulsion keeps particles’ no-slip surfaces separated by at least twenty per cent of their size, these interactions become weak and can be neglected to good approximation (Bergenholtz, Brady & Vicic Reference Bergenholtz, Brady and Vicic2002; Khair & Brady Reference Khair and Brady2006; Khair, Swaroop & Brady Reference Khair, Swaroop and Brady2006; Swaroop & Brady Reference Swaroop and Brady2007). Making this freely draining approximation, the hydrodynamic force on each particle is determined by Stokes’ drag law
 \begin{equation} \boldsymbol{F}_i^H = -6\pi \eta a_i \left [ \boldsymbol{U}_i-\boldsymbol{u}^{\infty }(\boldsymbol{X}_i) \right ]\!. \end{equation}
Here, $\boldsymbol{U}_i-\boldsymbol{u}^{\infty }(\boldsymbol{X}_i)$
represents the particle velocity
$\boldsymbol{U}_i-\boldsymbol{u}^{\infty }(\boldsymbol{X}_i)$
represents the particle velocity $\boldsymbol{U}_i$
relative to the fluid velocity
$\boldsymbol{U}_i$
relative to the fluid velocity $\boldsymbol{u}^{\infty }(\boldsymbol{X}_i)$
. The Brownian force obeys Gaussian statistics (Brünger et al. Reference Brünger, Brooks and Karplus1984)
$\boldsymbol{u}^{\infty }(\boldsymbol{X}_i)$
. The Brownian force obeys Gaussian statistics (Brünger et al. Reference Brünger, Brooks and Karplus1984)
 \begin{equation} \overline {\boldsymbol{F}_i^B} = 0\textrm {, }\overline {\boldsymbol{F}_i^B(0)\boldsymbol{F}_i^B(t)} = 2kT(6\pi \eta a_i) \boldsymbol{I}\delta (t), \end{equation}
where the overbars indicate averaging over a time period larger than the solvent time scale and $\boldsymbol{I}$
is the identity tensor. The Dirac delta distribution
$\boldsymbol{I}$
is the identity tensor. The Dirac delta distribution $\delta (t)$
indicates that the Brownian impacts are instantaneously correlated. The interparticle force is defined as the negative gradient of the interparticle potential
$\delta (t)$
indicates that the Brownian impacts are instantaneously correlated. The interparticle force is defined as the negative gradient of the interparticle potential $V(r)$
, and because the Morse potential is spherically symmetric, we incorporate its derivative in the spherical coordinate system
$V(r)$
, and because the Morse potential is spherically symmetric, we incorporate its derivative in the spherical coordinate system
 \begin{equation} \boldsymbol{F}_i^P = - \sum _{j} \frac {\partial V(r_{\textit{ij}})}{\partial r_{\textit{ij}}} \hat {\boldsymbol{r}}_{\textit{ij}}. \end{equation}
Here, $\hat {\boldsymbol{r}}_{\textit{ij}}=\boldsymbol{r}_{\textit{ij}}/r_{\textit{ij}}$
, where
$\hat {\boldsymbol{r}}_{\textit{ij}}=\boldsymbol{r}_{\textit{ij}}/r_{\textit{ij}}$
, where $\boldsymbol{r}_{\textit{ij}}=\boldsymbol{X}_{i}-\boldsymbol{X}_{j}$
is the separation vector from the centre of particle
$\boldsymbol{r}_{\textit{ij}}=\boldsymbol{X}_{i}-\boldsymbol{X}_{j}$
is the separation vector from the centre of particle $i$
to the centre of particle
$i$
to the centre of particle $j$
, and
$j$
, and $r_{\textit{ij}}=|\boldsymbol{r}_{\textit{ij}}|$
. The summation is taken over all interacting pairs involving particle
$r_{\textit{ij}}=|\boldsymbol{r}_{\textit{ij}}|$
. The summation is taken over all interacting pairs involving particle $i$
. In LAMMPS, particle velocities and positions are advanced in time numerically using velocity Verlet integration (Allen & Tildesley Reference Allen and Tildesley1987). To model colloidal physics, the Reynolds number and the Stokes number must be small; in LAMMPS, this requires thoughtful selection of the integration time step, which we set at
$i$
. In LAMMPS, particle velocities and positions are advanced in time numerically using velocity Verlet integration (Allen & Tildesley Reference Allen and Tildesley1987). To model colloidal physics, the Reynolds number and the Stokes number must be small; in LAMMPS, this requires thoughtful selection of the integration time step, which we set at $\Delta t=10^{-5}a^2/D$
, where
$\Delta t=10^{-5}a^2/D$
, where $a^2/D$
is the diffusive time required for a single particle of size
$a^2/D$
is the diffusive time required for a single particle of size $a$
diffusing its size in pure solvent with diffusion coefficient
$a$
diffusing its size in pure solvent with diffusion coefficient $D=kT/6\pi \eta a$
. The small time step permits only very small particle overlaps, which are resolved via a standard Heyes–Melrose algorithm (Heyes & Melrose Reference Heyes and Melrose1993). This overlap resolution represents an entropic encounter that contributes appropriately to the osmotic pressure (Zia & Brady Reference Zia and Brady2012; Zia et al. Reference Zia, Landrum and Russel2014).
$D=kT/6\pi \eta a$
. The small time step permits only very small particle overlaps, which are resolved via a standard Heyes–Melrose algorithm (Heyes & Melrose Reference Heyes and Melrose1993). This overlap resolution represents an entropic encounter that contributes appropriately to the osmotic pressure (Zia & Brady Reference Zia and Brady2012; Zia et al. Reference Zia, Landrum and Russel2014).
We explored phase behaviour within the theoretical coexistence region by preparing 13 samples at target volume fractions spanning $0.49 \le \phi \le 0.55$
, then monitoring the evolution of crystal fraction and osmotic pressure over time. Phase transitions were induced using both freezing and melting protocols to expose possible path dependence, where we expected metastable systems that retained their initial fluid structure well above the freezing point and crystalline structure well below the melting point. Similar to the asymmetric approach signatures observed in glasses (Kovacs Reference Kovacs1964; Di et al. Reference Di, Win, McKenna, Narita, Lequeux, Pullela and Cheng2011, Reference Di, Peng and McKenna2014; Peng & McKenna Reference Peng and McKenna2016; McKenna Reference McKenna2020), nonlinear kinetics, where particle mobility changes as
$0.49 \le \phi \le 0.55$
, then monitoring the evolution of crystal fraction and osmotic pressure over time. Phase transitions were induced using both freezing and melting protocols to expose possible path dependence, where we expected metastable systems that retained their initial fluid structure well above the freezing point and crystalline structure well below the melting point. Similar to the asymmetric approach signatures observed in glasses (Kovacs Reference Kovacs1964; Di et al. Reference Di, Win, McKenna, Narita, Lequeux, Pullela and Cheng2011, Reference Di, Peng and McKenna2014; Peng & McKenna Reference Peng and McKenna2016; McKenna Reference McKenna2020), nonlinear kinetics, where particle mobility changes as $\phi$
varies, introduce hysteresis in rate-dependent processes, potentially assisting the system in escaping metastability and reaching equilibrium coexistence. If the final, phase-separated state (same final crystal fraction) is identical for both freezing and melting protocols, the resulting state can be identified as the equilibrium coexistence condition.
$\phi$
varies, introduce hysteresis in rate-dependent processes, potentially assisting the system in escaping metastability and reaching equilibrium coexistence. If the final, phase-separated state (same final crystal fraction) is identical for both freezing and melting protocols, the resulting state can be identified as the equilibrium coexistence condition.
2.2.2. Preparation
Freezing and melting protocols were designed to prepare samples on or near the metastable fluid and crystal lines with well-controlled initial crystal fractions. Because a pristine MPRHS system would require infinite time to phase separate (Ten Wolde et al. Reference Ten Wolde, Ruiz-Montero and Frenkel1996), we deliberately introduced small, spatially distributed crystal seeds, enabling observation of phase behaviour on finite time scales. The goal was to mimic the natural emergence of nucleites from thermal fluctuations while avoiding strong seeding effects, such as the use of a single crystalline substrate, that can artificially force or suppress metastability (Ladd & Woodcock Reference Ladd and Woodcock1977; Davidchack & Laird Reference Davidchack and Laird1998; Auer & Frenkel Reference Auer and Frenkel2001a , Reference Auer and Frenkelb , Reference Auer and Frenkel2004; Noya et al. Reference Noya, Vega and de Miguel2008; Filion et al. Reference Filion, Hermes, Ni and Dijkstra2010, Reference Filion, Ni, Frenkel and Dijkstra2011b ; Zykova-Timan et al. Reference Zykova-Timan, Horbach and Binder2010; Hermes et al. Reference Hermes, Vermolen, Leunissen, Vossen, Van Oostrum, Dijkstra and Van Blaaderen2011; Espinosa et al. Reference Espinosa, Sanz, Valeriani and Vega2013; Espinosa et al. Reference Espinosa, Vega, Valeriani and Sanz2016; Tateno et al. Reference Tateno, Yanagishima, Russo and Tanaka2019; Fiorucci et al. Reference Fiorucci, Coli, Padding and Dijkstra2020; Montero de Hijes et al. Reference Montero de Hijes, Espinosa, Bianco, Sanz and Vega2020a , Reference Montero de Hijes, Shi, Noya, Santiso, Gubbins, Sanz and Vegab ; Sanchez-Burgos et al. Reference Sanchez-Burgos, Sanz, Vega and Espinosa2021; Gispen & Dijkstra Reference Gispen and Dijkstra2024). Our approach thus introduces the smallest practicable perturbation to spontaneous phase separation.
2.2.3. Freezing protocol
The system was initialised as a face-centred-cubic (FCC) lattice at a volume fraction of $\phi _{0,fr} = 0.45$
, from which Brownian motion immediately began to relax the structure. The simulation box was then uniformly contracted to increase the packing fraction from 0.45 to 0.56 at controlled rates. This densification was performed either slowly or rapidly relative to the Brownian relaxation time, producing samples with fewer or more distributed crystal seeds, respectively. Two freezing rates were applied:
$\phi _{0,fr} = 0.45$
, from which Brownian motion immediately began to relax the structure. The simulation box was then uniformly contracted to increase the packing fraction from 0.45 to 0.56 at controlled rates. This densification was performed either slowly or rapidly relative to the Brownian relaxation time, producing samples with fewer or more distributed crystal seeds, respectively. Two freezing rates were applied:
 \begin{align} \frac {{\rm d}\phi }{{\rm d}t} \bigg \vert _{\textit{freezing}} = \begin{cases} 0.025\,D/a^2 \quad &(\text{slow, total time } 4\,a^2/D),\\ 0.25\,D/a^2 \quad &(\text{fast, total time } 0.4\,a^2/D). \end{cases} \end{align}
At higher densification rates, Brownian relaxation becomes less effective, retaining more of the initial FCC order. The result was two distinct sets of 13 samples: one near the metastable-fluid line (slow freezing, $\zeta _0 = 2\,\%{-}4\,\%$
crystal fraction) and one near the metastable-crystal line (fast freezing,
$\zeta _0 = 2\,\%{-}4\,\%$
crystal fraction) and one near the metastable-crystal line (fast freezing, $\zeta _0 = 84\,\%{-}99\,\%$
).
$\zeta _0 = 84\,\%{-}99\,\%$
).
2.2.4. Melting protocol
For melting tests, the target protocol is to begin from a fluid state as close as possible to the metastable-fluid line, but with only a small, controlled crystalline seed. Because a homogeneous fluid at $\phi = 0.56$
cannot be prepared directly, we instead initialised the system as an FCC lattice at
$\phi = 0.56$
cannot be prepared directly, we instead initialised the system as an FCC lattice at $\phi = 0.45$
, then gradually increased the volume fraction to
$\phi = 0.45$
, then gradually increased the volume fraction to $\phi = 0.56$
. During this concentration ramp, the FCC structure relaxes and loses most of its long-range order as the system traverses the fluid regime (
$\phi = 0.56$
. During this concentration ramp, the FCC structure relaxes and loses most of its long-range order as the system traverses the fluid regime ( $\phi = 0.45$
to
$\phi = 0.45$
to $0.49$
). As
$0.49$
). As $\phi$
increases further through the coexistence region, Brownian motion continues to randomise the particle configuration. Upon reaching
$\phi$
increases further through the coexistence region, Brownian motion continues to randomise the particle configuration. Upon reaching $\phi = 0.56$
, the system is held for
$\phi = 0.56$
, the system is held for $4\,a^2/D$
prior to initiating melting – a duration short enough to avoid complete recrystallisation – resulting in an initial crystalline fraction of
$4\,a^2/D$
prior to initiating melting – a duration short enough to avoid complete recrystallisation – resulting in an initial crystalline fraction of $2\,\%{-}4\,\%$
. The melting process is then induced by expanding the simulation box to decrease
$2\,\%{-}4\,\%$
. The melting process is then induced by expanding the simulation box to decrease $\phi$
at two prescribed rates
$\phi$
at two prescribed rates
 \begin{align} \frac {{\rm d}\phi }{{\rm d}t} \bigg \vert _{\textit{melting}} = \begin{cases} -0.025\,D/a^2 &\quad (\text{slow}),\\ -0.1\,D/a^2 &\quad (\text{fast}). \end{cases} \end{align}
As opposed to a linear affine-expansion protocol, which would pull apart all crystal seeds, in our protocol Brownian motion randomises particle positions during advective expansion allows small seed clusters to remain.
As in freezing, varying the expansion rate tunes the number of remnant crystal seeds. Two corresponding sets of 13 samples were thus prepared near the metastable-fluid line, each containing small, spatially distributed crystalline seeds. Each initial condition contains a single largest crystalline cluster, with all remaining crystalline particles distributed among many smaller clusters (see figure 13 in Appendix C). Across all samples, 97 %–99 % of crystalline particles reside in clusters smaller than 260 particles, i.e. below the upper end of critical nucleus sizes typically reported for hard spheres (Auer & Frenkel Reference Auer and Frenkel2004). The largest cluster contains fewer than 200 particles near freezing ( $0.49 \le \phi \le 0.51$
), 500–900 at intermediate volume fractions (
$0.49 \le \phi \le 0.51$
), 500–900 at intermediate volume fractions ( $0.515 \le \phi \le 0.53$
) and
$0.515 \le \phi \le 0.53$
) and $\lesssim 1{,}500$
near melting (
$\lesssim 1{,}500$
near melting ( $0.535 \le \phi \le 0.55$
). Unlike studies employing fixed-seed protocols (Hermes et al. Reference Hermes, Vermolen, Leunissen, Vossen, Van Oostrum, Dijkstra and Van Blaaderen2011; Espinosa et al. Reference Espinosa, Vega, Valeriani and Sanz2016; Fiorucci et al. Reference Fiorucci, Coli, Padding and Dijkstra2020; Montero de Hijes et al. Reference Montero de Hijes, Espinosa, Bianco, Sanz and Vega2020a
,
Reference Montero de Hijes, Shi, Noya, Santiso, Gubbins, Sanz and Vegab
; Gispen & Dijkstra Reference Gispen and Dijkstra2024), we do not immobilise or otherwise constrain any crystalline cluster at any stage of the simulation, thereby allowing Brownian-motion-driven dissolution, fragmentation and merging of nuclei (Kiang et al. Reference Kiang, Stauffer, Walker, Puri, Wise and Patterson1971).
$0.535 \le \phi \le 0.55$
). Unlike studies employing fixed-seed protocols (Hermes et al. Reference Hermes, Vermolen, Leunissen, Vossen, Van Oostrum, Dijkstra and Van Blaaderen2011; Espinosa et al. Reference Espinosa, Vega, Valeriani and Sanz2016; Fiorucci et al. Reference Fiorucci, Coli, Padding and Dijkstra2020; Montero de Hijes et al. Reference Montero de Hijes, Espinosa, Bianco, Sanz and Vega2020a
,
Reference Montero de Hijes, Shi, Noya, Santiso, Gubbins, Sanz and Vegab
; Gispen & Dijkstra Reference Gispen and Dijkstra2024), we do not immobilise or otherwise constrain any crystalline cluster at any stage of the simulation, thereby allowing Brownian-motion-driven dissolution, fragmentation and merging of nuclei (Kiang et al. Reference Kiang, Stauffer, Walker, Puri, Wise and Patterson1971).
2.2.5. Quasi-equilibrium protocol
A third, quasi-equilibrium series was prepared by melting while allowing the system to relax at each step by $2000\,a^2/D$
after every incremental decrease
$2000\,a^2/D$
after every incremental decrease $\Delta \phi = -0.01$
. This approach approximates an equilibrium path through the coexistence region.
$\Delta \phi = -0.01$
. This approach approximates an equilibrium path through the coexistence region.
2.2.6. Equilibration and monitoring
Upon reaching each target volume fraction (the frozen or melted configuration), the system was held at constant $\phi$
and evolved via Brownian dynamics under isothermal conditions (2.2). Osmotic pressure and crystal fraction were monitored until both reached steady values. Equilibrium plateaus were typically achieved within
$\phi$
and evolved via Brownian dynamics under isothermal conditions (2.2). Osmotic pressure and crystal fraction were monitored until both reached steady values. Equilibrium plateaus were typically achieved within $t/(a^2/D) = 2{\,}000{-}8{\,}000$
; the minimum monitoring time was therefore set to
$t/(a^2/D) = 2{\,}000{-}8{\,}000$
; the minimum monitoring time was therefore set to $2000\,a^2/D$
.
$2000\,a^2/D$
.
2.2.7. Hardness variation
All protocols described above were repeated for four values of particle hardness to quantify how small variations in accessible free volume mediate the exchange between long-range (configurational) and short-range (vibrational) entropy.
2.3. Structure and osmotic pressure measurement
We track the positions, velocities and particle-phase stress throughout the freeze or melt processes. We measure the radial distribution function, then use it to quantify the extent of crystallisation in our calculation of the per-particle bond-orientational order parameters $\bar {q}_6$
and
$\bar {q}_6$
and $\bar {q}_4$
, from which we calculate the crystal fraction at any time during the freeze and melt process. Using these data we plot the crystal fraction as a function of volume fraction to deduce regions of a colloidal phase diagram.
$\bar {q}_4$
, from which we calculate the crystal fraction at any time during the freeze and melt process. Using these data we plot the crystal fraction as a function of volume fraction to deduce regions of a colloidal phase diagram.
The average local-order parameter is defined, for a particle $i$
with a number of neighbouring particle
$i$
with a number of neighbouring particle $N_b$
, as (Steinhardt, Nelson & Ronchetti Reference Steinhardt, Nelson and Ronchetti1983; Lechner & Dellago Reference Lechner and Dellago2008)
$N_b$
, as (Steinhardt, Nelson & Ronchetti Reference Steinhardt, Nelson and Ronchetti1983; Lechner & Dellago Reference Lechner and Dellago2008)
 \begin{equation} \bar q_l(i)=\sqrt {\frac {4\pi }{2l+1}\sum ^l_{m=-l}|\bar q_{lm}(i)|^2}, \end{equation}
where
 \begin{equation} \bar q_{lm}(i)=\frac {q_{lm}(i)+\sum _{k=1}^{N_b}q_{lm}(k)}{N_b+1}, \end{equation}
and
 \begin{equation} q_{lm}(i)=\frac {\sum _{j=1}^{N_b}Y_{lm}(\textbf{r}_{\textit{ij}})}{N_b}. \end{equation}
Here, $q_{lm}$
is a complex number depending on all spherical harmonics
$q_{lm}$
is a complex number depending on all spherical harmonics $Y_{lm}$
of order
$Y_{lm}$
of order $l$
and where integers
$l$
and where integers $m \in \{-l,\ldots ,l\}$
, for a pair of particles with centre-to-centre vector separation
$m \in \{-l,\ldots ,l\}$
, for a pair of particles with centre-to-centre vector separation $\boldsymbol{r}_{\textit{ij}}$
.
$\boldsymbol{r}_{\textit{ij}}$
.
In (2.9), $q_{lm}$
is averaged over both particle
$q_{lm}$
is averaged over both particle $i$
and its neighbours
$i$
and its neighbours $N_b$
, enhancing the ability to distinguish between different crystal structures (Lechner & Dellago Reference Lechner and Dellago2008). Particles are considered neighbours if their separation is less than the distance corresponding to the first minimum of the radial distribution function. The absolute value of the crystal fraction is, in principle, cutoff-dependent, because changing the cutoff alters which neighbours contribute to
$N_b$
, enhancing the ability to distinguish between different crystal structures (Lechner & Dellago Reference Lechner and Dellago2008). Particles are considered neighbours if their separation is less than the distance corresponding to the first minimum of the radial distribution function. The absolute value of the crystal fraction is, in principle, cutoff-dependent, because changing the cutoff alters which neighbours contribute to $q_6$
and thus which particles are tagged as `solid-like’. If the cutoff is too small, true first-shell neighbours are missed and genuinely crystalline particles can fall below the solid-like threshold; if it is too large, second-shell or fluid-like neighbours contaminate the bond-orientational signal and can either inflate or deflate the apparent crystal fraction. In our analysis, we therefore define neighbours using the first minimum of
$q_6$
and thus which particles are tagged as `solid-like’. If the cutoff is too small, true first-shell neighbours are missed and genuinely crystalline particles can fall below the solid-like threshold; if it is too large, second-shell or fluid-like neighbours contaminate the bond-orientational signal and can either inflate or deflate the apparent crystal fraction. In our analysis, we therefore define neighbours using the first minimum of $g(r)$
at each volume fraction, which isolates the first coordination shell and minimises contamination from more disordered neighbours. Within a narrow range around this first minimum, our qualitative conclusions about the magnitude and trends of the crystal fraction are robust.
$g(r)$
at each volume fraction, which isolates the first coordination shell and minimises contamination from more disordered neighbours. Within a narrow range around this first minimum, our qualitative conclusions about the magnitude and trends of the crystal fraction are robust.
The spherical harmonics of orders $l=4$
and
$l=4$
and $l=6$
are used in the present study to identify structures with fourfold symmetry, such as body-centred cubic (BCC), and sixfold symmetry, for hexagonal close packed (HCP) and FCC, respectively. Particles are classified as crystalline if
$l=6$
are used in the present study to identify structures with fourfold symmetry, such as body-centred cubic (BCC), and sixfold symmetry, for hexagonal close packed (HCP) and FCC, respectively. Particles are classified as crystalline if $\bar q_6\ge 0.29$
and further categorised as BCC for
$\bar q_6\ge 0.29$
and further categorised as BCC for $\bar q_4\le 0.05$
, HCP for
$\bar q_4\le 0.05$
, HCP for $0.05\lt \bar q_4\le 0.1$
and FCC for
$0.05\lt \bar q_4\le 0.1$
and FCC for $\bar q_4 \gt 0.1$
(Lechner & Dellago Reference Lechner and Dellago2008; Kratzer & Arnold Reference Kratzer and Arnold2015). Based on the average local-order parameter, the structure can be further quantified in terms of fractions of BCC, HCP and FCC crystals as well as the fluid (amorphous) phase.
$\bar q_4 \gt 0.1$
(Lechner & Dellago Reference Lechner and Dellago2008; Kratzer & Arnold Reference Kratzer and Arnold2015). Based on the average local-order parameter, the structure can be further quantified in terms of fractions of BCC, HCP and FCC crystals as well as the fluid (amorphous) phase.
In the Results section, we will report the particle-phase osmotic pressure in connection with phase behaviour. Osmotic pressure is defined as the negative of one third of the trace of the stress. The particle-phase stress $\boldsymbol{\varSigma}^{\boldsymbol{P}}$
in a freely draining suspension arises from the presence of the particles – the ideal osmotic pressure – as
$\boldsymbol{\varSigma}^{\boldsymbol{P}}$
in a freely draining suspension arises from the presence of the particles – the ideal osmotic pressure – as $nkT\boldsymbol{I}$
, and the interparticle elastic stress
$nkT\boldsymbol{I}$
, and the interparticle elastic stress $\boldsymbol{r} \boldsymbol{F}^P$
due to interactions
$\boldsymbol{r} \boldsymbol{F}^P$
due to interactions
 \begin{equation} \langle \boldsymbol{\varSigma } \rangle = -nkT \boldsymbol{I} - n \left \langle \boldsymbol{r} \boldsymbol{F}^P\right \rangle . \end{equation}
Here, $\boldsymbol{I}$
is the identity tensor,
$\boldsymbol{I}$
is the identity tensor, $\boldsymbol{r}$
is the centre-to-centre distance between an interacting pair, and the angle brackets indicate an average over all particles. This particle-phase stress plus the solvent stress give the total suspension stress
$\boldsymbol{r}$
is the centre-to-centre distance between an interacting pair, and the angle brackets indicate an average over all particles. This particle-phase stress plus the solvent stress give the total suspension stress $\langle \boldsymbol{\sigma }\rangle$
(Batchelor Reference Batchelor1977; Foss & Brady Reference Foss and Brady2000; Brady Reference Brady1993; Zia & Brady Reference Zia and Brady2012).
$\langle \boldsymbol{\sigma }\rangle$
(Batchelor Reference Batchelor1977; Foss & Brady Reference Foss and Brady2000; Brady Reference Brady1993; Zia & Brady Reference Zia and Brady2012).
The osmotic pressure in a suspension also includes both the contribution due to solvent thermodynamic pressure and that arising from the presence of the particles, their diffusion and interactions between the particles – the particle-phase osmotic pressure $\langle \varPi ^P\rangle$
 \begin{equation} \bigl\langle \varPi ^P\bigr\rangle = -\frac {1}{3} \boldsymbol{I}: \bigl\langle \boldsymbol{\varSigma }^P \bigr\rangle . \end{equation}
2.4. Free energy, hard spheres and osmotic pressure
At fixed temperature, spontaneous phase separation in colloidal dispersions is governed by minimisation of the Helmholtz free energy
 \begin{align} A = U - TS, \end{align}
where $U$
is the internal energy,
$U$
is the internal energy, $T$
the absolute temperature and
$T$
the absolute temperature and $S$
the entropy (Balescu Reference Balescu1975; Russel et al. Reference Russel, Russel, Saville and Schowalter1991). Coexistence between a fluid and a crystal is obtained from the standard equalities of intensive variables
$S$
the entropy (Balescu Reference Balescu1975; Russel et al. Reference Russel, Russel, Saville and Schowalter1991). Coexistence between a fluid and a crystal is obtained from the standard equalities of intensive variables
 \begin{align} \mu _{\textit{fluid}}(T,\phi _{\textit{fluid}})&=\mu _{\textit{solid}}(T,\phi _{\textit{solid}}), \end{align}
 \begin{align} \varPi _{\textit{fluid}}(T,\phi _{\textit{fluid}})&=\varPi _{\textit{solid}}(T,\phi _{\textit{solid}}), \end{align}
which define the tie line connecting the fluid and solid branches of the phase envelope. The thermodynamic connection among free energy $A$
, osmotic pressure
$A$
, osmotic pressure $\varPi$
and chemical potential
$\varPi$
and chemical potential $\mu$
follows from extensivity:
$\mu$
follows from extensivity: $A=\mu N-\varPi V$
, showing that the osmotic pressure
$A=\mu N-\varPi V$
, showing that the osmotic pressure $\varPi$
is related thermodynamically to the chemical potential
$\varPi$
is related thermodynamically to the chemical potential $\mu$
as
$\mu$
as $\mu /kT = A/NkT+\varPi /nkT$
, representing the increase in pressure and the energy per unit volume required to add another particle to a system of fixed size, respectively. Here,
$\mu /kT = A/NkT+\varPi /nkT$
, representing the increase in pressure and the energy per unit volume required to add another particle to a system of fixed size, respectively. Here, $N$
is the total number of particles in the volume
$N$
is the total number of particles in the volume $V$
,
$V$
, $n\equiv N/V$
is the number density and
$n\equiv N/V$
is the number density and $kT$
is the thermal energy.
$kT$
is the thermal energy.
For purely repulsive hard spheres, the pair potential satisfies $V(r)=\infty$
for
$V(r)=\infty$
for $r\lt 2a$
and
$r\lt 2a$
and $V(r)=0$
for
$V(r)=0$
for $r\ge 2a$
. Configuration space is therefore constrained solely by excluded volume, and the free energy is entropic in origin. Consistently, the reduced second virial coefficient
$r\ge 2a$
. Configuration space is therefore constrained solely by excluded volume, and the free energy is entropic in origin. Consistently, the reduced second virial coefficient $B_2^\ast$
approaches unity in the hard-sphere limit. In our simulations we approximate the hard core with a steep, short-ranged, repulsive Morse form. Tuning its amplitude controls an effective ‘hardness’; as the amplitude increases,
$B_2^\ast$
approaches unity in the hard-sphere limit. In our simulations we approximate the hard core with a steep, short-ranged, repulsive Morse form. Tuning its amplitude controls an effective ‘hardness’; as the amplitude increases, $B_2^\ast \to 1$
, approaching the hard-sphere benchmark.
$B_2^\ast \to 1$
, approaching the hard-sphere benchmark.
Finite hardness (softness) slightly relaxes the exclusion constraint: small deformations at contact increase locally accessible volume and open additional short-range (vibrational) configurations. This raises vibrational entropy and facilitates rearrangements needed to accommodate an additional particle. Conversely, as particles become harder, the set of available configurations at fixed $\phi$
shrinks; adding a particle then requires rarer, cooperative rearrangements that create a full particle-sized cavity, which elevates the osmotic pressure. At equal volume fraction we therefore expect
$\phi$
shrinks; adding a particle then requires rarer, cooperative rearrangements that create a full particle-sized cavity, which elevates the osmotic pressure. At equal volume fraction we therefore expect
 \begin{align} \varPi _{\textit{soft}}(\phi ) \;\lt \; \varPi _{\textit{HS}}(\phi ), \end{align}
with corresponding shifts of the fluid and crystal branches of the metastable phase diagram relative to the atomic hard-sphere reference.
These considerations yield two testable expectations for our nearly hard, monodisperse systems: (i) minimal, distributed crystalline seeds plus slight softness should enable finite-time formation of explicit, long-lived fluid-crystal coexistence along the tie line; and (ii) even without seeding, tiny softness should produce spontaneous coexistence within a narrower window of $\phi$
, consistent with a (metastable) coexistence region in the strict hard-sphere limit where the (stable) phase-separated state is dynamically inaccessible. We now present results that quantify these effects on crystalline structure, inferred coexistence boundaries and osmotic pressure.
$\phi$
, consistent with a (metastable) coexistence region in the strict hard-sphere limit where the (stable) phase-separated state is dynamically inaccessible. We now present results that quantify these effects on crystalline structure, inferred coexistence boundaries and osmotic pressure.
3. Results and discussion
We report measurements of crystal fraction, phase envelope and osmotic pressure for sets of thirteen samples prepared at target volume fractions spanning the MPRHS phase envelope. As detailed in the §§ 1 and 2, and consistent with prior literature, spontaneous equilibrium phase separation is not expected in pristine systems of MPRHS (Frenkel Reference Frenkel1993). The metastability of such systems – whether along the fluid or solid line – would require astronomical time scales to relax, even for extremely large systems (Ten Wolde et al. Reference Ten Wolde, Ruiz-Montero and Frenkel1996).
Instead, we probe this metastable regime by preparing samples very near a metastable line, each containing distinct, spatially distributed crystal seeds. Samples prepared near the metastable fluid line were generated by controlled melting or slow freezing and contained 2 %–4 % distributed crystal nuclei. Samples prepared near the metastable solid line were generated by rapid freezing and contained 84 %–99 % crystalline material. The precise initial crystal fraction, $\zeta _0$
, is reported alongside the data for each final state.
$\zeta _0$
, is reported alongside the data for each final state.
To interrogate Frenkel’s proposed long-range/short-range entropy-exchange mechanism, we designed simulations that isolate both competing contributions. First, the system size – 2000 000 particles – provides substantial configurational (long-range) entropy. Second, we systematically varied particle hardness across four values in the `very hard’ regime to perturb the available short-range vibrational entropy via minute changes in local free volume around slightly deformable particles.
The following sections present structural and thermodynamic results in sequence. Section 3.1 reports structural metrics, most principally crystal fraction, from which we infer the phase envelope in § 3.2. The resulting phase diagram, expressed as osmotic pressure versus volume fraction, is discussed in § 3.3. Section 3.4 examines the effect of particle hardness as a direct test of Frenkel’s mechanistic model, and § 3.5 presents the time evolution of osmotic pressure and crystal fraction. In each case, we emphasise the path dependence of the final system state as a function of the sample preparation route (melting versus freezing).
Snapshots of our Brownian dynamics simulations of the phase behaviour of solvent-suspended colloids. (a) Far left: simulation cell of 2000 000 colloids, replicated periodically into an infinite domain in LAMMPS (Thompson et al. Reference Thompson2022). (b) Second and (c) third images: same system at $2 \times$
and
$2 \times$
and $5 \times$
magnification. Colours correspond to local order, ranging from red for structureless to deep blue for perfect crystal structure. Figure from Wang et al. (Reference Wang, Dhumal, Zakhari and Zia2026), with permission.
$5 \times$
magnification. Colours correspond to local order, ranging from red for structureless to deep blue for perfect crystal structure. Figure from Wang et al. (Reference Wang, Dhumal, Zakhari and Zia2026), with permission.
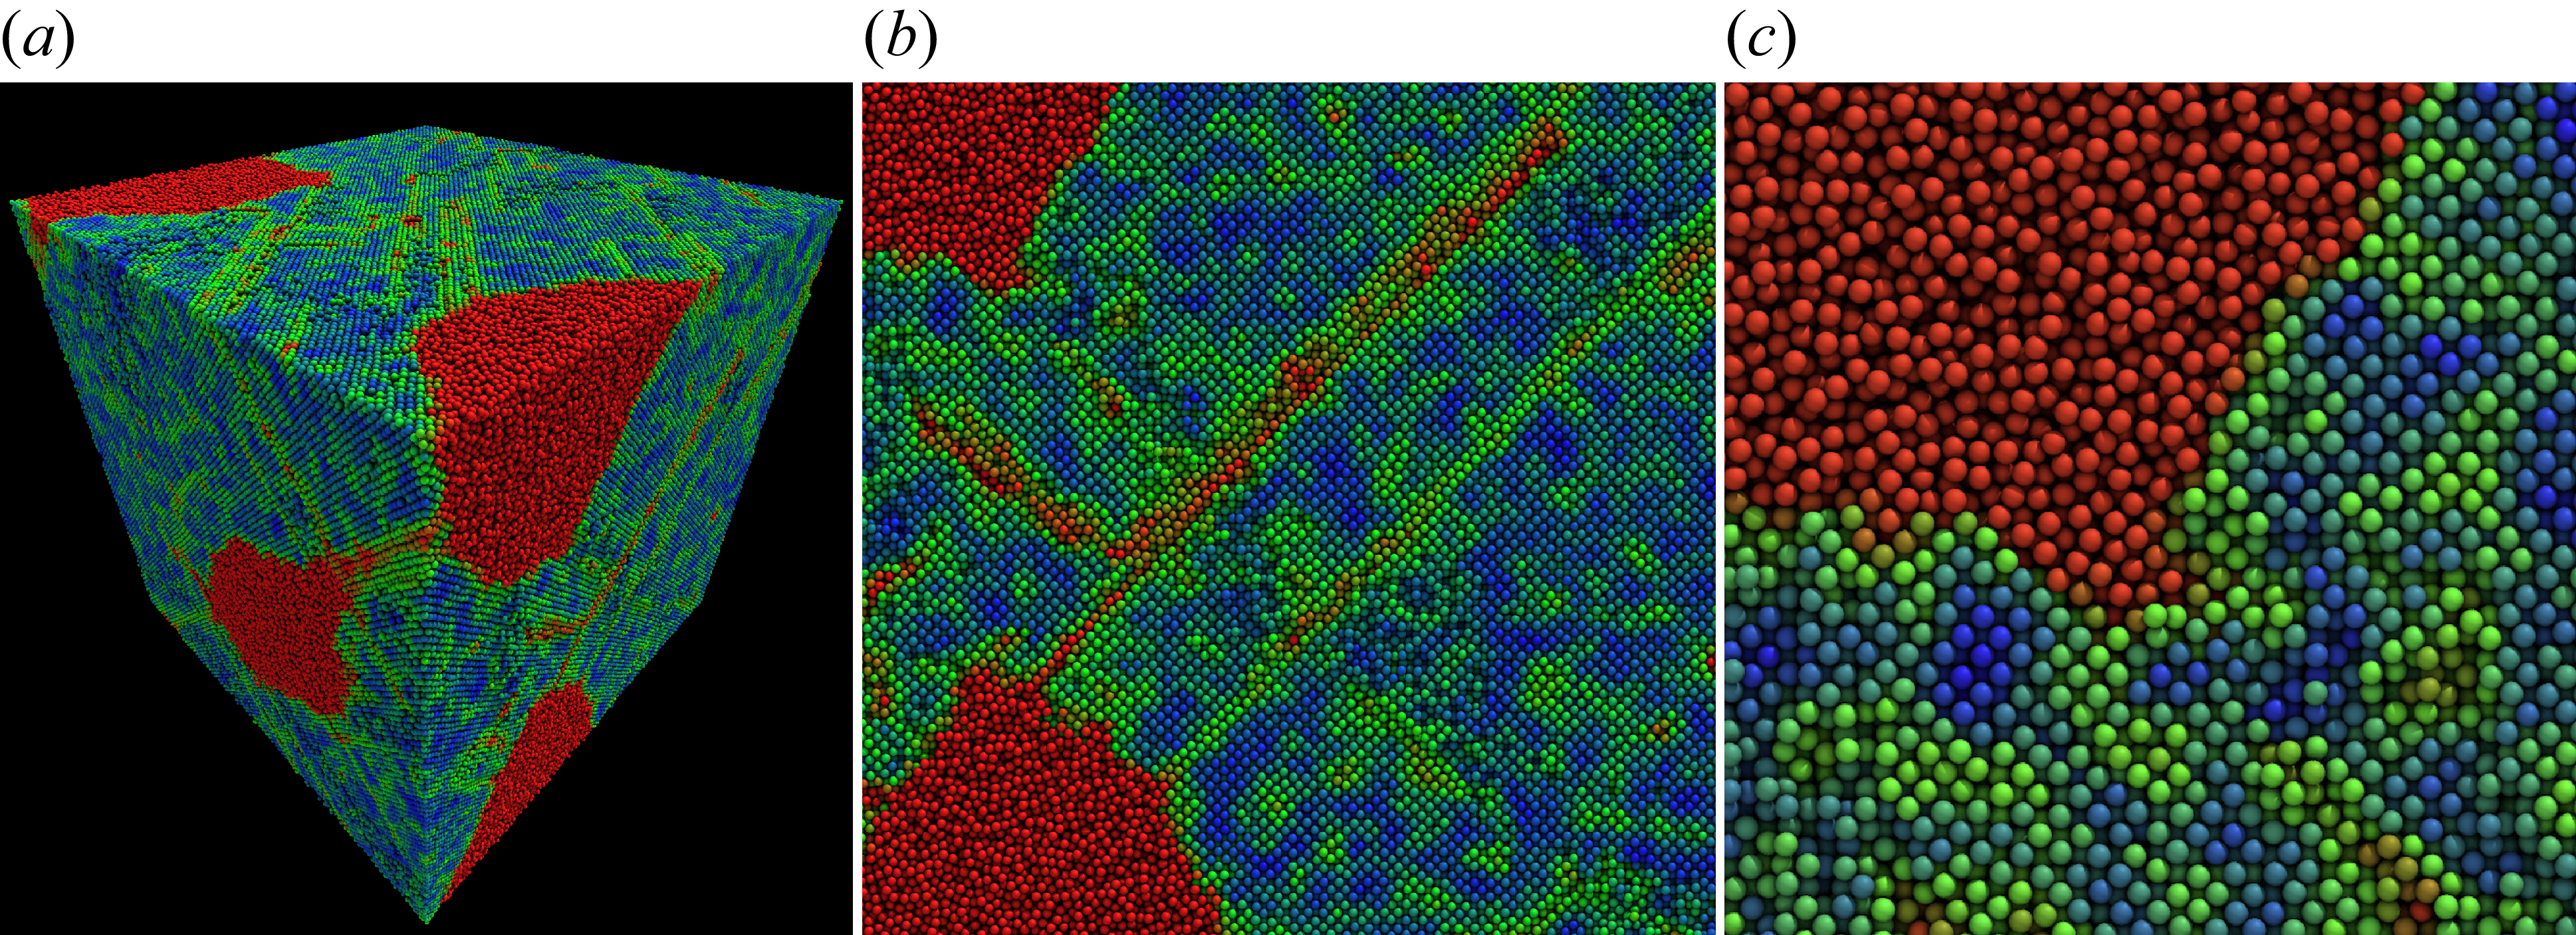
3.1. Structural measurements
Using the computational framework outlined above, we simulated freezing and melting of a colloidal dispersion of very hard spheres with particle hardness parameters $V_0=6kT$
and
$V_0=6kT$
and $\kappa a=30$
, giving the reduced second virial coefficient
$\kappa a=30$
, giving the reduced second virial coefficient $B_2^*=0.985$
(baseline hardness; see Methods). A representative simulation (replicated periodically into an infinite system) is shown in figure 2, which displays the full simulation cell and two zoomed-in views. We began our phase-behaviour analysis by preparing 13 samples at target volume fractions spanning
$B_2^*=0.985$
(baseline hardness; see Methods). A representative simulation (replicated periodically into an infinite system) is shown in figure 2, which displays the full simulation cell and two zoomed-in views. We began our phase-behaviour analysis by preparing 13 samples at target volume fractions spanning $\phi =0.49$
to
$\phi =0.49$
to $\phi =0.55$
using the slow-melting protocol (see Methods). For several cases we also examined quasi-equilibrium melting and fast freezing to probe protocol sensitivity. Each protocol produced a sample that was almost entirely metastable fluid with widely distributed, tiny crystal seeds; the total seed fraction for each sample is indicated in the corresponding plot. The samples at
$\phi =0.55$
using the slow-melting protocol (see Methods). For several cases we also examined quasi-equilibrium melting and fast freezing to probe protocol sensitivity. Each protocol produced a sample that was almost entirely metastable fluid with widely distributed, tiny crystal seeds; the total seed fraction for each sample is indicated in the corresponding plot. The samples at $\phi =0.505$
and
$\phi =0.505$
and $\phi =0.510$
were initially prepared by slow melting and remained metastable fluids for long durations. We then repeated the preparation by first relaxing the system at
$\phi =0.510$
were initially prepared by slow melting and remained metastable fluids for long durations. We then repeated the preparation by first relaxing the system at $\phi =0.515$
(seed fraction
$\phi =0.515$
(seed fraction $\zeta _0=2.12\,\%$
) and subsequently melting down to the target
$\zeta _0=2.12\,\%$
) and subsequently melting down to the target $\phi$
. This quasi-equilibrium path (see Methods) allowed those two samples to phase separate, with the path dependence illustrating the system’s metastability.
$\phi$
. This quasi-equilibrium path (see Methods) allowed those two samples to phase separate, with the path dependence illustrating the system’s metastability.
Simulation images from present study showing particle arrangements for a range of volume fraction $\phi$
and crystal fraction
$\phi$
and crystal fraction $\zeta$
. Particles are coloured according to sixth-order average local-order parameter
$\zeta$
. Particles are coloured according to sixth-order average local-order parameter $\bar {q}_6$
. Particles surrounded by amorphous structure (
$\bar {q}_6$
. Particles surrounded by amorphous structure ( $\bar {q}_6\lt 0.29$
) are coloured pink and made translucent for visibility. Red particles are surrounded by marginally crystalline structure (
$\bar {q}_6\lt 0.29$
) are coloured pink and made translucent for visibility. Red particles are surrounded by marginally crystalline structure ( $\bar {q}_6\approx 0.3$
); green particles are surrounded by substantially crystalline structure (
$\bar {q}_6\approx 0.3$
); green particles are surrounded by substantially crystalline structure ( $\bar {q}_6\approx 0.4$
); and blue particles (
$\bar {q}_6\approx 0.4$
); and blue particles ( $\bar {q}_6\geq 0.5$
) are surrounded by very crystalline structure. Particle hardness set as
$\bar {q}_6\geq 0.5$
) are surrounded by very crystalline structure. Particle hardness set as $V_0=6kT$
and
$V_0=6kT$
and $\kappa a=30$
. All images from samples initially close to the theoretical metastable-fluid line (all using the slow melting protocol, except for
$\kappa a=30$
. All images from samples initially close to the theoretical metastable-fluid line (all using the slow melting protocol, except for $\phi =0.505$
and
$\phi =0.505$
and $\phi =0.51$
that used the quasi-equilibrium melting protocol).
$\phi =0.51$
that used the quasi-equilibrium melting protocol).
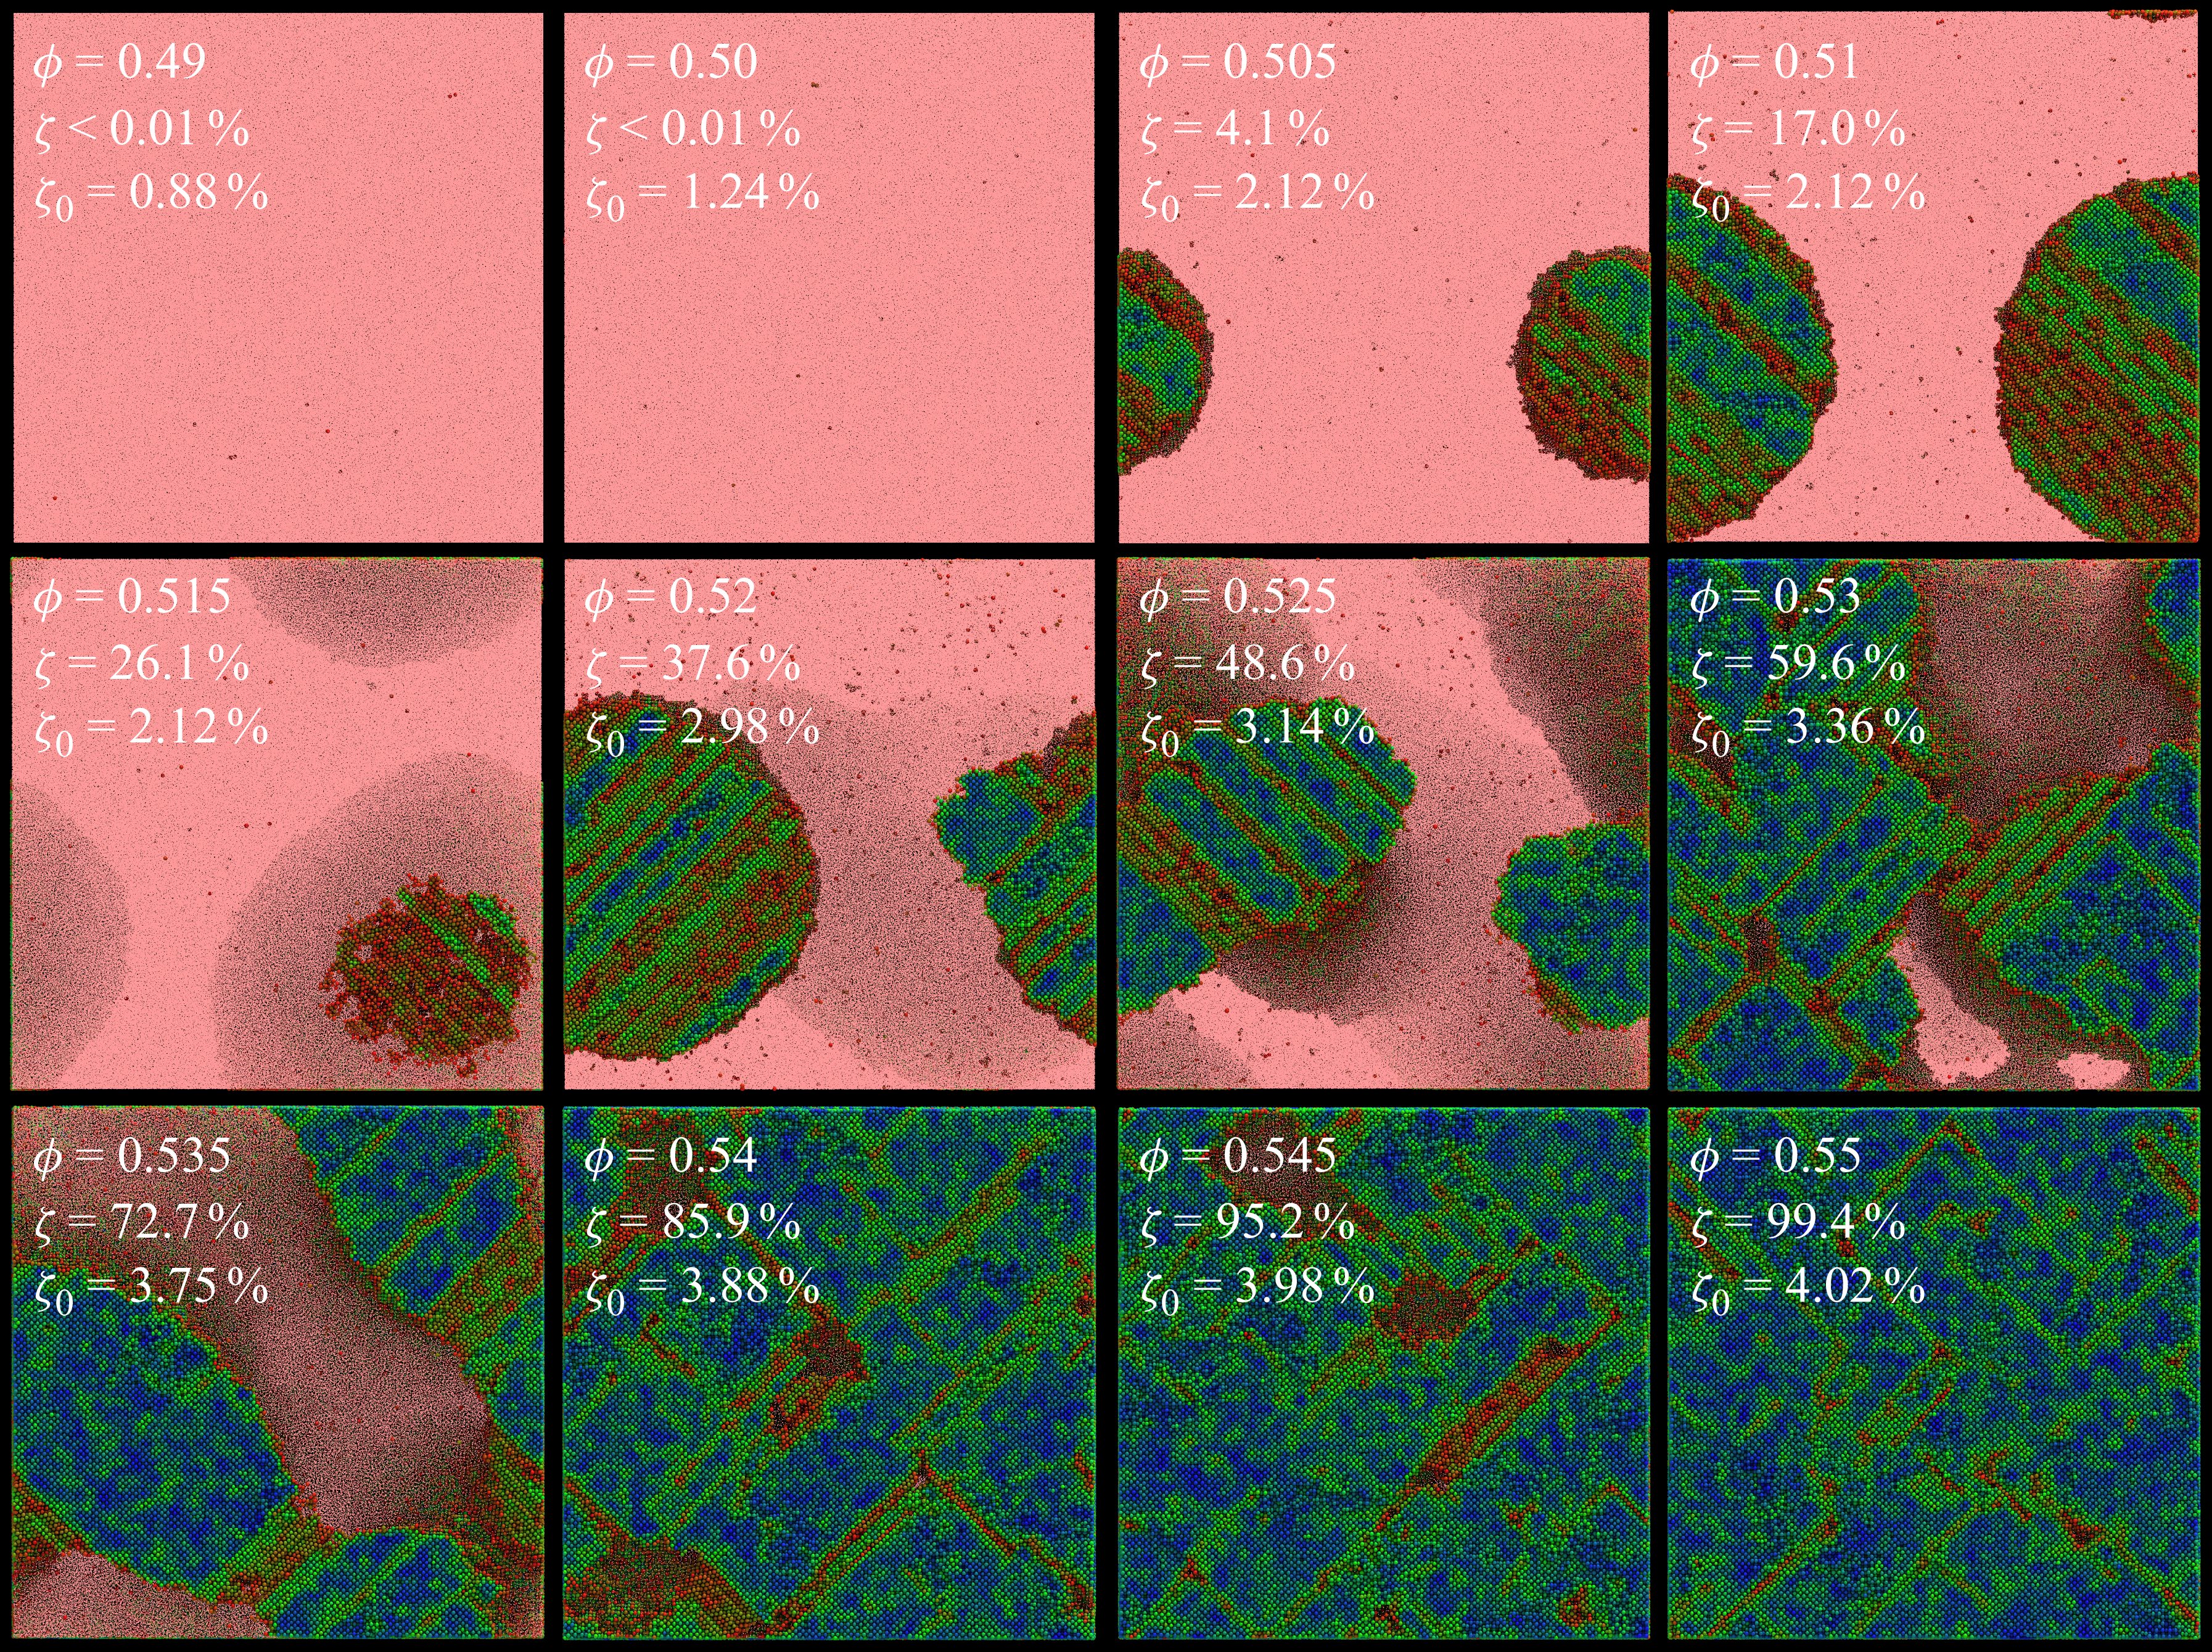
Extent of crystal and fluid-like structure at 12 volume fractions as shown. Total crystal fraction $\zeta$
shown in each plot. The probability P(
$\zeta$
shown in each plot. The probability P( $\bar {q}_6$
) is plotted as a function of the sixth-order average local-order parameter
$\bar {q}_6$
) is plotted as a function of the sixth-order average local-order parameter $\bar {q}_6$
, calculated for each of the 2000 000 particles. Measurement taken at
$\bar {q}_6$
, calculated for each of the 2000 000 particles. Measurement taken at $2000a^2/D$
after achieving target volume fraction. Dotted vertical line marks the boundary between fluid-like structure (
$2000a^2/D$
after achieving target volume fraction. Dotted vertical line marks the boundary between fluid-like structure ( $\bar {q}_6 \lt 0.29$
) and crystalline structure (
$\bar {q}_6 \lt 0.29$
) and crystalline structure ( $\bar {q}_6 \ge 0.29$
). Particle hardness
$\bar {q}_6 \ge 0.29$
). Particle hardness $V_0=6kT$
,
$V_0=6kT$
, $\kappa a=30$
(
$\kappa a=30$
( $B_2^*=0.985$
), cf. figure 1.
$B_2^*=0.985$
), cf. figure 1.
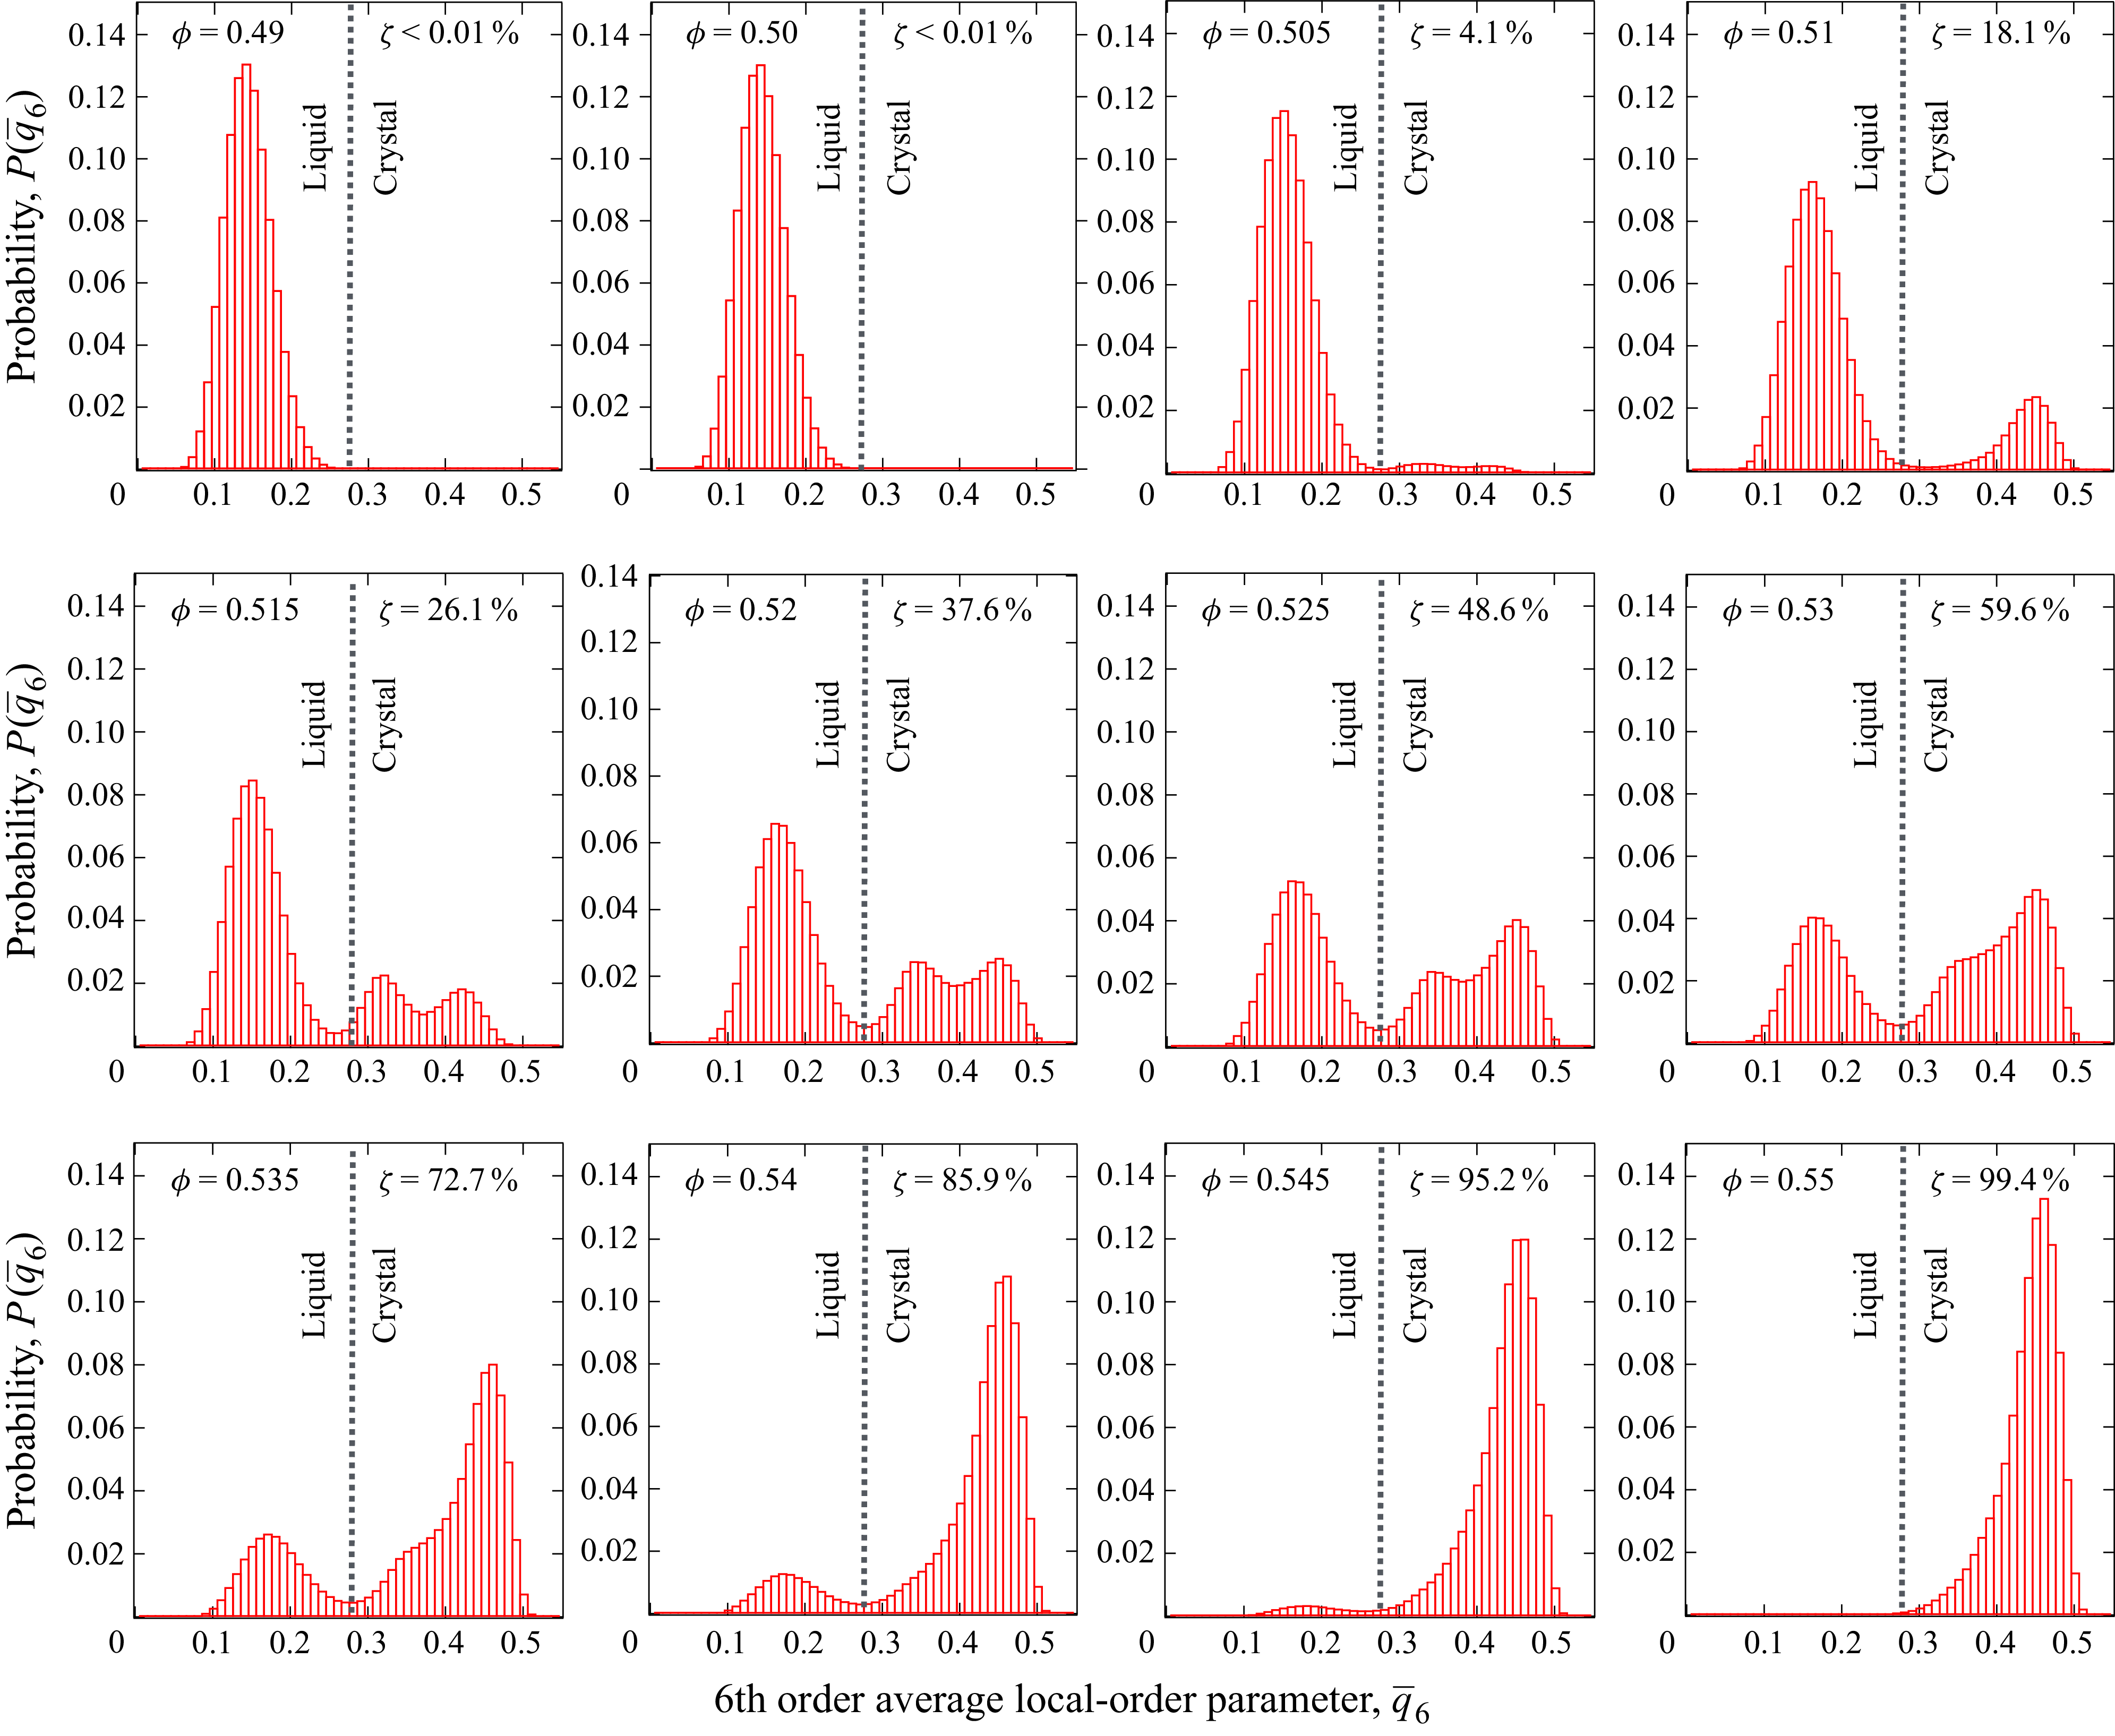
Crystal fraction as a function of volume fraction. Fast freezing ( $\triangle$
), slow freezing (
$\triangle$
), slow freezing ( $\blacktriangle$
), fast melt (
$\blacktriangle$
), fast melt ( $\square$
), slow melt (
$\square$
), slow melt ( $\blacksquare$
) and quasi-equilibrium melting (
$\blacksquare$
) and quasi-equilibrium melting ( $\blacklozenge$
) are shown (see Methods for rates), with the initial crystal seeding fractions also shown in the legend. A linear fit predicts freezing at
$\blacklozenge$
) are shown (see Methods for rates), with the initial crystal seeding fractions also shown in the legend. A linear fit predicts freezing at $\phi =0.503$
and melting at
$\phi =0.503$
and melting at $\phi =0.547$
. Particle hardness parameters
$\phi =0.547$
. Particle hardness parameters $V_0=6kT$
and
$V_0=6kT$
and $\kappa a=30$
(
$\kappa a=30$
( $B_2^*=0.985$
).
$B_2^*=0.985$
).

After each target $\phi$
was reached, we measured the crystal fraction of every sample. A slice from the simulation box for each case is shown in figure 3 together with the final crystal fraction. Particles are coloured by the sixth-order averaged local bond-order parameter
$\phi$
was reached, we measured the crystal fraction of every sample. A slice from the simulation box for each case is shown in figure 3 together with the final crystal fraction. Particles are coloured by the sixth-order averaged local bond-order parameter $\bar {q}_6$
(see Methods). Fluid-like environments yield
$\bar {q}_6$
(see Methods). Fluid-like environments yield $\bar {q}_6\lt 0.29$
and are coloured pink. Values
$\bar {q}_6\lt 0.29$
and are coloured pink. Values $\bar {q}_6\ge 0.29$
indicate crystalline order: marginally crystalline (
$\bar {q}_6\ge 0.29$
indicate crystalline order: marginally crystalline ( $\bar {q}_6\approx 0.30$
, red), substantially crystalline (
$\bar {q}_6\approx 0.30$
, red), substantially crystalline ( $\bar {q}_6\approx 0.40$
, green) and highly crystalline (
$\bar {q}_6\approx 0.40$
, green) and highly crystalline ( $\bar {q}_6\ge 0.50$
, dark blue). The volume fraction
$\bar {q}_6\ge 0.50$
, dark blue). The volume fraction $\phi$
, final crystal fraction
$\phi$
, final crystal fraction $\zeta$
, and initial seed fraction
$\zeta$
, and initial seed fraction $\zeta _0$
are listed on each panel. For each
$\zeta _0$
are listed on each panel. For each $\phi$
,
$\phi$
, $\bar {q}_6$
was monitored for at least
$\bar {q}_6$
was monitored for at least $t\ge 2000\,a^2/D$
, where
$t\ge 2000\,a^2/D$
, where $D=kT/(6\pi \eta a)$
is the single-particle diffusivity. The number of colloids that attain crystalline order is statistically invariant under further Brownian evolution beyond
$D=kT/(6\pi \eta a)$
is the single-particle diffusivity. The number of colloids that attain crystalline order is statistically invariant under further Brownian evolution beyond $1000\,a^2/D$
, and often stabilises earlier (see § 3.5).
$1000\,a^2/D$
, and often stabilises earlier (see § 3.5).
Visual inspection of figure 3 shows no crystalline domains for $\phi \lt 0.505$
. As the dispersion is effectively cooled by increasing
$\phi \lt 0.505$
. As the dispersion is effectively cooled by increasing $\phi$
into the range
$\phi$
into the range $0.505 \le \phi \le 0.520$
, a well-defined crystalline domain emerges within a structureless fluid. Unlike direct-coexistence approaches, here the crystalline domain develops from thermal fluctuations and Brownian motion acting on the initially tiny, distributed seeds. The approximately spherical crystal is consistent with CNT, wherein supercritical nuclei grow once a critical size is exceeded (Volmer & Weber Reference Volmer and Weber1926; Debenedetti Reference Debenedetti1996; Abraham Reference Abraham2012). With further densification to
$0.505 \le \phi \le 0.520$
, a well-defined crystalline domain emerges within a structureless fluid. Unlike direct-coexistence approaches, here the crystalline domain develops from thermal fluctuations and Brownian motion acting on the initially tiny, distributed seeds. The approximately spherical crystal is consistent with CNT, wherein supercritical nuclei grow once a critical size is exceeded (Volmer & Weber Reference Volmer and Weber1926; Debenedetti Reference Debenedetti1996; Abraham Reference Abraham2012). With further densification to $0.525 \le \phi \le 0.545$
, crystalline domains become dominant. At
$0.525 \le \phi \le 0.545$
, crystalline domains become dominant. At $\phi = 0.55$
, the system is fully crystalline. Misaligned crystalline domains separated by grain boundaries are evident, likely reflecting the formation and subsequent impingement of multiple nuclei. Standard equilibrium signatures such as transitions between spherical, cylindrical and slab-like interfacial morphologies are not observed in our simulations, in part because nucleation barriers and finite-time sampling limit access to fully equilibrated interfaces. Instead, we assess proximity to equilibrium using bulk observables: for our hardest particles, the long-time crystal fraction (§ 3.2) and pressure (§ 3.3) closely match theoretical coexistence predictions for hard spheres. This agreement suggests that, despite the persistence of grain boundaries and the absence of morphology fluctuations, the system is sampling states very near the equilibrium coexistence conditions relevant to our study.
$\phi = 0.55$
, the system is fully crystalline. Misaligned crystalline domains separated by grain boundaries are evident, likely reflecting the formation and subsequent impingement of multiple nuclei. Standard equilibrium signatures such as transitions between spherical, cylindrical and slab-like interfacial morphologies are not observed in our simulations, in part because nucleation barriers and finite-time sampling limit access to fully equilibrated interfaces. Instead, we assess proximity to equilibrium using bulk observables: for our hardest particles, the long-time crystal fraction (§ 3.2) and pressure (§ 3.3) closely match theoretical coexistence predictions for hard spheres. This agreement suggests that, despite the persistence of grain boundaries and the absence of morphology fluctuations, the system is sampling states very near the equilibrium coexistence conditions relevant to our study.
The structural composition, quantified by the distribution of $\bar {q}_6$
across all particles, is presented in figure 4. The dotted line at
$\bar {q}_6$
across all particles, is presented in figure 4. The dotted line at $\bar {q}_6=0.29$
separates fluid-like (
$\bar {q}_6=0.29$
separates fluid-like ( $\bar {q}_6\lt 0.29$
) from crystalline (
$\bar {q}_6\lt 0.29$
) from crystalline ( $\bar {q}_6\ge 0.29$
) environments. For
$\bar {q}_6\ge 0.29$
) environments. For $\phi =0.49$
and
$\phi =0.49$
and $\phi =0.50$
, a single peak lies to the left of the threshold, indicating fully fluid structure; the crystal fraction
$\phi =0.50$
, a single peak lies to the left of the threshold, indicating fully fluid structure; the crystal fraction $\zeta$
(upper right of each panel) is less than
$\zeta$
(upper right of each panel) is less than $0.01\,\%$
. At
$0.01\,\%$
. At $\phi =0.505$
, a small crystalline fraction
$\phi =0.505$
, a small crystalline fraction $\zeta =4.1\,\%$
appears, signalling the onset of coexistence. As
$\zeta =4.1\,\%$
appears, signalling the onset of coexistence. As $\phi$
increases beyond
$\phi$
increases beyond $0.505$
, a second peak emerges near
$0.505$
, a second peak emerges near $\bar {q}_6\approx 0.45$
and grows in height. Two distinct peaks – one fluid, one crystal – are observed for
$\bar {q}_6\approx 0.45$
and grows in height. Two distinct peaks – one fluid, one crystal – are observed for $0.505\le \phi \le 0.545$
, with the crystalline peak increasing in prominence in tandem with the measured
$0.505\le \phi \le 0.545$
, with the crystalline peak increasing in prominence in tandem with the measured $\zeta$
.
$\zeta$
.
A third peak is visible only within the coexistence regime. We attribute this feature to interfacial particles located at crystal–fluid boundaries. As $\phi$
increases, this interfacial peak shifts rightward and merges into the crystalline peak, while the fluid peak diminishes and shifts right until it disappears.
$\phi$
increases, this interfacial peak shifts rightward and merges into the crystalline peak, while the fluid peak diminishes and shifts right until it disappears.
3.2. Phase envelopes
The crystal fraction data extracted from figure 4 are plotted in figure 5 as a function of volume fraction. Several data series are shown, corresponding to two freezing protocols (fast and slow) and two melting protocols (fast and slow), as well as a quasi-equilibrium melt. These different preparation routes generate samples either near the theoretical metastable-fluid line or near the theoretical metastable solid line (see Methods). The legend indicates the initial crystal seeding fraction used in each case.
The resulting `phase diagram’ reveals a clear path dependence in the final state for volume fractions within the hard-sphere coexistence region predicted by theory (Hoover & Ree Reference Hoover and Ree1968; Pusey & van Megen Reference Pusey and van Megen1986). Samples prepared near the theoretical metastable solid line (via fast freezing) favour phase separation only for $\phi \le 0.518$
, i.e. closer to the freezing boundary. In contrast, samples prepared near the theoretical metastable-fluid line (via slow freezing or either melting protocol) favour phase separation closer to the melting envelope and well into the coexistence region, for
$\phi \le 0.518$
, i.e. closer to the freezing boundary. In contrast, samples prepared near the theoretical metastable-fluid line (via slow freezing or either melting protocol) favour phase separation closer to the melting envelope and well into the coexistence region, for $\phi \ge 0.514$
; At lower volume fractions, the initial metastable-fluid state persisted without observable phase separation. This contrasting behaviour between fluid- and solid-side preparations is analysed further in the following section on osmotic pressure.
$\phi \ge 0.514$
; At lower volume fractions, the initial metastable-fluid state persisted without observable phase separation. This contrasting behaviour between fluid- and solid-side preparations is analysed further in the following section on osmotic pressure.
For all cases in which phase separation occurs – that is, when the system escapes metastability – the final state becomes path independent. This is evident from the linear alignment of all coexistence data along a single lever-rule line (dashed line in figure 5). A linear fit yields freezing and melting points of $\phi _{{F}} = 0.503$
and
$\phi _{{F}} = 0.503$
and $\phi _{{M}} = 0.547$
, respectively, defining a coexistence region between these limits. Both boundaries lie slightly above the hard-sphere, liquid-state-theory predictions for perfectly hard spheres (
$\phi _{{M}} = 0.547$
, respectively, defining a coexistence region between these limits. Both boundaries lie slightly above the hard-sphere, liquid-state-theory predictions for perfectly hard spheres ( $\phi _{{F}} = 0.494$
,
$\phi _{{F}} = 0.494$
, $\phi _{{M}} = 0.545$
). The origin of this small shift, linked to finite particle hardness and corresponding changes in osmotic pressure, is discussed in the next section.
$\phi _{{M}} = 0.545$
). The origin of this small shift, linked to finite particle hardness and corresponding changes in osmotic pressure, is discussed in the next section.
3.3. Osmotic pressure
Osmotic pressure as a function of volume fraction in experiments, theory and simulations for the baseline nearly hard-sphere case. Present simulations ( $V_0 = 6kT$
,
$V_0 = 6kT$
, $\kappa a = 30$
,
$\kappa a = 30$
, $B_2^\ast = 0.985$
) were prepared near the metastable fluid and crystal lines with initial crystal fraction as shown in the legend, and yield all-fluid, all-crystal and fluid–crystal coexistence states (red and blue circles). Theoretical predictions for the fluid branch (Carnahan & Starling Reference Carnahan and Starling1969) and crystal branch (Hall Reference Hall1972) for truly hard spheres are shown as solid red and blue lines and closely match the corresponding event-driven atomic simulations of Pieprzyk et al. (Reference Pieprzyk, Bannerman, Brańka, Chudak and Heyes2019) (red and blue crosses). Experimental data for nearly hard-sphere colloids (Phan et al. Reference Phan, Russel, Cheng, Zhu, Chaikin, Dunsmuir and Ottewill1996) span coexistence and pure fluid and solid phases (green triangles). Coexistence lines: the present simulation data intersect the metastable branches along the green dashed line; the Hoover–Ree coexistence pressure (Hoover & Ree Reference Hoover and Ree1968) is shown as a black dashed line. The magenta dotted line denotes the coexistence pressure obtained by Pieprzyk et al. (Reference Pieprzyk, Bannerman, Brańka, Chudak and Heyes2019). The pink dotted line indicates the literature-average coexistence pressure compiled by Royall et al. (Reference Royall, Charbonneau, Dijkstra, Russo, Smallenburg, Speck and Valeriani2024), based on multiple previous studies (Speedy Reference Speedy1997; Davidchack & Laird Reference Davidchack and Laird1998; Wilding & Bruce Reference Wilding and Bruce2000; Frenkel & Smit Reference Frenkel and Smit2002; Vega & Noya Reference Vega and Noya2007; Noya et al. Reference Noya, Vega and de Miguel2008; Odriozola Reference Odriozola2009; Zykova-Timan et al. Reference Zykova-Timan, Horbach and Binder2010; Nayhouse et al. Reference Nayhouse, Amlani and Orkoulas2011; Fernández et al. Reference Fernández, Martin-Mayor, Seoane and Verrocchio2012; Ustinov Reference Ustinov2017; Pieprzyk et al. Reference Pieprzyk, Bannerman, Brańka, Chudak and Heyes2019; Moir et al. Reference Moir, Lue and Bannerman2021). The
$B_2^\ast = 0.985$
) were prepared near the metastable fluid and crystal lines with initial crystal fraction as shown in the legend, and yield all-fluid, all-crystal and fluid–crystal coexistence states (red and blue circles). Theoretical predictions for the fluid branch (Carnahan & Starling Reference Carnahan and Starling1969) and crystal branch (Hall Reference Hall1972) for truly hard spheres are shown as solid red and blue lines and closely match the corresponding event-driven atomic simulations of Pieprzyk et al. (Reference Pieprzyk, Bannerman, Brańka, Chudak and Heyes2019) (red and blue crosses). Experimental data for nearly hard-sphere colloids (Phan et al. Reference Phan, Russel, Cheng, Zhu, Chaikin, Dunsmuir and Ottewill1996) span coexistence and pure fluid and solid phases (green triangles). Coexistence lines: the present simulation data intersect the metastable branches along the green dashed line; the Hoover–Ree coexistence pressure (Hoover & Ree Reference Hoover and Ree1968) is shown as a black dashed line. The magenta dotted line denotes the coexistence pressure obtained by Pieprzyk et al. (Reference Pieprzyk, Bannerman, Brańka, Chudak and Heyes2019). The pink dotted line indicates the literature-average coexistence pressure compiled by Royall et al. (Reference Royall, Charbonneau, Dijkstra, Russo, Smallenburg, Speck and Valeriani2024), based on multiple previous studies (Speedy Reference Speedy1997; Davidchack & Laird Reference Davidchack and Laird1998; Wilding & Bruce Reference Wilding and Bruce2000; Frenkel & Smit Reference Frenkel and Smit2002; Vega & Noya Reference Vega and Noya2007; Noya et al. Reference Noya, Vega and de Miguel2008; Odriozola Reference Odriozola2009; Zykova-Timan et al. Reference Zykova-Timan, Horbach and Binder2010; Nayhouse et al. Reference Nayhouse, Amlani and Orkoulas2011; Fernández et al. Reference Fernández, Martin-Mayor, Seoane and Verrocchio2012; Ustinov Reference Ustinov2017; Pieprzyk et al. Reference Pieprzyk, Bannerman, Brańka, Chudak and Heyes2019; Moir et al. Reference Moir, Lue and Bannerman2021). The $V_0 = 6kT$
simulation data shown here are also included in figure 7(b) for comparison with harder particles.
$V_0 = 6kT$
simulation data shown here are also included in figure 7(b) for comparison with harder particles.

We measured the particle-phase osmotic pressure, as described in § 2, throughout the freezing and melting processes and during subsequent equilibration. The resulting values, averaged over all colloids, are plotted in figure 6 for our baseline nearly hard-sphere condition ( $V_0 = 6kT$
,
$V_0 = 6kT$
, $B_2^* = 0.985$
). For comparison, the figure also shows results from purely repulsive hard-sphere (PRHS) experiments (Phan et al. Reference Phan, Russel, Cheng, Zhu, Chaikin, Dunsmuir and Ottewill1996), hard-sphere liquid-state theory (Hoover & Ree Reference Hoover and Ree1968; Carnahan & Starling Reference Carnahan and Starling1969; Hall Reference Hall1972) and EDMD simulations of atomic hard spheres (Pieprzyk et al. Reference Pieprzyk, Bannerman, Brańka, Chudak and Heyes2019). Data from all initial configurations are included: red symbols represent samples prepared near the metastable-fluid line, and blue symbols represent samples prepared near the metastable solid line. The combined measurements yield a fluid branch, a crystal branch and a coexistence tie line obtained directly from coexistence mixtures.
$B_2^* = 0.985$
). For comparison, the figure also shows results from purely repulsive hard-sphere (PRHS) experiments (Phan et al. Reference Phan, Russel, Cheng, Zhu, Chaikin, Dunsmuir and Ottewill1996), hard-sphere liquid-state theory (Hoover & Ree Reference Hoover and Ree1968; Carnahan & Starling Reference Carnahan and Starling1969; Hall Reference Hall1972) and EDMD simulations of atomic hard spheres (Pieprzyk et al. Reference Pieprzyk, Bannerman, Brańka, Chudak and Heyes2019). Data from all initial configurations are included: red symbols represent samples prepared near the metastable-fluid line, and blue symbols represent samples prepared near the metastable solid line. The combined measurements yield a fluid branch, a crystal branch and a coexistence tie line obtained directly from coexistence mixtures.
The intersections of the fluid and crystal branches with the measured coexistence data (filled circles), indicated by the green dashed line in figure 6, correspond to the condition of equal osmotic pressure between phases. From these intersections, our simulations produce a coexistence envelope bounded by $\phi _{{F}} = 0.502$
and
$\phi _{{F}} = 0.502$
and $\phi _{{M}} = 0.550$
. These phase boundaries derived from pressure equality agree closely with those inferred independently from the crystal fraction measurements (cf. figures 4 and 5).
$\phi _{{M}} = 0.550$
. These phase boundaries derived from pressure equality agree closely with those inferred independently from the crystal fraction measurements (cf. figures 4 and 5).
The fluid and crystal branches in figure 6 show strong qualitative agreement with experiments, theory and prior EDMD simulations. Quantitatively, our measured pressures underpredict both the fluid and crystal branches by approximately 3 %–4 %. This systematic offset is similar to that reported in Brownian dynamics simulations by Foss and Brady (Foss & Brady Reference Foss and Brady2000). In contrast, our simulations slightly overpredict the coexistence pressure relative to experimental and theoretical values as well as EDMD results.
In atomic and colloidal systems alike, the osmotic pressure is the thermodynamic variable used to define phase envelopes, typically represented as pressure versus density or packing fraction. The total osmotic pressure consists of the ideal-gas contribution, $nkT$
, arising from the finite-size non-interacting particles, together with contributions from entropic exclusion and higher-order interactions, all of which are built into our simulations. It was therefore unexpected that our initial simulations of very hard spheres (
$nkT$
, arising from the finite-size non-interacting particles, together with contributions from entropic exclusion and higher-order interactions, all of which are built into our simulations. It was therefore unexpected that our initial simulations of very hard spheres ( $V_0 = 6kT$
,
$V_0 = 6kT$
, $B_2^* = 0.985$
) yielded lower metastable-fluid and metastable-crystal pressures than predicted by hard-sphere liquid-state theory for PRHS. We do not interpret this as a discrepancy with existing theory, but as a finite-size, finite-time and finite-softness effect: our systems are large but not in the strict thermodynamic limit, and we use a very steep but still soft Morse potential in place of an ideal hard-sphere interaction. Pushing to larger systems and harder interaction parameters is therefore expected to reduce these finite-size and finite-softness deviations and bring our simulation observables into even closer agreement with standard hard-sphere liquid-state predictions. We also note that liquid-state theoretical approaches can be and have been successfully applied to a wide range of interaction potentials, including Morse-like systems; our aim here is not to challenge those results, but to quantify how nearly hard-sphere colloids behave under our specific kinetic model. Given that our parameter set corresponds to much harder interactions than those typically employed in colloidal simulations, such as the softer WCA potentials used by the Dijkstra and Tanaka groups (Filion et al. Reference Filion, Hermes, Ni and Dijkstra2010, Reference Filion, Ni, Frenkel and Dijkstra2011b
; Tateno et al. Reference Tateno, Yanagishima, Russo and Tanaka2019; Fiorucci et al. Reference Fiorucci, Coli, Padding and Dijkstra2020; Gispen & Dijkstra Reference Gispen and Dijkstra2024), this underprediction implies that particle hardness in our system remains slightly perturbed relative to the pristine PRHS limit. We examine the influence of hardness more systematically in the following section.
$B_2^* = 0.985$
) yielded lower metastable-fluid and metastable-crystal pressures than predicted by hard-sphere liquid-state theory for PRHS. We do not interpret this as a discrepancy with existing theory, but as a finite-size, finite-time and finite-softness effect: our systems are large but not in the strict thermodynamic limit, and we use a very steep but still soft Morse potential in place of an ideal hard-sphere interaction. Pushing to larger systems and harder interaction parameters is therefore expected to reduce these finite-size and finite-softness deviations and bring our simulation observables into even closer agreement with standard hard-sphere liquid-state predictions. We also note that liquid-state theoretical approaches can be and have been successfully applied to a wide range of interaction potentials, including Morse-like systems; our aim here is not to challenge those results, but to quantify how nearly hard-sphere colloids behave under our specific kinetic model. Given that our parameter set corresponds to much harder interactions than those typically employed in colloidal simulations, such as the softer WCA potentials used by the Dijkstra and Tanaka groups (Filion et al. Reference Filion, Hermes, Ni and Dijkstra2010, Reference Filion, Ni, Frenkel and Dijkstra2011b
; Tateno et al. Reference Tateno, Yanagishima, Russo and Tanaka2019; Fiorucci et al. Reference Fiorucci, Coli, Padding and Dijkstra2020; Gispen & Dijkstra Reference Gispen and Dijkstra2024), this underprediction implies that particle hardness in our system remains slightly perturbed relative to the pristine PRHS limit. We examine the influence of hardness more systematically in the following section.
3.4. Hardness, osmotic pressure and the entropy-exchange mechanism
As discussed in § 2.4, the osmotic pressure $\varPi$
of a colloidal suspension can be viewed as the mechanical pressure the particles would exert on a semipermeable boundary that passes solvent but not particles (Zia & Brady Reference Zia and Brady2012; Chu & Zia Reference Chu and Zia2016; Johnson & Zia Reference Johnson and Zia2021; Wang & Zia Reference Wang and Zia2021). Raising the number density increases both
$\varPi$
of a colloidal suspension can be viewed as the mechanical pressure the particles would exert on a semipermeable boundary that passes solvent but not particles (Zia & Brady Reference Zia and Brady2012; Chu & Zia Reference Chu and Zia2016; Johnson & Zia Reference Johnson and Zia2021; Wang & Zia Reference Wang and Zia2021). Raising the number density increases both $\varPi$
and the chemical potential
$\varPi$
and the chemical potential $\mu$
at fixed
$\mu$
at fixed $T$
. Relative to perfectly hard spheres, finite particle hardness (‘softness’) admits tiny overlaps/deformations that increase locally accessible free volume and the number of microstates; for metastable states at a given
$T$
. Relative to perfectly hard spheres, finite particle hardness (‘softness’) admits tiny overlaps/deformations that increase locally accessible free volume and the number of microstates; for metastable states at a given $\phi$
this lowers
$\phi$
this lowers $\varPi$
and enhances metastability.
$\varPi$
and enhances metastability.
This trend appears in fi
gure 6: our nearly hard-sphere data, together with prior colloidal experiments (Phan et al. Reference Phan, Russel, Cheng, Zhu, Chaikin, Dunsmuir and Ottewill1996), lie systematically below hard-sphere liquid-state theory (Carnahan & Starling Reference Carnahan and Starling1969; Hall Reference Hall1972) and EDMD for perfectly hard spheres (Pieprzyk et al. Reference Pieprzyk, Bannerman, Brańka, Chudak and Heyes2019) on the metastable branches. At coexistence, however, the same softness elevates the inferred coexistence pressure. Mechanistically, softness stabilises amorphous (fluid-like) local structure within the coexistence region by adding short-range (vibrational) entropy, reducing the needed gain in short-range entropy from ordered (crystalline) structure; to satisfy $\mu _{\textit{fluid}}=\mu _{\textit{solid}}$
, a higher
$\mu _{\textit{fluid}}=\mu _{\textit{solid}}$
, a higher $\varPi$
is then required than in the strict hard-sphere limit. Thus softness lowers metastable
$\varPi$
is then required than in the strict hard-sphere limit. Thus softness lowers metastable $\varPi (\phi )$
but raises
$\varPi (\phi )$
but raises $\varPi _{{coex}}$
, reconciling the two observations.
$\varPi _{{coex}}$
, reconciling the two observations.
Following Gispen et al. (Gispen & Dijkstra Reference Gispen and Dijkstra2024), the isothermal `over-pressure’
 \begin{align} \Delta \varPi (\phi ) \equiv \varPi (\phi )-\varPi _{{coex}} \end{align}
maps to the nucleation driving force via the Gibbs–Duhem relation ${\rm d}\mu = {\rm d}\varPi /n$
. They report a reduced
${\rm d}\mu = {\rm d}\varPi /n$
. They report a reduced $\Delta \varPi$
on the solid branch, which they associate with proximity to a spinodal (superheat) limit (Wang et al. Reference Wang, Wang, Peng, Zheng and Han2018), implying a smaller driving force for melting than for crystallisation. This framework is consistent with the softness-induced shifts we observe in both metastable and coexistence pressures.
$\Delta \varPi$
on the solid branch, which they associate with proximity to a spinodal (superheat) limit (Wang et al. Reference Wang, Wang, Peng, Zheng and Han2018), implying a smaller driving force for melting than for crystallisation. This framework is consistent with the softness-induced shifts we observe in both metastable and coexistence pressures.
We speculate that the observed over-pressure condition explains why the coexistence line predicted for our softest particles ( $V_0=6kT$
,
$V_0=6kT$
, $B_2^*=0.985$
) in figure 6 slopes downward at higher volume fractions toward the theoretical value. This behaviour reflects an interplay between the over-pressure condition that increases with
$B_2^*=0.985$
) in figure 6 slopes downward at higher volume fractions toward the theoretical value. This behaviour reflects an interplay between the over-pressure condition that increases with $\phi$
and finite particle hardness. Stronger over-pressure favours sampling of periodic, ordered structures and greater short-range (vibrational) entropy, whereas finite hardness allows small deformations that increase configurational freedom and long-range entropy. For particles with
$\phi$
and finite particle hardness. Stronger over-pressure favours sampling of periodic, ordered structures and greater short-range (vibrational) entropy, whereas finite hardness allows small deformations that increase configurational freedom and long-range entropy. For particles with $V_0=6kT$
(
$V_0=6kT$
( $B_2^*=0.985$
), at lower
$B_2^*=0.985$
), at lower $\phi$
(e.g.
$\phi$
(e.g. $\phi =0.505$
) the over-pressure is weaker than the particles’ deformability, favouring retention of fluid-like structure and resulting in an overall higher coexistence pressure than hard-sphere theory, which predicts a larger crystal fraction. At higher volume fraction (e.g.
$\phi =0.505$
) the over-pressure is weaker than the particles’ deformability, favouring retention of fluid-like structure and resulting in an overall higher coexistence pressure than hard-sphere theory, which predicts a larger crystal fraction. At higher volume fraction (e.g. $\phi =0.54$
), the elevated over-pressure dominates finite-hardness effects, yielding a crystal fraction and pressure close to hard-sphere theory predictions. Consistent with Gispen et al. (Gispen & Dijkstra Reference Gispen and Dijkstra2024), the system most closely approaches the theoretical coexistence tie line of Hoover and Ree (Reference Hoover and Ree1968) near the melting point.
$\phi =0.54$
), the elevated over-pressure dominates finite-hardness effects, yielding a crystal fraction and pressure close to hard-sphere theory predictions. Consistent with Gispen et al. (Gispen & Dijkstra Reference Gispen and Dijkstra2024), the system most closely approaches the theoretical coexistence tie line of Hoover and Ree (Reference Hoover and Ree1968) near the melting point.
This mechanistic perspective also clarifies the path dependence of the final state, illustrated in figure 5. Samples prepared near the metastable-fluid line remain metastable for $\phi \le 0.514$
due to weak over-pressure but phase separate for
$\phi \le 0.514$
due to weak over-pressure but phase separate for $\phi \ge 0.515$
. Conversely, samples prepared near the metastable-crystal line experience strong over-pressure at low
$\phi \ge 0.515$
. Conversely, samples prepared near the metastable-crystal line experience strong over-pressure at low $\phi$
and weak excess pressure at high
$\phi$
and weak excess pressure at high $\phi$
; thus, the opposite trend arises: phase separation occurs readily for
$\phi$
; thus, the opposite trend arises: phase separation occurs readily for $\phi \le 0.518$
, whereas systems remain metastable crystals for
$\phi \le 0.518$
, whereas systems remain metastable crystals for $\phi \ge 0.52$
.
$\phi \ge 0.52$
.
Impact of increasing particle hardness on phase behaviour. (a) Crystal fraction as a function of volume fraction for systems with progressively harder purely repulsive Morse potentials ((2.1), with $V_0 = 6kT$
(green circles),
$V_0 = 6kT$
(green circles), $15kT$
(blue squares),
$15kT$
(blue squares), $30kT$
(magenta triangles) and
$30kT$
(magenta triangles) and $60kT$
(orange diamonds), as indicated in the legend. All samples were prepared near the metastable-fluid line (see Methods). Open symbols correspond to the melting protocol on Brownian time scales, and filled symbols to the quasi-equilibrium protocol. Solid lines are linear fits to the coexistence state for each hardness, indicating the inferred coexistence tie lines. (b) Osmotic pressure versus volume fraction for the same systems. New simulation data for increased hardness (coloured symbols) are shown alongside the baseline
$60kT$
(orange diamonds), as indicated in the legend. All samples were prepared near the metastable-fluid line (see Methods). Open symbols correspond to the melting protocol on Brownian time scales, and filled symbols to the quasi-equilibrium protocol. Solid lines are linear fits to the coexistence state for each hardness, indicating the inferred coexistence tie lines. (b) Osmotic pressure versus volume fraction for the same systems. New simulation data for increased hardness (coloured symbols) are shown alongside the baseline $V_0 = 6kT$
case from figure 6, experimental data (Phan et al. Reference Phan, Russel, Cheng, Zhu, Chaikin, Dunsmuir and Ottewill1996), theoretical predictions (Hoover & Ree Reference Hoover and Ree1968; Carnahan & Starling Reference Carnahan and Starling1969; Hall Reference Hall1972), event-driven molecular dynamics simulations and literature-average coexistence pressures (Pieprzyk et al. Reference Pieprzyk, Bannerman, Brańka, Chudak and Heyes2019; Royall et al. Reference Royall, Charbonneau, Dijkstra, Russo, Smallenburg, Speck and Valeriani2024) and references therein), as in figure 6. This panel thus extends figure 6 by comparing the baseline nearly hard-sphere case with progressively harder particles.
$V_0 = 6kT$
case from figure 6, experimental data (Phan et al. Reference Phan, Russel, Cheng, Zhu, Chaikin, Dunsmuir and Ottewill1996), theoretical predictions (Hoover & Ree Reference Hoover and Ree1968; Carnahan & Starling Reference Carnahan and Starling1969; Hall Reference Hall1972), event-driven molecular dynamics simulations and literature-average coexistence pressures (Pieprzyk et al. Reference Pieprzyk, Bannerman, Brańka, Chudak and Heyes2019; Royall et al. Reference Royall, Charbonneau, Dijkstra, Russo, Smallenburg, Speck and Valeriani2024) and references therein), as in figure 6. This panel thus extends figure 6 by comparing the baseline nearly hard-sphere case with progressively harder particles.

Considering finite-hardness particles diffusing within a fictitious enclosure, increasing hardness raises osmotic pressure; beyond a critical threshold, structural rearrangement into a crystalline phase reduces osmotic pressure and increases local entropy. To examine this relationship, we systematically increased hardness to $V_0 = 15kT$
,
$V_0 = 15kT$
, $30kT$
and
$30kT$
and $60kT$
, corresponding to reduced second virial coefficients
$60kT$
, corresponding to reduced second virial coefficients $B_2^* = 0.990$
,
$B_2^* = 0.990$
, $0.993$
and
$0.993$
and $0.995$
, respectively. Figure 7(a) shows that, as particle hardness approaches the true hard-sphere limit, the predicted freezing and melting points converge toward theoretical values. For the freezing point,
$0.995$
, respectively. Figure 7(a) shows that, as particle hardness approaches the true hard-sphere limit, the predicted freezing and melting points converge toward theoretical values. For the freezing point, $\phi _{\mathrm{F}} = 0.500$
(
$\phi _{\mathrm{F}} = 0.500$
( $V_0 = 15kT$
),
$V_0 = 15kT$
), $0.499$
(
$0.499$
( $30kT$
) and
$30kT$
) and $0.497$
(
$0.497$
( $60kT$
); for the melting point,
$60kT$
); for the melting point, $\phi _{{M}} = 0.544$
,
$\phi _{{M}} = 0.544$
, $0.542$
and
$0.542$
and $0.541$
, respectively. Increased hardness also facilitated phase separation: with identical starting configurations, systems of harder particles exhibited phase coexistence across a broader portion of the theoretical coexistence region (see § 3.5).
$0.541$
, respectively. Increased hardness also facilitated phase separation: with identical starting configurations, systems of harder particles exhibited phase coexistence across a broader portion of the theoretical coexistence region (see § 3.5).
Figure 7(b) presents the osmotic pressure for these systems. At each $\phi$
, samples were prepared near the fluid metastable line (as in figure 5), with corresponding initial crystal fractions shown in figure 3. Particle hardness was then set to one of the four values indicated, and simulation commenced. As expected, increased hardness raised the osmotic pressure of metastable states at all volume fractions, with the hardest samples approaching the purely hard-sphere values from hard-sphere liquid-state theory. As discussed above, greater hardness reduces amorphous configurations and long-range entropy, thereby promoting phase separation. This effect is particularly pronounced at low
$\phi$
, samples were prepared near the fluid metastable line (as in figure 5), with corresponding initial crystal fractions shown in figure 3. Particle hardness was then set to one of the four values indicated, and simulation commenced. As expected, increased hardness raised the osmotic pressure of metastable states at all volume fractions, with the hardest samples approaching the purely hard-sphere values from hard-sphere liquid-state theory. As discussed above, greater hardness reduces amorphous configurations and long-range entropy, thereby promoting phase separation. This effect is particularly pronounced at low $\phi$
(e.g.
$\phi$
(e.g. $\phi = 0.505$
), where coexistence pressures approach theoretical predictions as hardness increases. The resulting coexistence line flattens and converges toward the Hoover–Ree theoretical tie line as the particles approach the truly hard-sphere limit.
$\phi = 0.505$
), where coexistence pressures approach theoretical predictions as hardness increases. The resulting coexistence line flattens and converges toward the Hoover–Ree theoretical tie line as the particles approach the truly hard-sphere limit.
In summary, simulations initiated with particle hardness $V_0 = 6kT$
(
$V_0 = 6kT$
( $B_2^* = 0.985$
) intended to represent very hard spheres and 2 %–4 % distributed crystal seeding produced phase separation consistent with prior studies but underpredicted metastable fluid and solid pressures. We attribute this discrepancy to finite particle softness. Increasing hardness toward the truly hard-sphere limit restored closer agreement with theoretical metastable and coexistence pressures and improved prediction of the phase envelope, yielding explicit phase separation in finite time. Hardening of already very hard particles increased the probability of phase separation, opposite the trend for soft particles modelled via WCA potential (
$B_2^* = 0.985$
) intended to represent very hard spheres and 2 %–4 % distributed crystal seeding produced phase separation consistent with prior studies but underpredicted metastable fluid and solid pressures. We attribute this discrepancy to finite particle softness. Increasing hardness toward the truly hard-sphere limit restored closer agreement with theoretical metastable and coexistence pressures and improved prediction of the phase envelope, yielding explicit phase separation in finite time. Hardening of already very hard particles increased the probability of phase separation, opposite the trend for soft particles modelled via WCA potential ( $B_2^* \lessapprox 0.8$
), where further softening lowers the phase envelope (Hermes et al. Reference Hermes, Vermolen, Leunissen, Vossen, Van Oostrum, Dijkstra and Van Blaaderen2011; Filion et al. Reference Filion, Ni, Frenkel and Dijkstra2011b
; Tateno et al. Reference Tateno, Yanagishima, Russo and Tanaka2019; Fiorucci et al. Reference Fiorucci, Coli, Padding and Dijkstra2020; Gispen & Dijkstra Reference Gispen and Dijkstra2024). For soft particles, rearrangements of the order of a particle diameter promote crystallisation; in contrast, in the extremely hard-sphere regime, crystallisation requires high pressures to drive short-range particle motion.
$B_2^* \lessapprox 0.8$
), where further softening lowers the phase envelope (Hermes et al. Reference Hermes, Vermolen, Leunissen, Vossen, Van Oostrum, Dijkstra and Van Blaaderen2011; Filion et al. Reference Filion, Ni, Frenkel and Dijkstra2011b
; Tateno et al. Reference Tateno, Yanagishima, Russo and Tanaka2019; Fiorucci et al. Reference Fiorucci, Coli, Padding and Dijkstra2020; Gispen & Dijkstra Reference Gispen and Dijkstra2024). For soft particles, rearrangements of the order of a particle diameter promote crystallisation; in contrast, in the extremely hard-sphere regime, crystallisation requires high pressures to drive short-range particle motion.
We compare these findings with the truly hard-sphere simulations of Pieprzyk et al. (Reference Pieprzyk, Bannerman, Brańka, Chudak and Heyes2019), which did not show explicit phase separation but reproduced the hard-sphere liquid-state phase envelope and deduced the coexistence line from the chemical potential. Our extremely hard-sphere systems exhibited explicit phase separation in finite time but displayed slight over- and under-predictions driven by residual finite hardness. Two factors likely explain the differing outcomes. First, simulation methodology: for a given potential and ensemble, both EDMD and Brownian dynamics (BD) converge to the same Boltzmann distribution at equilibrium, and we do not suggest otherwise. Our point is kinetic: starting from a metastable fluid (or metastable crystal), the rate and pathway of phase separation (nucleation, growth, and coarsening) can differ significantly between EDMD and BD because the underlying dynamics is fundamentally different (ballistic, momentum conserving versus overdamped, stochastic). As a result, whether phase separation is actually observed within accessible simulation times can differ between EDMD and BD, even at identical thermodynamic state points. Second, crystal seeding: distributed seeding in our BD simulations perturbs metastability and accelerates phase separation, whereas the absence of such perturbations in the EDMD study of Pieprzyk et al. maintains metastability.
To isolate the effect of hardness, we next tested whether increasing $V_0$
alone – without any crystal seeding – could destabilise the metastable state. This test provides a direct demonstration of Frenkel’s mechanistic model of phase separation in MPRHS, wherein short-range vibrational entropy increases with minimal perturbation of particle hardness. We focused on the very-hard regime to exclude mechanisms associated with soft-particle phase shifts (Hermes et al. Reference Hermes, Vermolen, Leunissen, Vossen, Van Oostrum, Dijkstra and Van Blaaderen2011; Filion et al. Reference Filion, Ni, Frenkel and Dijkstra2011b
; Tateno et al. Reference Tateno, Yanagishima, Russo and Tanaka2019; Fiorucci et al. Reference Fiorucci, Coli, Padding and Dijkstra2020; Gispen & Dijkstra Reference Gispen and Dijkstra2024).
$V_0$
alone – without any crystal seeding – could destabilise the metastable state. This test provides a direct demonstration of Frenkel’s mechanistic model of phase separation in MPRHS, wherein short-range vibrational entropy increases with minimal perturbation of particle hardness. We focused on the very-hard regime to exclude mechanisms associated with soft-particle phase shifts (Hermes et al. Reference Hermes, Vermolen, Leunissen, Vossen, Van Oostrum, Dijkstra and Van Blaaderen2011; Filion et al. Reference Filion, Ni, Frenkel and Dijkstra2011b
; Tateno et al. Reference Tateno, Yanagishima, Russo and Tanaka2019; Fiorucci et al. Reference Fiorucci, Coli, Padding and Dijkstra2020; Gispen & Dijkstra Reference Gispen and Dijkstra2024).
Additional simulations with 0 % crystal seeding were therefore performed at the metastable lines, comparing phase behaviour for very hard ( $6kT$
,
$6kT$
, $B_2^* = 0.985$
) and the hardest (
$B_2^* = 0.985$
) and the hardest ( $60kT$
,
$60kT$
, $B_2^* = 0.995$
) spheres. Spontaneous phase separation occurred for
$B_2^* = 0.995$
) spheres. Spontaneous phase separation occurred for $\phi \ge 0.54$
in the
$\phi \ge 0.54$
in the $6kT$
system (figure 8) and for
$6kT$
system (figure 8) and for $\phi \ge 0.535$
in the
$\phi \ge 0.535$
in the $60kT$
system (figure 9). Eliminating crystal seeding narrowed the observable coexistence window, but at fixed seeding fraction of zero, increasing hardness broadened this range. It is gratifying to observe spontaneous, equilibrium phase separation in a colloidal simulation with no crystal seeding, a nice demonstration of Frenkel’s proposed mechanism of entropy-driven phase separation in MPRHS, where short-range vibrational entropy is enhanced by minimally perturbed particle hardness.
$60kT$
system (figure 9). Eliminating crystal seeding narrowed the observable coexistence window, but at fixed seeding fraction of zero, increasing hardness broadened this range. It is gratifying to observe spontaneous, equilibrium phase separation in a colloidal simulation with no crystal seeding, a nice demonstration of Frenkel’s proposed mechanism of entropy-driven phase separation in MPRHS, where short-range vibrational entropy is enhanced by minimally perturbed particle hardness.
Phase behaviour without crystal seeding. Simulation snapshots for samples with particles of hardness $V_0 = 6kT$
(
$V_0 = 6kT$
( $B_2^* = 0.985$
) initially on the metastable-fluid line (
$B_2^* = 0.985$
) initially on the metastable-fluid line ( $\zeta _0 \lt 0.01\,\%$
), showing spontaneous phase separation after
$\zeta _0 \lt 0.01\,\%$
), showing spontaneous phase separation after $2000\,a^2/D$
. Particles are coloured by the sixth-order average local-order parameter
$2000\,a^2/D$
. Particles are coloured by the sixth-order average local-order parameter $\bar {q}_6$
, as in figure 3.
$\bar {q}_6$
, as in figure 3.

Phase behaviour without crystal seeding. Simulation snapshots for samples with particles of hardness $V_0 = 60kT$
(
$V_0 = 60kT$
( $B_2^* = 0.995$
) initially on the metastable-fluid line (
$B_2^* = 0.995$
) initially on the metastable-fluid line ( $\zeta _0 \lt 0.01\,\%$
), showing spontaneous phase separation after
$\zeta _0 \lt 0.01\,\%$
), showing spontaneous phase separation after $2000\,a^2/D$
. Particles are coloured by the sixth-order average local-order parameter
$2000\,a^2/D$
. Particles are coloured by the sixth-order average local-order parameter $\bar {q}_6$
, as in figure 3.
$\bar {q}_6$
, as in figure 3.

3.5. Time evolution of osmotic pressure and crystal fraction
Time evolution of osmotic pressure for particles of hardness $V_0=60kT$
(
$V_0=60kT$
( $B_2^*=0.995$
), over a duration of
$B_2^*=0.995$
), over a duration of $4000 a^2/D$
. For visual clarity, not all volume fractions are represented in the figure.
$4000 a^2/D$
. For visual clarity, not all volume fractions are represented in the figure.

Time evolution of osmotic pressure and crystal fraction for three values of particle hardness as indicated in each plot, and for several volume fractions as indicated in the legend. Time is scaled on single-particle Brownian diffusion. Top row: osmotic pressure (scaled on the single-particle osmotic pressure), for (a) $V_0=15kT$
(
$V_0=15kT$
( $B_2^*=0.990$
), (b)
$B_2^*=0.990$
), (b) $V_0=30kT$
(
$V_0=30kT$
( $B_2^*=0.993$
) and (c)
$B_2^*=0.993$
) and (c) $V_0=60kT$
(
$V_0=60kT$
( $B_2^*=0.995$
). Bottom row: crystal fraction, for (d)
$B_2^*=0.995$
). Bottom row: crystal fraction, for (d) $V_0=15kT$
(
$V_0=15kT$
( $B_2^*=0.990$
), (e)
$B_2^*=0.990$
), (e) $V_0=30kT$
(
$V_0=30kT$
( $B_2^*=0.993$
) and (f)
$B_2^*=0.993$
) and (f) $V_0=60kT$
(
$V_0=60kT$
( $B_2^*=0.995$
).
$B_2^*=0.995$
).

Finite particle hardness evidently introduces kinetic effects during the transition from metastable states to the final phase-separated state. We examined how these kinetics depend on particle hardness by monitoring the time evolution of osmotic pressure and crystal fraction for each hardness studied. Figure 10 shows the temporal evolution of pressure after initialisation near the metastable line for our hardest particles ( $V_0 = 60kT$
,
$V_0 = 60kT$
, $B_2^* = 0.995$
). Each sample was monitored for at least
$B_2^* = 0.995$
). Each sample was monitored for at least $2000\,a^2/D$
. Near the freezing point (
$2000\,a^2/D$
. Near the freezing point ( $0.49 \le \phi \le 0.505$
), the osmotic pressure decays almost instantaneously to its final equilibrium value, indicating that these initial configurations are already close to the final fluid state. For samples deeper into the coexistence and crystalline regions (
$0.49 \le \phi \le 0.505$
), the osmotic pressure decays almost instantaneously to its final equilibrium value, indicating that these initial configurations are already close to the final fluid state. For samples deeper into the coexistence and crystalline regions ( $0.51 \le \phi \le 0.55$
), where phase separation proceeds, the pressure exhibits an initial steep drop followed by a slower long-time decay. This two-stage relaxation is consistent with CNT, which describes crystallisation as a process overcoming an activation barrier (Volmer & Weber Reference Volmer and Weber1926). The activation process is most clearly manifested at
$0.51 \le \phi \le 0.55$
), where phase separation proceeds, the pressure exhibits an initial steep drop followed by a slower long-time decay. This two-stage relaxation is consistent with CNT, which describes crystallisation as a process overcoming an activation barrier (Volmer & Weber Reference Volmer and Weber1926). The activation process is most clearly manifested at $\phi = 0.51$
, where a brief shoulder in the curve indicates transient residence in the metastable state before rapid pressure decay as phase separation begins. Simulations extended to
$\phi = 0.51$
, where a brief shoulder in the curve indicates transient residence in the metastable state before rapid pressure decay as phase separation begins. Simulations extended to $4000\,a^2/D$
revealed no further change in the mean osmotic pressure, confirming that steady state was achieved by
$4000\,a^2/D$
revealed no further change in the mean osmotic pressure, confirming that steady state was achieved by $2000\,a^2/D$
.
$2000\,a^2/D$
.
We next investigated the influence of particle hardness on the temporal evolution of both osmotic pressure and crystal fraction, using samples prepared near the metastable line with minimal crystal seeding. Figure 11 presents the evolution of osmotic pressure (top row) and crystal fraction (bottom row) for $V_0 = 15kT$
,
$V_0 = 15kT$
, $30kT$
and
$30kT$
and $60kT$
. At each hardness, the long-time pressure plateau coincides with the saturation of the crystal fraction, consistent with CNT’s depiction of crystallisation as an activated process.
$60kT$
. At each hardness, the long-time pressure plateau coincides with the saturation of the crystal fraction, consistent with CNT’s depiction of crystallisation as an activated process.
Increasing particle hardness accelerates crystal growth. This trend is highlighted for $\phi = 0.51$
in figure 11 (bold curves). The onset of crystal nucleation is identified by the intersection of a tangent drawn through the initial growth regime with the time axis, while the completion time – corresponding to attainment of the equilibrium crystal fraction – is marked by the intersection between the growth-regime tangent and the long-time plateau tangent. Comparing panels (d), (e) and (f), both the onset and completion times decrease as particle hardness increases, confirming that systems of harder particles crystallise more readily. This observation aligns with the mechanistic picture outlined above: increasing hardness reduces available free volume, promoting crystalline order and enhancing short-range entropy, whereas reduced hardness expands free volume, providing additional configurations and greater long-range entropy. Harder particles also intensify the over-pressure driving force (cf. § 3.3), thereby facilitating faster phase separation.
$\phi = 0.51$
in figure 11 (bold curves). The onset of crystal nucleation is identified by the intersection of a tangent drawn through the initial growth regime with the time axis, while the completion time – corresponding to attainment of the equilibrium crystal fraction – is marked by the intersection between the growth-regime tangent and the long-time plateau tangent. Comparing panels (d), (e) and (f), both the onset and completion times decrease as particle hardness increases, confirming that systems of harder particles crystallise more readily. This observation aligns with the mechanistic picture outlined above: increasing hardness reduces available free volume, promoting crystalline order and enhancing short-range entropy, whereas reduced hardness expands free volume, providing additional configurations and greater long-range entropy. Harder particles also intensify the over-pressure driving force (cf. § 3.3), thereby facilitating faster phase separation.
4. Conclusions
Entropically driven fluid–solid transitions in MPRHS are firmly established: distinct phases, phase envelopes and freezing and melting points have been predicted and observed across liquid-state theory, simulations and experiments. The same framework implies a fluid–solid coexistence region in MPRHS that must be purely entropic in origin. Frenkel proposed a mechanistic basis for this in systems lacking polydispersity or anisotropy, arguing that crystallisation trades long-range configurational entropy for short-range vibrational entropy (Frenkel Reference Frenkel1993). The present work shows how this entropy-exchange picture can be made operational in large-scale simulations that explicitly realise and interrogate phase behaviour in nearly hard-sphere colloids.
Decades of simulations that nominally match the MPRHS model nonetheless struggle to produce spontaneous, long-lived fluid–crystal coexistence from unbiased homogeneous states: transient mixtures form but are typically overtaken by a single phase, and most studies quite appropriately focus on nucleation-rate measurements in a metastable fluid or crystal (Ten Wolde et al. Reference Ten Wolde, Ruiz-Montero and Frenkel1996; Filion et al. Reference Filion, Hermes, Ni and Dijkstra2010, Reference Filion, Ni, Frenkel and Dijkstra2011b ; Fiorucci et al. Reference Fiorucci, Coli, Padding and Dijkstra2020; Wöhler & Schilling Reference Wöhler and Schilling2022; Wang et al. Reference Wang, Dhumal, Zakhari and Zia2026). Those nucleation studies have been essential for quantifying rates, interfacial free energies and finite-size effects, and we view them as a cornerstone of the hard-sphere literature rather than something to be challenged (Auer & Frenkel Reference Auer and Frenkel2001a ; Espinosa et al. Reference Espinosa, Sanz, Valeriani and Vega2013, Reference Espinosa, Vega and Sanz2014, Reference Espinosa, Vega, Valeriani and Sanz2016; Montero de Hijes et al. Reference Montero de Hijes, Espinosa, Bianco, Sanz and Vega2020a , Reference Montero de Hijes, Shi, Noya, Santiso, Gubbins, Sanz and Vegab ; Gispen & Dijkstra Reference Gispen and Dijkstra2024). Here we ask a complementary question. We emphasise that we do not question the existence or location of the hard-sphere coexistence window, nor do we claim to simulate a mathematically ideal MPRHS system. Instead, we treat the hard-sphere phase diagram as settled and pose a kinetic problem: How can one gently break metastability so that the coexistence state actually appears on accessible Brownian time scales, and how does Frenkel’s configurational–vibrational entropy exchange operate once such minimal perturbations are present?
To address this, we computationally studied $2\times 10^6$
nearly hard-sphere colloids undergoing Brownian dynamics with a short-ranged Morse interaction whose reduced second virial coefficient differs from the hard-sphere value by at most
$2\times 10^6$
nearly hard-sphere colloids undergoing Brownian dynamics with a short-ranged Morse interaction whose reduced second virial coefficient differs from the hard-sphere value by at most $ 1\,\%$
. We then introduced two controlled perturbations: (i) tiny, distributed crystalline seeds at 2 %–4 % initial volume fraction, and (ii) small, explicitly quantified changes in particle hardness, scanning
$ 1\,\%$
. We then introduced two controlled perturbations: (i) tiny, distributed crystalline seeds at 2 %–4 % initial volume fraction, and (ii) small, explicitly quantified changes in particle hardness, scanning $B_2^* = 0.985, 0.990, 0.993$
and
$B_2^* = 0.985, 0.990, 0.993$
and $0.995$
(in contrast to much softer WCA-like models with
$0.995$
(in contrast to much softer WCA-like models with $B_2^* \approx 0.73$
Filion et al. Reference Filion, Ni, Frenkel and Dijkstra2011b
; Tateno et al. Reference Tateno, Yanagishima, Russo and Tanaka2019; Fiorucci et al. Reference Fiorucci, Coli, Padding and Dijkstra2020; Gispen & Dijkstra Reference Gispen and Dijkstra2024). With weak seeding at
$B_2^* \approx 0.73$
Filion et al. Reference Filion, Ni, Frenkel and Dijkstra2011b
; Tateno et al. Reference Tateno, Yanagishima, Russo and Tanaka2019; Fiorucci et al. Reference Fiorucci, Coli, Padding and Dijkstra2020; Gispen & Dijkstra Reference Gispen and Dijkstra2024). With weak seeding at $B_2^* = 0.985$
, we obtained explicit fluid–crystal phase separation and freezing/melting points
$B_2^* = 0.985$
, we obtained explicit fluid–crystal phase separation and freezing/melting points $\phi _F \approx 0.497$
and
$\phi _F \approx 0.497$
and $\phi _M \approx 0.541$
, close to hard-sphere coexistence. As hardness was increased, the long-time crystal fraction and osmotic pressure moved systematically toward the hard-sphere fluid, crystal and coexistence lines, indicating that our nearly hard-sphere system asymptotically recovers standard hard-sphere liquid-state behaviour while retaining Brownian kinetics.
$\phi _M \approx 0.541$
, close to hard-sphere coexistence. As hardness was increased, the long-time crystal fraction and osmotic pressure moved systematically toward the hard-sphere fluid, crystal and coexistence lines, indicating that our nearly hard-sphere system asymptotically recovers standard hard-sphere liquid-state behaviour while retaining Brownian kinetics.
We then isolated the role of vibrational entropy by removing seeding and perturbing hardness alone. Samples prepared on the metastable-fluid line with $B_2^* = 0.995$
– only approximately
$B_2^* = 0.995$
– only approximately $0.5\,\%$
below the hard-sphere limit – exhibited equilibrium fluid–crystal phase separation in finite time, whereas softer cases remained trapped in the metastable fluid. In our simulations, this minimal, quantified softness increased locally accessible free volume just enough to destabilise the metastable branch and allow coexistence to emerge. In this sense, our simulations provide a direct numerical realisation of Frenkel’s entropy-exchange mechanism in an MPRHS-like system: a small gain in short-range vibrational entropy enables the long-range configurational entropy loss required for crystallisation, without materially altering the underlying hard-sphere thermodynamics.
$0.5\,\%$
below the hard-sphere limit – exhibited equilibrium fluid–crystal phase separation in finite time, whereas softer cases remained trapped in the metastable fluid. In our simulations, this minimal, quantified softness increased locally accessible free volume just enough to destabilise the metastable branch and allow coexistence to emerge. In this sense, our simulations provide a direct numerical realisation of Frenkel’s entropy-exchange mechanism in an MPRHS-like system: a small gain in short-range vibrational entropy enables the long-range configurational entropy loss required for crystallisation, without materially altering the underlying hard-sphere thermodynamics.
Finally, our results have practical implications. They clarify how slight deviations from perfect hardness and small distributed seeds jointly control the dynamic accessibility of fluid–crystal coexistence in colloidal suspensions, and they illustrate how nearly hard-sphere Brownian simulations can be used to test and refine empirical freezing criteria (e.g. Hansen–Verlet and Löwen criteria) when crystallisation is slow or difficult to observe directly. In future work, explicit lineage tracking of crystalline clusters – i.e. identifying and following clusters through time while accounting for Brownian-motion-driven merging, fragmentation and dissolution – could clarify whether the macroscopic crystalline domain primarily descends from the largest remnant seed or instead emerges via collective coarsening of many smaller remnants. More broadly, Brownian dynamics simulations provide a concrete framework for connecting the well-established hard-sphere phase diagram to the specific microscopic perturbations and kinetic pathways that make the underlying entropy-exchange mechanism observable in realistic colloidal systems.
Acknowledgements
The authors gratefully acknowledge very insightful feedback from anonymous reviewers. J.G.W. acknowledges helpful conversations with Dr G. Roure. The authors acknowledge the support of the National Science Foundation’s computational resources: Anvil at the Purdue University’s Rosen Center for Advanced Computing (RCAC) (Song et al. Reference Song2022) and Ranch Storage at Texas Advanced Computing Center (TACC) at U.T. Austin through allocation CHM240060 from the ACCESS program (Boerner et al. Reference Boerner, Deems, Furlani, Knuth and Towns2023), which is supported by U.S. National Science Foundation grants nos. 2138259, 2138286, 2138307, 2137603 and 2138296. Some of the computation for this work was also performed on the high performance computing infrastructure operated by Research Support Solutions (RSS) in the Division of IT at the University of Missouri, Columbia MO DOI:https://doi.org/10.32469/10355/97710. We acknowledge computational support of the RSS staff and resources of the University of Missouri’s Hellbender High Performance Computing cluster.
Funding
The authors acknowledge the support of the National Science Foundation’s computation resources: Anvil at the Purdue University’s Rosen Center for Advanced Computing (RCAC) (Song et al. Reference Song2022) and Ranch Storage at Texas Advanced Computing Center (TACC) at U.T. Austin through allocation CHM240060 from the ACCESS program (Boerner et al. Reference Boerner, Deems, Furlani, Knuth and Towns2023), which is supported by U.S. National Science Foundation grants nos. 2138259, 2138286, 2138307, 2137603, and 2138296.
Declaration of interests
The authors report no conflicts of interest.
Author contributions
J. Galen Wang – conceptualisation (co-lead); data generation (lead); data analysis and curation (co-lead); methodology (lead); writing, original draft (co-lead); writing: review and editing (co-lead); funding acquisition (contributor).
Umesh Dhumal – conceptualisation (contributor); data generation (co-lead); data analysis and curation (co-lead); methodology (contributor); writing, original draft (contributor); writing: review and editing (contributor); funding acquisition (contributor).
Monica E. A. Zakhari – conceptualisation (contributor); data generation (contributor); data analysis and curation (contributor); methodology (co-lead); writing, original draft (co-lead); writing: review and editing (contributor); funding acquisition (contributor).
Roseanna N. Zia – conceptualisation (co-lead); data generation (contributor); data analysis and curation (co-lead); methodology (contributor); investigation (lead); writing, original draft (co-lead); writing: review and editing (co-lead); funding acquisition (lead).
Data availability
Data are stored on the Ranch Storage at Texas Advanced Computing Center (TACC) at U.T. Austin and are available upon request.
Appendix A. A condensed history of the study of entropic phase transitions
1941: Kirkwood and Monroe. Theory explains and predicts melting transition in purely repulsive hard-sphere systems. Validated with experimental data with argon (Kirkwood & Monroe Reference Kirkwood and Monroe1941).
1949: Onsager. First described purely entropic phase transitions arising from configurational entropy due to shape anisotropy (Onsager Reference Onsager1949).
1957, 1959, 1960: Alder and Wainwright. First EDMD simulations of perfectly hard, purely repulsive monodisperse hard spheres, showing phase transition but not coexistence. Authors called for larger simulations to explicitly show coexistence (Alder et al. Reference Alder1957; Alder & Wainwright Reference Alder and Wainwright1959, Reference Alder and Wainwright1960).
1957: International discussion led by Uhlenbeck, in a letter edited by Percus in 1963 (Uhlenbeck Reference Uhlenbeck1963). This discussion and letter addressed the seeming paradox of freezing in MPRHS systems that would seem to lead to a higher-entropy crystal. Demonstrated the mechanism was understood as real but mechanistically unexplained (Uhlenbeck Reference Uhlenbeck1963).
Hard-sphere equations of state. The fluid line is calculated theoretically from virial expansion, the solid line is obtained from single-occupancy lattice MC simulation and the tie line is calculated with equal-pressure and equal-chemical-potential conditions. Figure from (Hoover & Ree Reference Hoover and Ree1968), with permission.

1968: Hoover and Ree. Combination of theory and experiments produced the MPRHS phase envelope. Lattice was used only for solid line. Virial equation (liquid-state theory) used to separately obtain the liquid line. Thermodynamics theory then used to connect them to deduce the coexistence line (Hoover & Ree Reference Hoover and Ree1968).
1986: Pusey and van Megen. Experimentally observed phase behaviour in putatively hard-sphere colloids. Seminal connection between colloidal and atomic phase behaviour (Pusey & van Megen Reference Pusey and van Megen1986).
1980s: Extensive work demonstrating purely entropic phase transitions due to shape anisotropy and size polydispersity in colloids (Eppenga & Frenkel Reference Eppenga and Frenkel1984; Kranendonk & Frenkel Reference Kranendonk and Frenkel1991; Bartlett et al. Reference Bartlett, Ottewill and Pusey1992; Eldridge et al. Reference Eldridge, Madden and Frenkel1993; Han & Herzfeld Reference Han and Herzfeld1994; Camp & Allen Reference Camp and Allen1997; Dijkstra et al. Reference Dijkstra, van Roij and Evans1998, Reference Dijkstra, van Roij and Evans1999; Bartlett & Warren Reference Bartlett and Warren1999; Fasolo & Sollich Reference Fasolo and Sollich2003; Zubarev & Iskakova Reference Zubarev and Iskakova2005; Cuetos & Dijkstra Reference Cuetos and Dijkstra2007; Zaccarelli et al. Reference Zaccarelli, Valeriani, Sanz, Poon, Cates and Pusey2009; Cinacchi & van Duijneveldt Reference Cinacchi and van Duijneveldt2010; Miller et al. Reference Miller, Bozorgui and Cacciuto2010; Wilding & Sollich Reference Wilding and Sollich2010; Agarwal & Escobedo Reference Agarwal and Escobedo2011; Filion et al. Reference Filion, Hermes, Ni, Vermolen, Kuijk, Christova, Stiefelhagen, Vissers, Van Blaaderen and Dijkstra2011a ; Haji-Akbari et al. Reference Haji-Akbari, Engel and Glotzer2011; Hopkins et al. Reference Hopkins, Jiao, Stillinger and Torquato2011; Jiao & Torquato Reference Jiao and Torquato2011; Kallus & Elser Reference Kallus and Elser2011; Avendano & Escobedo Reference Avendano and Escobedo2012; Marechal et al. Reference Marechal, Zimmermann and Löwen2012; Peroukidis & Vanakaras Reference Peroukidis and Vanakaras2013; Dijkstra Reference Dijkstra2014; Boles et al. Reference Boles, Engel and Talapin2016; Karas et al. Reference Karas, Dshemuchadse, van Anders and Glotzer2019; Koshoji et al. Reference Koshoji, Kawamura, Fukuda and Ozaki2021; Koshoji & Ozaki Reference Koshoji and Ozaki2021; Lim et al. Reference Lim, Lee and Glotzer2023).
1993: Frenkel. Proposed a mechanistic concept for phase transitions in MPRHS systems, the entropy-exchange mechanism. (Frenkel Reference Frenkel1993).
1996: Ten Wolde and Frenkel et al. Predicted that observing phase separation in large simulations of MPRHS would take 317,000,000 years due to the many configurations needed to be sampled for the microstates to converge to the phase-separated macrostate (Ten Wolde et al. Reference Ten Wolde, Ruiz-Montero and Frenkel1996).
2000: Frenkel. Recast Onsager’s phase transitions as a competition between translation versus orientational entropy (Frenkel & Onsager Reference Frenkel and Onsager2000).
2000s: Extensive simulations studies of nucleation, nucleation rates and interfacial properties between liquid and crystal phases (many and inclusive citations in our article Ladd & Woodcock Reference Ladd and Woodcock1977; Davidchack & Laird Reference Davidchack and Laird1998; Auer & Frenkel Reference Auer and Frenkel2001a , Reference Auer and Frenkel2004; Noya et al. Reference Noya, Vega and de Miguel2008; Filion et al. Reference Filion, Hermes, Ni and Dijkstra2010, Reference Filion, Ni, Frenkel and Dijkstra2011b ; Zykova-Timan et al. Reference Zykova-Timan, Horbach and Binder2010; Hermes et al. Reference Hermes, Vermolen, Leunissen, Vossen, Van Oostrum, Dijkstra and Van Blaaderen2011; Espinosa et al. Reference Espinosa, Sanz, Valeriani and Vega2013; Isobe & Krauth Reference Isobe and Krauth2015; Espinosa et al. Reference Espinosa, Vega, Valeriani and Sanz2016; Tateno et al. Reference Tateno, Yanagishima, Russo and Tanaka2019; Fiorucci et al. Reference Fiorucci, Coli, Padding and Dijkstra2020; Montero de Hijes et al. Reference Montero de Hijes, Espinosa, Bianco, Sanz and Vega2020a , Reference Montero de Hijes, Shi, Noya, Santiso, Gubbins, Sanz and Vegab ; Sanchez-Burgos et al. Reference Sanchez-Burgos, Sanz, Vega and Espinosa2021; Wöhler & Schilling Reference Wöhler and Schilling2022; Gispen & Dijkstra Reference Gispen and Dijkstra2024). Established understanding of why nucleation is much slower in simulations than experiments. Demonstration that seeding, gravity, direct construction of a crystal slab (‘direct coexistence’) and other triggers are needed to induce phase separation, otherwise either the liquid or the solid takes over the entire system. Use of algorithmic drivers in MC simulations to establish phase diagrams.
2019: Pieprzyk et al. Simulated a pristine MPRHS system with 1000 000 particles using EDMD (no suspending fluid) to recover phase transition. Produced a sharpened phase envelope. Produced a pure metastable liquid and a pure metastable crystal but not explicit phase separation. Reinforced the metastability of MPRHS (Pieprzyk et al. Reference Pieprzyk, Bannerman, Brańka, Chudak and Heyes2019).
Appendix B. Particle hardness in simulations
To model hard-sphere interactions, we use purely repulsive Morse potentials with a small range parameter $\kappa a=30$
(see (2.1)) and plot the potential energy in figure 1. The WCA potential is another potential that is widely used in previous studies, with the following form:
$\kappa a=30$
(see (2.1)) and plot the potential energy in figure 1. The WCA potential is another potential that is widely used in previous studies, with the following form:
 \begin{equation} V(r) = \left \{ \begin{aligned} & 4 V_0 \left [\left (\frac {\sigma }{r}\right )^{12}-\left (\frac {\sigma }{r}\right )^{6}+\frac {1}{4}\right ], & \frac {r}{\sigma } \lt 2^{1/6}, \\ & 0, &\textrm {otherwise}. \end{aligned} \right . \end{equation}
The $V_0=6kT$
Morse potential is quite hard, comparing with a
$V_0=6kT$
Morse potential is quite hard, comparing with a $V_0=40kT$
WCA potential. We also make our particles much harder by increasing
$V_0=40kT$
WCA potential. We also make our particles much harder by increasing $V_0$
of Morse potential in (2.1) and obtain a good model to represent hard spheres.
$V_0$
of Morse potential in (2.1) and obtain a good model to represent hard spheres.
Statistics of the initial crystalline seed clusters. Left axis: binned counts of sub- and super-critical clusters, with the critical nucleus-size range taken from Auer & Frenkel (Reference Auer and Frenkel2004). Right axis: size of the single largest cluster present at each volume fraction (solid black circles).

Appendix C. Distribution of initial crystalline cluster size
We characterised the initial crystalline seeds at $t=0$
by computing a cluster-size distribution over crystalline particles. Crystalline particles were identified using the same crystallinity order parameter and threshold used throughout the manuscript. We then defined clusters using a contact-based connectivity criterion intended to capture coordination/contact-number connectivity: two crystalline particles
$t=0$
by computing a cluster-size distribution over crystalline particles. Crystalline particles were identified using the same crystallinity order parameter and threshold used throughout the manuscript. We then defined clusters using a contact-based connectivity criterion intended to capture coordination/contact-number connectivity: two crystalline particles $i$
and
$i$
and $j$
were assigned to the same cluster if their surface-to-surface separation satisfied
$j$
were assigned to the same cluster if their surface-to-surface separation satisfied
 \begin{equation} s_{\textit{ij}} \equiv r_{\textit{ij}} - 2a \le 0.04\,a, \end{equation}
equivalently $r_{\textit{ij}} \le 2.04\,a$
, where
$r_{\textit{ij}} \le 2.04\,a$
, where $r_{\textit{ij}}$
is the centre-to-centre distance and
$r_{\textit{ij}}$
is the centre-to-centre distance and $a$
is the particle radius. Clusters were taken as the connected components of the resulting adjacency graph. We define the cluster size
$a$
is the particle radius. Clusters were taken as the connected components of the resulting adjacency graph. We define the cluster size $N_c$
as the number of crystalline particles in a connected component, and we report the binned distribution of
$N_c$
as the number of crystalline particles in a connected component, and we report the binned distribution of $N_c$
for each
$N_c$
for each $\phi$
.
$\phi$
.
Per-particle $\bar {q}_6$
vs
$\bar {q}_6$
vs $\bar {q}_4$
plot for PRHS systems of
$\bar {q}_4$
plot for PRHS systems of $V_0=6kT$
particles at 12 volume fractions, as labelled in each plot. For all particles that are part of a crystalline structure (
$V_0=6kT$
particles at 12 volume fractions, as labelled in each plot. For all particles that are part of a crystalline structure ( $\bar {q}_6 \ge 0.29$
), the value of
$\bar {q}_6 \ge 0.29$
), the value of $\bar {q}_4$
determines the type of crystal structure (Lechner & Dellago Reference Lechner and Dellago2008; Kratzer & Arnold Reference Kratzer and Arnold2015): BCC (
$\bar {q}_4$
determines the type of crystal structure (Lechner & Dellago Reference Lechner and Dellago2008; Kratzer & Arnold Reference Kratzer and Arnold2015): BCC ( $0 \le \bar {q}_4 \le 0.05$
), HCP (
$0 \le \bar {q}_4 \le 0.05$
), HCP ( $0.05\lt \bar {q}_4 \le 0.10$
) and FCC (
$0.05\lt \bar {q}_4 \le 0.10$
) and FCC ( $\bar {q}_4\gt 0.10$
). A dotted line marks the boundary between fluid-like structure and crystalline structure. The BCC, HCP and FCC regions are marked and highlighted.
$\bar {q}_4\gt 0.10$
). A dotted line marks the boundary between fluid-like structure and crystalline structure. The BCC, HCP and FCC regions are marked and highlighted.

Probability P( $\bar {q}_4$
) vs
$\bar {q}_4$
) vs $\bar {q}_4$
plot for systems of
$\bar {q}_4$
plot for systems of $V_0=6kT$
particles at 12 volume fractions at 2000
$V_0=6kT$
particles at 12 volume fractions at 2000 $a^{2}/D$
, as labelled in each plot. For all particles that are crystalline (
$a^{2}/D$
, as labelled in each plot. For all particles that are crystalline ( $\bar {q}_6 \ge 0.29$
). The BCC, HCP and FCC regions are marked and highlighted the same way as figure 4.
$\bar {q}_6 \ge 0.29$
). The BCC, HCP and FCC regions are marked and highlighted the same way as figure 4.

Appendix D. Distribution of detailed crystalline structures
We quantify the detailed crystalline structure via the combined measurements of $\bar {q}_6$
and
$\bar {q}_6$
and $\bar {q}_4$
(figure 14). For crystalline structure (
$\bar {q}_4$
(figure 14). For crystalline structure ( $\bar {q}_6 \ge 0.29$
), values of
$\bar {q}_6 \ge 0.29$
), values of $0\lt \bar {q}_4 \le 0.05$
signify BCC structure,
$0\lt \bar {q}_4 \le 0.05$
signify BCC structure, $0.05 \lt \bar {q}_4 \le 0.1$
signifies HCP structure and
$0.05 \lt \bar {q}_4 \le 0.1$
signifies HCP structure and $\bar {q}_4\gt 0.1$
signifies FCC structure. As labelled in the figure,
$\bar {q}_4\gt 0.1$
signifies FCC structure. As labelled in the figure, $\bar {q}_4$
measurements reveal the structure of the coexisting crystalline state: nearly all crystalline regions are FCC. We also quantify the statistics of crystalline structures via the histogram of
$\bar {q}_4$
measurements reveal the structure of the coexisting crystalline state: nearly all crystalline regions are FCC. We also quantify the statistics of crystalline structures via the histogram of $\bar {q}_4$
for all crystalline particles that have
$\bar {q}_4$
for all crystalline particles that have $\bar {q}_6 \ge 0.29$
(figure 15). There is only one peak of
$\bar {q}_6 \ge 0.29$
(figure 15). There is only one peak of $P(\bar {q}_4)$
centred around
$P(\bar {q}_4)$
centred around $\bar {q}_4 \approx 0.2$
, and it is clear that almost all crystalline colloids has
$\bar {q}_4 \approx 0.2$
, and it is clear that almost all crystalline colloids has $\bar {q}_4 \gt 0.1$
. In fact, less than 0.1 % of structure is BCC or HCP. This distribution of crystalline structure is consistent with previous literature results, which indicate that FCC structure is slightly more stable than HCP structure (Frenkel & Ladd Reference Frenkel and Ladd1984; Woodcock Reference Woodcock1997).
$\bar {q}_4 \gt 0.1$
. In fact, less than 0.1 % of structure is BCC or HCP. This distribution of crystalline structure is consistent with previous literature results, which indicate that FCC structure is slightly more stable than HCP structure (Frenkel & Ladd Reference Frenkel and Ladd1984; Woodcock Reference Woodcock1997).
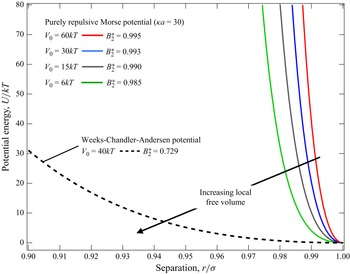

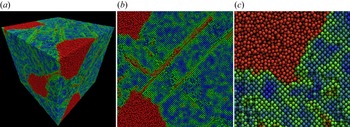


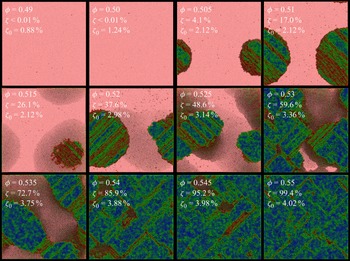


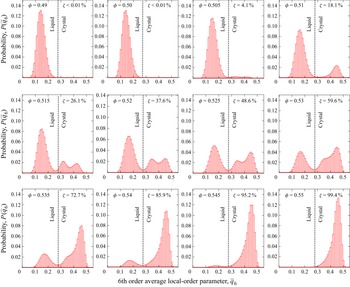


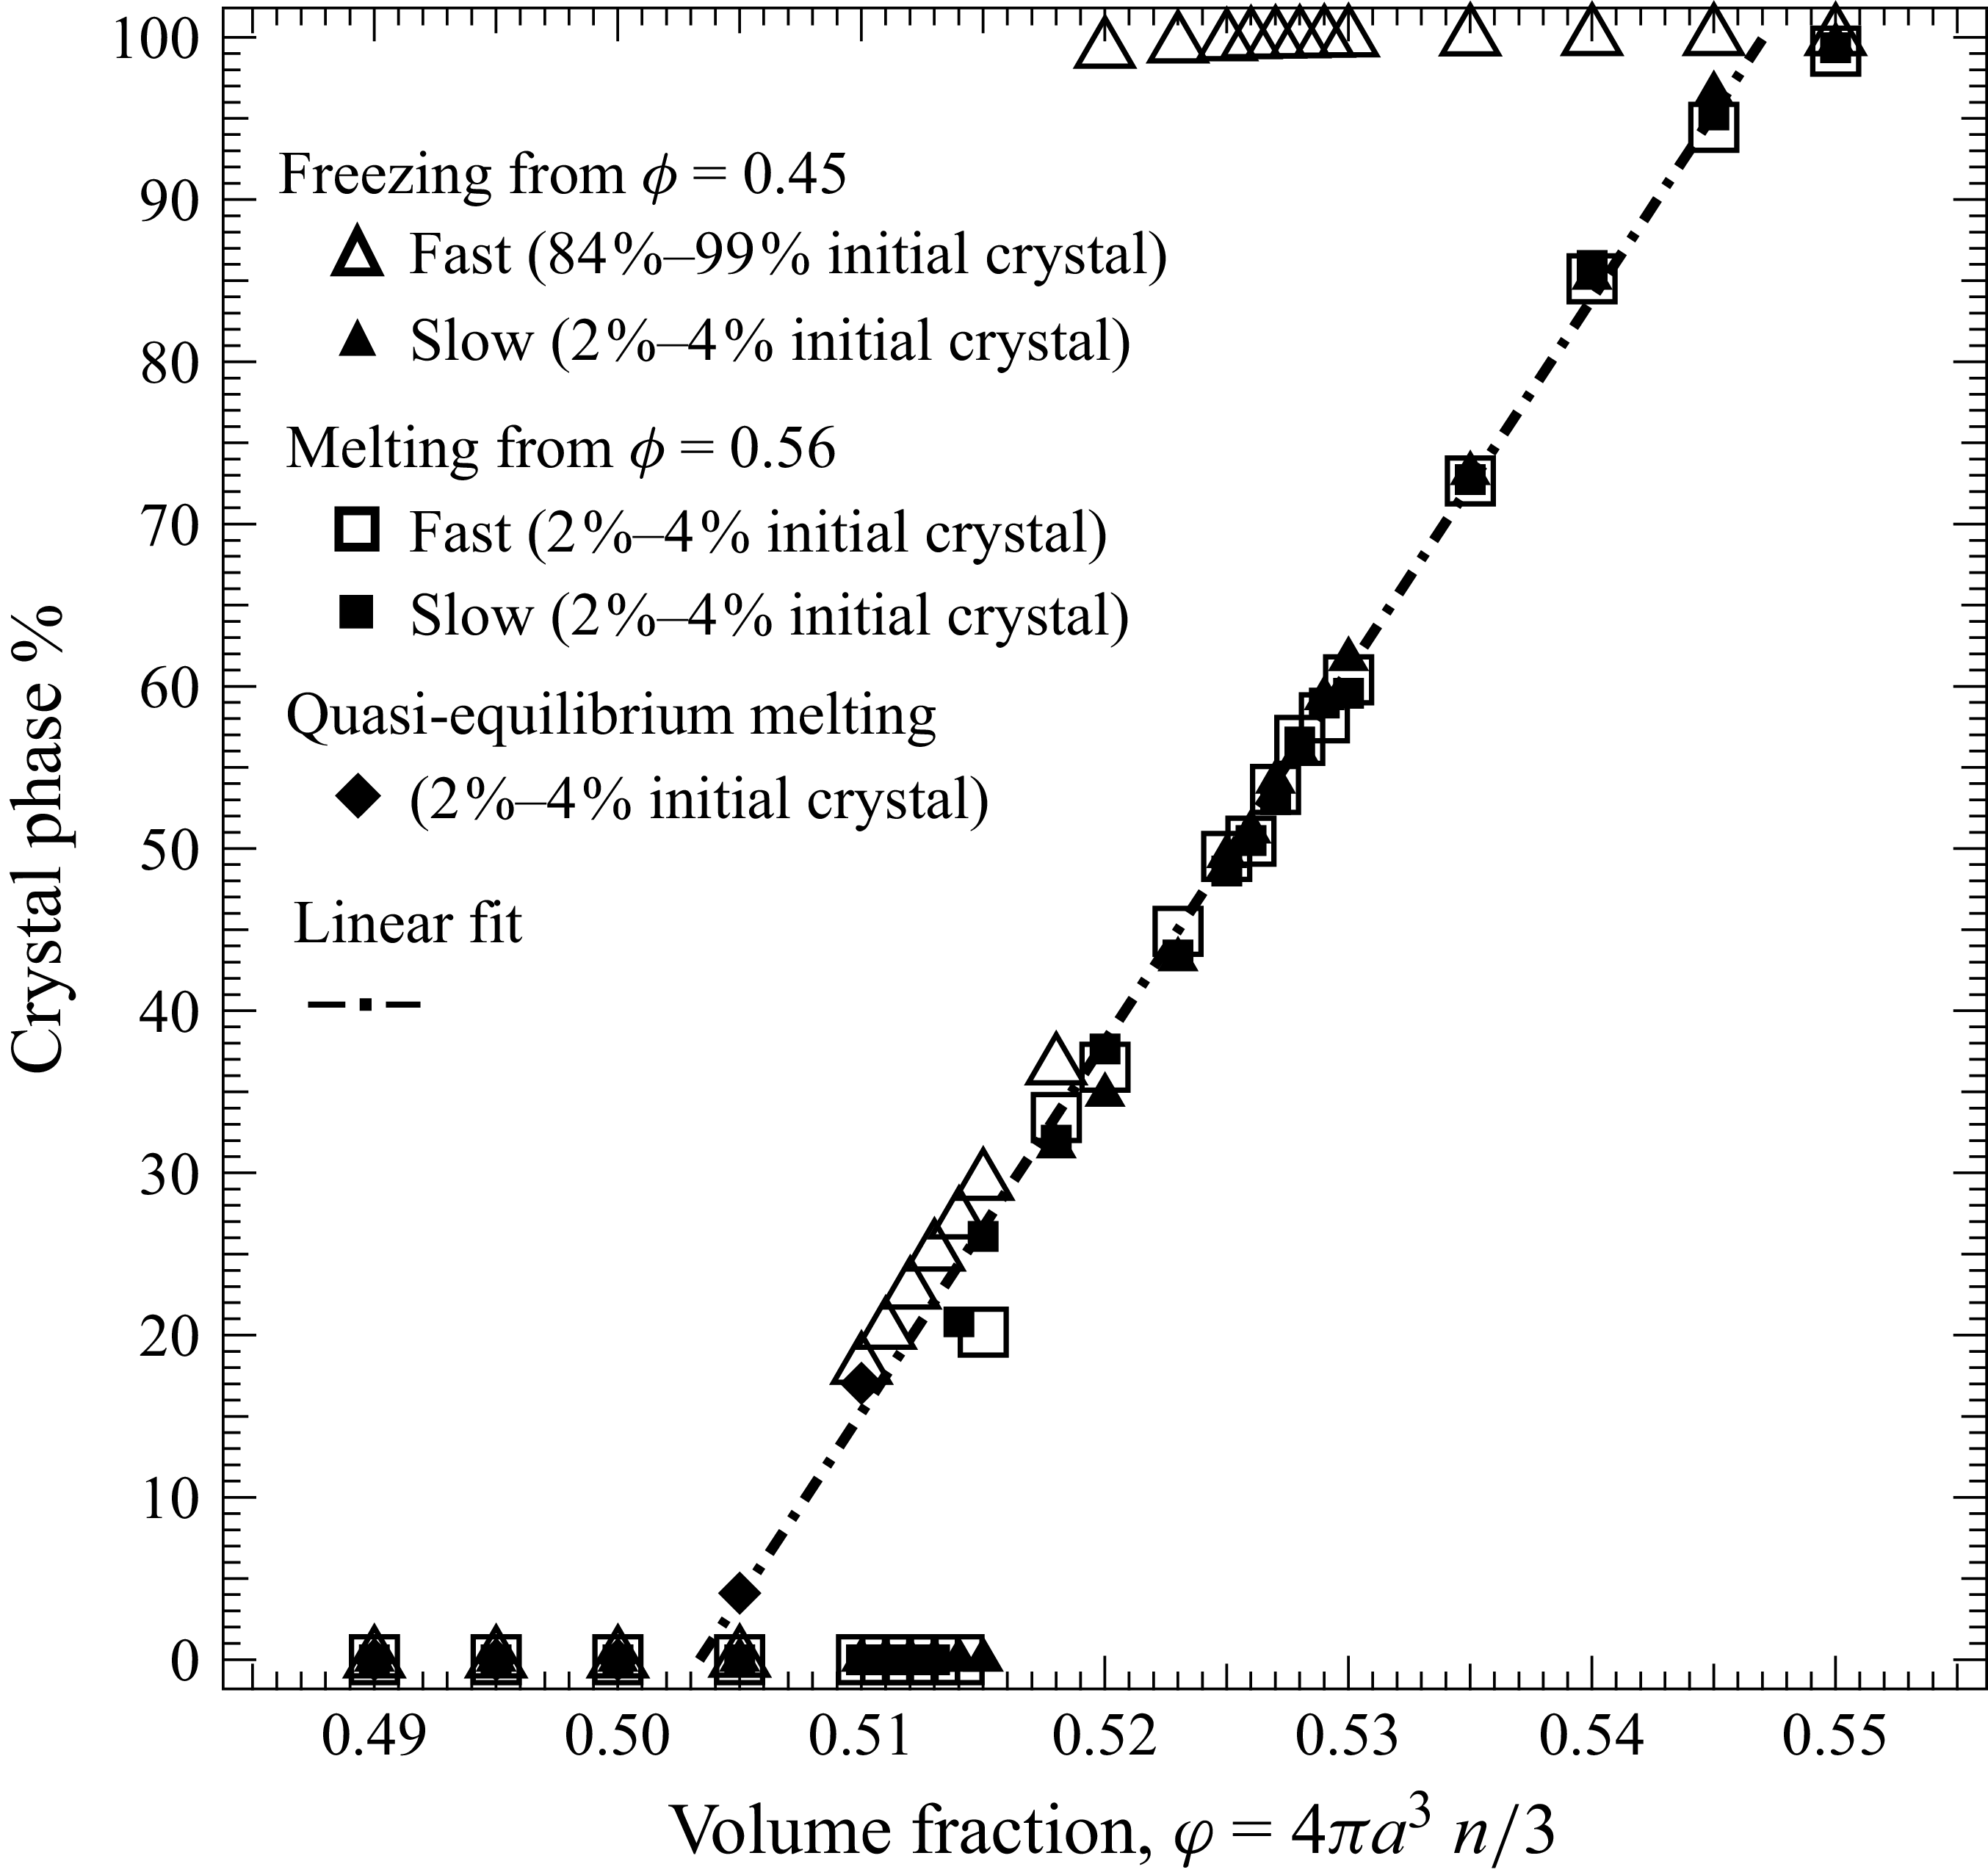


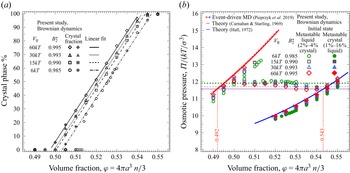


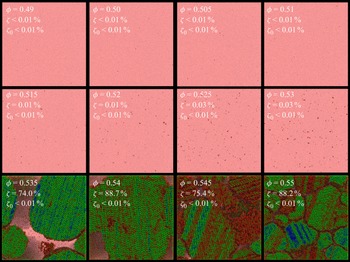


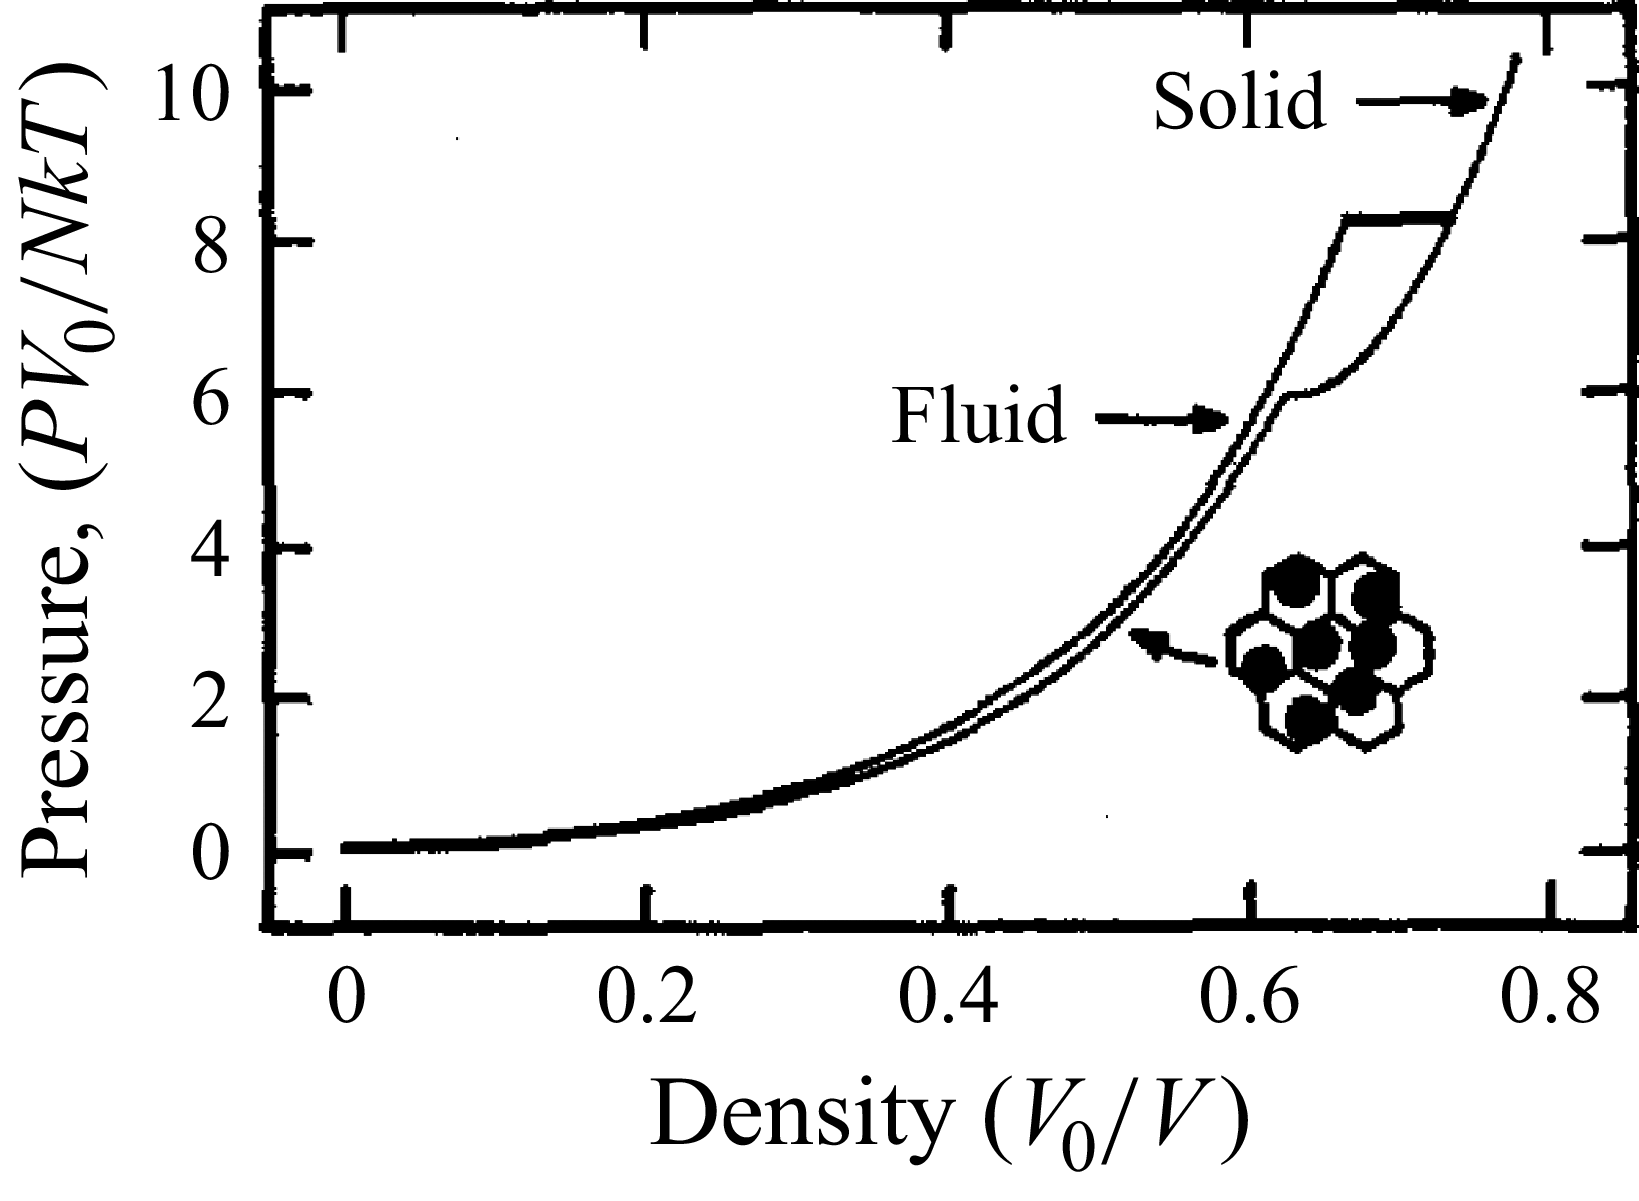
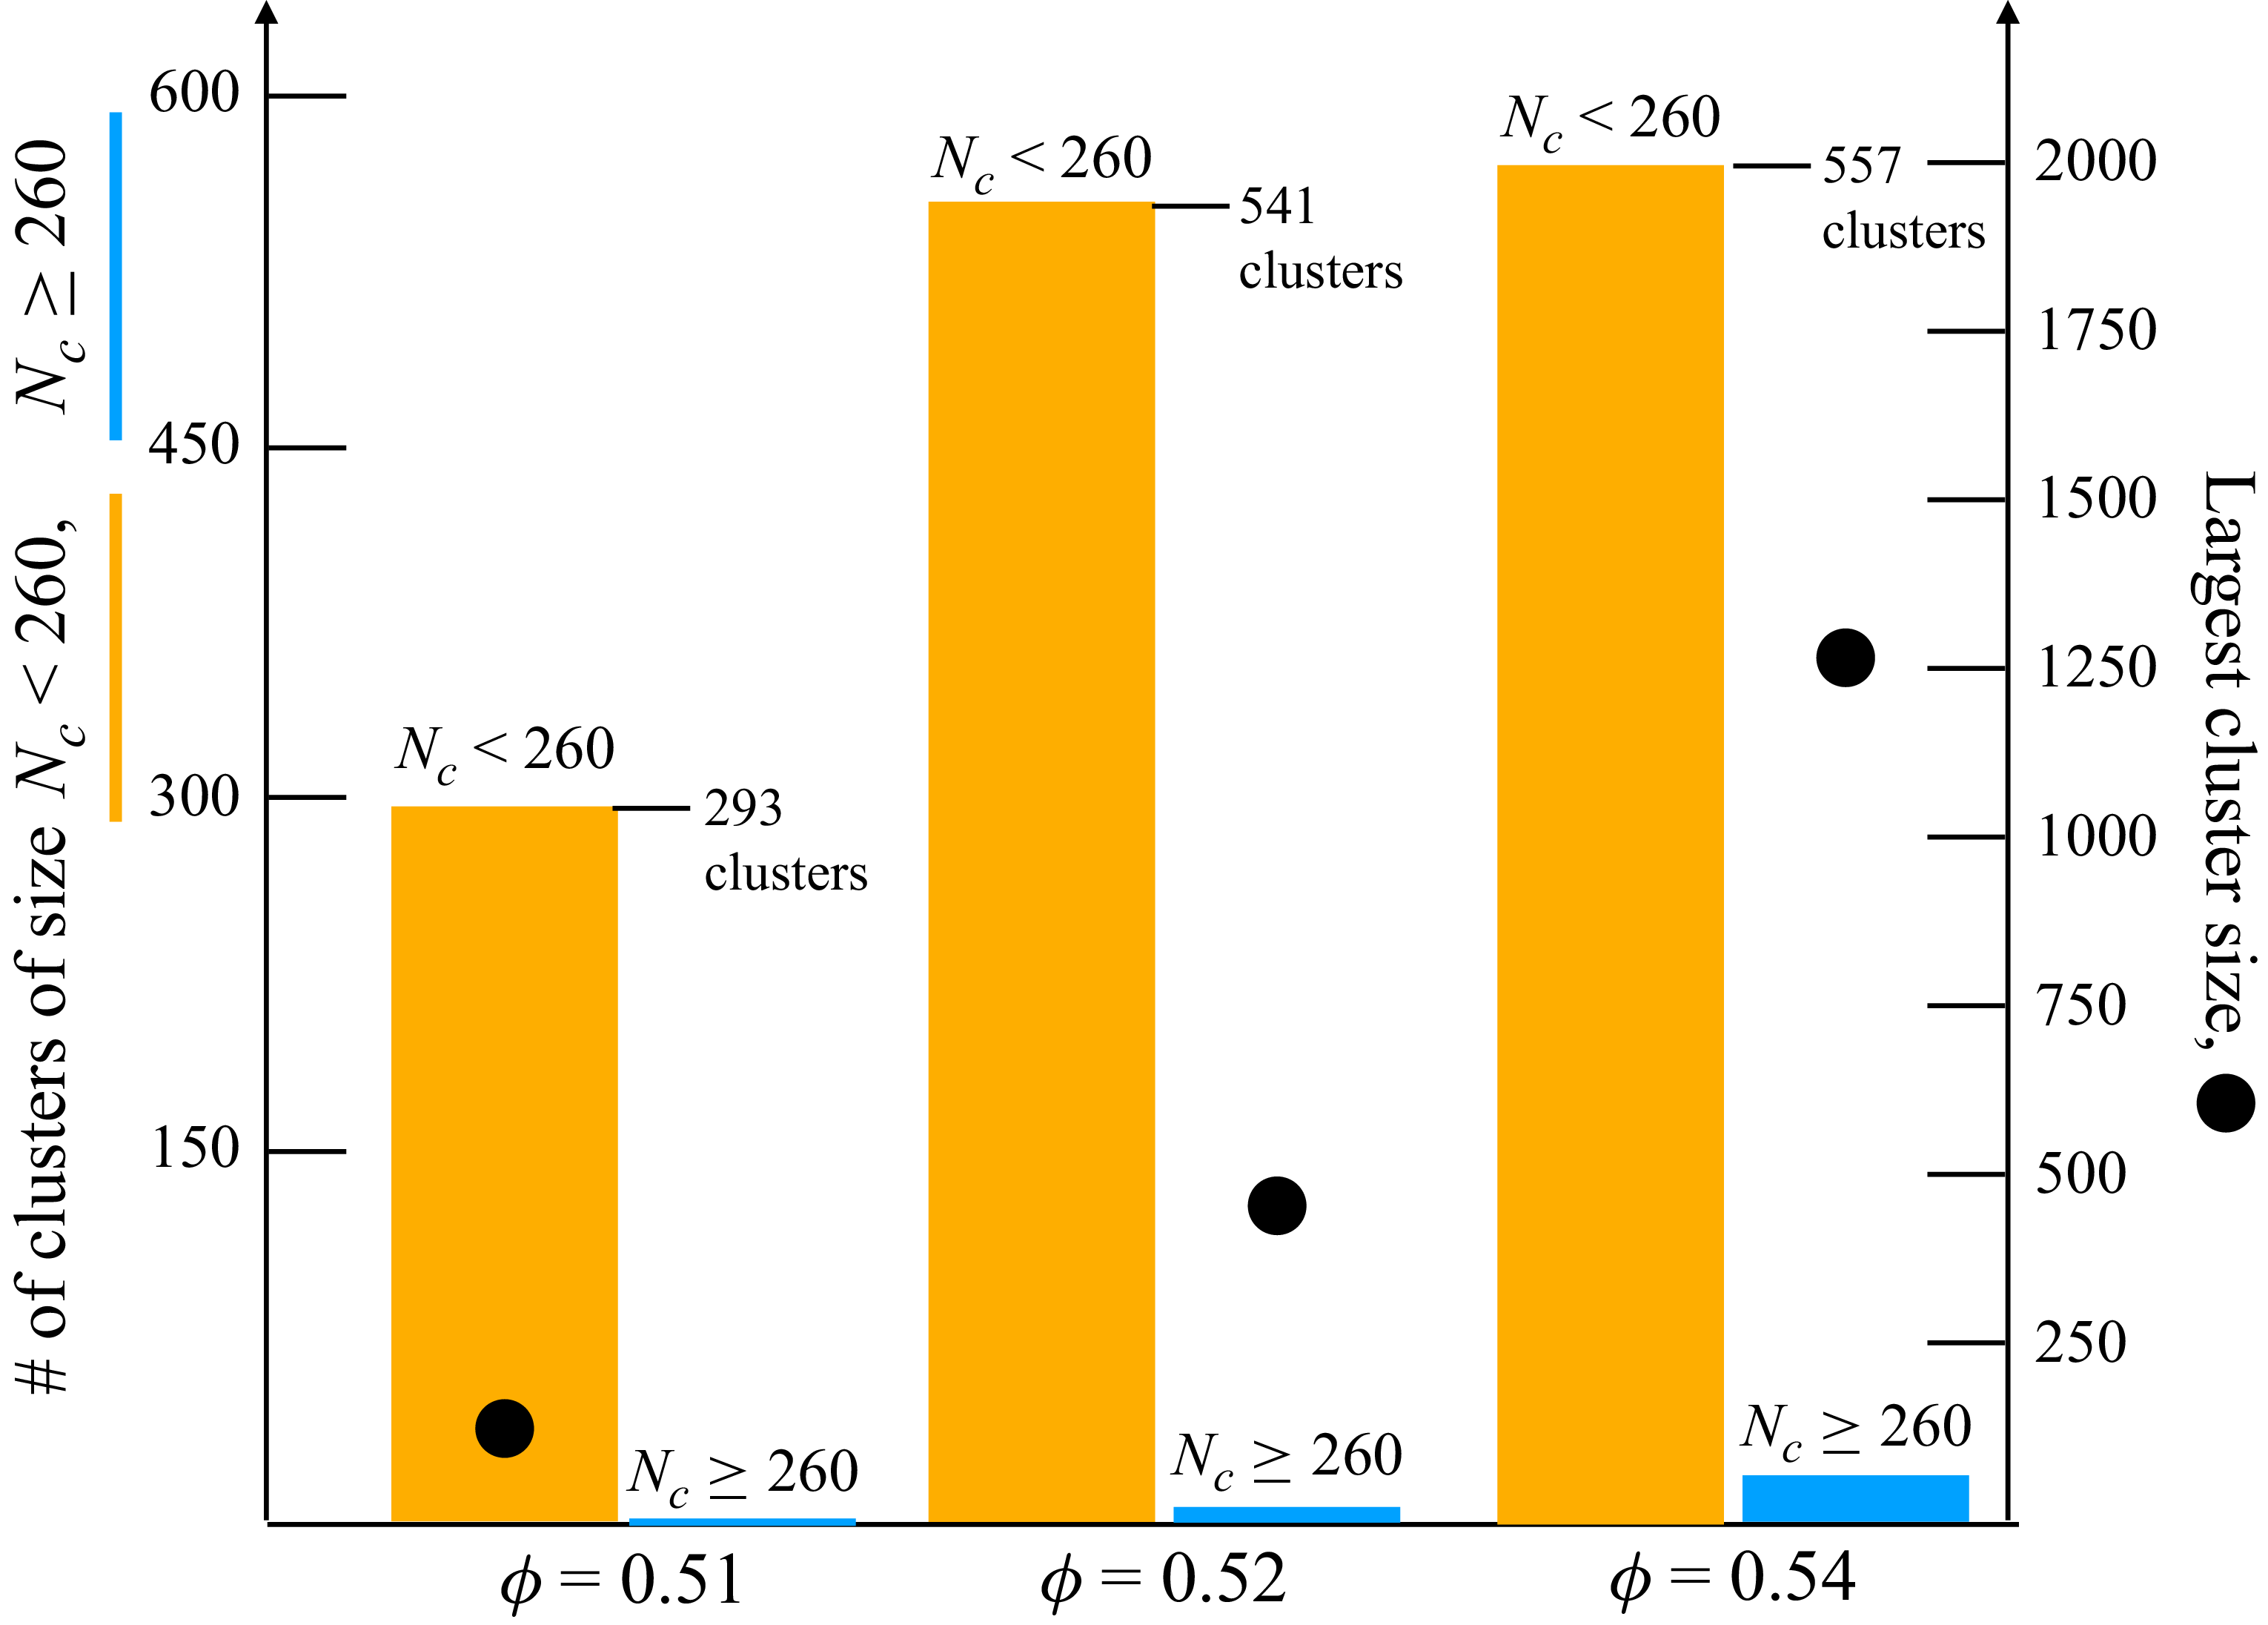


 Open access

